")
Back to Journals » Infection and Drug Resistance » Volume 15
Proteomics Combined with RNA Sequencing to Screen Biomarkers of Sepsis
Authors Wang C , Li Y, Li S, Chen M, Hu Y
Received 26 June 2022
Accepted for publication 10 September 2022
Published 21 September 2022 Volume 2022:15 Pages 5575—5587
DOI https://doi.org/10.2147/IDR.S380137
Checked for plagiarism Yes
Review by Single anonymous peer review
Peer reviewer comments 3
Editor who approved publication: Prof. Dr. Héctor Mora-Montes
Chenglin Wang, Yang Li, Shilin Li, Muhu Chen, Yingchun Hu
Department of Emergency Medicine, The Affiliated Hospital of Southwest Medical University, Luzhou, People’s Republic of China
Correspondence: Yingchun Hu, Department of Emergency Medicine, The Affiliated Hospital of Southwest Medical University, No. 25, Taiping Road, Luzhou, Sichuan, People’s Republic of China, Tel +86-15228232720, Fax +86-0830-3165120, Email [email protected]
Purpose: To screen biomarkers in the serum of patients with sepsis by proteomics combined with RNA sequencing technology, and to find new diagnostic and therapeutic targets for sepsis.
Patients and Methods: Blood samples of 22 sepsis patients (sepsis group) and 10 healthy volunteers (normal group) were collected from January 2019 to December 2020. Data-independent acquisition (DIA) method was employed for protein profiling, RNA sequencing was employed for gene sequencing. Subsequently, quality control and differential analysis (FC≥ 2; FDR< 0.05) of DIA data and RNA sequencing data were performed. Then we identified expression trend-consistent divergence factors by nine-quadrant analysis; subsequent protein-protein interaction (PPI) and gene ontology (GO) functional enrichment analysis of intersection factors was performed, and meta-analysis of targets at transcriptome level was implemented using public datasets. Finally, five Peripheral blood mononuclear cell (PBMC) samples (NC=2; SIRS=1; SEPSIS =2) were collected, and cell localization analysis of core genes was performed by 10× single-cell RNA sequencing (scRNA-seq).
Results: Compared with the normal group, there were 4681 differentially expressed genes and 202 differentially expressed proteins in the sepsis group. Among them, 25 factors were expressed in both proteome and transcriptome, and the analysis of PPI and GO found that they were mainly involved in biological processes such as white blood cell and neutrophil response, inflammatory and immune response. Four core genes GSTO1, C1QA, RETN, and GRN were screened by meta-analysis, all of which were highly expressed in the sepsis group compared with the normal group (P< 0.05); scRNA-seq showed the core genes were mainly localized in macrophage cell lines.
Conclusion: The core genes GSTO1, C1QA, RETN and GRN are mainly expressed in macrophages, widely involved in inflammation and immune responses, and are highly expressed in plasma in the sepsis, suggesting that they may become potential research targets for sepsis.
Keywords: sepsis, proteomics, RNA sequencing, single-cell RNA sequencing, biomarker
Introduction
Sepsis is a life-threatening and time-critical medical emergency, whose core treatment relies on source control, early use of antibiotics, and organ function support. Rapid initiation of sepsis protocols can be effective in reducing adverse outcomes, but it relies on clinicians’ cognition of sepsis,1 which requires the availability of diagnostic biomarkers at different points of sepsis. However, the current diagnosis of sepsis is not sufficiently rapid, sensitive and specific.2 In recent years, sepsis research has made great strides, abnormal immune responses triggered by pathogens (from excessive inflammation to immunosuppression) are considered to be an important cause of high mortality.3 The innate and adaptive immune system plays a key role in the host response to sepsis,4 and emerging therapeutic strategies are currently focused on immunomodulatory, artificial intelligence and personalized therapeutic multi-omics approaches.5
RNA sequencing is a common method for analyzing gene expression and discovering new RNAs,6 and is now one of the most advanced techniques for transcriptome analysis.7 However, traditional RNA sequencing samples are obtained from a mixture of cells, and sequencing allows the detection of differentially expressed genes between two or more cell populations, but fails to discover the genes responsible for intercellular differences.8 scRNA-seq technology has dramatically changed transcriptomic studies by resolving gene expression in a single cell,9 allowing further clarification of gene localization and expression in specific cells. The resolution of proteins is significant as they are the ultimate functional performers of an organism and their levels are constantly changing in response to processes such as growth, environmental stress, and disease. DIA is an emerging technology for large-scale proteomics studies, characterized by broad protein coverage, high reproducibility and accuracy.10,11 Proteomics combined with transcriptomic analysis can explore the expression levels of proteins and mRNAs, take full advantage of the differences and complementarities between the two histological studies to measure the full range of gene expression, uncover new results that conventional individual histology fails to discover, and comprehensively explore the mechanisms of disease, growth and development of organisms.
In this study, we intend to identify new diagnostic and therapeutic targets for sepsis by combining DIA protein profiling with multidimensional sequencing technologies to clarify the expression levels of core targets and cell lineage localization, and lay the foundation for subsequent in vivo functional studies. See Figure 1 for the specific process.
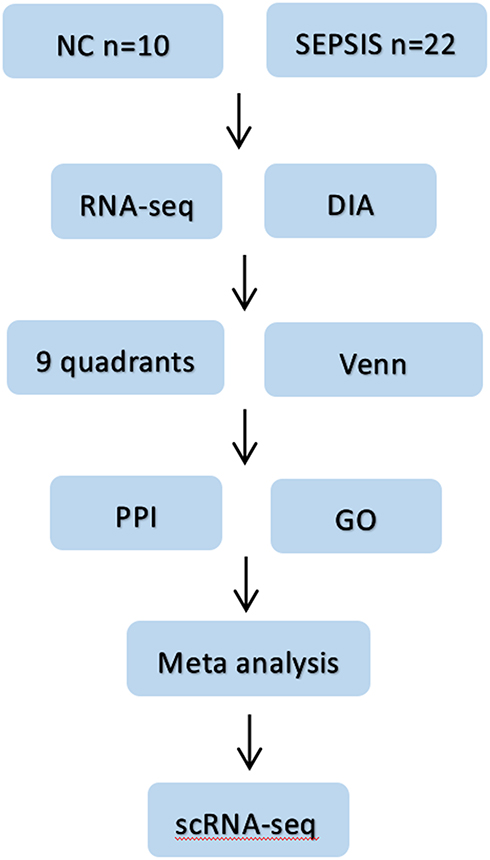 |
Figure 1 Flow chart of the study. Firstly, blood samples from sepsis patients and normal subjects were collected, then differential proteins and differential genes were screened by DIA protein profile and RNA sequencing combined with bioinformatics methods; then proteomics and genomics data were jointly analyzed; later, intersecting targets were taken for PPI and GO analysis, and four potential core genes were finally clarified by meta-analysis. Finally, scRNA-seq was used to clarify the cell lines localization of the target genes. |
Materials and Methods
Subjects Recruitment and Blood Collection
Peripheral blood samples were collected from sepsis patients (n=22) and healthy volunteers (n=10) who were admitted to the EICU of The Affiliated Hospital of Southwest Medical University from January 2019 to December 2020. Inclusion criteria were (1) sepsis patients admitted to the EICU; (2) meeting the Sepsis 3.0 criteria (infection + SOFA score ≥ 2) jointly published by American Society of Critical Care Medicine (SCCM) and European Society of Intensive Care Medicine (ESICM) in 2016; (3) patient age ≥ 18 years and ≤ 80 years; (4) patients or their legal representatives willing to enter the experiment and sign informed consent form. Exclusion criteria: (1) previous organ failure; (2) previous immune system disorders; (3) previous hematologic disorders; (4) patients who were unwilling to enter the trial. This experiment passed the Ethics Committee of Affiliated Hospital of Southwest Medical University (ethics number: ky2018029), and the clinical trial registration number: ChiCTR1900021261. This study complies with the Declaration of Helsinki.
RNA Sequencing
mRNA sequencing was performed with the assistance of BGI (Shenzhen, China). Total RNA was extracted from peripheral blood cells by TRizol (Invitrogen, Carlsbad, CA, USA). Subsequently, first strand cDNA was synthesized from 800–1000 ng total RNA by Clontech SMARTer PCR cDNA Synthesis Kit. The CDS Primer IIA was first annealed to the polyA+ tail of transcripts, followed by first-strand synthesis with SMARTScribe™ Reverse Transcriptase. Then, a sufficient amount of double-stranded cDNA was produced by large-scale PCR with Clontech PrimeSTAR GXL DNA Polymerase and 5ʹPCR Primer IIA (5’- AAGCAGTGGTATCAACGCAGAGTAC-3’). Finally, the cDNA library was established. Libraries were qualified and quantified by Agilent 2100 Bioanalyzer (Thermo Fisher Scientific, MA, USA) and real-time quantitative PCR (qPCR) (TaqMan Probe). mRNA quality control had to meet 28S/18S > 1. Qualified libraries were sequenced on DNBSEQ platform (BGI-Shenzhen, China). We used the website iDEP9512 (http://bioinformatics.sdstate.edu/idep/) to logarithmicize and differentially analyze the data, screening differentially expressed genes between the normal and sepsis groups using |FC| (fold change) ≥2.0 and FDR (false discovery rate) < 0.05 as criteria. And box plots were used to determine whether homogeny in the samples, outlier samples were excluded using principal component analysis (PCA) for both data sets. The RNA sequencing dataset analysed during the current study is available in the China National GeneBank DataBase (CNGBdb) and can be found below: https://db.cngb.org/, under the accession: CNP0002611.
DIA Protein Profiling
22 samples from the sepsis group and 10 samples from normal group were analyzed by DIA proteomics techniques. We used the Q-Exactive HF (Thermo Fisher Scientific, San Jose, CA) liquid-mass spectrometer to achieve accurate and highly repeatable quantitative mass spectrometry data on a large number of proteins. Subsequently, based on the spectral library constructed in the traditional data dependent acquisition (DDA) mode, the Ratio values and P values of protein expression changes in 32 samples were identified and quantified using the mProphet algorithm. Differentially expressed proteins were screened using the OmicShare online platform (https://www.omicshare.com/) with the screening criteria: p<0.05 and |FC|≥2.0.
Combined Proteomic and Transcriptomic Analyses
Proteomic co-transcriptomic analysis is often used to explore the expression regulation patterns and mechanisms of organisms, to mine the expression levels of mRNA and protein. Transcriptomic and proteomic data are submitted to OmicShare platform to construct a nine-quadrant map, and the intersection targets of differential genes and differential proteins are obtained by Venny2.1 (https://bioinfogp.cnb.csic.es/tools/venny/index.html).
PPI Analysis
Protein-protein interaction analysis is a widely used core factor screening strategy based on a linkage network constructed on the strength of interaction between two proteins found in previous studies. Theoretically, the closer a protein is to the intermediate region and the more it is linked to the outside, the more likely it is to be a core target. To further screen potential immune-related genes, the STRING database (https://cn.string-db.org/) was used to construct protein-protein interaction network map for the intersecting targets to further screen the core genes. This study was set to a linkage strength of at least 0.15 between the two factors,13 and the points in the network that were not linked were removed and subsequently labeled with the functions of interest in this study.
GO Functional Enrichment Analysis
GO functional enrichment analysis is a typical approach for big data analysis of genes, which includes three components: biological process (BP), cellular component (CC) and molecular function (MF). To globally view the functional enrichment of the intersecting genes, we performed GO analysis by ShinyGO14 (http://bioinformatics.sdstate.edu/go/) to enrich the top 20 gene sets of BP, CC, and MF separately and plot the interactions, and p<0.05 was defined as statistically significant.
Meta-Analysis
To further investigate the differential expression of intersecting genes at the transcript levels of different groups, we downloaded five sepsis samples of human peripheral blood (GSE28750,15 GSE54514,16 GSE67652,17 GSE69528,18 GSE9523319) from the public database GEO (https://www.ncbi.nlm.nih.gov/geo/). The above datasets were homogenized (log2 logarithmic) and divided into sepsis group (Sepsis) and normal group (NC), and comprehensive meta-analysis based on R package: MultiMeta20 was performed on single genes of the same grouping in different datasets to verify the reliability of target gene expression trends in this study.
Single-Cell RNA Sequencing
Peripheral blood cells are a mixture of multiple cell lines, scRNA-seq analysis helps investigators to localize target genes to cells within tissues. In this study, 10× scRNA-seq was used to probe the cell lineage localization of individual target genes. The specific method was performed according to the company’s operating manual. Five (NC=2; SIRS=1; SEPSIS=2) blood samples were collected and mixed. The raw data generated in high-throughput sequencing were fastq format, and the raw data were quality counted using the 10× genomics official software CellRanger (https://support.10xgenomics.com/single-cell-gene-expression/software/pipelines/latest/what-is-cell-ranger), the data were further quality controlled using the Seurat software package. PCA linear dimensionality reduction analysis was performed based on gene expression, and the PCA results were visualized in two dimensions by tSNE. Marker genes identification was performed by the FindAllMarkers function, and the specific genes identified were visualized by the VlnPlot and FeaturePlot functions. Correlation of the expression profiles of the cells to be identified with the reference dataset was calculated by the SingleR package,21 and the cell type with the highest correlation in the reference dataset was assigned to the cells to be identified to construct a sepsis-related single-cell library. The core targets screened in the above study are submitted to the single cell library to specify the cell lineage localization of the target genes.
Results
Clinical Information
22 patients with sepsis and 10 normal controls included in the study were statistically analyzed for gender, age, SOFA score, GCS score, total white blood cell count, neutrophil count, monocyte count, platelet count, urea, and hemoglobin levels, expressed as mean ± standard deviation. The clinical data information is shown in Table 1. The results showed that in the sepsis group, patients had significantly higher inflammatory indicators and indicators of organ functional impairment.
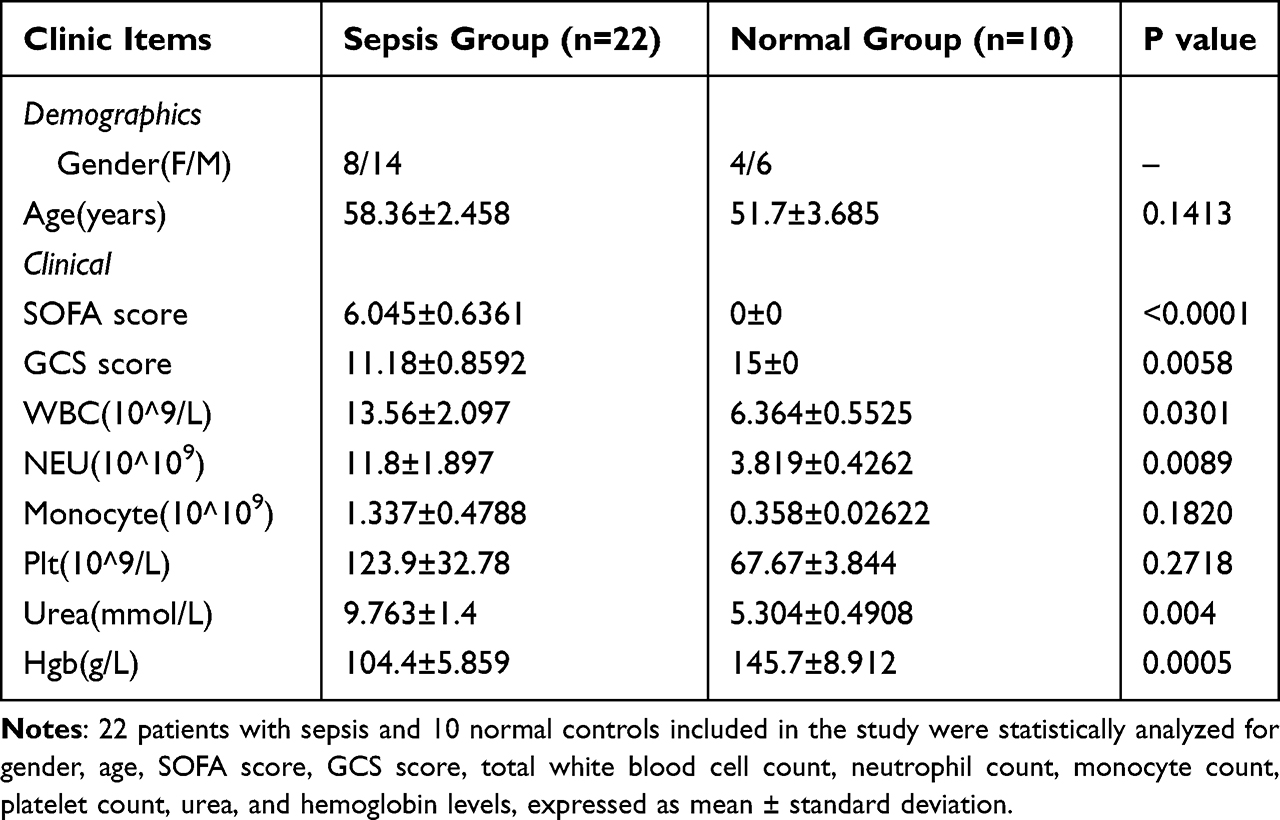 |
Table 1 Clinical Information of Patients with Sepsis and Normal Controls |
RNA Sequencing
Box plot and PCA analysis of the mRNA obtained by sequencing revealed good homogeneity and inter-group differentiation between samples in the normal group and sepsis group, with no outlier samples (Figure 2A and B). Differential analysis was performed on the data of the two groups, and 4681 differentially expressed genes were screened with |FC| ≥ 2.0 as well as FDR < 0.05, of which 2462 up-regulated genes were indicated in red, 2219 down-regulated genes in blue, and no differential genes in gray (Figure 2C).
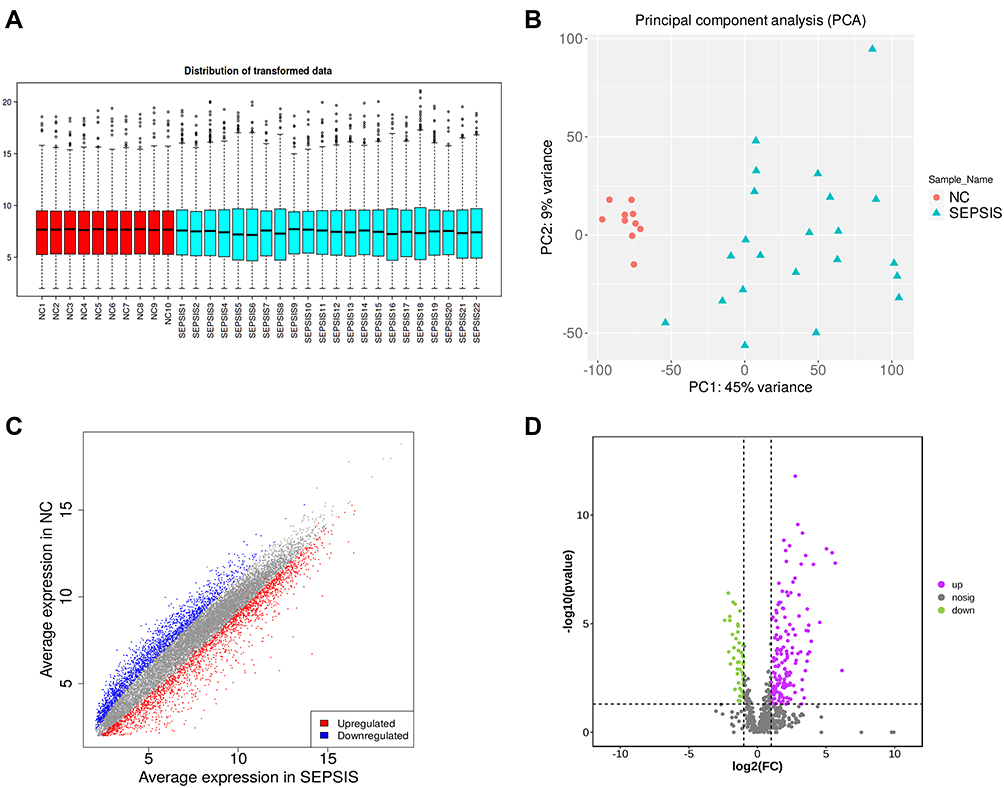 |
Figure 2 Data quality control and differential screening. (A) the y-axis of box plot represents logarithmicized FPKM (Fragments Per Kilobase of exon model per Million mapped fragments), also known as log10 (FPKM), and showing that the data of each sample are homogenized and distributed at the same level and are comparable; (B) PCA showing that the two groups are clearly distinguishable and there were no outliers; (C) volcano plot showing up-regulated (red) and down-regulated (blue) genes screened by differential analysis, the horizontal coordinate is the gene expression in the sepsis group and the vertical coordinate is the gene expression in the normal group; (D) volcano plot showing up-regulated (purple) and down-regulated (green) proteins screened by differential analysis, with the logarithm of the difference multiplicity (log2) as the horizontal coordinate and the negative logarithm of the p-value (log10) as the vertical coordinate. |
DIA Protein Profiling
After protein profiling and data quality control of peripheral blood samples from 22 sepsis patients and 10 healthy volunteers, 690 validated proteins were obtained, of which 482 were up-regulated and 208 were down-regulated. With |FC| ≥ 2.0 and P < 0.05, 202 differentially expressed proteins were screened, of which 157 up-regulated proteins were represented in purple and 45 down-regulated proteins were represented in green (Figure 2D).
Combined Transcriptome and Proteome Analysis
The nine-quadrant plot was divided into 9 quadrants, the vertical coordinates represent the log2 values of the differential ploidy of transcriptome genes, the horizontal coordinates represent the log2 values of the differential ploidy of protein expression in the proteome. Genes with ≥2-fold up-regulation or down-regulation of gene expression were defined as significantly differential genes (log2=1 or −1), and proteins with ≥2-fold up- regulation or down-regulation of protein expression were defined as significantly differential proteins. A total of 203 intersecting targets were screened by the combined analysis of the two histologies, among which 8 targets, including IGF1, CD44, and MMP8, etc were located in quadrants 1 or 9, indicating inconsistent differential expression patterns of mRNA and corresponding proteins, suggesting the existence of post-transcriptional or translational level regulation, such as miRNA regulation of target genes leading to inhibition of protein translation. 36 targets, including DMBT1, TDRD9, PCSK9, etc were located in quadrants 2 or 8, indicating differential expression of mRNA and no change in the corresponding protein, suggesting post-transcriptional or translational level regulation. The 31 targets of GSTO1, C1QA, RETN, GRN, etc. were located in the 3 or 7 quadrants, indicating the mRNA was consistent with the corresponding protein in expression pattern, suggesting synchronous changes in transcription and translation levels. 54 targets such as EXTL2, HYAL1, ITIH2, etc were located in quadrants 4 or 6, indicating differential protein expression with no change in corresponding mRNAs, suggesting translational level regulation or accumulation of protein. 73 targets such as HSPB1, DSC3, THRB, etc were located in quadrant 5, indicating that both co-expressed mRNAs and proteins were not differentially expressed (Figure 3A), the correspondence between specific genes and quadrants is shown in Table 2. The Venn diagram of transcriptome and proteome differentially expressed targets showed a total of 25 intersecting targets in both histologies (Figure 3B).
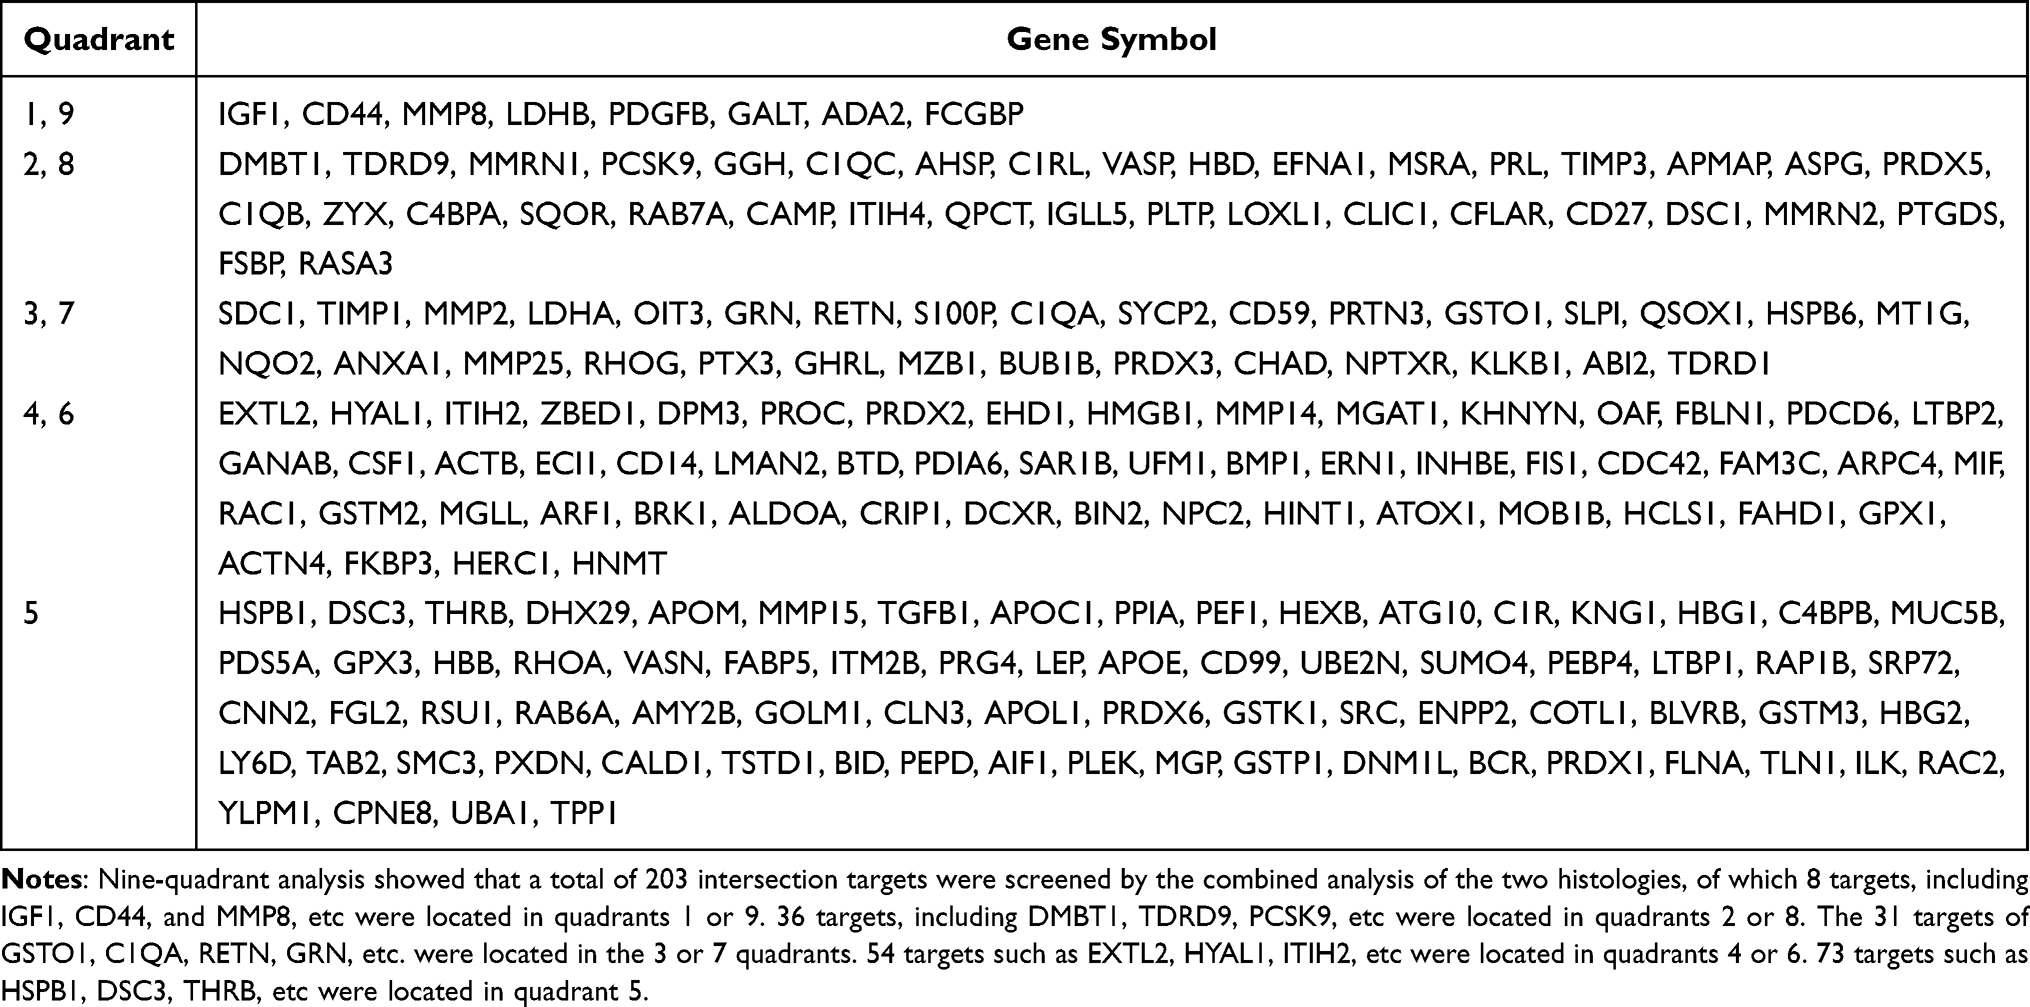 |
Table 2 Proteomics Combined with Transcriptomics Analysis |
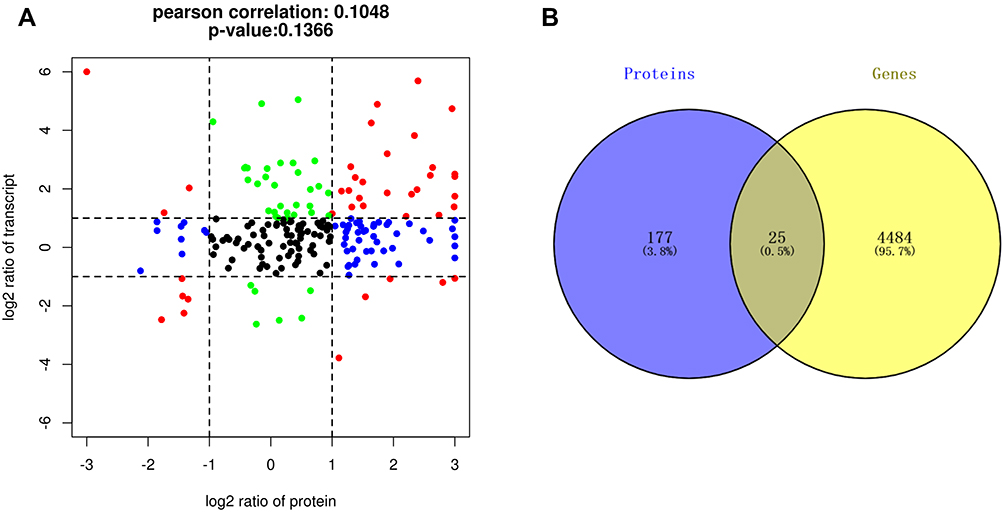 |
Figure 3 Transcriptome-proteome association analysis. (A) Nine-quadrant diagram showing 203 intersecting targets between transcriptome and proteome, including 8 targets in quadrants 1 or 9, 36 targets in quadrants 2 or 8, 31 targets in quadrants 3 or 7, 54 targets in quadrants 4 or 6, and 73 targets in quadrant 5. (B) Venn diagram showing 25 intersecting targets with differential expression between the proteomic and the transcriptome. |
PPI Analysis
The protein-protein interaction analysis network consists of 25 nodes and 78 edges, nodes represent proteins and edges represent connections. These proteins are localized in secretory granule, extracellular region, vesicle and other cellular components, mainly involved in myeloid leukocyte activation, neutrophil degranulation, inflammatory response, cell activation, immune system process and other biological processes. The proteins TIMP1, CD59, CD44, GSTO1, C1QA, RETN, GRN are located at the center of the network (Figure 4A). Based on RNA sequencing data, genes CHAD, KLKB1 and ABI2, etc. were found to be lowly expressed in the sepsis group, GSTO1, C1QA, RETN, GRN, TIMP1, CD59 and CD44 were highly expressed in the sepsis group (Figure 4B).
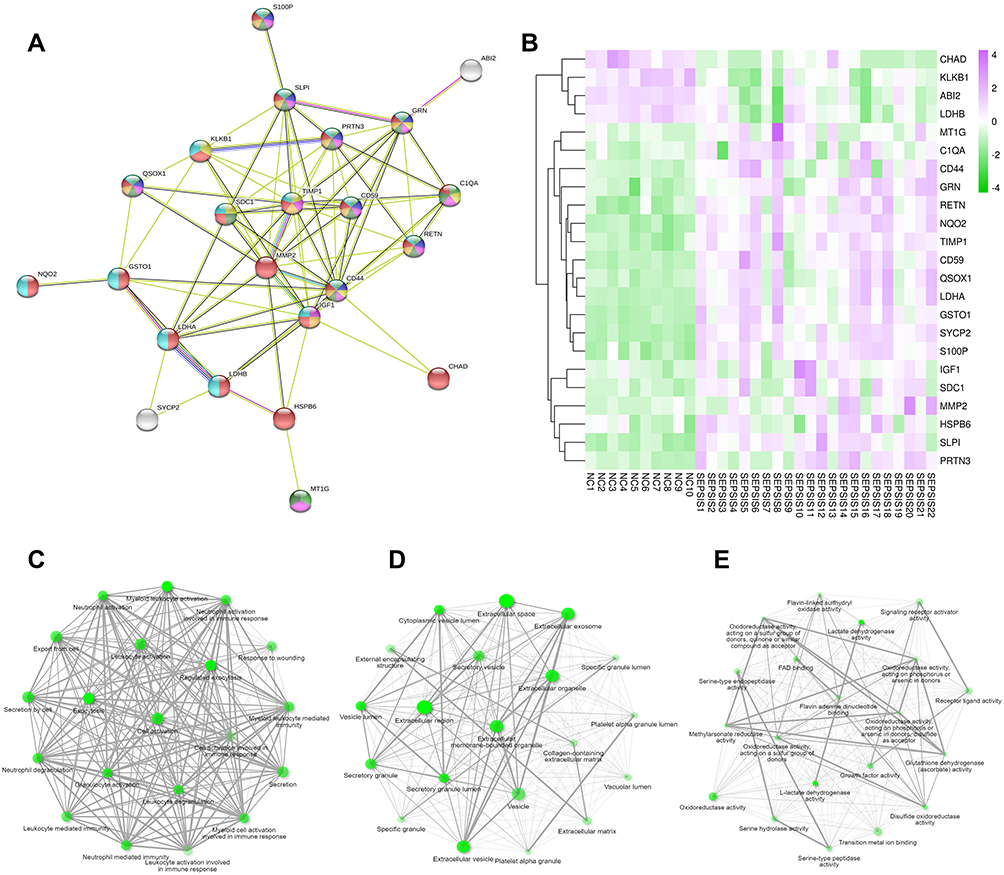 |
Figure 4 Intersectional gene analysis. (A) PPI network showing light green for myeloid leukocyte activation, purple for neutrophil degranulation, yellow for inflammatory response, pink for cell activation, dark green for immune system process, dark yellow represents secretory granule, red represents extended region, and royal blue represents vesicle. (B) heat map with purple for high expression in sepsis group and green for low expression in sepsis group; sample number below and gene name on the right; color shades respond to high and low expression values. (C) BP shows that the intersecting genes are mainly enriched in myeloid leukocyte activation, exocytosis, cell activation, neutrophil mediated immunity, secretion by cell, neutrophil activation, cell activation involved in immune response. (D) CC shows that the intersecting genes are mainly located in extracellular space, extracellular exosome, extracellular vesicle, secretory vesicle. (E), MF indicates that these genes are mainly involved in lactate dehydrogenase activity, oxidoreductase activity, signaling receptor activator activity, receptor ligand activity and other molecular processes. The darker nodes are the more significant enriched gene sets, and the larger nodes represent a larger number of enriched gene sets. |
GO Functional Enrichment Analysis
The top 20 gene sets of BP, CC, and MF were enriched separately, and in the GO interactive graph, if the two pathways (nodes) share 20% or more genes, they are connected. The darker nodes are the more significant enriched gene sets, and the larger nodes represent a greater number of enriched gene sets. GO functional enrichment analysis shows that the intersecting genes are mainly involved in myeloid leukocyte activation, exocytosis, cell activation, neutrophil mediated immunity, secretion by cell, neutrophil activation, cell activation involved in immune response, and other biological processes (Figure 4C), mainly located in extracellular space, extracellular exosome, extracellular vesicle, secretory vesicle and other cellular components (Figure 4D), mainly involved in lactate dehydrogenase activity, oxidoreductase activity, signaling receptor activator activity, receptor ligand activity, and other molecular functions (Figure 4E).
Meta-Analysis
Meta-analysis of the above intersecting genes at the transcriptional level using the sepsis datasets GSE28750, GSE54514, GSE67652, GSE69528, GSE95233 from the GEO public database showed that the expression of GSTO1, C1QA, RETN, GRN was significantly higher in the sepsis group compared with the normal group, and the differences were statistically significant (P < 0.05) (Figure 5).
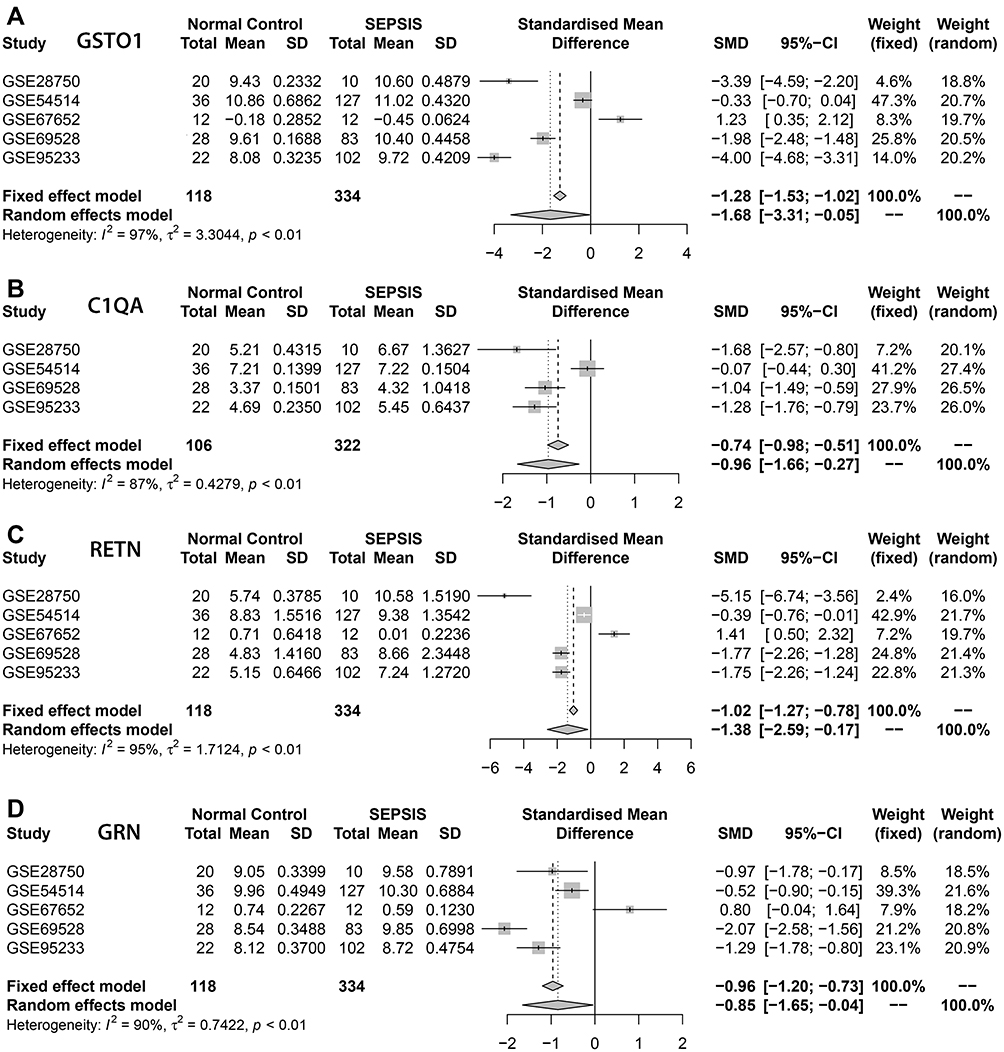 |
Figure 5 Meta-analysis. (A–D) represented the genes GSTO1, C1QA, RETN, GRN based on the data set GSE28750, GSE54514, GSE67652, GSE69528, GSE95233 respectively for the normal groups and sepsis groups meta-analysis, The four core genes showed low expression in the normal group and high expression in the sepsis group, and the differences were statistically significant (P<0.05). |
Single-Cell RNA Sequencing
The number of high quality cells for each sample was distributed from 4000 to 10,000, after eliminating double cells, multi-cells and apoptosis cells, the final number of cells obtained is distributed in 3108 to 8509, the average number of Unique Molecular Identifiers (UMI) in each cell was distributed from 519 to 8529, and the average number of genes in each cell was distributed from 343 to 2337. After descending clustering, the cells were divided into 9 clusters, and the cell types identified by Marker genes were B cell, NK cell, T cell, Platelet, and Monocyte. Among them, 3 and 5 represented macrophages, 4 represented NK cells, 1, 2, 6, and 8 represented T cells, 7 represented B cells, and 9 represented platelets (Figure 6A). GSTO1, C1QA, RETN, and GRN are mainly localized in 3 and 5 cell populations, that is, macrophage lines (Figure 6B–D).
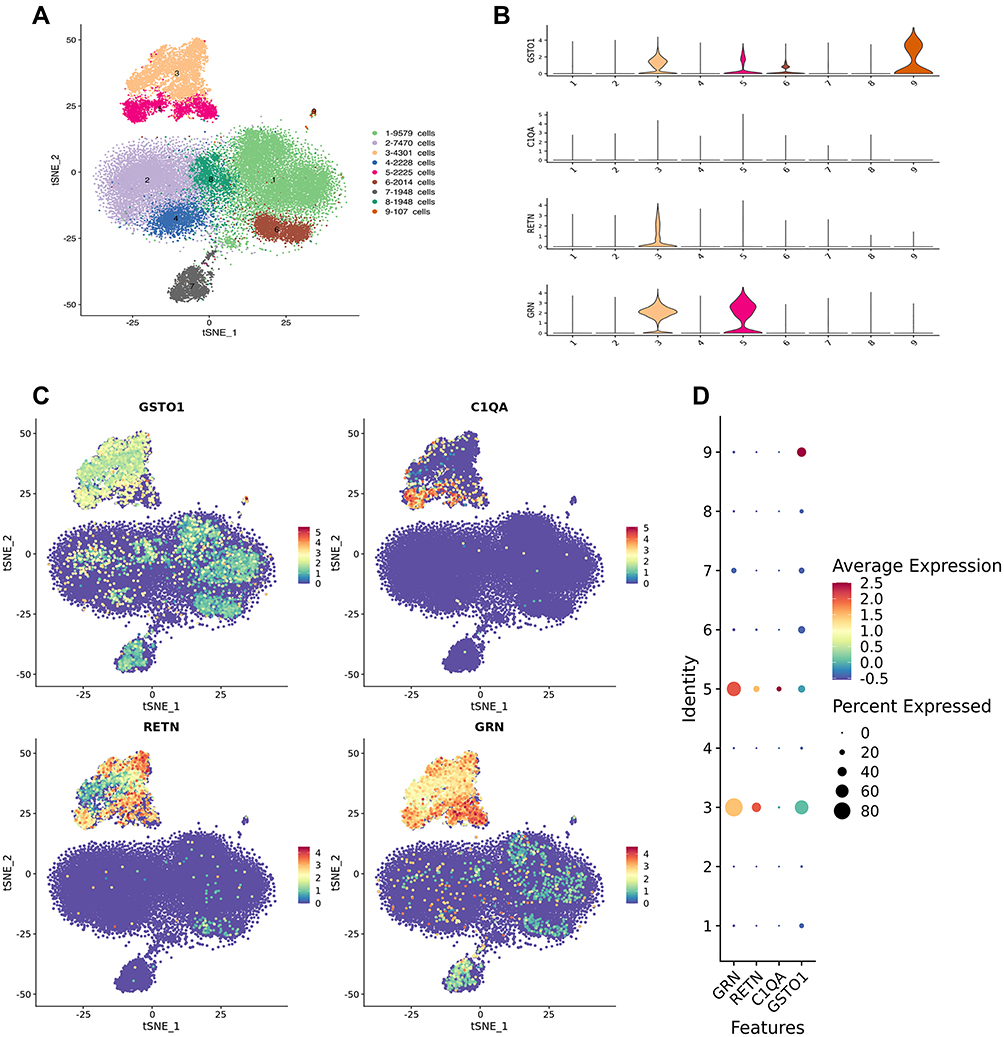 |
Figure 6 Single-cell RNA sequencing. (A) General map of sequencing of mixed samples. Cell populations 1,2,6 and 8 are T cells, 3 and 5 are macrophages, 4 is NK cells, 7 is B cells, and 9 is platelets. (B–D) suggest that core genes GSTO1, C1QA, RETN, and GRN are mainly localized in 3 and 5 cell populations, that is, macrophage lines. |
Discussion
The difficulty in the diagnosis and treatment of sepsis is that its pathological mechanism is not fully understood, and the core targets associated with prognosis are not clear for precise targeted therapy. In this study, 25 potential core genes were screened by RNA sequencing technique combined with DIA protein profile analysis. And we performed PPI and GO functional enrichment analysis on core genes. Four potential key genes, GSTO1, C1QA, RETN and GRN were screened by meta-analysis, these mRNAs were consistent with the corresponding protein in expression patterns, suggesting simultaneous changes in transcription and translation levels. The four key genes were mainly localized in macrophages and were highly expressed in the sepsis group, suggesting that they deserve further investigation and may provide clues for sepsis treatment.
Glutathione S-transferase Omega 1 (GSTO1), a glutathione S-transferase (GST) family gene, has been found to be upregulated in a variety of highly aggressive cancer cells,22 and some studies have shown that GSTO1 is associated with chemotherapy-resistant. Therefore, inhibition of GSTO1 may be an emerging strategy for cancer therapy.23 GSTO1 exhibits different activities in the regulation of inflammation, apoptosis and redox homeostasis,24 but its specific mechanism of action is unclear. The functional enrichment in this study suggests that GSTO1 is mainly involved in molecular functions such as oxidoreductase activity, disulfide oxidoreductase activity, mainly localized in macrophages and highly expressed in sepsis patients. The complement system is an early participant in the innate immune response, providing initial host protection by promoting phagocytosis of apoptotic or necrotic cells. C1Q molecule is an important molecule that activates the classical pathway of the complement cascade and is encoded by the C1Q gene cluster.25 C1Q deficiency prevents cerebrovascular injury and white matter loss in chronically obese mice.26 Homonymous single nucleotide polymorphisms in Component 1qa (C1QA) have been associated with distant metastasis in breast cancer.27 Studies on CIQA and sepsis are limited, in this study, bioinformatics analysis revealed that CIQA is mainly involved in biological processes such as inflammatory response, cell activation, immune system process, and is highly expressed in the sepsis group. Adipose tissue is a highly active metabolic and endocrine organ, and its dysfunction can lead to insulin resistance, type 2 diabetes or hyperlipidemia. Resistin (RETN) is a hormone secreted by adipocytes and is associated with glucose homeostasis and insulin resistance,28,29 obesity, inflammation and various cancers, including breast cancer.30 The present study showed that RETN was found to be mainly localized in macrophages, involved in myeloid leukocyte activation, regulated exocytosis, cell activation, neutrophil mediated immunity, and highly expressed in the sepsis group. Progranulin Gene (GRN) plays a key role in the development, survival and function of mammalian neuronal cells and microglia, and it regulates lysosomal biogenesis, inflammation, repair, stress response and aging responses.31 GRN mutations are associated with one third of inherited frontotemporal dementias.32 Circulating GRN is a potential biomarker for screening patients with Alzheimer-type dementia and mild cognitive impairment.33 In this experiment, GRN was found to be highly expressed in the sepsis group, mainly located in macrophages, and involved in biological processes such as myeloid leukocyte activation, neutrophil degranulation, inflammatory response, and cell activation.
In this study, human peripheral blood RNA sequencing, DIA protein profile and 10× single-cell RNA sequencing combined with GEO public database information were used to screen out core genes that are closely linked to the clinical phenotype of sepsis, we explore the expression of core genes from multiple dimensions, providing important clues for later in-depth research. This study focused on the consistency of genes and proteins expression trends in blood, only focused on core factors with increased expression in plasma, which may be associated with intercellular communication or leakage after cell death. However, there are still a large number of core genes in cells that are not expressed in plasma, especially some transcription factors that are transferred to the nucleus. The shortcoming of this study is that the relevant content is an observational study of phenomenon, and further functional validation of the target genes has not been performed.
Conclusion
The core genes GSTO1, C1QA, RETN and GRN are mainly expressed in macrophages, widely involved in inflammation and immune responses, and are highly expressed in plasma in the sepsis, suggesting that they may become potential research targets for sepsis.
Data Sharing Statement
We intend to share individual deidentified participant data. Peripheral blood RNA sequencing data and DIA protein profiling data from 22 patients with sepsis and 10 normal controls are available in the China National GeneBank DataBase (CNGBdb) and can be found below: https://db.cngb.org/, under the accession: CNP0002611, you can access it now and it’s valid forever.
Acknowledgments
The study was supported by Project of science and technology department of Sichuan province [grant number 2019JDPT0003].
Disclosure
The authors report no conflicts of interest in this work.
References
1. Eisenberg MA, Balamuth F. Pediatric sepsis screening in US hospitals. Pediatr Res. 2022;91(2):351–358.
2. Alba-Patiño A, Vaquer A, Barón E, et al. Micro- and nanosensors for detecting blood pathogens and biomarkers at different points of sepsis care. Mikrochim Acta. 2022;189(2):74.
3. Chen J, Wei H. Immune intervention in sepsis. Front Pharmacol. 2021;12:718089.
4. Rimmelé T, Payen D, Cantaluppi V, et al. Immune cell phenotype and function in sepsis. Shock. 2016;45(3):282–291.
5. Heming N, Azabou E, Cazaumayou X, et al. Sepsis in the critically ill patient: current and emerging management strategies. Expert Rev Anti Infect Ther. 2021;19(5):635–647.
6. Hrdlickova R, Toloue M, Tian B. RNA-Seq methods for transcriptome analysis. Wiley Interdiscip Rev RNA. 2017;8(1):e1364.
7. Shi H, Zhou Y, Jia E, et al. Bias in RNA-seq library preparation: current challenges and solutions. Biomed Res Int. 2021;2021:6647597.
8. Yip SH, Sham PC, Wang J. Evaluation of tools for highly variable gene discovery from single-cell RNA-seq data. Brief Bioinform. 2019;20(4):1583–1589.
9. Chen G, Ning B, Shi T. Single-cell RNA-seq technologies and related computational data analysis. Front Genet. 2019;10:317.
10. Li J, Smith LS, Zhu HJ. Data-independent acquisition (DIA): an emerging proteomics technology for analysis of drug-metabolizing enzymes and transporters. Drug Discov Today Technol. 2021;39:49–56.
11. Yang Y, Lin L, Qiao L. Deep learning approaches for data-independent acquisition proteomics. Expert Rev Proteomics. 2021;18(12):1031–1043.
12. Ge SX, Son EW, Yao R. iDEP: an integrated web application for differential expression and pathway analysis of RNA-Seq data. BMC Bioinform. 2018;19(1):534.
13. Von Mering C, Jensen LJ, Snel B, et al. STRING: known and predicted protein-protein associations, integrated and transferred across organisms. Nucleic Acids Res. 2005;33:D433–D437.
14. Ge SX, Jung D, Yao R. ShinyGO: a graphical gene-set enrichment tool for animals and plants. Bioinformatics. 2020;36(8):2628–2629.
15. Sutherland A, Thomas M, Brandon RA, et al. Development and validation of a novel molecular biomarker diagnostic test for the early detection of sepsis. Crit Care. 2011;15(3):R149.
16. Parnell GP, Tang BM, Nalos M, et al. Identifying key regulatory genes in the whole blood of septic patients to monitor underlying immune dysfunctions. Shock. 2013;40(3):166–174.
17. Vieira Da Silva Pellegrina D, Severino P, Vieira BH, et al. Septic shock in advanced age: transcriptome analysis reveals altered molecular signatures in neutrophil granulocytes. PLoS One. 2015;10(6):e0128341.
18. Pankla R, Buddhisa S, Berry M, et al. Genomic transcriptional profiling identifies a candidate blood biomarker signature for the diagnosis of septicemic melioidosis. Genome Biol. 2009;10(11):R127.
19. Venet F, Schilling J, Cazalis MA, et al. Modulation of LILRB2 protein and mRNA expressions in septic shock patients and after ex vivo lipopolysaccharide stimulation. Hum Immunol. 2017;78(5–6):441–450.
20. Vuckovic D, Gasparini P, Soranzo N, et al. MultiMeta: an R package for meta-analyzing multi-phenotype genome-wide association studies. Bioinformatics. 2015;31(16):2754–2756.
21. Aran D, Looney AP, Liu L, et al. Reference-based analysis of lung single-cell sequencing reveals a transitional profibrotic macrophage. Nat Immunol. 2019;20(2):163–172.
22. Wang LK, Yue HL, Peng XJ, et al. GSTO1 regards as a meritorious regulator in cutaneous malignant melanoma cells. Mol Cell Probes. 2019;48:101449.
23. Tsuboi K, Bachovchin DA, Speers AE, et al. Optimization and characterization of an inhibitor for glutathione S-transferase; 2010.
24. Radic T, Coric V, Bukumiric Z, et al. GSTO1*CC Genotype (rs4925) predicts shorter survival in clear cell renal cell carcinoma male patients. Cancers. 2019;11:12.
25. Bruiners N, Schurz H, Daya M, et al. A regulatory variant in the C1Q gene cluster is associated with tuberculosis susceptibility and C1qA plasma levels in a South African population. Immunogenetics. 2020;72(5):305–314.
26. Graham LC, Kocalis HE, Soto I, et al. Deficiency of complement component C1Q prevents cerebrovascular damage and white matter loss in a mouse model of chronic obesity. eNeuro. 2020;3. doi:10.1523/ENEURO.0057-20.2020.
27. Azzato EM, Lee AJ, Teschendorff A, et al. Common germ-line polymorphism of C1QA and breast cancer survival. Br J Cancer. 2010;102(8):1294–1299.
28. Nowacka-Woszuk J, Pruszynska-Oszmalek E, Szydlowski M, et al. Diet-induced variability of the resistin gene (Retn) transcript level and methylation profile in rats. BMC Genet. 2015;16:113.
29. Zhang Y, Wang Y, Xu Q, et al. Molecular and expression characteristics of resistin (RETN) and its effects on the differentiation of intramuscular preadipocyte in goat. Anim Biotechnol. 2021;32(1):113–120.
30. Wang CQ, Tang CH, Tzeng HE, et al. Impacts of RETN genetic polymorphism on breast cancer development. J Cancer. 2020;11(10):2769–2777.
31. Rhinn H, Tatton N, Mccaughey S, et al. Progranulin as a therapeutic target in neurodegenerative diseases. Trends Pharmacol Sci. 2022;43:641–652.
32. Terryn J, Verfaillie CM, Van Damme P. Tweaking progranulin expression: therapeutic avenues and opportunities. Front Mol Neurosci. 2021;14:713031.
33. Sleegers K, Brouwers N, Van Broeckhoven C. Role of progranulin as a biomarker for Alzheimer’s disease. Biomark Med. 2010;4(1):37–50.
 © 2022 The Author(s). This work is published and licensed by Dove Medical Press Limited. The full terms of this license are available at https://www.dovepress.com/terms.php and incorporate the Creative Commons Attribution - Non Commercial (unported, v3.0) License.
By accessing the work you hereby accept the Terms. Non-commercial uses of the work are permitted without any further permission from Dove Medical Press Limited, provided the work is properly attributed. For permission for commercial use of this work, please see paragraphs 4.2 and 5 of our Terms.
© 2022 The Author(s). This work is published and licensed by Dove Medical Press Limited. The full terms of this license are available at https://www.dovepress.com/terms.php and incorporate the Creative Commons Attribution - Non Commercial (unported, v3.0) License.
By accessing the work you hereby accept the Terms. Non-commercial uses of the work are permitted without any further permission from Dove Medical Press Limited, provided the work is properly attributed. For permission for commercial use of this work, please see paragraphs 4.2 and 5 of our Terms.