")
Back to Journals » OncoTargets and Therapy » Volume 11
Protein tyrosine phosphatase L1 inhibits high-grade serous ovarian carcinoma progression by targeting IκBα
Authors Wang Y, Li M, Huang T, Li J
Received 2 March 2018
Accepted for publication 26 May 2018
Published 30 October 2018 Volume 2018:11 Pages 7603—7612
DOI https://doi.org/10.2147/OTT.S167106
Checked for plagiarism Yes
Review by Single anonymous peer review
Peer reviewer comments 3
Editor who approved publication: Dr Samir Farghaly
Yacheng Wang, Miao Li, Ting Huang, Jun Li
Department of Oncology, The Central Hospital of Wuhan, Wuhan, Hubei, China
Background: High-grade serous ovarian cancer (HGSOC) represents most of the ovarian cancers and accounts for 70%–80 % of related deaths. The overall survival of HGSOC has not been remarkably improved in the past decades, due to the tumor dissemination in peritoneal cavity and invasion of adjacent organs. Therefore, identifying molecular biomarkers is invaluable in helping predicting clinical outcomes and developing targeted chemotherapies. Although there have been studies revealing the prognostic significance of protein tyrosine phosphatase L1 (PTPL1) in breast cancer and lung cancer, its involvement and functions in HGSOC remains to be elucidated.
Methods: We retrospectively enrolled a cohort of HGSOC patients after surgical resection. And analyzed the mRNA and protein levels of PTPL1 in tissue samples.
Results: We found that PTPL1 presented a lower expression in HGSOC tissues than in adjacent normal ovarian tissues. Besides, the PTPL1 level was negatively correlated with tumor stage, implying its potential role as a tumor suppressor. Univariate and multivariate analyses identified that patients with higher PTPL1 showed a better overall survival compared to those with lower PTPL1 expression. In addition, cellular experiments confirmed the role of PTPL1 in suppressing tumor proliferation and invasion. Furthermore, we demonstrated that PTPL1 negatively regulated phosphorylation of tyrosine 42 on IκBα (IκBα-pY42). To our knowledge, this is the initial finding on PTPL1 targeting IκBα-pY42 site. Finally, our data indicated that PTPL1 suppressed tumor progression by dephosphorylating IκBα-pY42, which stabilized IκBα and attenuated nucleus translocation of NF-κB.
Conclusion: Our study revealed a tumor-suppressing role of PTPL1 in HGSOC by targeting IκBα.
Keywords: IκBα, phosphorylation, prognosis, PTPL1, serous ovarian carcinoma, overall survival
Introduction
Epithelial ovarian cancer is the most lethal gynecologic malignancy,1 and high-grade serous ovarian carcinoma (HGSOC) accounts for most of the morbidity and mortality in this tumor type. Although the concept of HGSOC has been raised up for decades, till now, our understanding of HGSOC remains limited compared with other tumor types.2 HGSOC is generally diagnosed at advanced FIGO stages (stage III and stage IV), and the accurate diagnosis of this specific histological tumor type was only established in the last decade. Interestingly, the origin of HGSOC is the fallopian tubes instead of ovarian tissues.3 The poor prognosis of HGSOC is partially resulted from lacking early disease-specific symptoms and biomarkers. For example, the cancer antigen 125 (CA-125) is useful in monitoring disease status but failed to accomplish detection of early FIGO stage.4 In addition, HGSOC is initially hypersensitive to platinum chemotherapy, however, up to 75% of those responding cases occur with platinum-resistant relapse, and the 5-year survival rate is less than 40%.5 Last but not least, HGSOC is characterized with high invasive capacity, and the underlying molecular mechanism is still the major limitation for developing novel therapies. Therefore, identifying novel and reliable biomarkers for early diagnosis of HGSOC is urgently needed.6
Phosphorylation and de-phosphorylation are one of the most important post-translational modifications in functional proteins.7 Tyrosine phosphorylation is balanced by various kinases and protein tyrosine phosphatases (PTPs), playing critical roles in cellular survival, proliferation, and motility. PTPL1, also known as PTPN13, is a kind of non-receptor PTPs.8 Besides the conserved PTP domain for catalyzing de-phosphorylation, PTPL1 contains complex interaction domains such as PDZ domains.9 Due to the diversity of protein substrates, PTPL1 may show distinct roles in different tumor types. For example, PTPL1 can dephosphorylate insulin receptor substrate-1 (IRS-1) and induce apoptosis of Hela cells.10 In contrast, PTPL1 dephosphorylates Fas (Apo-1, CD95) protein, subsequently suppresses the Fas-caspase 8 apoptosis signaling pathway and promotes tumor progression of hepatocellular carcinoma.11 Therefore, identifying novel PTPL1 substrates will significantly enlarge our understanding of the molecular basis for its distinct functions in tumors.
PTPL1 has been reported to be upregulated in Fas-resistant ovarian cancer cell line SKOV3 and induced chemo-resistance by downregulating the Fas protein.12 However, its prognostic role in HGSOC patients has not been systematically studied. In this study, we explored the mRNA and protein expression of PTPL1 in clinical HGSOC samples and identified that its lower expression is an unfavorable prognostic factor. In addition, we found that PTPL1 can directly inhibit proliferation and invasion of HGSOC cells, which is completely different from the results in chemoresistant cell lines.12 Furthermore, our data revealed IκBα (nuclear factor of kappa light polypeptide gene enhancer in B-cells inhibitor, alpha) as a novel substrate of PTPL1.
Patients and methods
Patients and samples
Formalin-fixed, paraffin-embedded HGSOC tissues (n=97, the median patient age was 64.0 years) were collected from the Central Hospital of Wuhan (2009–2017). Patients’ information including age, pathological grade, FIGO stage, and serum CA-125 levels at the time of diagnosis were retrieved. The median follow-up time for our cohort was 42 months, ranging 9–89 months. Another seven paired HGSOC tissues and adjacent nontumorous ovarian tissues were stored in −80°C immediately after surgical resection. None of the patients underwent preoperative chemotherapy or radiotherapy. After surgery, 37 (37/97, 38.1%) patients received only paclitaxel chemotherapy, 49 (49/97, 50.5%) patients were treated with paclitaxel and carboplatin, and the other 11 (11/97, 11.3%) patients were treated with platinum and cyclophosphamide. All the patients underwent R0 resection, and final diagnoses were based on histological and pathological examinations.13 The accurate diagnosis of HGSOC was based on histological examination, p53 test, and WT1 (Wilms’ tumor 1) test. Mutate p53 was used to distinguish HGSOC with LGSOC, while WT1 was used to distinguish HGSOC with endometrioid carcinoma.2 Research use of tissue samples was approved by the ethical committee of the Central Hospital of Wuhan. Signed informed consents were obtained from all the cases enrolled in this study.
Quantitative real-time polymerase chain reaction
Total RNA was extracted from fresh frozen tissue samples with TRIzol reagent (Thermo Fisher Scientific, Waltham, MA, USA) according to the manufacturer’s instructions. The concentration and purity of isolated RNA were confirmed by a NanoDrop instrument (NanoDrop Technologies, Wilmington, DE, USA). cDNA was generated by reverse transcription from 1 μg RNA using a Superscript III kit (Thermo Fisher Scientific). qPCR analysis was then performed to evaluate the mRNA level of PTPL1 in HGSOC and adjacent nontumorous tissues. The PTPL1 primers were designated as 5′-GCGAAATGATCAGTTGCCAATAG-3′ and 5′-ACTTGGCACCCGTCTATTTACC-3′.14 In addition, housekeeping gene GAPDH was used as internal control to normalize the variability in different groups (primers: 5′-GCCGC ATCTTCTTTTGCGTCGC-3′ and 5′-TCCCGTTCTCAGCCTTGACGGT-3′).15 Transcription levels were calculated using the 2−ΔΔCt method.16 All experiments were performed in triplicate for at least three times.
Western blot
Immunoblotting assays were performed to evaluate the expression or phosphorylation levels of various proteins. Fresh-frozen tissues or harvested cells were homogenized in RIPA buffer to generate total cell lysates. Nucleus fraction was isolated as described by others.17 Total protein concentration was measured using a BCA Protein Assay Kit (Pierce, Rockford, IL, USA). Briefly, 20 μg of total proteins was resolved on 10% SDS/PAGE gels, transferred onto polyvinylidene fluoride membranes (EMD Millipore, Billerica, MA), blocked with 5% nonfat milk, and probed with primary antibodies including PTPL1, IκBα, phospho-IκBα (Tyr42), NF-κB, caspase 3, caspase 9, and β-actin (Santa Cruz Biotechnology Inc., Dallas, TX, USA). Horseradish peroxidase-conjugated secondary antibodies were then incubated for 1 hour at room temperature followed by detection with enhanced chemiluminescence solution (Thermo Fisher Scientific).
Immunohistochemistry (IHC) and IHC evaluation
Formalin-fixed, paraffin-embedded HGSOC tissues were cut into 4 μm sections, followed by de-paraffinized and re-hydrated. After antigen retrieval in a microwave for 10 minutes, sections were blocked with non-immunoreactivity goat serum and then incubated overnight with anti-PTPL1 (Abcam, Cat No ab198882, 1:100 dilution) or anti-phospho-IκBα-Y42 (Abcam, Cat No ab24783; Cambridge, MA, USA; 1:100 dilution) antibodies at 4°C. Negative controls were conducted by incubating with PBS instead of primary antibody. Sections were then incubated with the corresponding biotinylated secondary antibody at room temperature for 2 hours. Immunoreactivity was visualized with 3,3-diaminobenzidine (DAB) staining for 15 minutes. The slides were finally counterstained with 1% hematoxylin and evaluated by two independent pathologists. As described by others,15 PTPL1 expressions were scored by determining the percentage and staining intensity of positive cells in three different visual fields at ×100 magnification. The percentage of positive tumor cells was scored as follows: 0 (0%–10%), 1 (11%–50%), 2 (51%–75%), and 3 (75%–100%).18 The staining intensity was graded into 0 (negative), 1 (weakly positive), 2 (moderately positive), and 3 (strongly positive). The final IHC score of PTPL1 was weighted by multiplying the intensity and percentage scores (range 0–9).19 High PTPL1 immunostaining was defined as IHC score ≥4, while <4 was defined as a low PTPL1 expression.
Cell culture and transfection
The human high-grade serous ovarian carcinoma cell line OV-90 was obtained from the China Center for Type Culture Collection (CCTCC, Wuhan, Hubei, China). Primary ovarian cancer (POC) cells were established following the procedures described by others,20 and human normal fallopian tube epithelium cells (FTEC) were purchased from Lifeline Cell Technology (Carlsbad, CA, USA) (Cat. No FC-0081). All cells were maintained in DMEM supplemented with 10% FBS and 1% penicillin (10,000 U/mL)/streptomycin (10 mg/mL) in a humidified atmosphere at 37°C with 5% CO2.
The coding regions of PTPL1 were cloned into a pCMV6 vector (pCMV6-PTPL1). After the confirmation by DNA-Sequencing, pCMV6-PTPL1 was transfected into OV-90 cells to generate PTPL1-overexpressing cells. Knockdown of PTPL1 was achieved using an siRNA with the following sequence: 5′-CAGAUCAGCUUUCCUGUAA-3′ (position 1,028–1,046). Both overexpression and siRNA-knockdown were performed with Lipofectamine 2000 reagent (Thermo Fisher Scientific) following the manufacturer’s procedure. For each transfection assay, the plasmid construct vector and scrambled siRNA were used as negative control. The transfection efficiencies were tested by Western blot analyses.
MTT assay
Transfected cells were seeded into 96-well plates (5.0×10³ cells/well) with a final volume of 150 μL/well. At designated time points (day 1, 2, 3, and 4), 20 μL MTT solution was added into each well. After another 4 hours incubation at 37°C, the culturing medium was discarded, and crystals were resolved by adding 150 μL of DMSO.21 Cell viability was then assessed by measuring the absorbance at 490 nm wavelength with a 96-well plate reader. All experiments were performed for three times in triplicate.
Matrigel-transwell assay
Transfected cells within the log phase were resuspended in FBS-free medium and seeded (8×10⁴ cells/well) into 24-well Transwell chambers (Corning Incorporated, Corning, NY, USA) pre-coated with Matrigel (B Biosciences, San Jose, CA, USA). Medium containing 20% FBS was added into the lower chamber as a chemoattractant. After keeping the culture at 37°C for 48 hours, the invaded cells adhesive to the lower membrane surface were fixed with 100% methanol, stained with 0.5% crystal violet, and counted under a light microscope to determine the average number of cells from five visual fields.22 Assays were performed in triplicate for three times.
Statistics
Statistical analysis was performed using the SPSS 18.0 software. Data were expressed as mean ± SD. Differences between the two subgroups were evaluated with two-sided chi-squared test. Overall survival time was defined as the period from the date of surgery to the date of death or last follow-up. Univariate analysis was performed using the Kaplan–Meier method and the log-rank test. Parameters with significant prognostic value in the univariate analysis were subjected to the multivariate Cox regression model to determine their independent role in clinical outcomes. Statistical differences between cellular treatment groups were evaluated by two-tailed Student’s t-test compared with the control group. P<0.05 was considered statistically significant.
Results
Patients’ characteristics
A total number of 97 patients suffered from HGSOC were enrolled in this retrospective study. The median age at the time of diagnosis was 64.0 years. Most of the patients (85/97, 87.6%) were diagnosed with a higher level of serum CA-125 (>35 U/mL), only 12 patients within the normal range of CA-125 (0–35 U/mL). According to the pathological examination, 69 patients were classified as differential grade 3, and the other 28 patients suffered with grade 1–2. Consistent with previous studies, most of the HGSOC patients were with advanced FIGO stage, and only six patients (6/97, 6.2%) were with FIGO stage I or stage II. The median survival time was 42.0 months, and the 5-year overall survival was 32.7%. The detailed clinicopathologic characteristics are listed in Table 1.
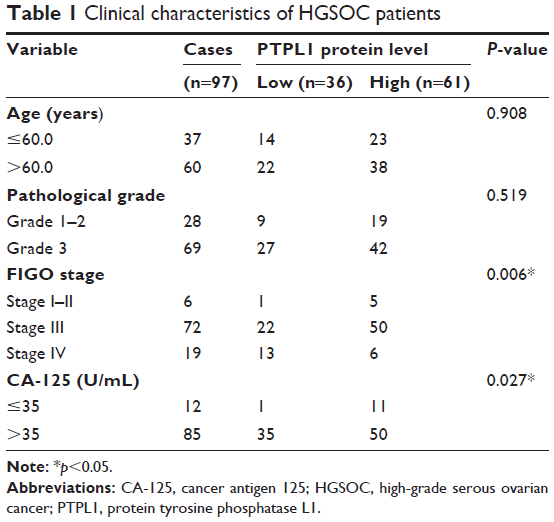 | Table 1 Clinical characteristics of HGSOC patients |
PTPL1 shows lower expression in HGSOC and correlated with disease progression
First, we compared the mRNA levels of PTPL1 in seven paired HGSOC and adjacent non-tumorous tissues and found that PTPL1 transcripts were significantly lower in HGSOC than that in adjacent tissues (P=0.042, Figure 1A). The protein expression pattern of PTPL1 from fresh-frozen tissues was consistent with that of mRNA, showing a decreased level in tumor tissues (Figure 1B). The results indicated that PTPL1 might play tumor suppressing roles in HGSOC, and we next expanded the case numbers by collecting paraffin-embedded HGSOC tissue samples from the Department of Pathology in our hospital. After excluding those lost to follow-up, the cohort finally contains 97 cases. Most of the adjacent normal ovarian tissues showed strong positive expression of PTPL1 (Figure 1C) in the cytoplasm, while 36 patients (36/97, 37.1%) were identified as a PTPL1 low expression or negative expression in HGSOC tissues (Figure 1D).
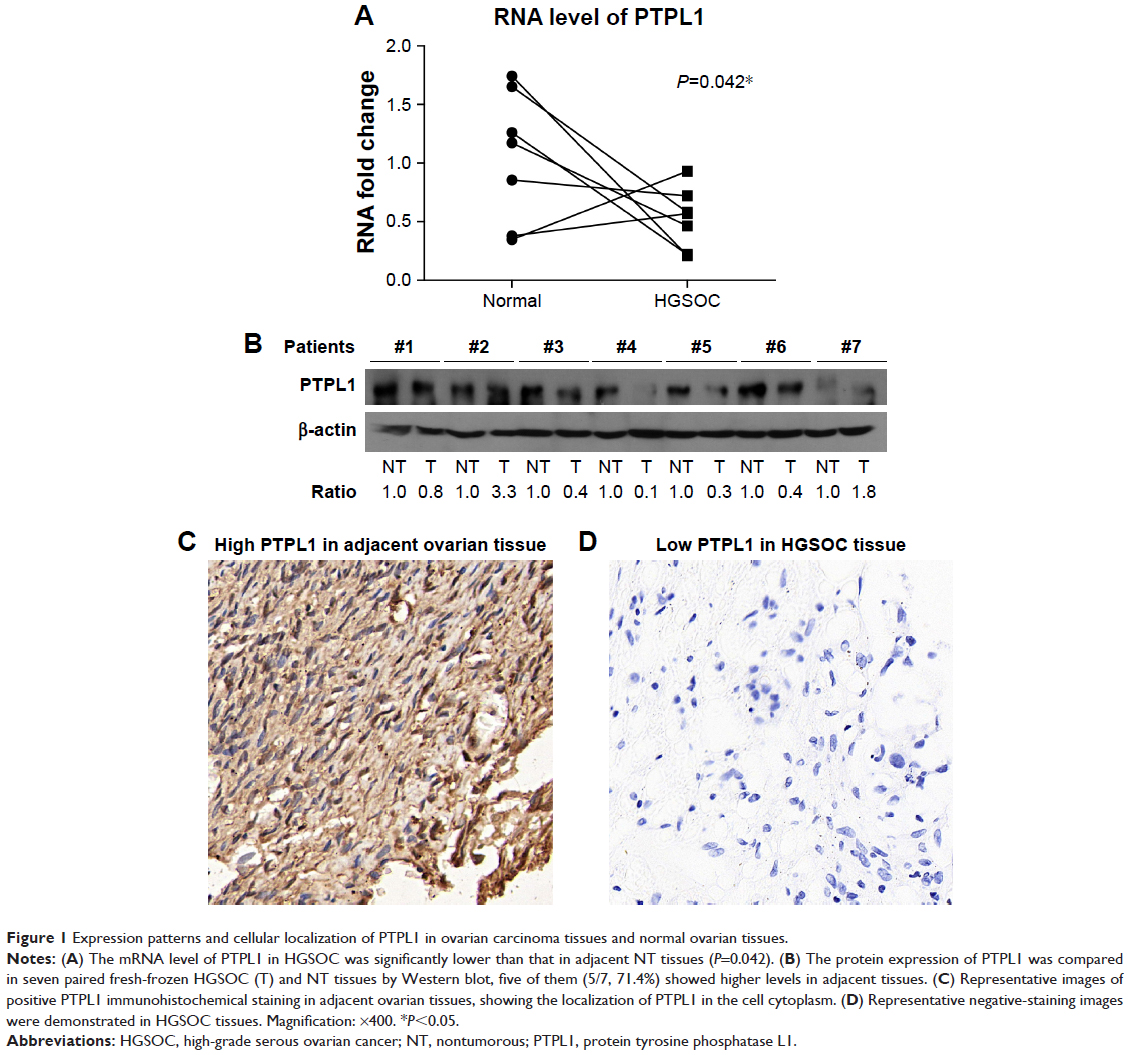 | Figure 1 Expression patterns and cellular localization of PTPL1 in ovarian carcinoma tissues and normal ovarian tissues. |
By quantifying the PTPL1 staining in HGSOC tissues, all the patients were divided into two groups: low PTPL1 expression group (n=36) and high PTPL1 expression group (n=61). The associations of PTPL1 expression with different clinicopathological parameters were assessed using the chi-squared test (Table 1). There was no significant difference in patients’ age or pathological grade between these two groups (P=0.908 and P=0.519, respectively). However, PTPL1 level in tumor cells was significantly correlated with the clinical stage (P=0.006), on that the HGSOC tissues with advanced clinical stages (III–IV) showed lower PTPL1 expressions than those with early clinical stages (I–II). Interestingly, patients with higher CA-125 levels exhibited significantly higher PTPL1 (P=0.027) although the bias is non-negligible due to limited case numbers.
Decreased PTPL1 indicates poor prognosis of HGSOC patients
Kaplan–Meier survival analyses were then performed to determine the clinical significance of variables (Figure 2). As expected, the advanced FIGO stage was negatively correlated with the poor overall survival (P=0.004, Table 2). Interestingly, patients with low PTPL1 expression also showed a shorter mean overall survival time compared to those with higher PTPL1 level (48.3±4.1 vs 59.5±3.6 months, P=0.042). Therefore, lower PTPL1 was an unfavorable prognostic factor for the overall survival of HGSOC patients.
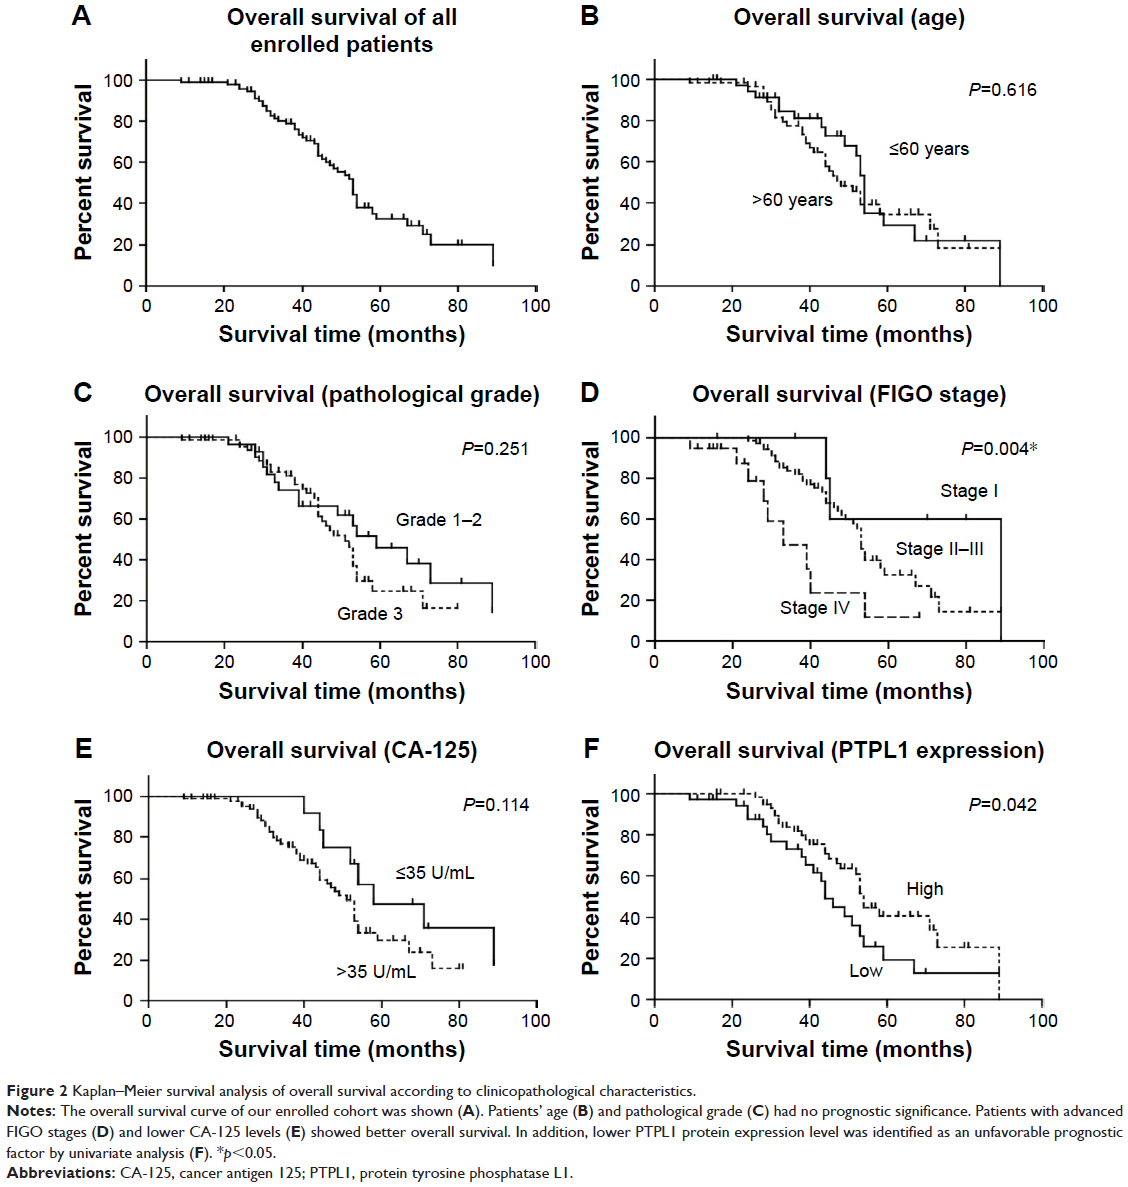 | Figure 2 Kaplan–Meier survival analysis of overall survival according to clinicopathological characteristics. |
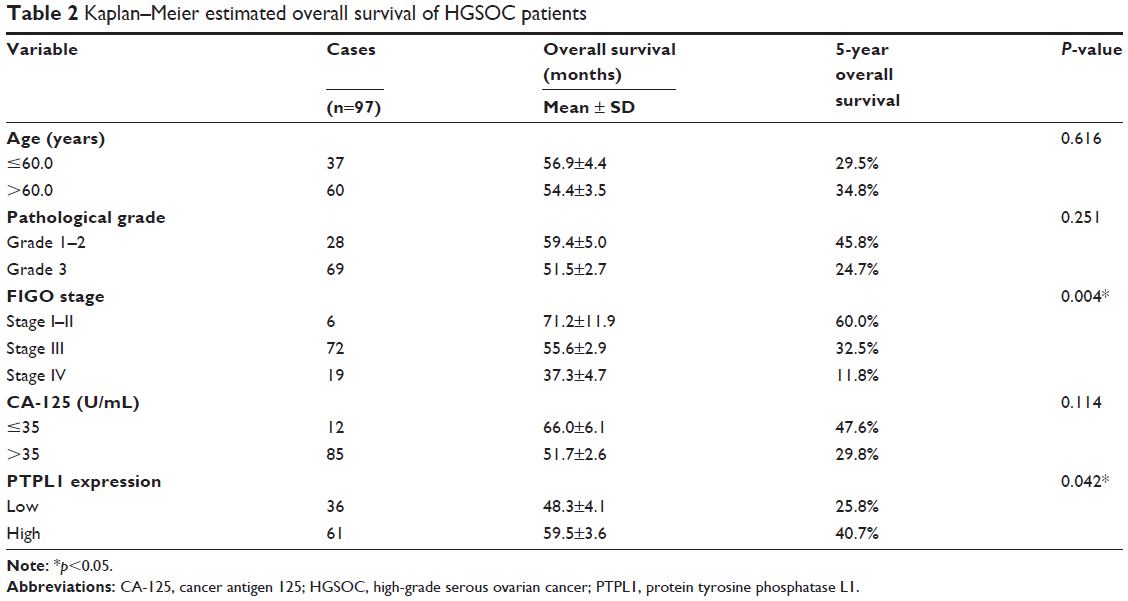 | Table 2 Kaplan–Meier estimated overall survival of HGSOC patients |
Cox proportional-hazard analysis was conducted to further evaluate the independent impact of prognostic factors (Table 3). Accordingly, advanced FIGO stages were statistically significant in predicting a poor clinical outcome (HR=2.380, 95% CI 1.253–4.522, P=0.008). Similarly, the PTPL1 was also found to be an independent prognostic biomarker (HR=0.621, 95% CI 0.351–0.844, P=0.039).
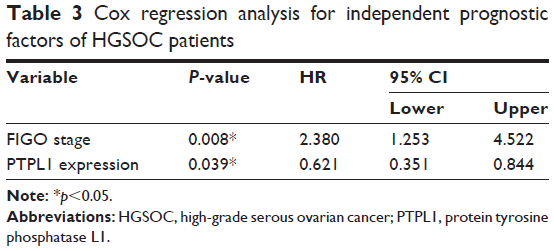 | Table 3 Cox regression analysis for independent prognostic factors of HGSOC patients |
PTPL1 inhibits proliferation and invasion of OV-90 cells
To determine the underlying mechanisms of PTPL1 in suppressing tumor progression, we obtained the normal FTEC and the primary serous ovarian cancer (POC) cells. Western blotting results showed a comparable level of PTPL1 protein expression between POC cells and OV-90 ovarian cancer cell line, both significantly lower than that in FTEC cells (Figure 3A). Therefore, we used the OV-90 cell line as the experimental model to explore the cellular effects of PTPL1 on HGSOC. The pCMV6-PTPL1 plasmids and PTPL1-siRNA were transfected into OV-90 cells, respectively. We then investigated the changes in cell proliferation and invasion capacities. MTT assay demonstrated that overexpressing PTPL1 significantly inhibited OV-90 cell growth, while siPTPL1 promoted cell proliferation (Figure 3B). Similarly, there was a significant decrease in cell invasion in PTPL1-overexpressing cells, whereby the invasion was enhanced in PTPL1-silencing cells compared with the scramble group (Figure 3C).
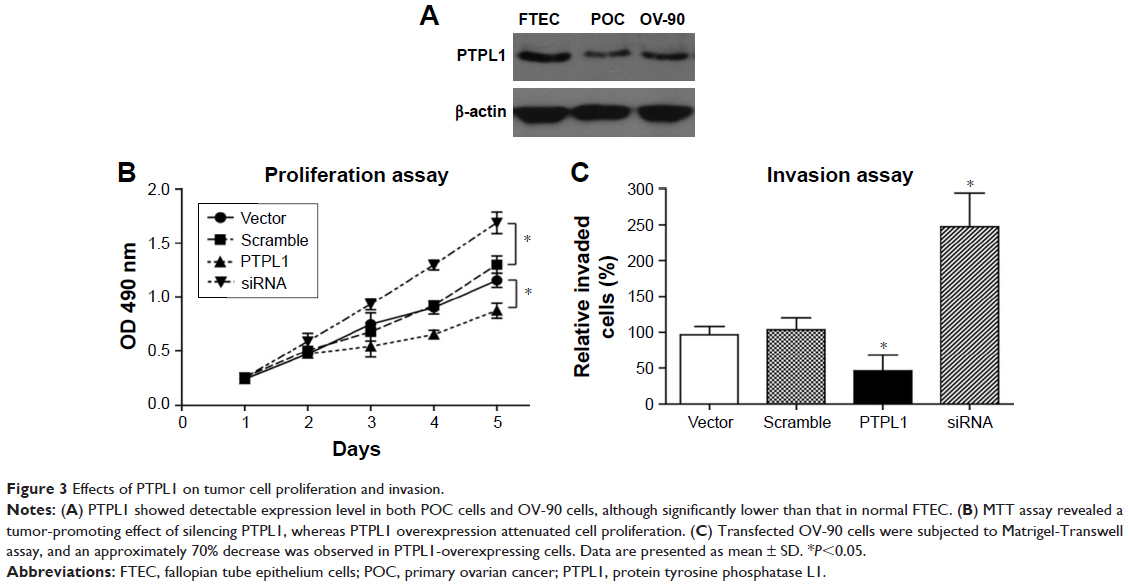 | Figure 3 Effects of PTPL1 on tumor cell proliferation and invasion. |
PTPL1 suppresses tumor progression by dephosphorylating IκBα
Since PTPL1 is a phosphatase, we hypothesized that it may function through dephosphorylating downstream proteins. IκBα is an important cellular protein in modulating the functions of transcription factor NF-κB (nuclear factor kappa-light-chain-enhancer of activated B cells). In normal conditions, IκBα interacts with NF-κB and prevents its nucleus translocation.23 Upon phosphorylation, IκBα is quickly degraded, the NF-κB is subsequently released and transports into the nucleus, inducing enhanced transcription.24 Interestingly, we found that the phosphorylation of IκBα on its tyrosine 42 site (IκBα-pY42) was significantly increased in accordance to tumor stages and showed negative statistical correlation with PTPL1 expression level (Figure 4A). Furthermore, in the cells transfected with PTPL1, the level of IκBα-pY42 was decreased. In contrast, upon silencing PTPL1 by siRNA, the phosphorylation of IκBα-Y42 was increased while the total IκBα was down-regulated (Figure 4B). The reduced total IκBα protein can be explained by the fact that IκBα phosphorylation will induce its ubiquitination and proteasome degradation.25 In addition, the nucleus level of NF-κB was negatively regulated by PTPL1, without significant NF-κB alteration in total lysates (Figure 4B). Consistently, caspase protein cleavage was also enhanced by silencing PTPL1, indicating its role in suppressing tumor cell viability.
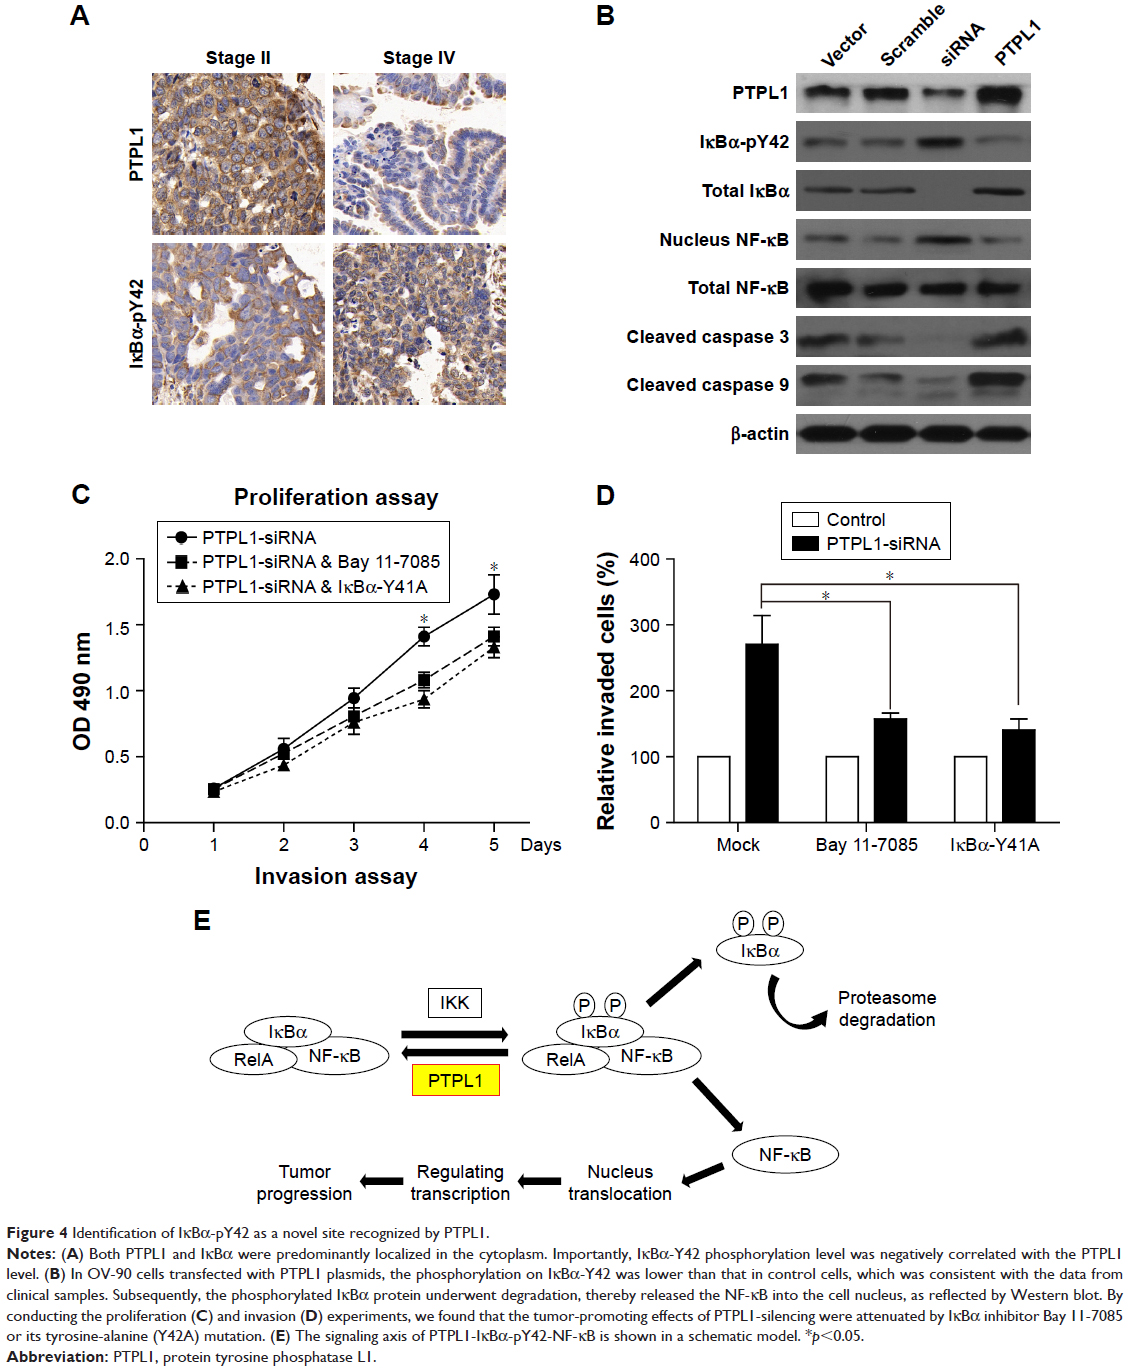 | Figure 4 Identification of IκBα-pY42 as a novel site recognized by PTPL1. |
Because IκBα-pY42 was obviously dephosphorylated by PTPL1, we then aimed to confirm whether PTPL1 suppressed tumor progression through the IκBα signaling pathway. We used a specific IκBα inhibitor, Bay 11-7085, to inhibit its phosphorylation. MTT and Transwell assays indicated that the tumor-promoting effects of PTPL1-siRNA were significantly attenuated by IκBα phosphorylation inhibitor (Figure 4C and D). In order to test the specific effects of Y42 site, we mutated the tyrosine into alanine (Y42A) and co-transfected IκBα-Y42A mutant with PTPL1-siRNA. Proliferation assay identified a comparable effect of Bay 11-7085 inhibitor with IκBα-Y42A overexpression (Figure 4C). Similarly, the cell invasion process was restrained by overexpressing IκBα-Y42A (Figure 4D). Taken together, we put forward the signaling axis of the PTPL1-IκBα-pY42-NF-κB pathway in HGSOC progression (Figure 4E).
Discussion
In the past decades, studies suggested that kinases and phosphatases are key players in regulating numerous cellular pathways. In this study, we focused on PTPL1, one of the non-receptor tyrosine phosphatases. Several groups have reported that abnormal expression of PTPL1 is involved in malignancies. However, it is still under debate whether PTPL1 is a tumor suppressor or a tumor promoter. Furthermore, PTPL1 showed tumor-suppressing functions in breast cancer and non-small-cell lung cancer.26,27 In contrast, PTPL1 can protect the pancreatic carcinoma cells from CD95-mediated apoptosis.28 PTPL1 was also reported to induce chemoresistance of head and neck cancers.29 To date, the roles of PTPL1 in the progression of ovarian cancer have not yet be fully elucidated.
Here, we found that PTPL1 showed distinct expression patterns in different high-grade serous ovarian cancer (HGSOC) patients. Clinical data suggested that a lower PTPL1 expression in HGSOC tissues was correlated with advanced tumor stage. We then identified PTPL1 as an unfavorable prognostic biomarker for overall survival of HGSOC patients by univariate and multivariate analyses. Interestingly, PTPL1 high expression was previously reported to induce Fas-resistance in ovarian cancer cell lines and maintain cell viability,12 which is a little different with our findings. However, their results were mainly obtained from cells treated with anti-Fas antibody, an inducer of cell apoptosis. Actually, whether an enzyme acts as an oncogenic molecular or tumor suppressor depends on its cellular localization and substrate targets. In the current study, we identified IκBα as a novel substrate targeted by PTPL1. By inhibitor treatment and site-directed mutagenesis, we confirmed that IκBα phosphorylation on tyrosine 42 was a chief contributor to be recognized by PTPL1. Cellular results also demonstrated that dephosphorylation of IκBα-pY42 by PTPL1 can enhance the sequestering of NF-κB, thus reduce the transcription of oncogenic factors.
Conclusion
Our results identified a prognostic role of PTPL1 in predicting the overall survival for surgical-treated HGSOC patients.
Disclosure
The authors report no conflicts of interest in this work.
References
Siegel RL, Miller KD, Jemal A. Cancer statistics, 2018. CA Cancer J Clin. 2018;68(1):7–30. | ||
Singh N, Mccluggage WG, Gilks CB. High-grade serous carcinoma of tubo-ovarian origin: recent developments. Histopathology. 2017;71(3):339–356. | ||
Przybycin CG, Kurman RJ, Ronnett BM, Shih I, Vang R. Are all pelvic (nonuterine) serous carcinomas of tubal origin? Am J Surg Pathol. 2010;34(10):1407–1416. | ||
Cohen JG, White M, Cruz A, Farias-Eisner R. In 2014, can we do better than CA125 in the early detection of ovarian cancer? World J Biol Chem. 2014;5(3):286–300. | ||
Vaughan S, Coward JI, Bast RC, et al. Rethinking ovarian cancer: recommendations for improving outcomes. Nat Rev Cancer. 2011;11(10):719–725. | ||
Coleman RL, Monk BJ, Sood AK, Herzog TJ. Latest research and treatment of advanced-stage epithelial ovarian cancer. Nat Rev Clin Oncol. 2013;10(4):211–224. | ||
Xiao K, Liu H. “Barcode” and Differential Effects of GPCR Phosphorylation by Different GRKs. G Protein-Coupled Receptor Kinases. 2016:75–120. | ||
Alonso A, Sasin J, Bottini N, et al. Protein tyrosine phosphatases in the human genome. Cell. 2004;117(6):699–711. | ||
Zhang J, Sapienza PJ, Ke H, et al. Crystallographic and nuclear magnetic resonance evaluation of the impact of peptide binding to the second PDZ domain of protein tyrosine phosphatase 1E. Biochemistry. 2010;49(43):9280–9291. | ||
Dromard M, Bompard G, Glondu-Lassis M, Puech C, Chalbos D, Freiss G. The putative tumor suppressor gene PTPN13/PTPL1 induces apoptosis through insulin receptor substrate-1 dephosphorylation. Cancer Res. 2007;67(14):6806–6813. | ||
Lee SH, Shin MS, Lee HS, et al. Expression of Fas and Fas-related molecules in human hepatocellular carcinoma. Hum Pathol. 2001;32(3):250–256. | ||
Meinhold-Heerlein I, Stenner-Liewen F, Liewen H, et al. Expression and potential role of Fas-associated phosphatase-1 in ovarian cancer. Am J Pathol. 2001;158(4):1335–1344. | ||
Committee FC. Staging announcement: FIGO Cancer Committee. Gynecol Oncol. 1986;25:383–385. | ||
Mishima K, Nariai Y, Yoshimura Y. Etodolac, a selective cyclo-oxygenase-2 inhibitor, enhances carboplatin-induced apoptosis of human tongue carcinoma cells by down-regulation of FAP-1 expression. Oral Oncol. 2005;41(1):77–81. | ||
Liu H, Zhang Q, Li K, et al. Prognostic significance of USP33 in advanced colorectal cancer patients: new insights into β-arrestin-dependent ERK signaling. Oncotarget. 2016;7(49):81223–81240. | ||
Livak KJ, Schmittgen TD. Analysis of relative gene expression data using real-time quantitative PCR and the 2(-Delta Delta C(T)) Method. Methods. 2001;25(4):402–408. | ||
Birnie GD. Subnuclear Components: Preparation and Fractionation. London: Elsevier; 2016. | ||
Sorbi F, Projetto E, Turrini I, et al. Luteinizing Hormone/Human Chorionic Gonadotropin Receptor Immunohistochemical Score Associated with Poor Prognosis in Endometrial Cancer Patients. Biomed Res Int. 2018;2018:1–6. | ||
Wang J, Yao Y, Ming Y, et al. Downregulation of stathmin 1 in human gallbladder carcinoma inhibits tumor growth in vitro and in vivo. Sci Rep. 2016;6:28833. | ||
Zhang S, Balch C, Chan MW, et al. Identification and characterization of ovarian cancer-initiating cells from primary human tumors. Cancer Res. 2008;68(11):4311–4320. | ||
Tan W, Pan M, Liu H, Tian H, Ye Q, Liu H. Ergosterol peroxide inhibits ovarian cancer cell growth through multiple pathways. Onco Targets Ther. 2017;10:3467–3474. | ||
Hou S, Du P, Wang P, Wang C, Liu P, Liu H. Significance of MNK1 in prognostic prediction and chemotherapy development of epithelial ovarian cancer. Clin Transl Oncol. 2017;19(9):1107–1116. | ||
Baldwin AS. The NF-kappa B and I kappa B proteins: new discoveries and insights. Annu Rev Immunol. 1996;14(1):649–681. | ||
Viatour P, Merville MP, Bours V, Chariot A. Phosphorylation of NF-kappaB and IkappaB proteins: implications in cancer and inflammation. Trends Biochem Sci. 2005;30(1):43–52. | ||
Karin M, Ben-Neriah Y. Phosphorylation meets ubiquitination: the control of NF-[kappa]B activity. Annu Rev Immunol. 2000;18(1):621–663. | ||
Révillion F, Puech C, Rabenoelina F, Chalbos D, Peyrat JP, Freiss G. Expression of the putative tumor suppressor gene PTPN13/PTPL1 is an independent prognostic marker for overall survival in breast cancer. Int J Cancer. 2009;124(3):638–643. | ||
Scrima M, de Marco C, de Vita F, et al. The nonreceptor-type tyrosine phosphatase PTPN13 is a tumor suppressor gene in non-small cell lung cancer. Am J Pathol. 2012;180(3):1202–1214. | ||
Ungefroren H, Kruse M-L, Trauzold A, et al. FAP-1 in pancreatic cancer cells: functional and mechanistic studies on its inhibitory role in CD95-mediated apoptosis. J Cell Sci. 2001;114(15):2735–2746. | ||
Wieckowski E, Atarashi Y, Stanson J, Sato TA, Whiteside TL. FAP-1-mediated activation of NF-kappaB induces resistance of head and neck cancer to Fas-induced apoptosis. J Cell Biochem. 2007;100(1):16–28. |
 © 2018 The Author(s). This work is published and licensed by Dove Medical Press Limited. The full terms of this license are available at https://www.dovepress.com/terms.php and incorporate the Creative Commons Attribution - Non Commercial (unported, v3.0) License.
By accessing the work you hereby accept the Terms. Non-commercial uses of the work are permitted without any further permission from Dove Medical Press Limited, provided the work is properly attributed. For permission for commercial use of this work, please see paragraphs 4.2 and 5 of our Terms.
© 2018 The Author(s). This work is published and licensed by Dove Medical Press Limited. The full terms of this license are available at https://www.dovepress.com/terms.php and incorporate the Creative Commons Attribution - Non Commercial (unported, v3.0) License.
By accessing the work you hereby accept the Terms. Non-commercial uses of the work are permitted without any further permission from Dove Medical Press Limited, provided the work is properly attributed. For permission for commercial use of this work, please see paragraphs 4.2 and 5 of our Terms.