")
Back to Journals » Diabetes, Metabolic Syndrome and Obesity » Volume 12
Protective Effects Of Astragalus Polysaccharides On Oxidative Stress In High Glucose-Induced Or SOD2-Silenced H9C2 Cells Based On PCR Array Analysis
Authors Sun Q, Wu X, Wang H, Chen W, Zhao X, Yang Y, Chen W
Received 23 August 2019
Accepted for publication 27 September 2019
Published 25 October 2019 Volume 2019:12 Pages 2209—2220
DOI https://doi.org/10.2147/DMSO.S228351
Checked for plagiarism Yes
Review by Single anonymous peer review
Peer reviewer comments 2
Editor who approved publication: Prof. Dr. Juei-Tang Cheng
Qilin Sun,1,* Xiaoyan Wu,1,* Hao Wang,2 Wenjie Chen,1 Xuelan Zhao,1 Yehong Yang,3 Wei Chen1,*
1Department of Geriatrics, Huashan Hospital, Fudan University, Shanghai 200040, People’s Republic of China; 2Experimental Teaching Center of Basic Medicine, Fudan University, Shanghai 200032, People’s Republic of China; 3Department of Endocrinology, Huashan Hospital, Fudan University, Shanghai 200040, People’s Republic of China
*These authors contributed equally to this work
Correspondence: Wei Chen
Department of Geriatrics, Huashan Hospital, Fudan University, No.12 Wu-lu-mu-qi Road, Shanghai 200040, People’s Republic of China
Tel +86 21 5288999
ext 7190 Email [email protected]
Yehong Yang
Department of Endocrinology, Huashan Hospital, Fudan University, No.12 Wu-lu-mu-qi Road, Shanghai 200040, People’s Republic of China
Tel +86 21 5288999
Email [email protected]
Background: Oxidative stress in cardiac myocytes is an important pathogenesis of diabetic cardiomyopathy (DCM). Previously, we reported that astragalus polysaccharide (APS) has protective effects against the oxidative stress of DCM. This study aimed to determine the effect of APS on the oxidative stress induced by hyperglycemia in H9C2 cells.
Methods: Rat H9C2 cells were cultured in vitro and randomly divided into the control group, HG group, APS-HG group, siRNASOD2 group, and APS-siRNASOD2 group. The cellular ultrastructure was measured by transmission electron microscopy. Cell apoptosis was examined by TUNEL staining. Levels of reactive oxygen species (ROS) were detected by a quantitative fluorescence assay (DHE). 8-OH-dG and nitrotyrosine, the indicators of oxidative stress injury, were detected by immunohistochemistry. A PCR array was used to evaluate the expression levels of 84 oxidative stress genes in cultured cells, and the PCR array results were partially verified by Western blot.
Results: APS treatment protected the H9C2 cell ultrastructure, reduced the level of cell apoptosis, inhibited cellular ROS production, and reduced the levels of oxidative stress injury indicators 8-OH-dG and nitrotyrosine in high glucose-induced or SOD2-silenced H9C2 cells. It also altered oxidative stress-related genes at the mRNA and protein levels.
Conclusion: APS may improve antioxidant capacity and inhibit oxidative stress injury in high glucose induced H9C2 cells.
Keywords: diabetic cardiomyopathy, cardiomyocyte, oxidative stress, ROS, PCR array, astragalus polysaccharide
Introduction
Diabetic cardiomyopathy (DCM) is irrelevant to coronary heart disease or any other known heart disease but is a characteristic cardiomyopathy that is independent of cardiovascular risk factors. It is widely known as one of the most common complications of diabetes mellitus.1 Though the mechanism of DCM is complicated, current studies suggest that oxidative stress injury in cardiac myocytes, which is induced by sustained hyperglycemia, is an important pathogenesis of DCM.2 Intracellular reactive oxygen species (ROS) are by-products of regular cellular metabolism in the mitochondria and in the cytoplasm through nicotinamide adenine dinucleotide phosphate (NADPH) oxidase and xanthine oxidase (XO) activities. Although ROS function plays an important role in the cell signaling process, excess ROS can harm cellular lipids, proteins, and especially DNA.3,4 When total ROS formation, including both physiological and pathological formation, overwhelm the protective ability of the antioxidant system, oxidative stress onsets. Classic oxidative stress reflects an imbalance between the formation of ROS, including O2−, H2O2, ·OH, and the system to detoxify ROS, such as superoxide dismutases (SODs), catalase (CAT), glutathione peroxidase (GPX) and peroxiredoxins (PRDXs). Such disturbances can cause irreversible injury in cells, which eventually leads to apoptosis.5,6 To evaluate the core components involved in the system balance of oxidative stress, we measured gene expression in both oxidant and antioxidant enzymes. Specifically, we tested the gene expression levels of oxidants such as NADPH oxidase and antioxidants such as SOD2, GPX, and PRDXs. Our results suggest that oxidative stress may be caused by the excessive production of ROS in cardiomyocytes and the downregulation of the ROS elimination pathway. This finding could provide important guidance for future treatment to reduce oxidative damage of myocardium caused by diabetes.
Astragalus polysaccharides (APS) are polysaccharides from Astragalus propinquus isolated by extraction, separation and purification. APS is an effective chemical component of Astragalus propinquus, which has proven effective in treating diabetes in traditional Chinese medicine.7–9 Our previous studies confirmed that APS treatment can improve the cardiac function of diabetic mice, reduce the oxidative stress damage of myocardial cells, and protect myocardial tissue.10–13 In the present study, we built a diabetes model using H9C2 cells induced by high glucose and constructed an oxidative stress model of SOD2-silenced H9C2 cells to further investigate the protective effect of APS on high glucose-induced oxidative stress injury.
Materials And Methods
Materials And Reagents
APS was bought from Shanghai Institutes for Biological Sciences, Chinese Academy of Sciences, as an injectable powder with a purity of 97% and a molecular weight of 10,000–40,000 Da.14 There are three subtypes of APS. Subtype 1 is a heterosaccharide composed of d-glucose, d-galactose, and l-arabinose with an average molecular weight of 36,300 Da and molar ratios of 1.75:1.63:1. Subtypes 2 and 3 are composed of high-molecular-weight dextran with average molecular weights of 12,300 and 34,600 Da, respectively, bonded with α-(1,4)-D-glycosidic linkages. The concentration of APS for injection is 100 μg/mL, which was decided by our previous studies.11
Embryonic rat heart derived H9C2 cells were bought from American Type Culture Collection (Manassas, VA, USA). Complete DMEM culture medium was supplemented with 10% fetal bovine serum (HyClone, Logan, UT, USA), 100 U/mL penicillin (Ameresco, Solon, OH, USA), and 100 mg/L streptomycin (Amresco, Solon, OH, USA). Cell culture dishes were bought from Corning (NY, USA) and were put in a 37 °C constant-temperature incubator with 5% CO2. The bath solution was replaced every 4 hrs, and cells were passaged every 72 hrs. Cells at the logarithmic growth stage were used for the experiment.
The cultured cells were randomly divided into 5 groups, and each group was combined with 6 compound pores. These cells were grouped as follows: 1. Normal control group (Ctrl): cells were cultured at the normal concentration (5 mM) of glucose, transfected with scrambled siRNA (20 pM/μL), and treated with normal saline. 2. High glucose-induced group (HG): cells were cultured in the high concentration of glucose (30 mM), transfected with scrambled siRNA (20 pM/μL), and treated with normal saline. 3. High glucose-induced group with APS treatment (APS-HG): cells were cultured in the high concentration of glucose (30 mM), transfected with scrambled siRNA (20 pM/μL), and treated with APS (100 μg/mL). 4. SOD2 interference group (siRNASOD2): cells were cultured in the normal concentration of glucose (5 mM), transfected with siRNASOD2 (20 pM/μL) and treated with normal saline. 5. APS-SOD2 interference group (APS-siRNASOD2): cells were cultured in the normal concentration (5 mM) glucose, transfected with siRNA-SOD2 (20 pM/μL), and treated with APS (100 μg/mL).
Observation Of Cell Ultrastructure
After the collection of cultured cells, these cells were washed twice using PBS and then incubated in diluted Karnovsky’s fixative for 2 hrs. These cells were fixed in 2.5% glutaraldehyde, embedded in paraffin after dehydration, and double-stained with 3% uranyl acetate and lead citrate. We eventually observed the ultrastructure of cardiomyocytes on a Philips Morgagni electron microscope (Philips, Amsterdam, Netherlands). The experiments were performed in triplicate and repeated four times.
Assessments Of Cell Apoptosis
Cells were fixed in 4% paraformaldehyde in PBS at 4 °C for 10 mins and then washed in PBS 3 times. We added 10% donkey serum (0.3% Triton dilution) as a blocking reagent and washed 3 times again. We added prepared TUNEL assay reagent without light, then put the cells in a 37 °C water bath for 1 hr and washed them in PBS. After that, cells were stained with DAPI for 5 mins and then observed under fluorescence microscopes. Six high-power-lens fields were selected randomly in each image, and the apoptotic index (AI), which equals the quotient of TUNEL-positive cells over total cells, was calculated for each field.
Evaluation Of The Formation Of ROS
To determine intracellular ROS levels with high-glucose induction or silencing of SOD2, cells were seeded in 6-well plates (1 x 10⁵ cells/well). After treatment as described above, dihydroethidium (DHE) fluorescent probes (Thermo Fisher Scientific) were loaded, and cells were incubated for 0.5 h at 37 °C with 5 μM/L DHE. The mean fluorescence intensity of DHE in nuclei was measured by dividing the combined fluorescence value of the pixels by the total number of pixels in 15 randomly selected fields and using a Bio-Rad Radiance 2100MP multiphoton microscope and Image-Pro analysis software (Molecular Probes). The experiments were performed in triplicate and repeated four times.
Evaluation Of Oxidative Damage
Oxidative damage in H9C2 cells was determined by immunohistochemistry as follows. Cultured cells were fixed with 4% paraformaldehyde, and oxidative stress injury of DNA was determined with the 8-OH-dG monoclonal antibody (QED Bioscience, San Diego, CA, USA). Oxidative stress injury of protein was detected with the nitrotyrosine monoclonal antibody (Upstate Biotechnology, Charlottesville, VA, USA). A Bio-Rad Radiance 2100 MP multiphoton microscope and Image-Pro analyzer were applied for measurements in this experiment. The experiments were performed in triplicate and repeated four times.
PCR Array Analysis Of Oxidative Stress
RNA isolation and cDNA synthesis. The total RNA from the H9C2 cells was extracted and purified using the RNeasy Mini Kit (Qiagen, Valencia, CA, USA) and converted to cDNA using the RT2 First Strand Kit (Qiagen, Valencia, CA, USA). The quantity and quality of the RNA extracts were quantified using a NanoDrop® ND-1000 Spectrophotometer (Thermo Scientific Inc, Waltham, MA) at 260/280 nm ratios. Only high-quality RNA with 260/280 nm ratios of 1.8 to 2.0 and concentrations greater than 40 µg/mL were used for PCR analysis.
Real-Time PCR
Rat RT2 Profiler™ PCR Array (Cat. No: PARN-065Z, SABiosciences—Qiagen, Valencia, CA, USA) profiling the expression of 84 genes related to oxidative stress, ROS metabolism and related oxygen transporter genes was used for analysis of oxidative stress specific transcripts following the manufacturer’s guidelines. Each array contained primers for 84 pathway-related genes and five housekeeping genes, and 7 wells included reverse-transcription controls, positive PCR controls, and a genomic DNA contamination control. Briefly, 1248 μL nuclease-free water (AM9937, Ambion, USA), 1350 μL SYBR green (ABI) and 102 μL cDNA were mixed in a solution. A total of 25 μL was added to each well of the 96-well array plate from this solution. This plate was briefly spun for 20 s at 1400 rpm. Amplification conditions were set at 95 °C for 10 mins for activation of HotStart DNA Taq polymerase. Then 40 cycles were performed at 95 °C for 15 s and 60 °C (annealing) for 1 min. The Applied Biosystems StepOnePlus was used for RT-PCR.
Data Analysis
Data analysis was done based on the 2−ΔΔCt values. Fold change values for each gene were tabulated and further analyzed using Qiagen’s web-based PCR Array data analysis software (http://pcrdataanalysis.sabiosciences.com/pcr/arrayanalysis.php). This tool provided a quality check step followed by normalization of data with housekeeping genes (Actb, B2m, Hprt1, Ldha and Rplp1) and then determination of statistically significant up- or downregulated genes (fold change values greater than 2 or less than 0.5). Only Ct values <35 were included in the calculations.
Western Blot Analyses
To validate the results of the gene arrays, Western blot analysis was used to further detect the significant differentially expressed genes related to ROS production or elimination in each cell group after initial screening using an oxidative stress array. The cells were collected and lysed, homogenized, and centrifuged in the lysate buffer using the standard technique. Protein concentrations were measured using a BCA protein concentration kit (Bio-Rad Laboratories Inc., Hercules, CA, USA), and 20 µL samples were prepared for SDS-PAGE electrophoresis. Separated proteins were electrotransferred to polyvinylidene difluoride (PVDF) membranes (Amersham-Pharmacia, Little Chalfont, UK), which were sealed with 5% skim milk at room temperature for 1 h, and then the relevant rabbit anti-rat primary antibody was added and incubated overnight at 4 °C. After 3 TBTS washes of the membrane, the corresponding HRP-coupled goat anti-rabbit IgG secondary antibody was added, and the membranes were incubated at room temperature for 1 h. After the secondary antibody was washed, ECL color was developed and imaged in a gel automatic imaging analysis system. Glyceraldehyde 3-phosphate dehydrogenase (GAPDH) was used as a loading control. ImageJ analysis software was used to conduct semiquantitative analysis of the gray value of protein expression level in each group.
Statistical Analyses
GraphPad Prism 7 was used to draw graphs and conduct statistical analysis. The results are presented as mean value ± standard error of the mean (SEM). An unpaired Student’s t-test was used for pairwise comparisons between groups, and one-way ANOVA was used for mean comparisons between multiple groups. A P-value < 0.05 was considered statistically significant.
Results
APS Protects H9C2 Cell Ultrastructure
It was found that sarcomeres, tubules and mitochondria were disrupted, and mitochondria were varied in size and shape, with structural integrity were destroyed and lost, and little or no mitochondrial crest in the HG group and the siRNASOD2 group. However, in the APS-HG group and APS-siRNASOD2 group, it showed that sarcomas, tubule and mitochondrial were almost the same as those in the normal control group, mitochondria were arranged with intact membrane and crests, indicating that APS can protected H9C2 cells ultrastructure (Figure 1).
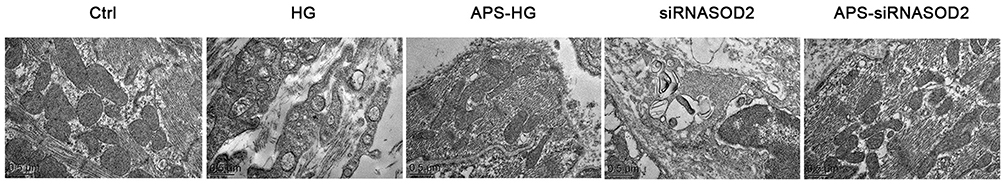 |
Figure 1 APS protected H9C2 cells ultrastructure. Ultrastructure of cultured cells was observed by a transmission electron microscope (×23,300 magnification). H9C2 cells cultured in the high or normal concentration of glucose were transfected with siRNASOD2 or disrupted siRNA and were further cultured in the presence of APS or normal saline. Disrupted sarcomeres, tubes and mitochondrial cristae were found in the HG group and the siRNASOD2 group, while TEM characteristics of the APS-treated H9C2 cells showed that sarcomas, tubule and mitochondrial crest were almost the same as those in the normal control group. APS, Astragalus polysaccharides; Ctrl, normal control group; HG, high glucose-induced group; APS-HG, APS-treated high glucose-induced group; siRNASOD2, SOD2 interference group; APS-siRNASOD2, APS-treated SOD2 interference group. |
APS Inhibits H9C2 Cell Apoptosis
To determine whether APS has a protective effect on H9C2 cells with hyperglycemia induction or silencing of the SOD2 gene, a TUNEL assay was applied to cultured cells in each group. Compared with the control group, the percentage of apoptotic cardiomyocytes in the HG group and siRNASOD2 group increased significantly, and these differences were shown in statistical analyses (P < 0.05). Compared with the HG group, the percentage of apoptotic cardiomyocytes in the APS-HG group was decreased (P<0.05). Compared with the siRNASOD2 group, the percentage of apoptotic cardiomyocytes in the APS-siRNASOD2 group was decreased (P<0.05). These results suggested that APS had a significant inhibitory effect on H9C2 cell apoptosis and significantly reduced apoptosis of cardiomyocytes (Figure 2).
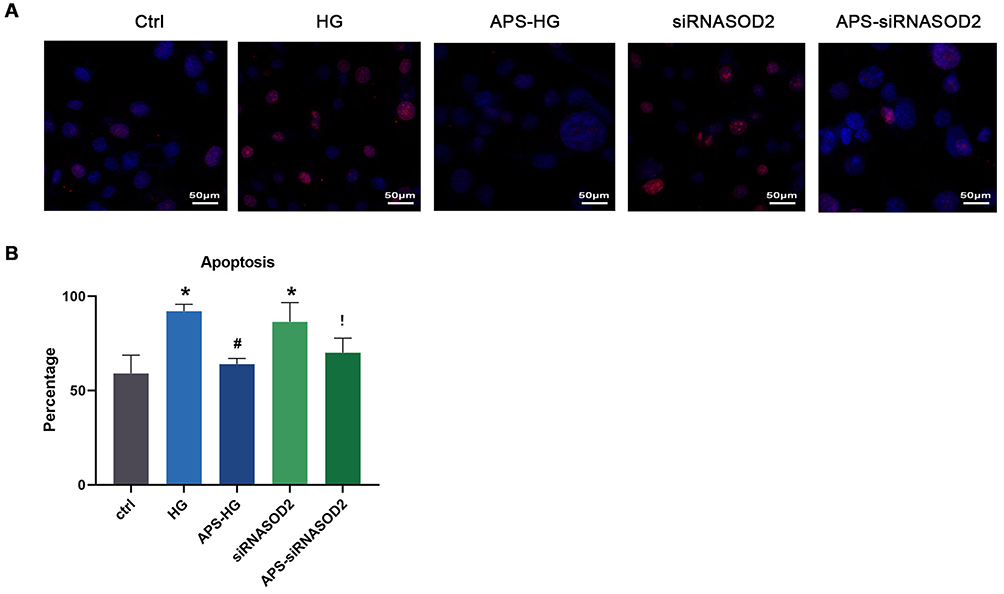 |
Figure 2 APS inhibited H9C2 cells apoptosis. (A) TUNEL assay microphotographs showing the apoptosis (red) cells (×400 magnification). (B) Bar graph showing the percentage of apoptosis cells in cultured cells by the TUNEL assay. Values are presented as mean ± SEM. The two-group analysis was performed using the independent samples t-test between HG and ctrl, siRNASOD2 and ctrl, APS-HG and HG, APS-siRNASOD2 and siRNASOD2. *P<0.05 vs ctrl, #P<0.05 vs HG, and !P<0.05 vs siRNASOD2, corresponding to all the repetitions in the study. |
APS Reduces ROS Formation In H9C2 Cells
The results showed that the ROS levels were significantly increased in the HG group compared with the control group (P<0.05). However, after APS treatment, the level of ROS induced by high glucose in the HG group was significantly inhibited, showing obscure fluorescence intensity (P<0.05). These results indicated the inhibitory effect of APS on high glucose-induced ROS formation in H9C2 cells. In addition, the ROS levels in the siRNASOD2 group were significantly increased compared with the control group, whereas the level of ROS induced by interference with the expression of SOD2 was significantly inhibited by APS treatment, showing obscure fluorescence intensity (P<0.05), which suggested that APS can inhibit ROS formation in SOD2-knockdown H9C2 cells (Figure 3A and D).
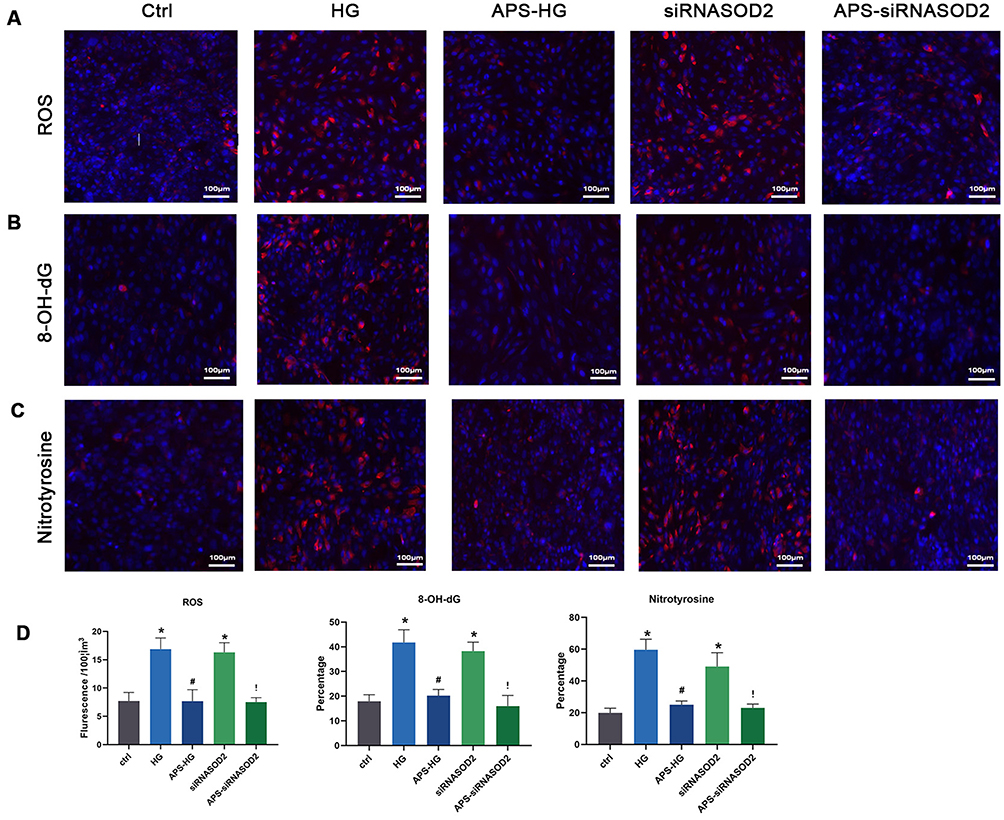 |
Figure 3 APS reduced ROS formation and oxidative damage in H9C2 cells. (A) ROS formation in Fluorescence microphotographs showing DHE-stained positive (red) cells. (B) Fluorescence microphotographs showing 8-OH-dG-stained positive (red) cells. (C) Fluorescence microphotographs showing nitrotyrosine-stained positive (red) cells. (×200 magnification). (D) Bar graph showing the ROS formation and the intensity of 8-OH-dG and nitrotyrosine signals in cultured H9C2 cells. Values are presented as mean ± SEM. The two-group analysis was performed using the independent samples t-test between HG and ctrl, siRNASOD2 and ctrl, APS-HG and HG, APS-siRNASOD2 and siRNASOD2. *P<0.05 vs ctrl, #P<0.05 vs HG, and !P<0.05 vs siRNASOD2, corresponding to all the repetitions in the study. |
APS Prevents H9C2 Cell Oxidative Damage
To evaluate the ROS-mediated oxidative damage in the HG group and siRNASOD2 group, 8-OH-dG antibodies and nitrotyrosine antibodies were applied to detect oxidative damage in intracellular DNA and proteins separately. The results matched the hypothesis and showed that the percentages of both 8-OH-dG-labeled cells and nitrotyrosine-labeled cells were significantly increased in the HG group compared with the control group. This phenomenon was significantly reversed by APS treatment. Moreover, those labeled cells in the SOD2-knockdown group were also significantly increased in the HG group compared with the control group and were reversed similarly with APS treatment. These results suggested an inhibitory effect of APS on high glucose-induced and SOD2 knockdown-induced oxidative damage to DNA and proteins in H9C2 cells (Figure 3B–D).
APS Regulates The Expression Levels Of Oxidative Stress Genes
To detect whether gene expression defects were involved in the ROS metabolism or antioxidant defense mechanisms in the HG and siRNASOD2 groups resulting in the overproduction of ROS, and to explore the protective effect of APS on oxidative stress, oxidative stress and antioxidant defense PCR arrays were used for analysis (Figure 4E and Table S1). The genes that changed significantly after APS treatment are presented in Figure 4A–D. Our results showed that compared with the control group, for the expression profile of genes regulating antioxidants, HG-induced or SOD2-knockdown H9C2 cells had a significant increase in the expression of genes encoding SOD2, GPX1, CAT, PRDX3 and other antioxidases, such as GSR, TXN1, and TXNRD2. APS reduced these HG- or siRNASOD2-induced increases in SOD2 and other antioxidases to normal levels. There were no significant changes in the expression of SOD1. In terms of regulating the expression of ROS production genes, H9C2 cells with HG induction or SOD2 knockdown had significantly higher expression of CYBA, NCF1, NCF2, NOX4, UCP2 and UCP3 compared with the control group. APS significantly reduced the expression levels of CYBA, NCF1, and NCF2 but further promoted the expression of UCP2 and UCP3. HG induction or SOD2 knockdown caused a significant increase in the gene expression of TXNIP, while its expression was significantly reduced in APS-treated H9C2 cells.
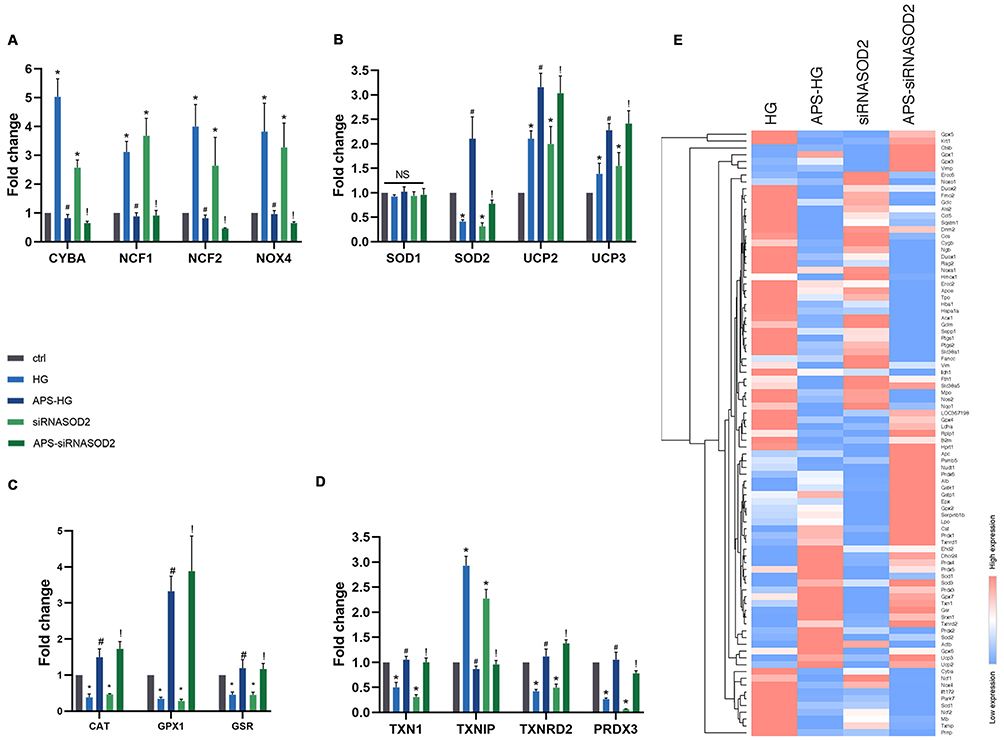 |
Figure 4 APS regulates the expression level of related oxidative stress genes in H9C2 cells. (A–D) Genes that changed significantly after APS treatment were analyzed and presented in the bar graph. (E) The expressions of 84 oxidative stress-related genes in HG, APS-HG, siRNASOD2, and APS-siRNASOD2 groups were detected by oxidative stress PCR arrays. Values of heat map indicate the ratio of expression of experimental group to that of control group. Clustering was performed using Euclidean distance and the up-regulated (red) or down-regulated (blue) redox stress-specific transcripts in each group were compared. Values are presented as mean ± SEM. The two-group analysis was performed using the independent samples t-test between HG and ctrl, siRNASOD2 and ctrl, APS-HG and HG, APS-siRNASOD2 and siRNASOD2. *P<0.05 vs ctrl, #P<0.05 vs HG, and !P<0.05 vs siRNASOD2, corresponding to all the repetitions in the study. |
APS Regulates The Protein Expression Levels Of Oxidative Stress-Related Genes In H9C2 Cells
Western blot analysis was used to further detect the protein expression levels of some significantly differentially expressed genes related to ROS production or elimination in each cell group. The protein expression levels of CYBA, NCF1, NOX4, TXNIP, SOD2, GSR, PRDX3, TXNRD2 and TXN1 are shown in Figure 5. Compared with the control group, the protein expression levels of SOD2, GSR, PRDX3, TXNRD2, and TXN1 were downregulated in the HG group and the siRNASOD2 group (P<0.05). The protein expression levels of CYBA, NCF1, NOX4, TXNIP were upregulated in the HG group and the siRNASOD2 group (P<0.05). Compared with the HG group, the protein expression levels of SOD2, GSR, PRDX3, TXNRD2 and TXN1 were upregulated in the APS-HG group (P<0.05), while the protein expression levels of CYBA, NCF1, NOX4 and TXNIP were downregulated in the APS-HG group (P<0.05). Compared with the siRNASOD2 group, the protein expression levels of SOD2, GSR, PRDX3, TXNRD2 and TXN1 were upregulated in the APS-siRNASOD2 group (P<0.05), and the protein expression levels of CYBA, NCF1, NOX4 and TXNIP were downregulated in the siRNASOD2 group (P<0.05).
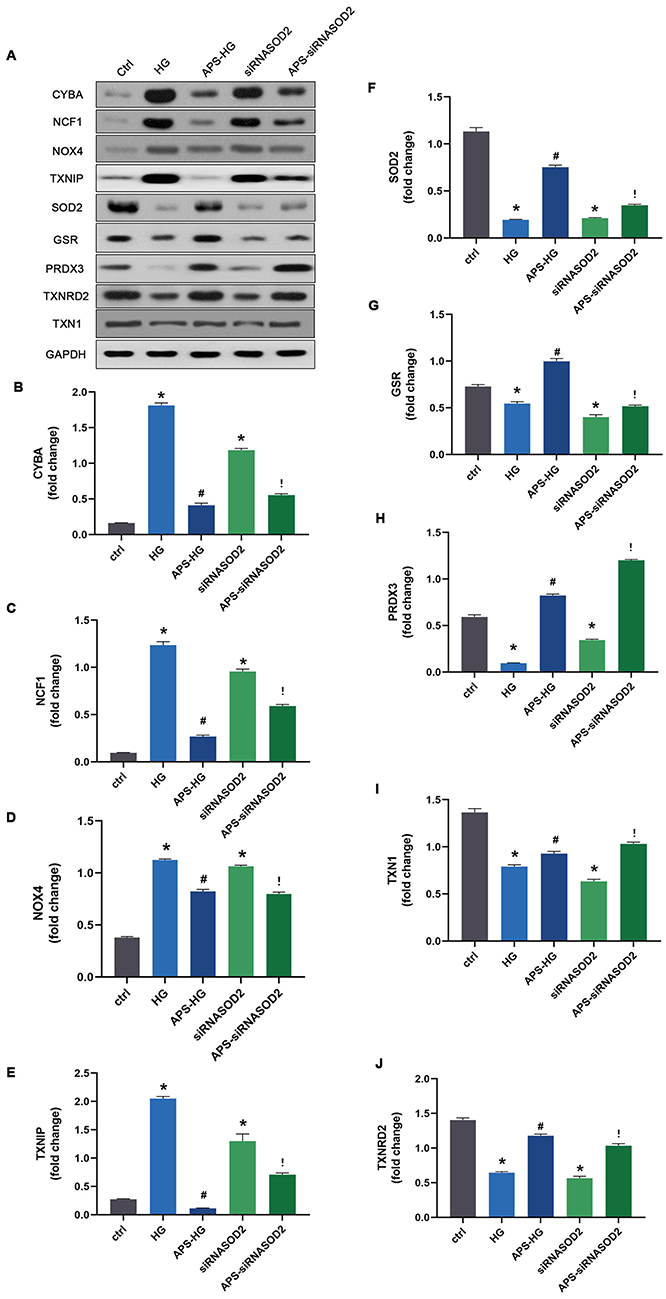 |
Figure 5 APS regulates the protein expression levels of oxidative stress-related genes in H9C2 cells. (A) Representative Western blot images. (B–J) Bar graphs showing the protein expression levels of CYBA, NCF1, NOX4, TXNIP, SOD2, GSR, PRDX3, TXNRD2 and TXN1 in cultured cells with or without APS treatment. Values are presented as mean ± SEM. The two-group analysis was performed using the independent samples t-test between HG and ctrl, siRNASOD2 and ctrl, APS-HG and HG, APS-siRNASOD2 and siRNASOD2. *P<0.05 vs ctrl, #P<0.05 vs HG, and !P<0.05 vs siRNASOD2, corresponding to all the repetitions in the study. |
The differences in protein levels were consistent with the overall trends in the oxidative stress array results, indicating that the results of gene arrays were true and reliable and could correctly reflect the gene expression level of each group. The results suggested that APS can reduce the oxidative stress injury of DCM by reducing the formation of ROS and increasing the antioxidant capacity.
Discussion
Diabetes has become one of the three major chronic diseases affecting human health. In China and even the whole world, the incidence of DM is increasing annually, with high mortality. With the aging of society, DCM is one of the main complications of DM and threatens the quality of life of diabetic patients. It is regarded as one of the main causes of end-stage death in diabetic patients.1 However, there are currently no effective treatments or preventions for DCM in patients with diabetes. Therefore, finding novel treatments for DCM has become a popular research topic.
Astragalus propinquus is applied to patients with deficiency of “Qi” in the context of traditional Chinese medicine. This special disease matches some symptoms in diabetes, which inspired researchers to identify the effective chemical component of this plant: APS. H9C2 cells are derived from embryonic rat cardiac muscle cell lines. Thus, H9C2 cells are appropriate experimental materials for our research because they are similar to ordinary rats’ myocardial cells and have good capacity for cell division.15
The pathophysiological mechanism of DCM is complicated and is highly relevant to the oxidative stress injury induced by sustained hyperglycemia, according to current studies.16,17 The oxidative stress imbalance includes abnormal expression of oxidant/antioxidant enzymes and excessive activation of the oxidative stress signaling system, and one of the most important implications is increased ROS production and/or impaired antioxidant defenses in the heart.17 The balance between ROS production and ROS elimination plays a key role in maintaining cardiac function. When oxidative stress occurs, ROS production is excessive, and antioxidant capacity is relatively insufficient. Excessive myocardial ROS will cause damage to cell structure and function, impair myocardial function and heart structure, and eventually lead to DCM.
The NADPH oxidase complex and mitochondrial electron transport chain enzyme complex are the principal ROS generating complexes in cardiac myocytes.18 The NADPH oxidase of cardiomyocytes is an enzyme complex composed of the membrane subunits p91phox and p22phox(CYBA) and the cytoplasmic subunits p47phox (NCF1), p67phox (NCF2), p40phox, and small molecule GTPase-binding protein Rac. Increased expression of the subunits of NADPH oxidase or increased transfer from the cytoplasm to the membrane can lead to increased NAPDH oxidase activity and to increased NADPH-derived ROS, which play an important role in DCM.19 The mitochondria also contribute greatly to ROS formation. Uncoupling Proteins 2 and 3 (UCP2/3), which is considered to protect against oxidative stress, exists in the mitochondrial membrane. UCP2/3 can be expressed in normal myocardial tissue and can be overexpressed in pathological heart tissue. Many studies of diabetes and DCM have claimed that the uncoupling effect of UCP2/3 can protect cells by reducing the production of ROS, inhibiting the death of mitochondria induced by oxidative stress, and decreasing the cell damage.4
The antioxidant system is one of the most important systems in our body, and it is widely acknowledged as a scavenger that can eliminate ROS. It can be divided into 2 categories: enzyme and nonenzyme scavengers. Enzyme scavengers are generally antioxidant enzymes, mainly SODs, CAT and substrate-specific peroxidases, including GPX and PRDXs. Nonenzymatic scavengers include reduced glutathione, thioredoxin, antioxidant vitamins and so on.5 According to their distribution in vivo, SODs are divided into three subtypes, cytoplasmic SOD (SOD1), mitochondrial SOD (SOD2) and extracellular SOD (SOD3).20 SOD can catalyze O2− to produce H2O2, which is known as the first line of defense of the antioxidant system of the organism. Its content can reflect changes in ROS in the body and the ability of the body to resist free radical damage. CAT, GPX and PRDXs can catalyze the transformation of H2O2 into H2O. SOD and CAT do not need co-factors, but GPX and PRDXs need to work with some proteins as co-factors. The major redox buffer system includes the reduced glutathione (GSH)/oxidized glutathione (GSSG) system (GSH system) and the thioredoxin (Trx)/reductase (TrxR) system (Trx system). These systems can maintain the redox balance of cells by reversing the formation of disulfide or by providing electrons to peroxidase to scavenging ROS. GSH is oxidized to GSSG by GPX, and GSSG is reduced to GSH by GSR. The antioxidant effect of PRDXs comes into play by utilizing the TRX system.6 Peroxidase 3 (PRDX3) is a PRDX located in mitochondria that can facilitate the process of removing ROS produced by mitochondria.21 Thioredoxin interaction protein (TXNIP) is an endogenous thioredoxin inhibitor. The overexpression of TXNIP leads to a decline in the antioxidant ability of TXN, which plays a role in mediating oxidative stress by inhibiting the function of the thioredoxin system.22,23 A schematic diagram of the above pathways involved in the regulation of redox proteins and ROS levels is shown in Figure 6.
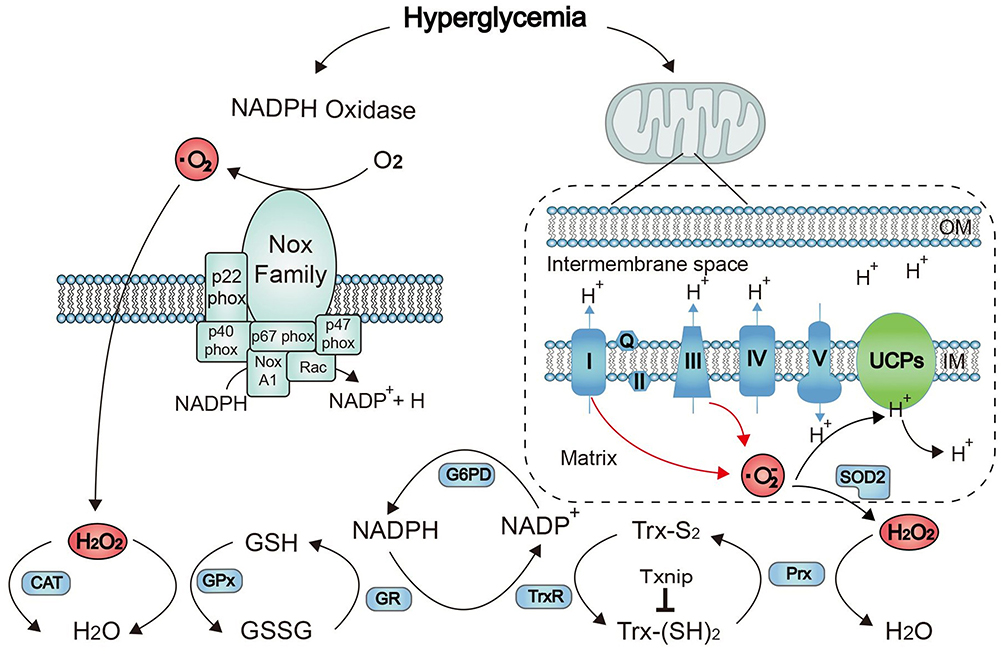 |
Figure 6 Schematic diagram of pathways involved in Redox proteins and ROS regulation. HS’ denotes the reduced form of the protein; “S” represents the protein oxidized form of the protein. Abbreviations: NADPH, nicotinamide adenine dinucleotide phosphate; UCP, uncoupling protein; SOD, superoxide dismutase; GPX, glutathione peroxidase; GSH, reduced glutathione; GSSG, oxidized glutathione; GR, glutathione reductase; Trx, thioredoxin; TrxR, thioredoxin reductase; Txnip, thioredoxin-interacting protein. |
Our previous studies demonstrated that APS could reduce the degree of oxidative damage in myocardium at the whole-animal and cellular levels, which indicated a protective effect on DCM.11–13 However, the underlying mechanism is still unclear. Recent study found that PARP1 inhibitor can prevent DNA damage in cardiomyocytes model for atrial fibrillation, suggesting that APS can protect diabetic cardiomyocytes by this way as it reduced oxidative damage as well.24Therefore, in this study, we further studied the possible mechanism of the protective effect of APS on the diabetic heart.
In this study, H9C2 cells were treated with high glucose to simulate the diabetic myocardial injury model, and H9C2 cells were treated with SOD2 RNA interference to simulate the oxidative-stress myocardial injury model. The myocardial tissue and ultrastructure damage of H9C2 myocardial cells was significantly increased in the HG group and siRNASOD2 group compared with the control group, and the apoptosis level of H9C2 cells and the levels of ROS and oxidative stress damage products were increased. These results suggested that the model of oxidative-stress myocardial injury was successfully established, and high glucose-induced cardiomyocyte damage was closely related to the oxidative stress response. However, the above indices in the APS treatment group showed significant improvement, indicating that APS had protective effects on oxidative damage in both high glucose-induced and SOD2-silenced H9C2 cells. APS may play a protective role by reducing the oxidative stress response of diabetic cardiomyocytes, thus significantly preventing or at least delaying the development of DCM.
We then used the oxidant array to analyze the gene expression of oxidant/antioxidant genes related to ROS production and elimination. The results showed that, compared with the control group, the CYBA, NCF1, NCF2, NOX4, UCP2, UCP3, and TXNIP genes in the HG group and siRNASOD2 group were significantly increased, while the expression of the SOD2, CAT, GPX1, PRDX3, GSR, TXN1 and TXNRD2 genes was significantly decreased. These results demonstrated that hyperglycemia or SOD2 gene interference may expose myocardial cells to an excessive oxidant stress burden, causing an increase in ROS levels that reaches a threshold that triggers an imbalance of oxidative stress. The expression of the above genes in the heart was significantly counteracted by APS treatment, suggesting that APS has a strong antioxidant activity. By regulating the expression of cardiac antioxidant genes, it inhibits the formation of ROS and plays a positive role. Therefore, after hyperglycemia or SOD2 interference causes cellular oxidative stress, cardiomyocytes can increase the antioxidant capacity by upregulating or downregulating the expression of oxidative stress response genes as part of the body’s defense mechanism against oxidative stress. These results indicated that APS could both reduce the formation of ROS and enhance the elimination of ROS. Thus, it could potentially improve the antioxidative status within the heart, thereby protecting the cells from excessive oxidative stress-induced myocardial cell damage and apoptosis.
APS has benefits in DCM, which may be partly associated with its impact on cardiac oxidant stress. As a model of oxidative stress, the siRNASOD2 group showed significant improvement in oxidative stress-related indicators after APS treatment without any hyperglycemia induction.25,26 This result suggested that APS could directly interfere with the oxidative stress of cardiomyocytes, and this effect was independent of the effect of APS under hyperglycemia induction. Our next study will further validate the results of this cell experiment in primary cardiomyocytes, which will make the conclusions from this part of the experiment more convincing.
From the above, our experiments proved that APS can improve hyperglycemia-induced oxidative stress in H9C2 cells, which may indicate a potential mechanism by which APS protects cardiomyocytes by decreasing ROS production and increasing ROS elimination. This finding may provide important guidance for developing new drugs related to reducing oxidative damage of DCM and provides a more theoretical basis for the clinical application of APS. These hypotheses could be further confirmed by additional mechanical studies.
Conclusion
Our findings suggested that APS can improve antioxidant capacity and inhibit oxidative stress injury in high glucose induced H9C2 cells by reducing the formation of ROS and increasing the elimination of ROS.
Acknowledgment
This study was supported by the Chinese State Natural Science Funds Commission (NSFC), Grant No. 81473460 and 81670751.
Author Contributions
All authors contributed toward data analysis, drafting and revising the paper, gave final approval of the version to be published and agree to be accountable for all aspects of the work.
Disclosure
The authors have no potential conflicts of interest related to this article.
References
1. Boudina S, Abel ED. Diabetic cardiomyopathy revisited. Circulation. 2007;115(25):3213–3223. doi:10.1161/CIRCULATIONAHA.106.679597
2. Kenichi W, Thandavarayan RA, Meilei H, et al. Role of differential signaling pathways and oxidative stress in diabetic cardiomyopathy. Curr Cardiol Rev. 2010;6(4):280–290.
3. Moncol J. Free radicals and antioxidants in normal physiological functions and human disease. Int J Bioxhem Cell Biol. 2007;39(1):44–84. doi:10.1016/j.biocel.2006.07.001
4. Jones ML, Mark PJ, Lewis JL, et al. Antioxidant defenses in the rat placenta in late gestation: increased labyrinthine expression of superoxide dismutases, glutathione peroxidase 3, and uncoupling protein 2. Biol Reprod. 2010;83(2):254. doi:10.1095/biolreprod.110.083907
5. Zhang Y, Martin SG, Proteins R. Radiotherapy. Clin Oncol. 2014;26(5):289–300. doi:10.1016/j.clon.2014.02.003
6. Koji A, Toshio N. Glutathione in cellular redox homeostasis: association with the Excitatory Amino Acid Carrier 1 (EAAC1). Molecules. 2015;20(5):8742–8758. doi:10.3390/molecules20058742
7. Shao BM, Xu W, Dai H, et al. A study on the immune receptors for polysaccharides from the roots of Astragalus membranaceus, a Chinese medicinal herb. Biochem Biophys Res Commun. 2004;320(4):1103–1111. doi:10.1016/j.bbrc.2004.06.065
8. Ni Y, Su Q, Liu X, et al. Study on the optimization experiment of decoction extraction of astragalus polysaccharides. China J Chin Material Medica. 1998;23:284–286.
9. Sun S, Yang S, Dai M, et al. The effect of Astragalus polysaccharides on attenuation of diabetic cardiomyopathy through inhibiting the extrinsic and intrinsic apoptotic pathways in high glucose -stimulated H9C2 cells. BMC Complement Altern Med. 2017;17(1):310. doi:10.1186/s12906-017-1828-7
10. Ju J, Chen W, Lai Y, et al. Astragalus polysaccharides improve cardiomyopathy in STZ-induced diabetic mice and heterozygous (SOD2±) knockout mice. Braz J Med Biol Res. 2017;50(8):e6204.
11. Chen W, Lai Y, Wang L, et al. Astragalus polysaccharides repress myocardial lipotoxicity in a PPARalpha-dependent manner in vitro and in vivo in mice. J Diabetes Complications. 2015;29(2):164–175. doi:10.1016/j.jdiacomp.2014.11.007
12. Chen W, Sun Q, Ju J, et al. Effect of astragalus polysaccharides on cardiac dysfunction in db/db mice with respect to oxidant stress. Biomed Res Int. 2018;2018:1–10.
13. Chen W, Sun Q, Ju J, et al. Astragalus polysaccharides inhibit oxidation in high glucose-challenged or SOD2-silenced H9C2 cells. Diabetes Metab Syndr Obes. 2018;11:673–681. doi:10.2147/DMSO.S177269
14. Wang J, Jia J, Song L, et al. Extraction, structure, and pharmacological activities of Astragalus Polysaccharides. Appl Sci. 2018;9:122. doi:10.3390/app9010122
15. Watkins SJ, Borthwick GM, Arthur HM. The H9C2 cell line and primary neonatal cardiomyocyte cells show similar hypertrophic responses in vitro. Vitro Cell Dev Biol Anim. 2011;47(2):125–131. doi:10.1007/s11626-010-9368-1
16. Aksakal E, Akaras N, Kurt M, et al. The role of oxidative stress in diabetic cardiomyopathy: an experimental study. Eur Rev Med Pharmacol Sci. 2011;15(11):1241–1246.
17. Chung S, Ho C, Lam K, et al. Oxidative stress and diabetic complications. Circ Res. 2004;107(9):1058–1070.
18. Aroor AR, Mandavia C, Ren J, et al. Mitochondria and oxidative stress in the cardiorenal metabolic syndrome. Cardiorenal Med. 2012;2(2):87–109. doi:10.1159/000335675
19. Atilano S, Lee D, Fukuhara P, et al. Corneal oxidative damage in keratoconus cells due to decreased oxidant elimination from modified expression levels of SOD enzymes, PRDX6, SCARA3, CPSF3, and FOXM1. J Ophthalmic Vis Res. 2019;14:62. doi:10.4103/jovr.jovr_80_18
20. Vats P, Sagar N, Singh TP, et al. Association of superoxide dismutases (SOD1 and SOD2) and Glutathione peroxidase 1 (GPx1) gene polymorphisms with type 2 diabetes mellitus. Free Radic Res. 2015;49(1):17–24. doi:10.3109/10715762.2014.971782
21. Chae H, Kim H, Sw RS. Characterization of three isoforms of mammalian peroxiredoxin that reduce peroxides in the presence of thioredoxin. Diabetes Res Clin Pract. 1999;45(2–3):101–112. doi:10.1016/s0168-8227(99)00037-6
22. Kolypetri P, Carayanniotis G. Apoptosis of NOD.H2 h4 thyrocytes by low concentrations of iodide is associated with impaired control of oxidative stress. Thyroid. 2014;24(7):1170–1178. doi:10.1089/thy.2013.0676
23. Telorack M, Meyer M, Ingold I, et al. A glutathione-Nrf2-thioredoxin cross-talk ensures keratinocyte survival and efficient wound repair. PLoS Genet. 2016;12(1):e1005800. doi:10.1371/journal.pgen.1005800
24. Zhang D, Hu X, Li J, et al. DNA damage-induced PARP1 activation confers cardiomyocyte dysfunction through NAD+ depletion in experimental atrial fibrillation. Nat Commun. 2019;10(1):1307. doi:10.1038/s41467-019-09014-2
25. Kohler JJ, Cucoranu IE. Transgenic mitochondrial superoxide dismutase and mitochondrially targeted catalase prevent antiretroviral-induced oxidative stress and cardiomyopathy. Lab Invest. 2009;89(7):782–790. doi:10.1038/labinvest.2009.39
26. Remmen H, Van, Williams MD, Guo Z, et al. Knockout mice heterozygous for Sod2 show alterations in cardiac mitochondrial function and apoptosis. Am J Physiol Heart Circ Physiol. 2001;281(3):1422–1432. doi:10.1152/ajpheart.2001.281.3.H1422
 © 2019 The Author(s). This work is published and licensed by Dove Medical Press Limited. The full terms of this license are available at https://www.dovepress.com/terms.php and incorporate the Creative Commons Attribution - Non Commercial (unported, v3.0) License.
By accessing the work you hereby accept the Terms. Non-commercial uses of the work are permitted without any further permission from Dove Medical Press Limited, provided the work is properly attributed. For permission for commercial use of this work, please see paragraphs 4.2 and 5 of our Terms.
© 2019 The Author(s). This work is published and licensed by Dove Medical Press Limited. The full terms of this license are available at https://www.dovepress.com/terms.php and incorporate the Creative Commons Attribution - Non Commercial (unported, v3.0) License.
By accessing the work you hereby accept the Terms. Non-commercial uses of the work are permitted without any further permission from Dove Medical Press Limited, provided the work is properly attributed. For permission for commercial use of this work, please see paragraphs 4.2 and 5 of our Terms.