Back to Journals » Journal of Pain Research » Volume 14
Promising Effect of Visually-Assisted Motor Imagery Against Arthrogenic Muscle Inhibition – A Human Experimental Pain Study
Authors Oda S ![]() , Izumi M
, Izumi M ![]() , Takaya S
, Takaya S ![]() , Tadokoro N, Aso K, Petersen KK
, Tadokoro N, Aso K, Petersen KK ![]() , Ikeuchi M
, Ikeuchi M
Received 18 September 2020
Accepted for publication 13 January 2021
Published 3 February 2021 Volume 2021:14 Pages 285—295
DOI https://doi.org/10.2147/JPR.S282736
Checked for plagiarism Yes
Review by Single anonymous peer review
Peer reviewer comments 2
Editor who approved publication: Professor Michael Überall
Shota Oda,1 Masashi Izumi,1,2 Shogo Takaya,1,2 Nobuaki Tadokoro,2 Koji Aso,2 Kristian Kjær Petersen,3 Masahiko Ikeuchi1,2
1Department of Rehabilitation Center, Kochi Medical School Hospital, Nankoku, Kochi, Japan; 2Department of Orthopedic Surgery, Kochi University, Nankoku, Kochi, Japan; 3Center for Neuroplasticity and Pain (CNAP), Department of Health Science and Technology, Faculty of Medicine, Aalborg University, Aalborg, Denmark
Correspondence: Masashi Izumi
Department of Orthopedic Surgery, Kochi University, Oko-Cho Kohasu, Nankoku, Kochi, Japan
, 783-8505 Tel +81-88-880-2386
Fax +81-88-880-2388
Email [email protected]
Purpose: Clinically, arthrogenic muscle inhibition (AMI) has a negative impact on functional recovery in musculoskeletal disorders. One possible technique to relieve AMI is motor imagery, which is widely used in neurological rehabilitation to enhance motor neuron excitability. The purpose of this study was to verify the efficacy of visually-assisted motor imagery against AMI using a human experimental pain model.
Methods: Ten healthy volunteers were included. Experimental ankle pain was induced by hypertonic saline infusion into unilateral Kager’s fat pad. Isotonic saline was used as control. Subjects were instructed to imagine while watching a movie in which repetitive motion of their own ankle or fingers was shown. H-reflex normalized by the motor response (H/M ratio) on soleus muscle, maximal voluntary contraction (MVC) force of ankle flexion, and contractile activities of the calf muscles during MVC were recorded at baseline, pre-intervention, post-intervention, and 10 minutes after the pain had subsided.
Results: Hypertonic saline produced continuous and constant peri-ankle pain (VAS peak [median]= 6.7 [2.1– 8.4] cm) compared to isotonic saline (0 [0– 0.8] cm). In response to pain, there were significant decreases in the H/M ratio, MVC and contractile activities (P< 0.01), all of which were successfully reversed after the ankle motion imagery. In contrast, no significant changes were observed with the finger motion imagery.
Conclusion: Visually-assisted motor imagery improved the pain-induced AMI. Motor imagery of the painful joint itself would efficiently work for relieving AMI. This investigation possibly shows the potential of a novel and versatile approach against AMI for patients with musculoskeletal pain.
Keywords: arthrogenic muscle inhibition, experimental ankle pain model, visually-assisted motor imagery
Introduction
Arthrogenic muscle inhibition (AMI) is a presynaptic, ongoing reflex inhibition of periarticular musculature elicited by abnormal input to the joint such as swelling and pain.1 AMI is a natural, protective response intended to reduce activity of the motor neuron pool to prevent further joint damage, however, prolonged AMI can cause muscle weakness and atrophy, which consequently lead to functional deficits.2 Particularly, pain-associated AMI has notable impact on patients with musculoskeletal disorders.3 To date, some clinical studies have suggested treatment modalities for AMI such as cryotherapy and transcutaneous electrical nerve stimulation,4,5 however, preventive strategies have not been established yet.
Experimental human pain models have provided better understanding of pain characteristics originating from specific anatomical structures.6 In animal studies, hypertonic saline injection into musculoskeletal structures induced neural firing in a large population of group III and IV nociceptive afferents.7 In humans, injection of hypertonic saline into muscles and ligaments is an accepted, efficient, and safe method to induce temporary pain which has similar features to clinical musculoskeletal pain6 and mimics the pain-related features of, eg, pain in osteoarthritis.8 These models have further advantage for evaluating motor alteration purely due to pain, which is difficult to demonstrate in patients with heterogeneous conditions. Indeed, several studies have shown a decrease of quadriceps muscle force with less motor neuron recruitment9,10 using experimental pain models.
In the field of electrophysiology, H/M ratio, defined as Hoffmann reflex (H-reflex) normalized by the motor response, has been used to assess motor neuron pool excitability11 and some of the studies reported its usefulness for evaluating AMI.11,12 In terms of technical issues, H-wave recording on the soleus muscle has been reported as a highly reliable measurement13 that would be easily available for H/M ratio assessment.
Motor imagery is a mental practice without any body movements.14 In rehabilitation, motor imagery combined with visual feedback has been used for patients with motor impairment after neurological disorders, such as spinal cord injuries and strokes.15,16 Clinical reviews have reported that rehabilitation using motion observation and imagery of the identical action is effective in restoring motor function.17 Recently, evidence for the neural mechanisms of motor imagery has been accumulated in neuroimaging and electrophysiological studies.18,19 In electrophysiology studies, some authors reported facilitation of the H-waves’ amplitude during motor imagery compared with at rest,20,21 whereas other studies showed reduction or no significant change.22,23 Thus, a consensus about the effect of motor imagery on H-waves has yet to be reached, however, a recent study reported that motor imagery could activate both cortical and subcortical structures and that its impact on spinal networks depends, at least, on the excitability thresholds of the involved interneurons and motoneurons structures.24,25 Although these reports supported that motor imagery probably modulates neural systems such as corticospinal tracts and spinal reflex circuits,18,26 its potential for relieving AMI has not been fully investigated.
The aim of this study was, therefore, to establish a human experimental pain model for evaluating AMI, and to utilize this model to study the effect of visually-assisted motor imagery against AMI. We hypothesized that our novel experimental pain model would be suitable for evaluating pain-associated AMI and visually-assisted motor imagery could improve the AMI.
Materials and Methods
Subjects
Ten healthy volunteers with no history of musculoskeletal or neurological problems participated in this study (sex; 8 men, age; 26±3 years [mean ± SD], height [range]; 167[153–181]cm, weight [range]; 68 [44–95] kg, BMI [range]; 24.6 [18.9–32.8] kg/m2). Subjects were given a detailed written and verbal explanation of the experimental procedures. Ethical approval was obtained from the institutional ethical review board of Kochi Medical School (ERB-10,435), and the study protocol was registered to UMIN-CTR (UMIN000029529). Written informed consent was obtained from all subjects prior to study enrollment. The study was conducted in compliance with the Declaration of Helsinki.
Experimental Protocol
This study was a randomized, double blinded, placebo-controlled trial, and consisted of 2 experiments (Experiment-A and -B) separated by at least a 1-week interval. Experiment-A contained 2 sessions which had 2 types of motor imagery interventions (ankle or finger) whereas Experiment-B had 1 session (ankle motion imagery only). In each session, the subjects received 1 hypertonic and 1 isotonic saline infusion separated by 15 minutes, with the experimenter and subject blinded to the order of the saline type. H/M ratio in Experiment-A, maximal voluntary contraction (MVC) and root mean square (RMS) of calf muscles activities in Experiment-B were evaluated at Baseline (pre-saline infusion; T0), Pre-intervention (stable painful state after saline infusion; T1), Post-intervention (3 minutes after intervention; T2) and 10 minutes after the pain had subsided (Recovery; T3). Illustration of the study design and an example of the experimental procedure are shown in Figure 1. Averages of measurements were used for analysis.
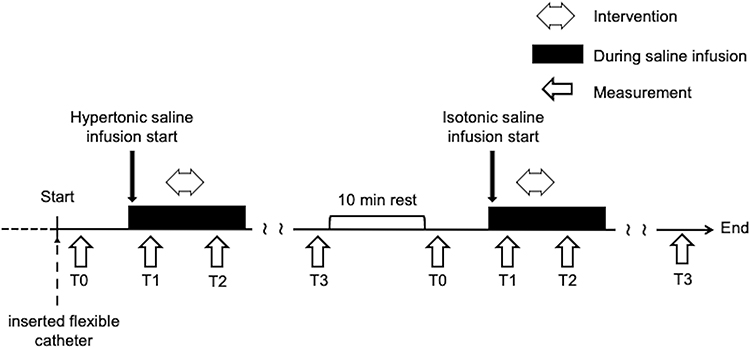 |
Figure 1 Experimental protocol. The evaluation was performed at four points: Baseline (pre-saline infusion; T0), Pre-intervention (stable painful state after saline infusion; T1), Post-intervention (3 minutes after intervention; T2) and 10 minutes after the pain had subsided (Recovery; T3). All subjects received hypertonic and isotonic infusions each day. The order of infusion type of saline (hypertonic/isotonic) and measurement (Experiment-A or -B) were randomized and balanced. Experiment-A contained 2 sessions which had 2 types of motor imagery interventions (ankle or finger) whereas Experiment-B had only 1 session (ankle motion imagery). Experiment-A measured H/M ratio, while Experiment-B recorded MVC force and RMS of the amplitude. Abbreviations: MVC, maximal voluntary contraction; RMS, root mean square. |
Experimental Ankle Pain Model
Study participants lay in a prone position on the bed, and skin was cleaned with an alcohol wipe and iodine (Libatape pharmaceutical Co., Ltd. Tokyo, Japan) to decrease the risk of infection. A 26-gauge flexible catheter (Nipro Co., Osaka, Japan) was inserted from medial edge of the Achilles tendon into the left Kager’s fat pad, that is an adipose tissue located between the Achilles tendon, superior cortex of the calcaneus and flexor hallucis longus muscle and tendon (Figure 2A and B). The catheter was connected to a 20mL syringe via a 100cm extension tube (Nipro Co., Osaka, Japan), which was attached to an infusion pump (Top Co., Ltd. Nagoya, Japan, Figure 2C). The infusion pump produced a continuous saline flow of 0.154 mL/min. Infusion of hypertonic saline (1.0mEq, Otsuka Pharmaceutical Co., Ltd. Tokyo, Japan) was used for evoking ankle pain, whereas isotonic saline (0.16mEq/mL, Otsuka Pharmaceutical Co., Ltd. Tokyo, Japan) was used as control. All infusions were performed under strictly sterile conditions by an experienced orthopedic surgeon (S.T). The location of infusion site was confirmed by ultrasound imaging (SONIMAGE HS1, KONICA MINOLTA, inc. Tokyo, Japan).
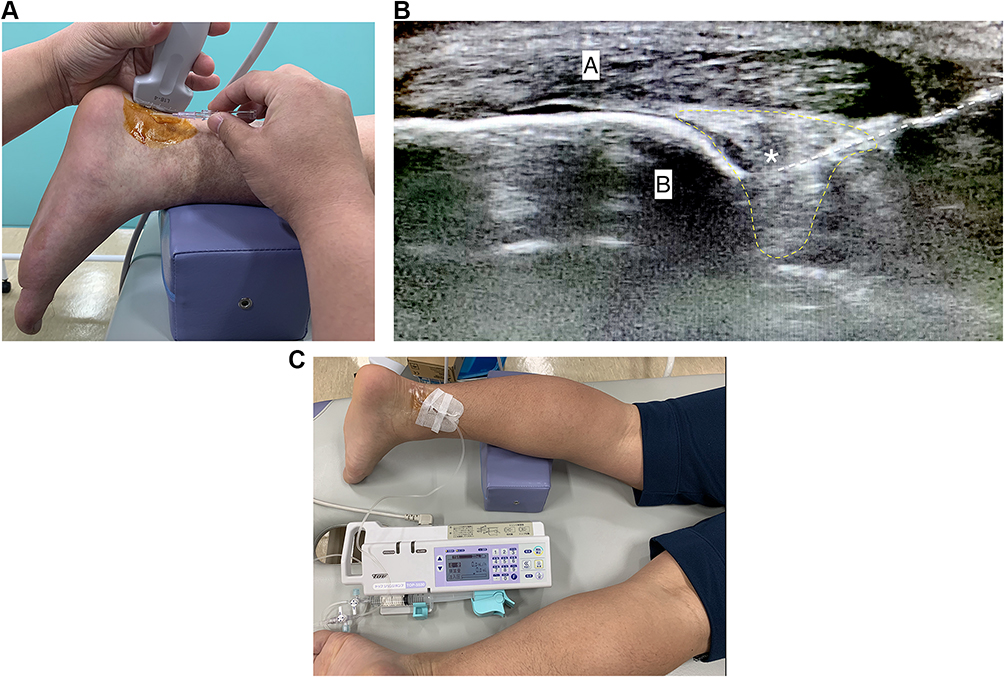 |
Figure 2 Experimental ankle pain model. (A) Set-up of the flexible catheter insertion. (B) Ultrasound image of the catheter inserted into Kager’s fat pad (A) Calcaneus, (B) Achilles tendon, Kager’s fat pad (yellow), catheter (white). *Tip of the catheter. (C) Syringe infusion pump attached to the catheter. |
Measurement
Pain Intensity
The experimental pain intensity and duration were measured on a 10cm electronic visual analog scale (VAS) with an external mouse wheel to adjust the scale. The VAS was anchored with “”no pain” and ”worst pain imaginable” at 0 cm and 10 cm, respectively. The signal from the VAS was recorded with a sample frequency of 0.5Hz from the beginning of infusion and continued until the pain had subsided. Pain scale following infusion of saline was continuously recorded using an electrical VAS system throughout the experiment and subjects were instructed to adjust their pain intensity using an external controller when it changed. The peak pain intensity (VAS peak) and area under the VAS–time curve (VAS area) were extracted.
H/M Ratio (Experiment-A)
Each subject lay on the bed in prone position comfortably with the left leg resting on a pillow in a shield room. The leg and trunk were fixed with a belt to avoid unexpected movement. Recordings were made from the left soleus muscle by two surface electrodes (Neuropack MEB-2200, Nihon-Koden Co., Tokyo, Japan) with the cathode over the motor point of the muscle and the anode about 3 cm distal from the cathode, on the Achilles tendon. The ground electrode was placed between the recording and the stimulating electrodes. H-waves and M-waves were elicited by stimulating the left tibial nerve at the popliteal fossa using a surface bipolar electrode (Neuropack MEB-2200, Nihon-Koden Co., Tokyo, Japan) with the cathode proximal to the anode. The stimuli were rectangular pulses delivered from a stimulator with 1 ms duration of the stimuli and at a 0.2Hz frequency. Stimulus intensity was increased by 0.2 mA increments until the H-wave max and M-wave max amplitudes were determined. At each intensity, ten stimuli were delivered with a 5 s interval between stimuli. From this data the maximum amplitude (peak to peak height of the waves) of the H-wave and the M-wave were identified. The H/M ratio was calculated as H-wave divided by M-wave×100 and then used for data analysis. According to Hopkins et al, reliability of this procedure on soleus muscle was good-to-excellent, with the interclass correlation coefficient (3,K) of 0.93–0.94.27
Maximal Voluntary Contraction Force and Contractile Activity (Experiment-B)
Subjects lay on the bed in supine position with their forefoot, knee and trunk strapped with some belts. The maximal voluntary contraction (MVC) force of ankle plantar flexion muscle was measured by a hand-held dynamometer (μ-tas F1; Anima Co., Tokyo, Japan) applied on the left metatarsus of the sole. The subjects were asked to perform isometric plantar flexion of their ankle at neutral position for 5 seconds. Loud verbal encouragement was given during the tests to get the maximal effort and force. Three repetitions in each measurement were performed with 20 seconds interval. Activation of the calf muscles was measured using surface electromyography (EMG) (Multi-channel telemetry system WEB-100, Nihon-Koden Co., Tokyo, Japan). EMG measurements were conducted on 1) soleus (SOL), 2) lateral gastrocnemius (LG), and 3) medial gastrocnemius (MG) muscles in the ipsilateral limb. The positions of electrodes were located as follows:28 1) SOL; mid-dorsal line of the leg, a few centimeters distal from where the two heads of the gastrocnemius join the Achilles tendon, 2) LG; one third of the line between the head of the fibula and the heel, 3) MG; most prominent bulge of the muscle. Root mean square (RMS) of the amplitude was calculated to evaluate muscle activity (SOL, LG and MG) after the tasks. The RMS analysis was performed on a 3sec data sample (from 0.5 sec before to 0.5 sec after the peak MVC).
Intervention (Visually-Assisted Motor Imagery)
Prior to the saline infusion, movies of active ankle and finger motion of the subjects (moved by themselves as much as possible) were recorded using iPad (Apple inc., California, USA). Subjects were then asked to perform two tasks of motor imagery from the kinesthetic motor imagery. The first motor imagery task was active plantar-dorsi flexion of their left ankle and the second one was flexion-extension of their left fingers. During interventions, subjects were asked to concentrate on the movie and imagine without actual motion. Each task was continued for 3 minutes with repetition of 5 second imagining and 5 second rest.29 Subjects were requested to imagine with the intensity of maximal muscle contraction. To ensure that motor imagery did not induce muscle contraction, EMGs during the intervention were recorded. No contamination of muscle contraction was observed in all subjects. To familiarize subjects with each task, the subjects had a short training session of the motor imagery prior to data collection.
Statistical Analysis
Our sample size was determined by referring to a previous study that examined H/M ratio in a saline-induced pain model. They found 12% decrease of the H/M ratio after hypertonic saline injection compared with isotonic saline (control), and the difference was statistically significant.11 Calculation was done according to this difference with 90% statistical power and an α level of 0.05, it was determined that 9 subjects were needed for each group. A group size of 10 was chosen to allow for possible dropouts.
Normally distributed data were presented as mean and standard error of the mean (SEM) and other data as median and interquartile range [0.25–0.75]. The VAS peak and VAS area did not pass the Kolmogorov–Smirnov test for normal distribution and were analyzed by the Wilcoxon signed rank test. In Experiment-A a mixed-model analysis of variance (ANOVA) was performed on H/M ratio using the repeated factors of saline type (hypertonic or isotonic) and time (Baseline; T0, Pre-intervention; T1, Post-intervention; T2 and Recovery; T3) and the independent factor of intervention (ankle or finger movies). In Experiment-B, a mixed-model ANOVA was performed on MVC and RMS using the repeated factors of saline type (hypertonic or isotonic) and time (T0, T1, T2 and T3). Saline and measurement sequence were set as independent factors. The Neuman-Keuls (NK) tests were used for post hoc comparisons incorporating correction for the multiple comparisons when the ANOVA showed significant factors or interactions. All statistical analyses were performed with IBM SPSS ver. 25.0 (IBM Co., Armonk, NY, USA).
Results
None of the subjects complained about adverse events caused by infusion itself during and after the experiment.
Experimental Ankle Pain Intensity
The VAS peak and VAS area were significantly increased after hypertonic saline infusions compared with isotonic saline (Table 1; Wilcoxon: P<0.01). A representative pain course after saline infusion is shown in Figure 3.
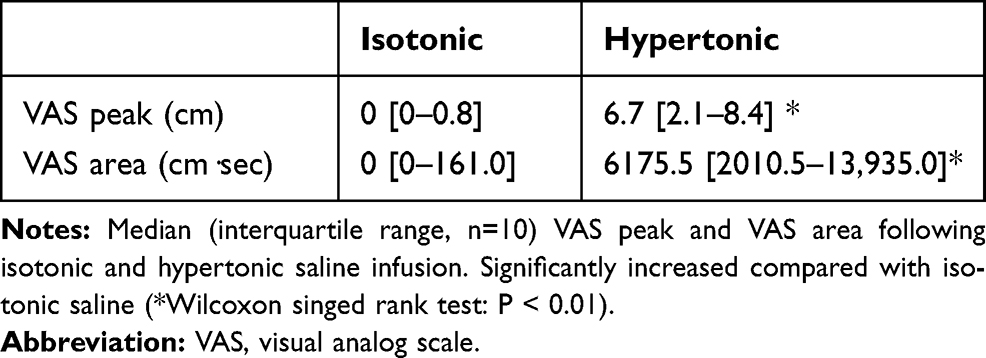 |
Table 1 Experimental Ankle Pain Intensity |
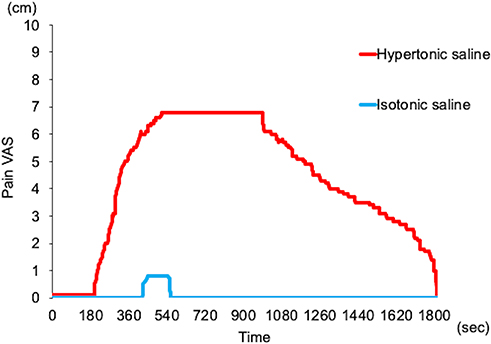 |
Figure 3 Example of experimental protocol for a subject. The pain VAS after isotonic saline (blue line) and hypertonic saline (red line) infusions are indicated respectively. Time 0 sec shows the beginning of saline infusion. Abbreviation: VAS, visual analog scale. |
H/M Ratio (Experiment-A)
H/M ratio change following isotonic and hypertonic saline infusion in Experiment-A is shown in Table 2, Figure 4. A significant interaction among saline, time and intervention was found on the H/M ratio of Experiment-A (ANOVA: F=5.4; P<0.0085). Following hypertonic saline infusion, H/M ratio in T1 demonstrated significant decrease compared with T0 (ankle: T1/T0=75.3±2.6%, finger: T1/T0=76.9±3.4%, NK: P<0.01, Figure 5). After the imagery using the ankle movie, H/M ratio in T2 was significantly increased compared to T0 (T2/T0=114.7±2.4%, NK; P<0.05 Figure 5A), however this phenomenon was not observed with the finger movie (T2/T0=80.1 ±6.2% Figure 5B). After the experimental pain had diminished (T3), H/M ratio was recovered to the baseline level in both intervention sessions. Infusion of isotonic saline demonstrated no significant change of H/M ratio on T1 and T3 compared with T0 in both intervention sessions, however, the ankle movie intervention, but not the finger movie, significantly increased H/M ratio compared with T0 (T2/T0=113.4 ±2.8%, NK; P<0.05 Figure 5A).
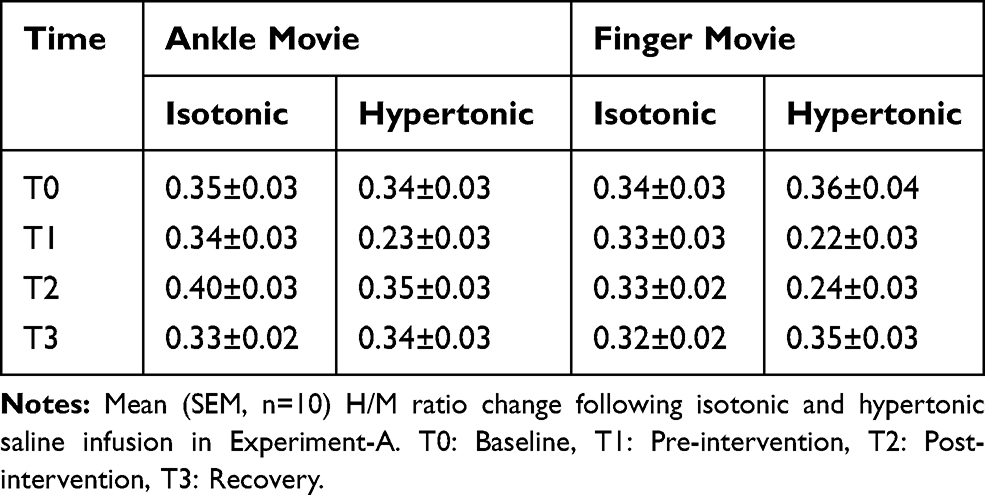 |
Table 2 H/M Ratio for Each Saline Infusion Over Time (Experiment-A) |
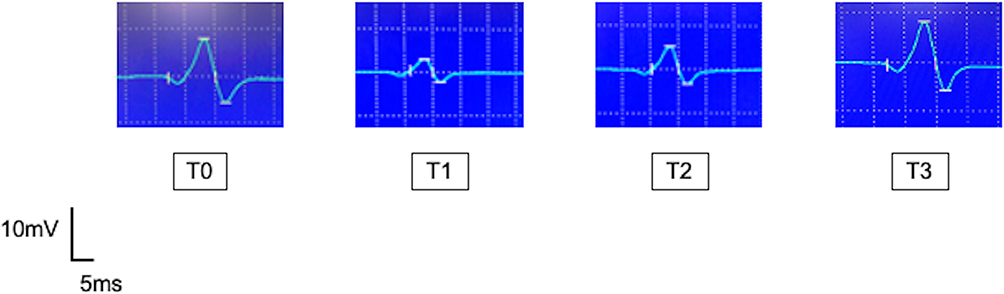 |
Figure 4 Example of H-waves obtained from a subject in Experiment-A. Ankle movie was used for visually-assisted motor imagery. T0: Baseline, T1: Pre-intervention, T2: Post-intervention, T3: Recovery. |
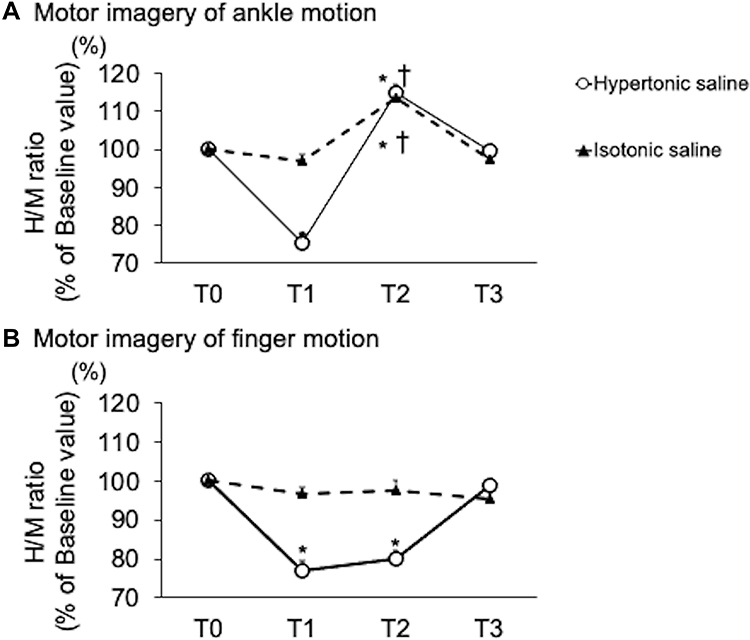 |
Figure 5 H/M ratio. Mean (SEM, n=10) H/M ratio after the infusion of hypertonic (open circle) or isotonic saline (black triangle). The data show H/M ratio after motor imagery of ankle motion (A) and hand motion (B). Although statistics were performed on raw values of the data, each number is indicated by the rate of change from Baseline (T0). Significantly different from T0 (*, NK: P<0.05), and T1 (†, NK: P<0.05). T0: Baseline, T1: Pre-intervention, T2: Post-intervention, T3: Recovery. |
Maximal Voluntary Contraction Force and Contractile Activity (Experiment-B)
A significant interaction between saline and time was found in the MVC force (ANOVA: F=14.4; P<0.01), and RMS of the amplitude in each muscle (ANOVA: F>4.7; P<0.0071). Following hypertonic saline infusion, MVC in T1 demonstrated significant reduction compared with T0, which returned to the baseline level after the experimental pain had diminished (T1/T0=61.7±15.1%, T3/T0=95.4±23.4%, NK: P<0.001, Figure 6). After the imagery using the ankle movie, MVC in T2 was not significantly reversed to the baseline level (T2/T0=75.9±4.8%, P<0.05, Figure 6), however it was improved compared with T1 (T2/T1=123.0±3.1%, NK: P<0.05, Figure 6). Similarly, RMS of the amplitude in T1 demonstrated significant reduction compared with T0 on the 3 recorded muscles (T1/T0=SOL;54.2±4.5, LG; 63.1±3.4%, MG; 70.4±2.8% NK: P<0.01, Figure 7), which were all improved by the ankle motion imagery (NK; P<0.05 Figure 7). Infusion of isotonic saline demonstrated no significant change of MVC and RMS on T1 and T3 compared with baseline (Figure 7), however, ankle motion imagery significantly increased RMS compared with T0 (T2/T0= SOL;116.3±13.4, LG; 113.1±9.3%, MG; 121.1±8.4% NK; P<0.05 Figure 7).
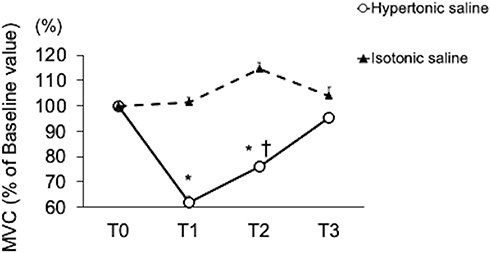 |
Figure 6 Maximal voluntary contraction force Mean (SEM, n=10) MVC after the infusion of hypertonic (open circle) or isotonic saline (black triangle). Although statistics were performed on raw values of the data, each number is indicated by the rate of change from Baseline (T0). Significantly different from T0 (*, NK: P<0.05), and T1 (†, NK: P<0.05). T0: Baseline, T1: Pre-intervention, T2: Post-intervention, T3: Recovery. Abbreviation: MVC, maximal voluntary contraction. |
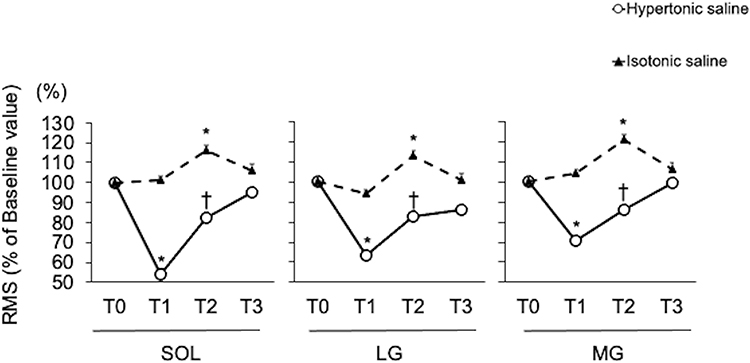 |
Figure 7 Contractile activity. Mean (SEM, n=10) RMS after the infusion of hypertonic (open circle) or isotonic saline (black triangle). Although statistics were performed on raw values of the data, each number is indicated by the rate of change from Baseline (T0). Significantly different from T0 (*, NK: P<0.05), and T1 (†, NK: P<0.05). T0: Baseline, T1: Pre-intervention, T2: Post-intervention, T3: Recovery. Abbreviations: RMS, root mean square; SOL, soleus; LG, lateral gastrocnemius; MG, medial gastrocnemius. |
Discussion
This was the first study to examine the immediate effect of visually-assisted motor imagery on AMI using a saline-infusion-induced experimental ankle pain model. The current study demonstrated that visually-assisted motor imagery improved H/M ratio and maximal voluntary contraction force together with muscle contractile activities following painful hypertonic saline infusion.
Experimental Continuous Ankle Pain Model
A novel experimental ankle pain model was successfully developed in this study. Although previous reports investigated the effect of saline-induced pain on periarticular muscle strength and contractile activity, they mainly used single-shot injections, which induce a quickly increasing and gradually decreasing pain so that duration of constant pain state was relatively short.9,10,30–32 In this study, continuous saline infusion model was adopted to make the time-consuming assessments and interventions more feasible and reliable. Similar to an established fat pad infusion of the knee,5,33 our ankle model was able to produce a long-lasting constant pain state without any adverse events. In addition, recording H-waves on soleus muscle has been recognized to be much easier and reproducible compared with other muscles such as quadriceps in lower limb.27 In this regard, the model presented in the current study has the advantage to make it possible for monitoring pain-associated AMI using H/M ratio on the soleus muscle.
Mechanisms of Pain-Associated AMI
Although it has not been fully elucidated, neural inhibition seems to contribute greatly to developing pain-associated AMI.1 According to animal studies, group III and IV nociceptive afferents facilitated Ib inhibitory neurons in spinal dorsal horn and consequently reduced muscle strength.34,35 In addition, γ-loop dysfunction, namely an impairment of Ia afferent firing due to abnormal conditions of γ-motor neuron excitability has been suspected to be a possible cause of AMI.1
In previous human studies, pain-induced decrease of H-wave amplitude was a common finding and interpreted as inhibition of spinal anterior horn cell excitability.36–38 Meanwhile, change of motor evoked potential (MEP) by experimental pain was inconsistent between recording muscles in upper and lower limbs.32,36 Rice et al mentioned that the difference in MEP change might be related to the location of pain or the different functional roles of the tested muscles working for motor dexterity versus locomotion in upper and lower limbs.32 This opinion seems plausible since MEP covers entire pathways from brain to muscles, and the supraspinal system probably works in a more complicated manner, however, there are few reports which focused on pain-induced change of spinal reflex systems in lower limb muscles11,39 possibly because of its technical difficulty to secure recording of H-waves. As mentioned previously, our new model enables the evaluation of H-waves easily and reproducibly during a constant pain state so that the results strengthen the importance of alterations in spinal reflex pathways in the mechanisms of pain-associated AMI.
Effects of Visually-Assisted Motor Imagery on AMI
The current study was the first to report that visually-assisted motor imagery significantly improved the inhibited monosynaptic spinal reflex pathway during a continuous and constant pain state. Previous studies have shown motor imagery increases the excitability of monosynaptic spinal reflex pathways, corticospinal excitability and motor related brain region excitability using H-wave,21,40 F-wave26 and transcranial magnetic stimulation.41,42 According to their discussions and our results, plausible effects of motor imagery on neural excitability are activation of motor neuron and motor-related brain network.43,44 It has become evident that motor imagery activates brain areas devoted to motor control and execution,44,45 and creates a subliminal output,46 which goes along the corticospinal track to modulate specific spinal pools.25,47 Regarding possible spinal mechanisms, Grosprêtre et al used H-reflex conditioning paradigms and demonstrated that motor imagery modulated Ia afferent-motoneuronal efficacy via altering excitability of the presynaptic interneuronal network.25 In the current study, visually-assisted motor imagery significantly improved H/M ratio even under the condition of pain-associated AMI, which was consistent with these reports.21,25,43,49 In addition, this study also demonstrated that visually-assisted motor imagery increased the H/M ratio during infusion of isotonic saline, suggesting that this intervention has potentially positive effects for H/M ratio regardless of whether it is a painful condition or not.
Interestingly, visually-assisted motor imagery for AMI was effective only using the movie associated with painful area. Cowley et al21 reported that effect of motor imagery on H-wave amplitude was not fully localized to the target muscle, but also observed in a remote muscle, which seems to be inconsistent with our results. However, the authors also mentioned that larger facilitation occurred at the target muscle compared with the remote muscle, suggesting that imagined effort, probably synchronized with degree of attention or task specificity, was somewhat different between the muscles.21,48 Compared to previous reports, our experiments were conducted under continuously very painful conditions, which might provide larger difference of motor imagery effects between the primary (ankle) and remote (finger) movies.
H/M ratio and contractile activity of calf muscles were remarkably reversed to the baseline level by visually-assisted motor imagery, while MVC force was not. A plausible explanation is that altering gross muscular output requires more effort than neural excitability recovery. Further, previous studies using saline-induced-pain demonstrated that reduction of muscle strength was positively correlated with the experimental pain intensity.9,49 Since visually-assisted motor imagery did not attenuate pain itself, the effects on MVC force were not as great as muscle contractile activity. However, the force significantly increased compared with the worst AMI state (T1), therefore the motor imagery together with pain relief treatments should work in clinical settings.
Several other interventions against AMI have already been reported in healthy subjects5,39,50–53 and in patients, eg, anterior cruciate ligament injury3 and osteoarthritis.54 In their reports, cryotherapy3,53 and transcutaneous electric nerve stimulation39,54 were major interventions and some of them were effective for pain associated AMI. These interventions may also be a promising approach, but it seems less versatile compared with our visually-assisted motor imagery because they require more specific physiotherapy using some dedicated devices.
Clinical Relevances
The outcome of this study has two important clinical implications. First, experimental acute pain itself greatly attenuated monosynaptic spinal reflex, motor unit recruitment, and muscle strength without any anatomical abnormalities, which were consistent with previous studies.9,55,56 Clinically, this phenomenon may have greater impact because it typically occurs in chronic pain patients who have been exposed to repeated nociceptive inputs on anatomically “non-perfect” (eg, degenerated) joints and muscles. In this regard, relieving the nociceptive inputs as much as possible during training is a highly important task for therapists. Second, visually-assisted motor imagery improved the pain-associated AMI. Although some patients who worry about cognitive dysfunction should be contraindicated, this novel approach is readily available to most musculoskeletal rehabilitation patients without any expensive equipment and manpower supply. In this regard, long-lasting effects of our intervention should be investigated in future clinical trials. Moreover, the results might be of interest to clinicians who can use the visually-assisted motor imagery of “targeted painful area” to achieve AMI alleviating effects, but future studies are also needed to confirm this hypothesis.
Limitations
The current study has some limitations that should be noted. First, number of subjects were relatively small, and most of the participants were young healthy men, thus, effect of aging and gender difference could not be discussed. Second, acute pain was evoked by hypertonic saline infusion, which does not always reflect some clinical pain conditions with chronicity, however this approach provided essential basic data of AMI purely due to pain and its recovery by visually-assisted motor imagery. Third, intensity and quality of the motor imagery were not monitored and direct effects on central motor activations were not investigated. Fourth, quality of motor imagery was not evaluated using objective and subjective measures, which might affect the suppression of AMI. However, to minimize the variability, familiarization with the motor imagery was meticulously carried out before the experiment and subjects were instructed to concentrate on doing their best. Further studies including brain imaging are warranted to overcome this topic.
Conclusion
A novel experimental ankle pain model was successfully developed which enables the evaluation of AMI during a stable pain state. The H/M ratio and MVC force together with contractile activities significantly decreased due to pain. Visually-assisted motor imagery dramatically improved the pain-associated AMI by facilitating monosynaptic spinal reflex pathway. The effects were completely different between the ankle and finger movies, indicating that visually-assisted motor imagery of the painful joint itself would efficiently work for relieving AMI. This novel approach possibly shows the potential of a novel and versatile approach against AMI for patients with musculoskeletal pain.
Acknowledgments
We are thankful to the study participants and field supervisors for their contribution to this study.
Author Contributions
All authors contributed to data analysis, drafting or revising the article, have agreed on the journal to which the article will be submitted, gave final approval of the version to be published, and agree to be accountable for all aspects of the work.
Funding
This study was supported by JSPS KAKENHI Grant Number 19K19868. Center for Neuroplasticity and Pain (CNAP) is supported by the Danish National Research Foundation (DNRF121).
Disclosure
The authors declare no competing interests.
References
1. Rice DA, McNair PJ. Quadriceps arthrogenic muscle inhibition: neural mechanisms and treatment perspectives. Semin Arthritis Rheum. 2010;40(3):250–266. doi:10.1016/j.semarthrit.2009.10.001
2. O’Reilly SC, Jones A, Muir KR, Doherty M. Quadriceps weakness in knee osteoarthritis: the effect on pain and disability. Ann Rheum Dis. 1998;57(10):588–594. doi:10.1136/ard.57.10.588
3. Hart JM, Kuenze CM, Diduch DR, Ingersoll CD. Quadriceps muscle function after rehabilitation with cryotherapy in patients with anterior cruciate ligament reconstruction. J Athl Train. 2014;49(6):733–739. doi:10.4085/1062-6050-49.3.39
4. Rice D, McNair PJ, Dalbeth N. Effects of cryotherapy on arthrogenic muscle inhibition using an experimental model of knee swelling. Arthritis Rheum. 2009;61(1):78–83. doi:10.1002/art.24168
5. Son SJ, Kim H, Seeley MK, Feland JB, Hopkins JT. Effects of transcutaneous electrical nerve stimulation on quadriceps function in individuals with experimental knee pain. Scand J Med Sci Sports. 2016;26(9):1080–1090. doi:10.1111/sms.12539
6. Graven-Nielsen T. Fundamentals of muscle pain, referred pain, and deep tissue hyperalgesia. Scand J Rheumatol Suppl. 2006;122:1–43.
7. Hoheisel U, Mense S. Response behaviour of cat dorsal horn neurones receiving input from skeletal muscle and other deep somatic tissues. J Physiol. 1990;426:265–280. doi:10.1113/jphysiol.1990.sp018137
8. Izumi M, Petersen KK, Arendt-Nielsen L, Graven-Nielsen T. Pain referral and regional deep tissue hyperalgesia in experimental human hip pain models. Pain. 2014;155(4):792–800. doi:10.1016/j.pain.2014.01.008
9. Graven-Nielsen T, Lund H, Arendt-Nielsen L, Danneskiold-Samsoe B, Bliddal H. Inhibition of maximal voluntary contraction force by experimental muscle pain: a centrally mediated mechanism. Muscle Nerve. 2002;26(5):708–712. doi:10.1002/mus.10225
10. Henriksen M, Rosager S, Aaboe J, Graven-Nielsen T, Bliddal H. Experimental knee pain reduces muscle strength. J Pain. 2011;12(4):460–467. doi:10.1016/j.jpain.2010.10.004
11. Park J, Hopkins JT. Induced anterior knee pain immediately reduces involuntary and voluntary quadriceps activation. Clin J Sport Med. 2013;23(1):19–24. doi:10.1097/JSM.0b013e3182717b7b
12. Lepley AS, Gribble PA, Thomas AC, Tevald MA, Sohn DH, Pietrosimone BG. Quadriceps neural alterations in anterior cruciate ligament reconstructed patients: a 6-month longitudinal investigation. Scand J Med Sci Sports. 2015;25(6):828–839. doi:10.1111/sms.12435
13. Hopkins JT, Ingersoll CD, Cordova ML, Edwards JE. Intrasession and intersession reliability of the soleus H-reflex in supine and standing positions. Electromyogr Clin Neurophysiol. 2000;40(2):89–94.
14. Porro CA, Francescato MP, Cettolo V, et al. Primary motor and sensory cortex activation during motor performance and motor imagery: a functional magnetic resonance imaging study. J Neurosci. 1996;16(23):7688–7698. doi:10.1523/JNEUROSCI.16-23-07688.1996
15. Opsommer E, Chevalley O, Korogod N. Motor imagery for pain and motor function after spinal cord injury: a systematic review. Spinal Cord. 2020;58(3):262–274. doi:10.1038/s41393-019-0390-1
16. García Carrasco D, Aboitiz Cantalapiedra J. Effectiveness of motor imagery or mental practice in functional recovery after stroke: a systematic review. Neurologia. 2016;31(1):43–52. doi:10.1016/j.nrl.2013.02.003
17. Eaves DL, Riach M, Holmes PS, Wright DJ. Motor imagery during action observation: a brief review of evidence, theory and future research opportunities. Front Neurosci. 2016;10:514. doi:10.3389/fnins.2016.00514
18. Liepert J, Neveling N. Motor excitability during imagination and observation of foot dorsiflexions. J Neural Transm (Vienna). 2009;116(12):1613–1619. doi:10.1007/s00702-009-0287-9
19. Lin IH, Tsai HT, Wang CY, Hsu CY, Liou TH, Lin YN. Effectiveness and superiority of rehabilitative treatments in enhancing motor recovery within 6 months poststroke: a systemic review. Arch Phys Med Rehabil. 2019;100(2):366–378. doi:10.1016/j.apmr.2018.09.123
20. Bonnet M, Decety J, Jeannerod M, Requin J. Mental simulation of an action modulates the excitability of spinal reflex pathways in man. Brain Res Cogn Brain Res. 1997;5(3):221–228. doi:10.1016/S0926-6410(96)00072-9
21. Cowley PM, Clark BC, Ploutz-Snyder LL. Kinesthetic motor imagery and spinal excitability: the effect of contraction intensity and spatial localization. Clin Neurophysiol. 2008;119(8):1849–1856. doi:10.1016/j.clinph.2008.04.004
22. Oishi K, Kimura M, Yasukawa M, Yoneda T, Maeshima T. Amplitude reduction of H-reflex during mental movement simulation in elite athletes. Behav Brain Res. 1994;62(1):55–61. doi:10.1016/0166-4328(94)90037-X
23. Yahagi S, Shimura K, Kasai T. An increase in cortical excitability with no change in spinal excitability during motor imagery. Percept Mot Skills. 1996;83(1):288–290. doi:10.2466/pms.1996.83.1.288
24. Grosprêtre S, Lebon F, Papaxanthis C, Martin A. New evidence of corticospinal network modulation induced by motor imagery. J Neurophysiol. 2016;115(3):1279–1288. doi:10.1152/jn.00952.2015
25. Grosprêtre S, Lebon F, Papaxanthis C, Martin A. Spinal plasticity with motor imagery practice. J Physiol. 2019;597(3):921–934. doi:10.1113/JP276694
26. Taniguchi S, Kimura J, Yamada T, et al. Effect of motion imagery to counter rest-induced suppression of F-wave as a measure of anterior horn cell excitability. Clin Neurophysiol. 2008;119(6):1346–1352. doi:10.1016/j.clinph.2007.11.179
27. Hopkins J, Ingersoll C, Cordova M, Edwards J. Intrasession and intersession reliability of the soleus H-reflex in supine and standing positions. Electromyogr Clin Neurophysiol. 2000;40(2):89–94.
28. Simoneau E, Martin A, Van Hoecke J. Effects of joint angle and age on ankle dorsi- and plantar-flexor strength. J Electromyogr Kinesiol. 2007;17(3):307–316. doi:10.1016/j.jelekin.2006.04.005
29. Larsen DB, Graven-Nielsen T, Boudreau SA. Pain-induced reduction in corticomotor excitability is counteracted by combined action-observation and motor imagery. J Pain. 2019;20(11):1307–1316. doi:10.1016/j.jpain.2019.05.001
30. Bennell K, Hodges P, Mellor R, Bexander C, Souvlis T. The nature of anterior knee pain following injection of hypertonic saline into the infrapatellar fat pad. J Orthop Res. 2004;22(1):116–121. doi:10.1016/S0736-0266(03)00162-1
31. Oda S, Izumi M, Aso K, Ikeuchi M. Impact of medial versus lateral knee pain on deep tissue hyperalgesia and muscle strength. Eur J Pain. 2018;22(10):1757–1766. doi:10.1002/ejp.1271
32. Rice DA, Graven-Nielsen T, Lewis GN, McNair PJ, Dalbeth N. The effects of experimental knee pain on lower limb corticospinal and motor cortex excitability. Arthritis Res Ther. 2015;17:204. doi:10.1186/s13075-015-0724-0
33. Seeley MK, Park J, King D, Hopkins JT. A novel experimental knee-pain model affects perceived pain and movement biomechanics. J Athl Train. 2013;48(3):337–345. doi:10.4085/1062-6050-48.2.02
34. Lundberg A, Malmgren K, Schomburg ED. Role of joint afferents in motor control exemplified by effects on reflex pathways from Ib afferents. J Physiol. 1978;284:327–343. doi:10.1113/jphysiol.1978.sp012543
35. Harrison PJ, Jankowska E. Sources of input to interneurones mediating group I non-reciprocal inhibition of motoneurones in the cat. J Physiol. 1985;361:379–401. doi:10.1113/jphysiol.1985.sp015651
36. Le Pera D, Graven-Nielsen T, Valeriani M, et al. Inhibition of motor system excitability at cortical and spinal level by tonic muscle pain. Clin Neurophysiol. 2001;112(9):1633–1641. doi:10.1016/S1388-2457(01)00631-9
37. Rossi A, Decchi B. Changes in Ib heteronymous inhibition to soleus motoneurones during cutaneous and muscle nociceptive stimulation in humans. Brain Res. 1997;774(1–2):55–61. doi:10.1016/S0006-8993(97)81687-3
38. Rossi A, Decchi B, Ginanneschi F. Presynaptic excitability changes of group Ia fibres to muscle nociceptive stimulation in humans. Brain Res. 1999;818(1):12–22. doi:10.1016/S0006-8993(98)01253-0
39. Hopkins J, Ingersoll CD, Edwards J, Klootwyk TE. Cryotherapy and transcutaneous electric neuromuscular stimulation decrease arthrogenic muscle inhibition of the vastus medialis after knee joint effusion. J Athl Train. 2002;37(1):25–31.
40. Hale BS, Raglin JS, Koceja DM. Effect of mental imagery of a motor task on the Hoffmann reflex. Behav Brain Res. 2003;142(1–2):81–87. doi:10.1016/S0166-4328(02)00397-2
41. Kaneko F, Shibata E, Hayami T, Nagahata K, Aoyama T. The association of motor imagery and kinesthetic illusion prolongs the effect of transcranial direct current stimulation on corticospinal tract excitability. J Neuroeng Rehabil. 2016;13:36. doi:10.1186/s12984-016-0143-8
42. Li S, Latash ML, Zatsiorsky VM. Effects of motor imagery on finger force responses to transcranial magnetic stimulation. Brain Res Cogn Brain Res. 2004;20(2):273–280. doi:10.1016/j.cogbrainres.2004.03.003
43. Grosprêtre S, Ruffino C, Lebon F. Motor imagery and cortico-spinal excitability: a review. Eur J Sport Sci. 2016;16(3):317–324. doi:10.1080/17461391.2015.1024756
44. Hétu S, Grégoire M, Saimpont A, et al. The neural network of motor imagery: an ALE meta-analysis. Neurosci Biobehav Rev. 2013;37(5):930–949. doi:10.1016/j.neubiorev.2013.03.017
45. Hardwick RM, Caspers S, Eickhoff SB, Swinnen SP. Neural correlates of action: comparing meta-analyses of imagery, observation, and execution. Neurosci Biobehav Rev. 2018;94:31–44. doi:10.1016/j.neubiorev.2018.08.003
46. Jeannerod M. The representing brain: neural correlates of motor intention and imagery. Behav Brain Sci. 2010;17(2):187–202. doi:10.1017/S0140525X00034026
47. Ruffino C, Papaxanthis C, Lebon F. Neural plasticity during motor learning with motor imagery practice: review and perspectives. Neuroscience. 2017;341:61–78. doi:10.1016/j.neuroscience.2016.11.023
48. Guillot A, Collet C. Contribution from neurophysiological and psychological methods to the study of motor imagery. Brain Res Brain Res Rev. 2005;50(2):387–397. doi:10.1016/j.brainresrev.2005.09.004
49. Farina D, Arendt-Nielsen L, Merletti R, Graven-Nielsen T. Effect of experimental muscle pain on motor unit firing rate and conduction velocity. J Neurophysiol. 2004;91(3):1250–1259. doi:10.1152/jn.00620.2003
50. Park J, Ty Hopkins J. Immediate effects of acupuncture and cryotherapy on quadriceps motoneuron pool excitability: randomised trial using anterior knee infusion model. Acupunct Med. 2012;30(3):195–202. doi:10.1136/acupmed-2012-010144
51. Blackburn JT, Pamukoff DN, Sakr M, Vaughan AJ, Berkoff DJ. Whole body and local muscle vibration reduce artificially induced quadriceps arthrogenic inhibition. Arch Phys Med Rehabil. 2014;95(11):2021–2028. doi:10.1016/j.apmr.2014.07.393
52. Pietrosimone B, McLeod MM, Florea D, Gribble PA, Tevald MA. Immediate increases in quadriceps corticomotor excitability during an electromyography biofeedback intervention. J Electromyogr Kinesiol. 2015;25(2):316–322. doi:10.1016/j.jelekin.2014.11.007
53. Hopkins JT. Knee joint effusion and cryotherapy alter lower chain kinetics and muscle activity. J Athl Train. 2006;41(2):177–184.
54. Pietrosimone BG, Saliba SA, Hart JM, Hertel J, Kerrigan DC, Ingersoll CD. Effects of transcutaneous electrical nerve stimulation and therapeutic exercise on quadriceps activation in people with tibiofemoral osteoarthritis. J Orthop Sports Phys Ther. 2011;41(1):4–12. doi:10.2519/jospt.2011.3447
55. Farina D, Arendt-Nielsen L, Roatta S, Graven-Nielsen T. The pain-induced decrease in low-threshold motor unit discharge rate is not associated with the amount of increase in spike-triggered average torque. Clin Neurophysiol. 2008;119(1):43–51. doi:10.1016/j.clinph.2007.10.003
56. Sohn MK, Graven-Nielsen T, Arendt-Nielsen L, Svensson P. Inhibition of motor unit firing during experimental muscle pain in humans. Muscle Nerve. 2000;23(8):1219–1226. doi:10.1002/1097-4598(200008)23:8<1219::AID-MUS10>3.0.CO;2-A
 © 2021 The Author(s). This work is published and licensed by Dove Medical Press Limited. The
full terms of this license are available at https://www.dovepress.com/terms
and incorporate the Creative Commons Attribution
- Non Commercial (unported, 3.0) License.
By accessing the work you hereby accept the Terms. Non-commercial uses of the work are permitted
without any further permission from Dove Medical Press Limited, provided the work is properly
attributed. For permission for commercial use of this work, please see paragraphs 4.2 and 5 of our Terms.
© 2021 The Author(s). This work is published and licensed by Dove Medical Press Limited. The
full terms of this license are available at https://www.dovepress.com/terms
and incorporate the Creative Commons Attribution
- Non Commercial (unported, 3.0) License.
By accessing the work you hereby accept the Terms. Non-commercial uses of the work are permitted
without any further permission from Dove Medical Press Limited, provided the work is properly
attributed. For permission for commercial use of this work, please see paragraphs 4.2 and 5 of our Terms.