Back to Journals » Cancer Management and Research » Volume 12
Programmed Death-1 Receptor (PD-1) as a Potential Prognosis Biomarker for Ovarian Cancer Patients
Authors Pawłowska A ![]() , Suszczyk D
, Suszczyk D ![]() , Tarkowski R, Paduch R
, Tarkowski R, Paduch R ![]() , Kotarski J, Wertel I
, Kotarski J, Wertel I ![]()
Received 28 May 2020
Accepted for publication 3 September 2020
Published 7 October 2020 Volume 2020:12 Pages 9691—9709
DOI https://doi.org/10.2147/CMAR.S263010
Checked for plagiarism Yes
Review by Single anonymous peer review
Peer reviewer comments 2
Editor who approved publication: Professor Harikrishna Nakshatri
Anna Pawłowska,1 Dorota Suszczyk,1 Rafał Tarkowski,2 Roman Paduch,3 Jan Kotarski,2 Iwona Wertel1
1Independent Laboratory of Cancer Diagnostics and Immunology, I Chair and Department of Oncological Gynaecology and Gynaecology, Medical University of Lublin, Lublin 20-081, Poland; 2I Chair and Department of Oncological Gynaecology and Gynaecology, Medical University of Lublin, Lublin 20-081, Poland; 3Department of Virology and Immunology, Maria Curie-Sklodowska University, Lublin 20-033, Poland
Correspondence: Anna Pawłowska
Independent Laboratory of Cancer Diagnostics and Immunology, I Chair and Department of Oncological Gynaecology and Gynaecology, Medical University of Lublin, Staszica 16, Lublin 20-081, Poland
Tel +48 81532 7847
Fax +48 81532 0608
Email [email protected]
Aim: Ovarian cancer (OC) is one of the most lethal gynecological malignancies. Recent studies suggest a crucial role of the PD-1/PD-L1 pathway in OC pathogenesis. Therefore, our study aimed at evaluation of the clinical importance of PD-1 expression in ovarian cancer patients.
Patients and Methods: In this study, we investigated the role of PD-1 in OC patients (n=50) by analyzing its expression on CD4+ and CD8+ T cells in three OC environments: peripheral blood (PB), peritoneal fluid (PF), and tumor (TT) as well as soluble PD-1 (sPD-1) in plasma and PF in terms of their clinical and prognostic significance. T cells with PD-1 expression were analyzed using flow cytometry. The concentration of sPD-1 was determined with the use of ELISA. Our research demonstrated differences in PD-1 expression on CD4+ and CD8+ T cells in the OC environments.
Results: We found an elevated level of CD4+PD-1+ T cells in tumor and PF, compared to PB. Additionally, we found the highest percentage of CD8+ PD-1+ in tumor, compared to PB and PF. The levels of sPD-1 were higher (p< 0.0001) in plasma than in PF. For the first time, we discovered that the higher level of CD4+PD-1+ T cells in the circulation and the higher sPD-1 level in plasma predict poor survival of OC patients.
Conclusion: We suggest that PD-1 could be a predictive biomarker for OC patients and successful immunotherapy.
Keywords: ovarian cancer, programmed cell death receptor 1, PD-1/PD-L1, grading, survival, immunotherapy
Introduction
Ovarian cancer (OC) is one of the most lethal gynecological cancers.1,2 In terms of occurrence, OC ranks the third, after cervical and uterine cancer, among all female reproductive tract malignancies. In the United States in 2017, there were 22,400 new cases of OC and 14,080 deaths caused by OC. Significantly, the number of deaths caused by OC is higher than in the case of corpus uteri malignancies and lower than in cervical cancer.3 As reported by Kurman and Shih, the survival of OC patients depends on the cancer type.4,5 The classification is based on the dualistic model of carcinogenesis: histopathological and molecular background. Moreover, the classification includes malignancy and genetic mutations.4,5
Type I is a large cystic neoplasm that is frequently unilateral, including low-grade serous, mucinous, seromucinous, endometrioid, clear cell carcinoma, and malignant Brenner tumor. Type I carcinomas are usually genetically stable. The most frequent somatic mutations are found in ARID1A, ERK, MAP, KRAS, BRAF, PIK3CA, and PTEN. Most frequently, this type is diagnosed at International Federation of Gynecology and Obstetrics (FIGO) stage I or II and the progression is indolent and slow. The prognosis is favorable for OC patients with I type carcinoma, resulting in a 10% patient mortality rate.4,5
Far poorer prognosis is associated with type II tumors. Unfortunately, approximately 75% of them are diagnosed at the advanced III or IV FIGO stages. Type II carcinoma is highly aggressive, develops rapidly, and is frequently accompanied by ascites. This type includes high-grade serous carcinomas, undifferentiated carcinomas, and carcinosarcomas. Type II tumors exhibit chromosomal instability and anomalies in homologous recombination repair, FOXM1, Notch3 and cyclin E, retinoblastoma protein, and very often the presence of the TP53 mutation.4,5
One of the causes of the high lethality of OC patients is the lack of biomarkers and screening methods.1,2 Consequently, most cases are diagnosed in the advanced FIGO III or IV stage, when the prognosis is poor. Diagnosis of OC at advanced stages is also related to the extreme heterogeneity of the cancer, including molecular, genetic, and immunologic aspects. Recent literature data suggest a crucial role of the immune system in OC development. Thus, researchers are looking for OC prognostic markers within the host immune system.6
Considering the heterogeneity of OC, its genetic complexity, and DNA repair dysfunctions should be emphasized. There are two main pathways involved in repairing double-strand break of DNA (DSB), ie homologous recombination (HR) and non-homologous and joining (NHEJ) recombination. It is well established that an increase in the genomic instability in cancer cells may lead to their death. Poly (ADP-ribose) polymerase (PARP) is a well-known factor involved in single-strand DNA damage detection and repair. Inhibitors of PARP (PARPi) bind to PARP, which prevents from DNA damage repair and finally leads to the death of cancer cells. Moreover, cells that show mutations in BRCA1 and BRCA2 are defective in terms of DSB repair that is dependent on a single-strand break (SSB) repair axis controlled via PARP. Both BRAC1 and BRCA2 are involved in DSB damage repair based on HR repair. Nevertheless, BRCA1 takes part in the regulation of transcription and controlling the cell cycle checkpoints. On the other hand, BRCA2 more directly control HR repair via RAD51 regulation. Noteworthy, the cumulative risk of OC for BRCA1 and BRCA2 mutation carriers is 44% and 17%, respectively, in comparison to the general population, in which the total risk is 1.3%. There are also other somatic mutations that take part in HR repair, ie ATR, RAD51B, ATM, BAP1, CHEK1, CHEK2, FANCC, FANCD2, FANCE, FANCF, MRE11A, PALB2, NBS1, WRN, FANCA, BLM, RAD51C, RAD51D, and CDK12. It should be highlighted that the FDA approved PARPi including olaparib, rucaparib, and niraparib in OC treatment.7
The main subpopulation of cells that recognize and eliminate cancer cells are effector T cells.2,8 The cytotoxic activity of T cells depends on immune-modulatory signals they receive. Among them, there are both co-stimulating signals and inhibitors. Inhibition of antitumor response is possible via the production of appropriate cytokines and immunomodulators. Consequently, T cells are not sensitive to the relevant antigen, which is a phenomenon referred to as anergy.8 This not only has an influence on cancer progression but also inhibits treatment efficiency.2
Tumor-infiltrating lymphocytes (TILs) are prognostic factors in many solid tumors, including OC.9 Depending on the infiltration of TILs, tumors are categorized as cold or hot ones, and the treatment option is dependent on the classification. High T-cell density (mainly CD8+) is typical for hot tumors. In this group of patients, implementation of treatment based on immune checkpoint inhibitors may turn out effective. Cold tumors are not immunogenic because of the absence of TILs. Consequently, cold-tumor patients are resistant to conventional treatment. Cancer cells may evade the host immune system response in many ways, including immune checkpoints.11
Hamanishi et al in their study have demonstrated that the programmed cell death receptor 1 (PD-1, B7-H1) and its ligand PD-L1 play a crucial role in the suppression of immune system response against cancer cells.13 As suggested by the name, it was initially found that PD-1 plays an important role in programmed cell death of T cells.12 In normal conditions, the PD-1 receptor exists on activated B and T cells. Ligands of PD-1 (PD-L1 and PD-L2) are mainly expressed on immune cells and cancer cells. Binding the PD-1 receptor on the T cell and its ligand leads to T cell anergy or elimination thereof through apoptosis.12,14 Many studies report that PD-L1 is expressed in multiple types of tumors, including kidney cancer, lung cancer, melanoma, and ovarian cancer.12,15,16 Thus, the PD-1/PD-L1 pathway is of the utmost importance in OC because PD-L1 is detected in a majority, ie approximately 70% of cases.15 In normal conditions, they play a crucial role in the inhibition of the overreaction of the immune system against host self-tissues, prevent autoimmunity reactions, and provide peripheral tolerance. Thereby, they keep the immune system response in check.11,17 Currently, they seem to be the most compelling tool in OC treatment.2
The treatment based on PD-1 inhibitors is associated with considerable costs and side effects. Thus, it is essential to search for biomarkers that assist in the selection of OC patients groups in which the therapy will be beneficial and will help to save time for the implementation of other treatment for non-responders. There are rationales that the neutrophil-to-lymphocyte ratio (NLR) may be a potential predicting factor for OC patients treated with both anti-PD-1 and anti-PD-L1 mAbs. Interestingly, in patients that undergo combined treatment of targeted therapies using immune checkpoint inhibitors and conventional chemotherapy, NLR seems to be a promising predicting biomarker. Moschetta and co-workers have demonstrated that a reduced NLR in OC patients that receive at least two cycles of PD-1/PD-L1 mAbs is related to favorable PFS. Surprisingly, changes in NLR are dependent not on absolute lymphocyte count (ALC) but on absolute neutrophil count (ANC). The main target of PD-1/PD-L1 checkpoint inhibitors are T cells. However, these findings indicate that neutrophils also interact with TME.18
Poor prognosis in patients with advanced stages of OC and platinum resistance in recurrent OC necessitate searching for new and more effective therapies.12,19 There is growing evidence that combined therapies may turn out efficient in OC treatment. One of them is a combination of PARPi and anti-PD-1/PD-L1 mAbs. There is ongoing research on a combination of PARPi and agents that lead to HR inhibition. The desired effect is to sensitize OC with HR proficiency to PARPi and implement the therapy not only in HR deficient OC. The combination of PARPi and anti-PD-1/PD-L1 agents is primarily based on a hypothesis that both wild-type BRCA1/2 and BRCA1/2 HR deficiency OC are related to an increased level of neoantigen load in comparison to HR proficient OC. The result is a more efficient anticancer immune response. Thus, in selecting a patient group for target therapy, the predominant aim is to investigate markers other than BRCA1/2 and HR status. Equally important is to establish the risk of adverse effects in combined therapies. However, the treatment dose optimization is based on a dose escalation, which is related to costliness. Nevertheless, it is essential to determine the overall risk-benefit profile of these therapies.20
Moreover, recognition of other markers that influence survival may be helpful in the selection of treatment and increasing patients’ lifetime.21 Since the monitoring of tumor development and efficiency of the implemented therapy via traditional biopsy is difficult, scientists in the field of gynecological oncology, and at the community large are looking for noninvasive methods that reflect tumor dynamics.22,23 Liquid biopsy is a noninvasive approach simultaneously offering high specificity and fitting into the paradigm of precision medicine.24,25 It is a promising minimally invasive tool for detecting and monitoring tumor in real time in diverse body fluids, including peripheral blood, in place of a tumor sample. In ovarian cancer, the soluble form of PD-1 (sPD-1) may offer this opportunity. However, the implementation of liquid biopsy in clinical practice requires further investigations to validate and standardize preanalytical, analytical, and postanalytical aspects.26
Therefore, the aim of our study was to evaluate the prevalence of PD-1 expression on CD4+ and CD8+ T cells in three different ovarian cancer microenvironments, ie peripheral blood (PB), peritoneal fluid (PF), and tumor (TT), and to analyze its correlation with clinicopathological characteristics and prognosis in OC patients. We also evaluated the plasma and PF concentration of soluble PD-1 in terms of its diagnostic and prognostic significance.
Patients and Methods
Patients, Ethic Statement, Standard Protocol Approvals
In this study, we included 50 patients with epithelial ovarian cancer whose diagnosis had been confirmed by pathological reports. All the tumors were staged according to the International Federation of Gynecologists and Obstetricians (FIGO classification).27 The tumors were graded and classified according to the Silverberg grading system by two independent gynecological pathologists.28 The tumor type was determined according to the Kurman and Shih classification.2 Patients that had undergone radical treatment at the I Chair and Department of Oncological Gynaecology and Gynaecology (Independent Public Clinical Hospital No. 1, Medical University of Lublin, Poland) were enrolled in the study. The exclusion criteria for the study cohort included a history of previous malignancies, chemotherapy, or radiation therapy prior to surgery as well as allergic, autoimmune, and infectious diseases. Data, eg the data on the overall survival (OS) of the patients were obtained from the Document Personalization Center of the Ministry of Internal Affairs and Administration, Department of Protection of Confidential Information in Warsaw.
Written informed consent was obtained from all patients. The research received the approval of the Bioethics Committee at the Medical University of Lublin (KE-0254/280/2015).
The control group included 15 healthy donors at the age of 21–51 (median 29 years). The PB of the control group was obtained from the Regional Centre of Blood Donation and Blood Treatment in Lublin. Every patient signed a written consent to participate in the study and the experiments were conducted in accordance with the Declaration of Helsinki.
The clinical characteristics of the OC patients are summarized in Table 1.
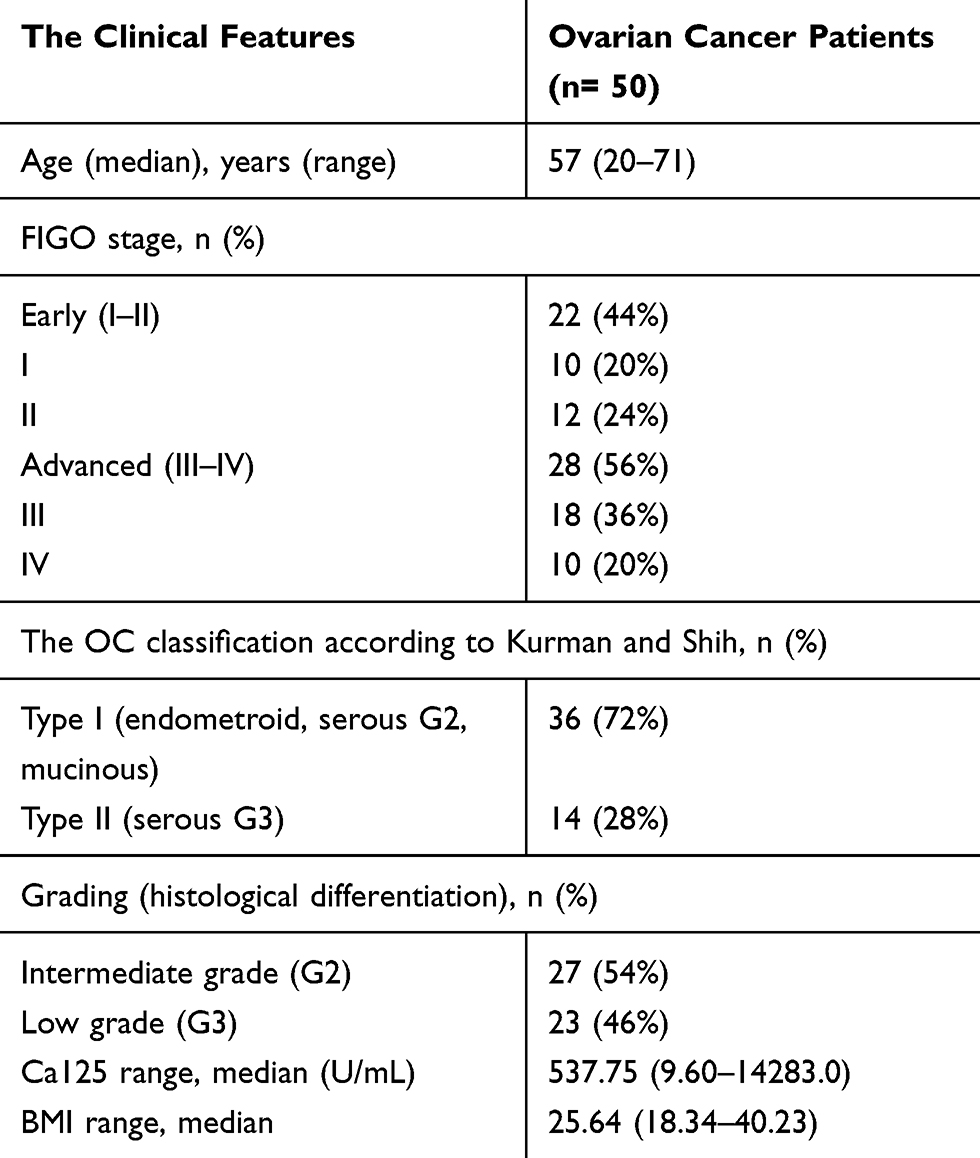 |
Table 1 The Clinical Characteristics of OC Patients |
Isolation of Mononuclear Cells (MNCs)
All PB samples were collected before the surgical procedure into heparinized tubes (Sarstedt, Germany) and immediately processed. Mononuclear cells (MNCs) were separated by density gradient centrifugation at 700 x g with Gradisol L (AquaMedica, Poland) at room temperature for 20 minutes. Then, interphase cells were collected, washed twice, and resuspended in phosphate-buffered saline (PBS, PAA Laboratories GmbH, Austria).
Peritoneal fluid and tumor tissue were collected aseptically during the operation. PF mononuclear cells were isolated by density gradient centrifugation at 700 x g on Gradisol L (AquaMedica, Poland) at room temperature for 20 minutes. The subsequent procedure was the same as for MNCs isolated from PB.
For isolation of tumor-infiltrating MNCs, freshly resected tumor tissue was minced, placed into a gentleMACS C tube, and processed using a Tumor Dissociation Kit (Miltenyi Biotec). The resulting cell suspension was filtered through a 70-mm mesh filter (BD Biosciences) and subjected to density centrifugation at 700 x g on Gradisol L (AquaMedica, Poland) at room temperature for 20 minutes. Then, interphase cells were collected, washed twice, and resuspended in phosphate-buffered saline (PBS, PAA Laboratories GmbH, Austria). The viability of the MNCs obtained was determined by trypan blue staining and was always >95%. Viable cells were quantified in a Neubauer chamber.
Flow Cytometric Analysis
Mononuclear cells (1×10⁶ cells) isolated from PB, PF, and tumor tissue were incubated with fluorochrome-labeled monoclonal antibodies (mAbs) against cell-surface markers: anti-CD3 FITC, anti-CD4 PerCP-Cy5.5, anti-CD8 APC-Cy7, and anti-PD-1 APC (BD Bioscience, USA) for 20 min at room temperature. Next, the cells were washed twice with PBS and the percentage of CD4+PD-1+ and CD8+PD-1+ T cells were analyzed using flow cytometry (FACSCanto I Becton Dickinson, USA). For each analysis, 100,000 events were acquired and analyzed using FacsDiva software. Dot plots illustrating the method for the identification of CD4+PD-1+and CD8+PD-1+T cells are shown in Figure 1.
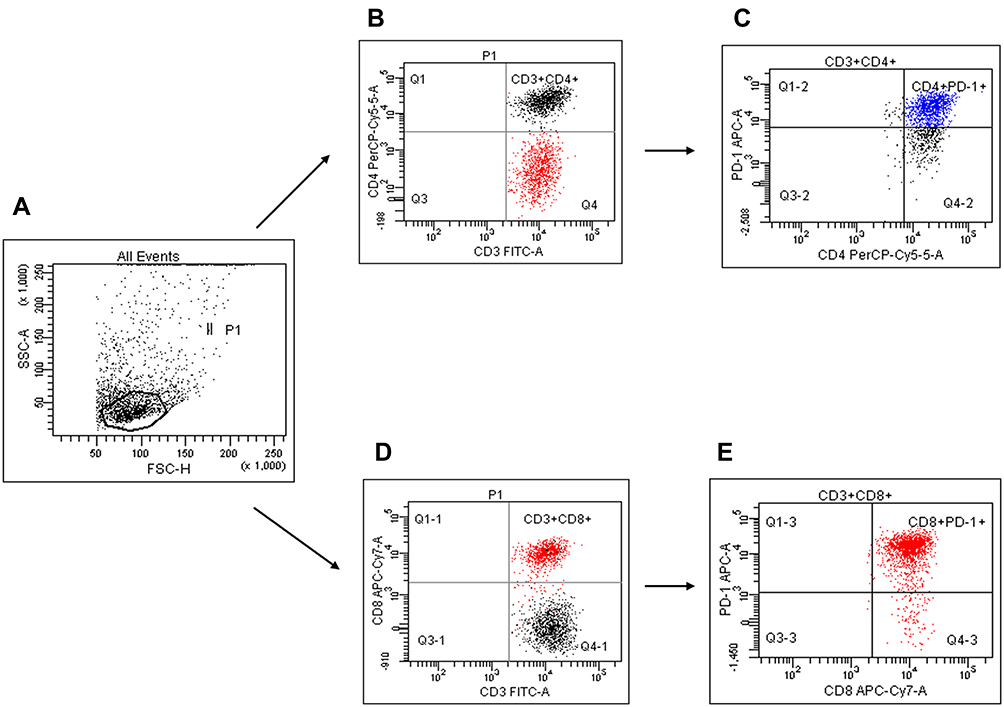 |
Figure 1 Flow cytometric analysis of tumor CD4+PD-1+ and CD8+PD-1+ T cells in ovarian cancer patients. Figure 1 shows representative data from OC patients, illustrating the method for identification of CD4+PD-1+ and CD8+PD-1+ T cells in the tumor. An acquisition gate was established based on FSC and SSC that included mononuclear cells. Population P1 was drawn around the lymphocytes (A). Next, the P1 gated events were analyzed for CD3/CD4 staining (B) and CD3/CD8 staining (D). The final dot plots of CD4+ and CD8+ with PD-1 expression were established by combined gating of events using population P1 and region Q2 or Q2-1, respectively. Isotype-matched mAbs were used to verify the staining specificity and as a guide for setting the markers to delineate positive and negative populations. The number in the upper right quadrant on the dot plot (C) represents the percentage of CD4+PD-1+ T cells and that on the dot plot (E) shows the percentage of CD8+PD-1+ T cells. |
ELISA
Soluble PD-1 levels in plasma and PF were determined with an immunoassay kit (Biorbyt LLC., San Francisco, California, USA) following the manufacturer’s protocol. Plate absorbance was read on an ELX-800 plate reader (BioTek Instruments, Inc, USA) and analyzed using Gen5_ (BioTek Instruments, Inc). Concentrations of sPD-1 (pg/mL) were calculated by interpolation from a standard curve.
Statistical Analysis
The statistical analysis of results was conducted using Statistica 12.0 PL.
The Wilcoxon paired test was used to compare the results from PB, PF, and tumor tissue. The Mann–Whitney U-test was applied to the results of the statistical comparison between the studied groups (Control/OC). Relationships between two parameters were investigated using Spearman’s rank correlation test. The data are presented as median, minimum, and maximum.
The probabilities of overall survival (OS) were estimated using the Kaplan–Meier method and differences in the survival curves were calculated with the logrank test; a p value less than 0.05 was considered statistically significant.
Results
Percentage of CD3+, CD4+, and CD8+ T Cells in Peripheral Blood, Peritoneal Fluid, and Tumor Tissue from OC Patients
The highest percentage of CD3+ T cells was detected in the peritoneal fluid of the OC patients, and it was significantly higher (p<0.0001) than in the peripheral blood and tumor. The percentage of CD3+ T cells in PB was elevated (p<0.01) in comparison to the percentage of tumor-infiltrating CD3+ T cells (Figure 2A).
 |
Figure 2 The percentage of CD3+ (A), CD4+ (B), CD8+ (C) T cells in peripheral blood, peritoneal fluid, and among ovarian cancer infiltrating cells. |
The highest percentage of CD4+ T cells was detected in the PB of the OC patients, and it was significantly higher than the number detected in tumor tissue and PF (p<0.0001 and p<0.01, respectively, Figure 2B).
The highest percentage of CD8+ T cells was detected among the tumor-infiltrating T cells, and it was higher than those detected in PF (p=0.07) and PB (p=0.09); however, the differences were not statistically significant (Figure 2C).
We also evaluated the relationship between the percentage of CD3+, CD4+, and CD8+ T cells in PB, PF, and tumor tissue and the 5-year survival rate, but the results were not statistically significant (p>0.05). However, the patients with the higher percentage of CD3+ T cells in PB had a longer survival than those with the lower level of CD3+ (49 vs 38 months).
Expression of PD-1 on CD4+ and CD8+ T Cells in Peripheral Blood, Peritoneal Fluid, and Tumor from OC Patients
The percentage of tumor-infiltrating and peritoneal fluid CD4+PD-1+ lymphocytes were significantly higher than in the peripheral blood (p<0.0001). Similarly, we observed an elevated (p<0.01) percentage of CD4+PD-1+ tumor-infiltrating lymphocytes compared to those detected in the PF of the ovarian cancer patients (Figure 3A).
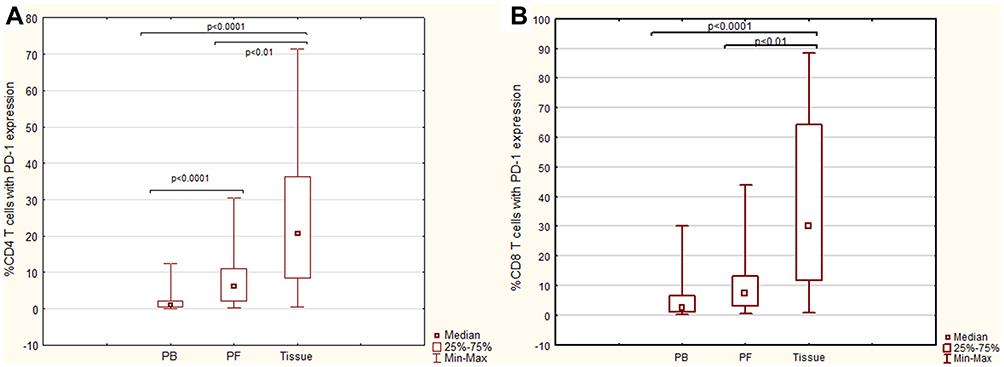 |
Figure 3 The percentage of CD4+PD-1+ (A), CD8+ PD-1+ (B) T cells in peripheral blood, peritoneal fluid, and among ovarian cancer infiltrating cells. |
Moreover, in the OC patients, we observed a significantly elevated (p<0.0001) percentage of tumor-infiltrating CD8+PD-1+ lymphocytes compared to that in peripheral blood as well as higher (p<0.01) accumulation of tumor-infiltrating CD8+PD-1+ lymphocytes compared to the PF of the patients (Figure 3B).
Comparison of the Percentage of CD4+PD-1+ and CD8+PD-1+ T Cells in the PB of OC Patients and Healthy Donors
The percentages of both CD4+PD-1+ (Figure 4A) and CD8+PD-1+ (Figure 4B) T cells in PB were significantly higher (p<0.0001) in the control group in comparison to the results in the OC patient group.
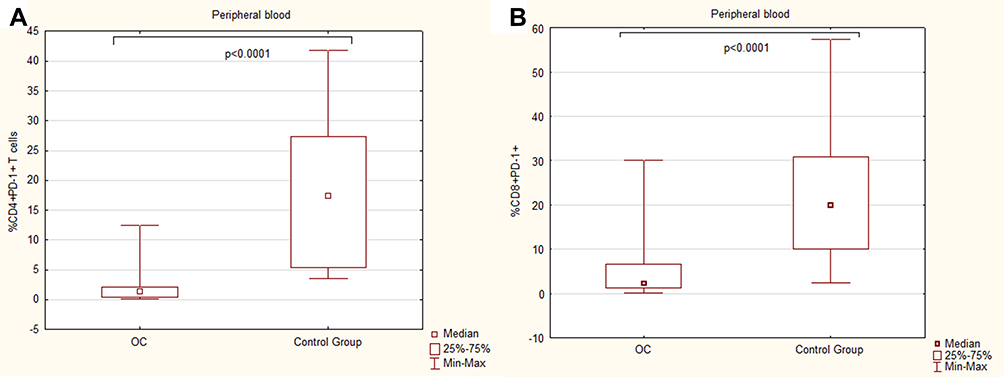 |
Figure 4 The percentage of CD4+PD-1+ (A), CD8+ PD-1+ (B) T cells in peripheral blood of OC patients and control group. |
Percentage of CD4+PD-1+ and CD8+PD-1+ T Cells in Patients with a Different FIGO Stage, Grade, and Histological Type of Ovarian Cancer
The percentages of CD4+PD-1+ T cells in the PB and tumor did not differ significantly (p>0.05) between the OC patients with a different FIGO stage, grade, or type of tumor according to the Kurman and Shih classification. Interestingly, we detected significantly higher (p<0.05) accumulation of CD4+PD-1+ T cells in the PF samples from patients with grade 3 than those with grade 2 of OC (Figure 5A). There were no differences in the percentage of PF CD4+PD-1+ T cells in patients with the different FIGO stage or type of OC (p>0.05).
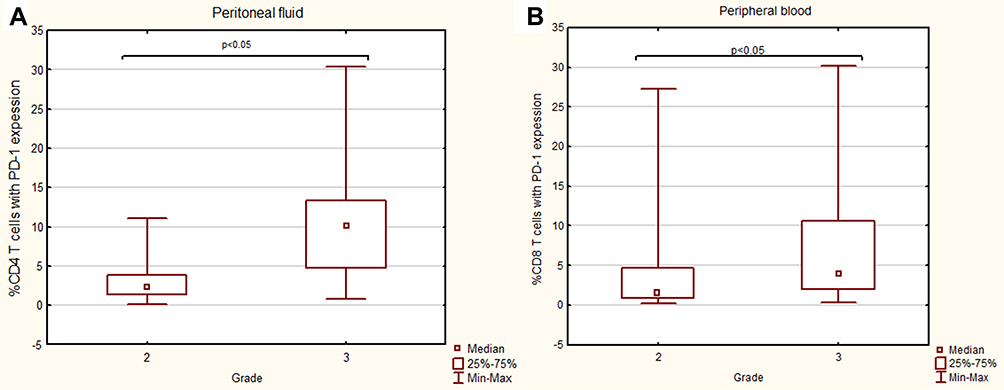 |
Figure 5 The percentage of CD4+PD-1+ (A), CD8+ PD-1+ (B) T cells in patients with different grade of OC. |
The percentages of CD8+PD-1+ T cells in the PF and tumor did not differ significantly (p>0.05) between the patients with the different FIGO stage, grade, or type of OC. In contrast, the percentage of CD8+PD-1+ lymphocytes was significantly higher (p<0.05) in the PB of patients with grade 3 than those with grade 2 of OC (Figure 5B).
Relationship Between Clinicopathological Characteristics of OC Patients and PD-1 Expression on CD4+ and CD8+ T Cells in PB, PF, and Tumor
The percentage of CD4+PD-1+ T cells in PF correlates positively (R Spearman: 0.536; t (N-2) 2.914; p=0.008) with the grade of OC.
There was also a relationship between the percentage of the CD4+PD-1+ T cells in PF and the age of the OC patients (R Spearman: 0.42; t (N-2) 2.14; p=0.04).
There was no relationship between the percentage of CD4+PD-1+ T cells in PB, PF, and tumor and the FIGO stage or the tumor type or between CD4+PD-1+ T cells in PB and tumor tissue and the grade of OC (p>0.05).
The percentages of CD8+PD-1+ T cells in PB and PF, but not in the tumor, correlate positively with the grade of OC (R Spearman: 0.325; t (N-2) 2.259; p=0.02 and R Spearman: 0.433; t(N-2) 2.098; p=0.04, respectively).
There was a relationship between the percentages of CD8+PD-1+ T cells and BMI of OC patients (R Spearman: 0.29; t(N-2) 2.03; p=0.04).
There was no relationship between the percentages of CD8+PD-1+ T cells in PB, PF, and tumor tissue and the FIGO stage or type of OC (p>0.05).
The percentages of CD4+PD-1+ and CD8+PD-1+ T cells in PB, PF, and tumor tissue did not differ significantly (p>0.05) between pre- and postmenopausal patients.
Relationship Between the Percentage of CD4+ and CD8+ T Cells with PD-1 Expression in PB, PF, and Tumor and the Level of Ca125
There was a relationship between the percentage of CD8+PD-1+ T cells in tumor tissue (R Spearman: 0.36; t(N-2) 2.13; p=0.04) and CD4+PD-1+ in PB (R Spearman: 0.28; t(N-2) 1.99; p=0.05) and Ca125 levels (Figure 6A and B).
 |
Figure 6 Relationship between the percentage of CD4+PD-1+ (A) and CD8+PD-1+ (B) and the level of Ca125 in OC patients. |
Assessment of Mutual Correlations Between the Percentage of CD4+ and CD8+ T Cells with PD-1 Expression in OC Patients and the Control Group
The percentages of CD4+PD-1+ T cells correlate positively with the percentages of CD8+PD-1+ T cells in peripheral blood and tumor tissue, but not in the PF of the OC patients (Figure 7). There was also a positive correlation between the percentage of CD4+PD-1+ T cells and CD8+PD-1+ T cells in the peripheral blood of healthy donors (Table 2).
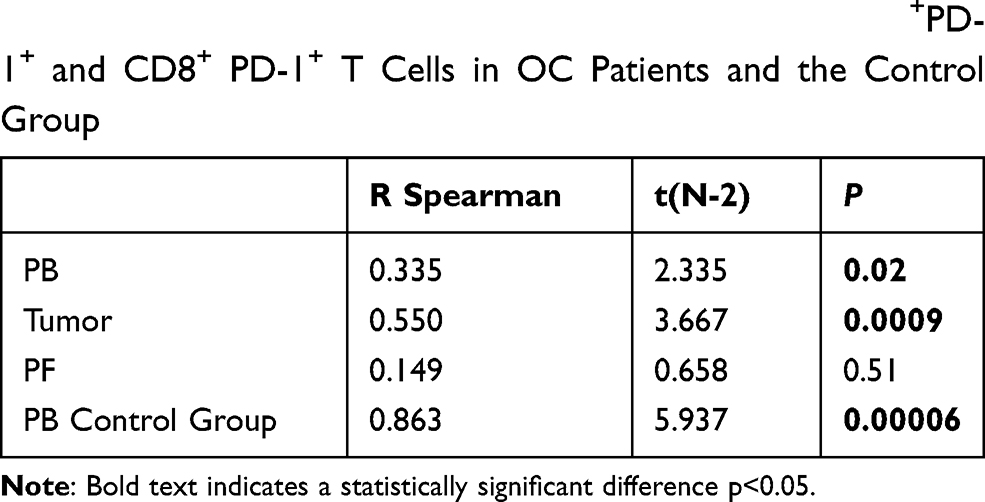 |
Table 2 The Correlation Between the Percentage of CD4+PD-1+ and CD8+ PD-1+ T Cells in OC Patients and the Control Group |
 |
Figure 7 The correlation between the percentage of CD4+PD-1+ and CD8+ PD-1+ T cells in peripheral blood (A), tumor (B) of OC patients and peripheral blood of control group (C). |
Concentration of Soluble PD-1 in the Plasma and Peritoneal Fluid of Patients with Ovarian Cancer and the Control Group
The concentrations of sPD-1 in the peritoneal fluid (median 30.59, range 12.98–47.64 pg/mL) and plasma (median 75.06, range 38.58–114.25 pg/mL) of the patients with ovarian cancer and the control group (median 52.37, range 41.53–60.98 pg/mL) are presented in Figure 8A and B. The plasma sPD-1 concentration was higher in the group of patients with OC in comparison to the control group; however, the difference was not statistically significant (p>0.05)
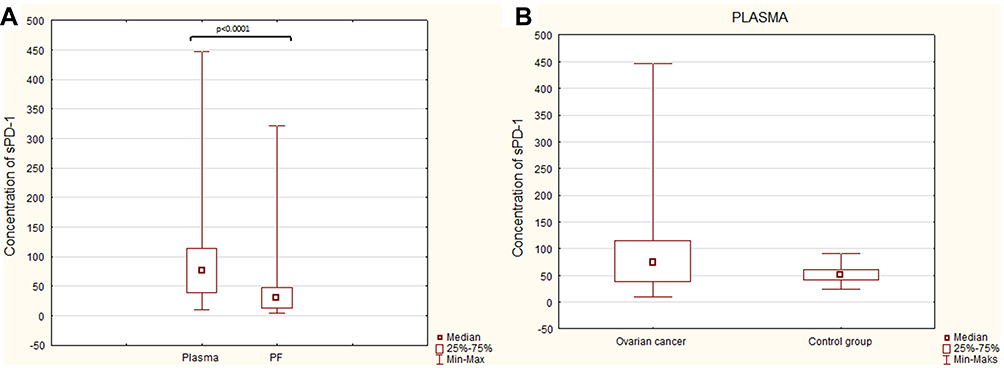 |
Figure 8 Levels of sPD-1 (pg/mL) in the plasma and PF of patients with ovarian cancer (A) and in the plasma of patients with OC and healthy donors (B). |
In the ovarian cancer group, the sPD-1 concentrations were significantly higher (p<0.0001) in the plasma than in the peritoneal fluid (Figure 8A).
Concentration of Soluble PD-1 in Patients with Ovarian Cancer Differing in the FIGO Stage, Grade, and Histological Type
The sPD-1 levels in the PF of patients with FIGO stage III–IV were significantly higher (p<0.05) than in those with FIGO stage I–II cancer (Figure 9). There were no significant differences in the PD-1 levels in the peritoneal fluid related to the tumor grade or type of OC.
 |
Figure 9 Levels of sPD-1 (pg/mL) in the PF of patients with different FIGO stages of ovarian cancer. |
The plasma sPD-1 levels did not differ significantly between the different FIGO stages, grades, or types of OC according to the Kurman and Shih classification.
Assessment of Correlations Between the Level of sPD-1 in Plasma and PF and Clinical Data of OC Patients
There was a relationship between the sPD-1 level in PF and the FIGO stage (R Spearman: 0.402; t (N-2) 2.245; p=0.03), but no correlation was found with the grade or type of ovarian cancer (p>0.05).
There was no relationship between the plasma sPD-1 level and the FIGO stage, grade, and type of ovarian cancer in the patients (p>0.05).
Relationship Between the Percentage of CD4+ and CD8+ T Cells with PD-1 Expression and the Soluble PD-1 Level in the Plasma and PF of OC Patients
The expression of the PD-1 molecule on CD4+ and CD8+ T cells did not correlate significantly with the levels of soluble PD-1 in the plasma and ascites in the ovarian cancer patients (p>0.05).
Clinical Parameters and Association with Survival of OC Patients
We evaluated the relationship between the clinical parameters and the 5-year survival of the OC patients. We found that patients diagnosed with advanced disease (FIGO stage III and IV) had shorter OS than those with FIGO stage I and II of the disease (median 33 vs 60 months), and the difference was statistically significant (p<0.001). Additionally, patients diagnosed with tumor grade 3 had shorter OS than those with grade 2 of OC (median 34 vs 51.5 months). The type of OC according to the Kurman and Shih classification was not correlated statistically significantly with patient survival (p>0.05). The premenopausal patients had a median OS of 60 months versus median OS of 39 months in the postmenopausal ones (p<0.01). Significant parameters for these correlations are shown in Kaplan–Meier plots (Figure 10).
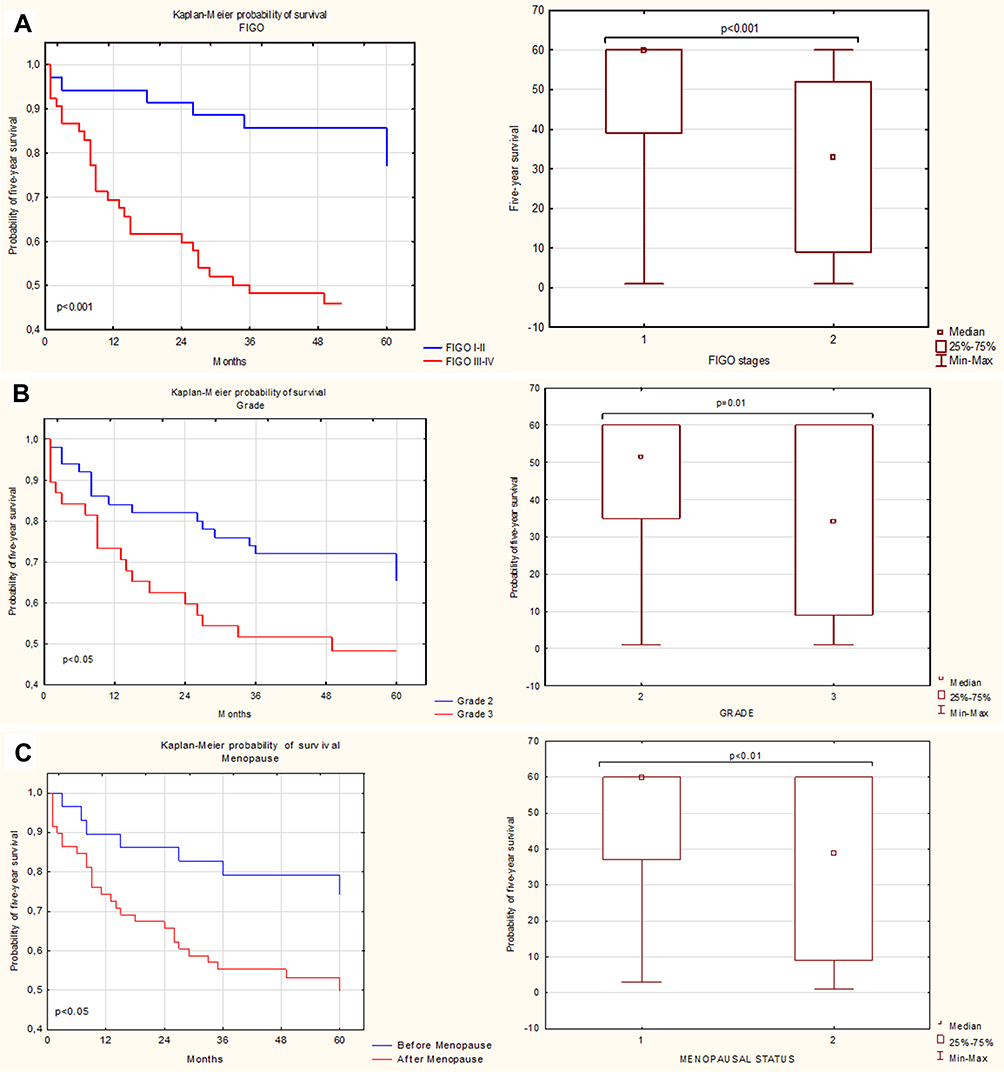 |
Figure 10 The relationship between clinical parameters, ie, FIGO (A), grade (B), menopausal status (C), and 5-year survival of OC patients. |
Immune Parameters as Predictors of OC Patient Prognosis
Similar assessment was performed to determine OS estimates as a function of the PD-1 expression on CD4+ and CD8+ T cells in the PB, PF, and tumor tissue from the OC patients.
We found that the OC patients with the higher percentage of CD4+PD-1+ in PB had shorter OS than those with the lower percentage of these cell populations (median 36 vs 58 months, p=0.04) (Figure 11A).
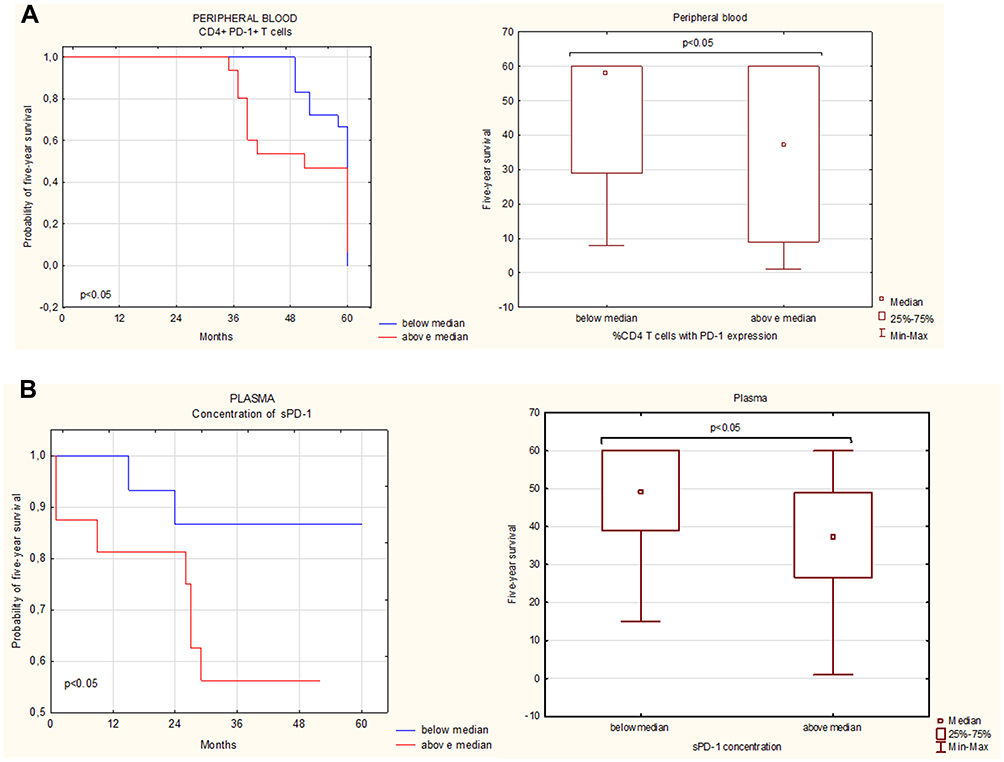 |
Figure 11 (A) The relationship between CD4+PD-1+ cells and 5-year survival of OC patients. (B) The relationship between plasma sPD-1 levels and 5-year survival of OC patients. |
Similarly, the patients with a higher percentage of tumor-infiltrating CD4+PD-1+ T cells had shorter OS than those with the lower percentage of these cells (median 39 vs 58 months); however, the difference was statistically insignificant (p>0.05).
The patients with the higher percentage of CD8+PD-1+ in the peripheral blood had shorter OS than those with the lower percentage of CD8+PD-1+ (median 37 vs 51 months, p>0.05).
The patients with the higher percentage of CD8+PD-1+ in PF had shorter OS than those with the lower percentage of these T cells (median 15 vs 39 months); however, the statistical difference was not significant (p>0.05).
Soluble PD-1 as a Potential Prognosis Biomarker for OC Patients
The OC patients with the higher soluble PD-1 level in the plasma had shorter 5-year survival than those with the lower sPD-1 concentration (median 37 vs 49 months, p<0.05) (Figure 11B).
There was no statistical difference in the OS of the ovarian cancer patients in relation to the sPD-1 level in peritoneal fluid (p>0.05).
Discussion
Every year cancer morbidity and mortality rates increase, despite the development of novel treatment methods. Thus, the mission of scientists is to develop an effective cancer therapy. However, the task is challenging, considering the complexity of the disease. Ovarian cancer proves difficult due to its genetic, molecular, and immunological heterogeneity. The determination of the disease background and reliable prediction factors is essential for developing and implementing targeted therapy for treatment and to improve patient quality of life. A groundbreaking revelation and game changer in the perception of the disease was the finding that the immune system plays a crucial role in the progression and metastasis of OC. Therefore, immunotherapy, especially based on immune checkpoint inhibitors including the PD-1/PD-L1 axis has become a hot topic among scientists exploring OC.
Immunotherapies based on PD-1/PD-L1 pathway inhibitors use both monoclonal antibodies (mAbs) anti-PD-1 and anti-PD-L1. Their mode of action is based on stimulation of the anticancer immune system response via signal inhibition leading to T-cell anergy.15 Considering the foregoing clinical trials and the drug efficiency in many cancers, including melanoma, leukemia, renal, gastric, lung, and bladder cancer, immunotherapy is also a promising approach in ovarian cancer treatment.2,17,29–32 Moreover, data suggest that the response to PD-1/PD-L1 pathway inhibitors may be dependent on the OC histological type.31,33 Currently, no PD-1/PD-L1 pathway inhibitors have been approved by FDA in OC treatment. Nevertheless, mAbs are currently in clinical trials, including Phase III, both in single and combined therapy.34–37 Unfortunately, treatment based on mAbs inhibiting the PD-1/PD-L1 pathway is only efficient in a small group of OC patients. Moreover, OC treatment results are not as satisfying as in the case of other solid tumors. Thus, it is necessary to find predictive markers and understand the OC microenvironment to implement the treatment for precise groups of OC patients.8,11,19,33,34
What is interesting, blood-borne metastases are rare in OC. The most common mechanism of metastasis is the release of cells into the peritoneal cavity from the primary tumor. In peritoneal fluid, cancer cells aggregate into spheroid-like structures, attack the peritoneum, and lead to metastasis. The increasing seeding of spheroids is common in advanced stages and in recurrent OC – frequently attacking large intestine, omentum, and uterus. It is well established that ovarian cancer cells can shift from epithelial to mesenchymal profile during metastasis. There is growing evidence that epithelial-to-mesenchymal transition (EMT) is a pivotal mechanism that leads to invasion, migration, and, metastasis in OC. During EMT, changes in cells lead to loss of epithelial cells features: including a loss of cell-cell junction, apical-basolateral polarity, and mesenchymal phenotype conversion. There are grounds to suggest that TME-derived factors such as growth factors, including TGF-β, and cytokines may regulate EMT. Moreover, it has been proved that TGF-β signaling is crucial for EMT regulation, and TGF-β inhibitor SB-431542 is able to block spheroid-induced EMT. The treatment based on SB-431542 requires the phenotype of epithelial cells and reduced spread of reattached cells from spheroids. What is more, SB-431542 also blocks the formation of spheroids. It should be highlighted that suspended cells are more prone to be eliminated by carboplatin agents than cells in aggregates. This proves that TGF-β is important for the promotion of advanced OC stage progression and it is a potential target for reducing the spread of malignant cells in the peritoneal cavity and disease burden during the OC recurrence.38
In our research, we established the expression of the PD-1 receptor on CD4+ and CD8+ T cells in three different OC environments, ie PB, PF, and tumor tissue (TT). We also investigated the concentration of the soluble PD-1 level in the plasma and PF of OC patients. The evaluation of these factors allowed us to correlate them with the clinicopathological characteristics and prognosis of OC patients.
Interestingly, we found differences in the distribution of CD3+, CD4+, and CD8+ T cells in three OC environments. We found an accumulation of CD3+ T cells in the peritoneal fluid in comparison to PB and tumor tissue. The highest percentage of CD4+ T cells was detected in the peripheral blood of the patients. Additionally, we detected an increased accumulation of CD8+ T cells in the tumor in comparison to PF and PB. It should be emphasized that we observed a positive correlation between the percentage of CD3+ T cells in PB and the longer survival of OC patients (49 vs 38 months).
Many studies have revealed that tumor infiltration by T cells is favorable for OC patients. It has been shown that the high percentage of CD3+ T cells is related to improved progression-free survival (PFS) and overall survival (OS) in OC patients.39,40 Rådestad and colleagues found an elevated level of CD3+ TILs in PB, PF, and TT. However, in contrast to our study, the differences were not significant.10 Similarly, an elevated percentage of CD3+ and CD8+ T cells in colorectal cancer was found to be related to improved OS, whereas a decreased percentage of T-cells was associated with poor prognosis.41 As shown by Darb-Esfahani and colleagues, the presence of different subpopulations of TILs, including CD4+ and CD8+ T cells, is related to a better prognosis for OC patients.32 Similar findings have been reported by Webb and co-workers.31 Furthermore, the meta-analysis conducted by Hwang et al has shown that intraepithelial CD3+ and CD8+ TILs are related to significantly prolonged OS in OC patients.42
It should be emphasized that the main function of cytotoxic T lymphocytes (CD8+) is recognition of cancer antigens and then the elimination of malignant cells by producing and releasing cytotoxic factors. Thus, their appearance in a tumor is considered a beneficial indicator for cancer patients' prognosis and, similarly to CD3+ T cells, is related to improved PFS and OS in OC patients.10,12,40,43–46 These results suggest that stimulation of the host immune system may lead to the renewal of antitumor immune response.35,46–49 Interestingly, an elevated level of CD8+ without any of the co-inhibitory receptors seems to be especially favorable for cancer patients, as the effector functions of the cells cannot be inhibited.10
Although the prognosis based on TILs in OC is challenging,10 these cells may be highly important biomarkers in ovarian cancer. The proportion of the subpopulations and phenotype TILs seem to be especially crucial for the proper choice and implementation of treatment in OC patients.10,49 However, Zhang and colleagues have already found that the activity of the same type of immune system cells, including T cells, leading to cancer progression and tumor growth is dependent on the tumor microenvironment.44
In the present study, we evaluated the expression of the PD-1 receptor on CD4+ and CD8+ T cells in three different OC environments, ie PB, PF, and tumor tissue. Our research demonstrated significant differences in the PD-1 expression on CD4+ and CD8+ T cells in the examined OC environments. We found a significantly elevated percentage of CD4+ T cells with PD-1 expression in the OC microenvironment (tumor and PF), compared to PB. Remarkably, the percentage of the CD4+ PD-1+ T cells was the highest among the tumor-infiltrating cells. We also found the highest percentage of CD8+PD-1+ in the tumor, rather than in the PB and PF, of the OC patients.
Similarly, Owens et al showed a higher level of PD-1 on CD8+ in tumor tissue in comparison to PB of OC patients.40 Furthermore, Rådestad and colleagues demonstrated similar results to these in our study of CD4+PD-1+ and CD8+PD-1+ T cells, and the differences shown by these authors were significant as well.10 In their study, Zhang and co-workers showed that approximately 5% of CD8+ T cells in humans expressed PD-1. Moreover, their percentage may be elevated in malignancies, eg the percentage of CD8+PD-1+ T cells in melanoma may be elevated up to 20%.50
It is well established that some factors such as the FIGO stage, histological grade, and menopausal status are prognostic factors for OC patients.51,52 However, the relation between immunological factors still remains unclear. Thus, in our study, we also evaluated the relationship between the clinical and immunological parameters and the 5-year survival of the OC patients. We found that patients diagnosed with FIGO stage III and IV of OC had shorter OS than those with FIGO stage I and II of the disease (median 33 vs 60 months). Additionally, patients diagnosed with tumor grade 3 had shorter OS than those with grade 2 of OC (median 34 vs 51.5 months). The premenopausal patients had a median OS of 60 versus 39 months in the postmenopausal women (p<0.05). Interestingly, we found a significant accumulation of CD4+PD-1+ T cells in the PF of patients with grade 3 of OC. Our results also indicated a significant positive correlation between CD4+PD-1+ T cells in PF and the tumor grade and between CD8+PD-1+ T cells in PB and PF and the tumor grade. However, we did not observe a statistically significant relationship between the percentage of CD4+PD-1+ T cells in PB, PF, or tumor tissue and the clinical FIGO stage, the degree of histological differentiation, or the type of cancer according to Kurman and Shih. We did not find a significant correlation between the percentage of CD8+PD-1+ T cells in TT and the different FIGO stages, grade, or type of OC.
The literature data on the relation between clinical characteristics of patients and PD-1 expression are divergent. According to a few reports, the advanced stage of some malignancies, eg pancreatic, renal, and breast cancer, is correlated with higher PD-1 expression.25,39,53 However, in agreement with our results, Imai and colleagues did not find a statistically significant correlation between clinicopathological factors, such as the FIGO stage, grade, age, and PD-1 expression on T cells in PF of ovarian cancer patients.54 In contrast, Xu et al demonstrated that the level of PD-1 expression was positively correlated with the FIGO stage and, unlike in our study, was not correlated with Ca125 and the age of patients.55
In the present study, we did not observe statistically significant differences between the PD-1 expression and the clinical stage of the disease according to FIGO. Based on our results and other findings,10 we draw a conclusion that target immunotherapies based on PD-1 inhibitors may be useful in both early and advanced OC stages.
Immune checkpoints, such as PD-1, are expressed on activated T cells, including both effector cells and regulatory T cells (Tregs), but also on exhausted and dysfunctional T-cells.41 The data demonstrating the influence of PD-1 expression on the survival of cancer patients are ambiguous, considering the complexity of immunological reactions in the OC microenvironment.32,53,56–61 According to the literature high PD-1 expression on TILs is related to poor prognosis in some cancers such as renal, lung, and breast cancer.39,53,57,59,60 In this context, our results assessing the relationship between the percentage of CD4+ and CD8+ T cells with PD-1 expression and the survival of OC patients are interesting. We have shown that the survival of patients with a higher percentage of both CD4+PD-1+ and CD8+ PD-1+ T cells in PB, PF, and tumor tissue was shorter than in those with the lower percentage of CD4+PD-1+ and CD8+PD-1+ T cells. Especially, the lower frequency of CD4+PD-1+ T cells in PB correlated with markedly more favorable clinical outcomes of ovarian cancer patients (median 36 vs 58 months). Similarly, Chatterjee et al and Darb-Esfahani1,32 showed that a lower percentage of T cells expressing PD-1 was associated with beneficial survival outcomes, making them a useful prognostic tool to select the most favorable therapy.1,32 Also Xu et al established that higher PD-1 expression was related to shorter survival and poor prognosis in OC.55 In turn, Imai et al did not find any correlation between survival and PD-1 expression on T cells in PF of ovarian cancer patients.54 Other researchers demonstrated that high PD-1 expression was related to beneficial survival rates, and the analysis of PD-1 expression was more pertinent than that of single CD3+ T cells.59 This finding needs further verification, as it may be crucial in the selection of OC patients in whom implementation of immunotherapy based on PD-1/PD-L1 inhibitors will be beneficial.1
In our study, we demonstrated that the percentage of both CD4+PD-1+ and CD8+PD-1+ T cells in PB was significantly decreased in the OC patients in comparison to the healthy donors. We draw a conclusion that the phenomenon is related to negative regulation of anticancer immune response and exhaustion of CD4+PD-1+ and CD8+PD-1+ T cells in OC TME. Similar results were found in other disorders such as rheumatoid arthritis (RA), psoriasis and pancreatic cancer.62–65 In contrast to our results, in some disorders, eg chronic lymphocytic leukemia and thrombocytopenia, the percentages of CD4+PD-1+ and CD8+PD-1+ T cells were higher in the PB of the cancer patients than in the control. This may be related to the dysfunctional proliferation of T cell subsets, increased apoptosis, and decreased release of particular cytokines, such as TNF-α, IFN-γ, IL-1, and IL-10, and may indicate exhaustion.62,63,66–69
The novel approaches in solid malignancies include the detection of soluble forms of immune checkpoint molecules by liquid biopsies. These molecules are important regulators of immune response, including anticancer response. Their potential prognostic value is also promising since their expression in blood is differential and helps distinguish benign tumors from malignancies. Moreover, both soluble and membrane-bounded forms of immune checkpoints seem to be a useful diagnostic approach in the management of patient treatment, determination of prognosis, and response to therapy based on PD-1/PD-L1 inhibitors via simple blood tests1. Therefore, in our study, we evaluated the soluble PD-1 concentration in the plasma and PF of OC patients and for the first time correlated them with clinicopathological characteristics and patient prognosis. We observed a significantly higher level of sPD-1 in the plasma than in PF of the ovarian cancer patients. Interestingly, our results indicate that the elevated sPD-1 concentration in plasma is correlated with shorter survival of OC patients (median 49 vs 37 months).
The circulating soluble PD-1 occurring in two different forms can be easily detected in blood tests. The first one is homologous to membrane-bound PD-1 and is released by cleavage or in a changed form by splicing out the membrane-bound form.69 Currently, there are studies of the clinical significance of sPD-1 not only in solid tumors but also in other diseases. For example, elevated sPD-1 in rheumatoid arthritis is related to disease progression.70 Furthermore, a higher sPD-1 level in autoimmune hepatitis is correlated with incomplete response to implemented therapy.70 Sorensen and colleagues demonstrated that an elevated sPD-1 level in EGFR-mutated non-small cell lung cancer (NSCLC) patients was associated with beneficial PFS and OS.72
In contrast, Elhang et al reported that an elevated sPD-1 concentration was related to prolonged survival in a murine model via reduced immunosuppression.73 Moreover, sPD-1 leads to blockage of PD-L1 by binding to the ligand and PD-L1 cannot bind to PD-1 on T-cells. In vivo studies have confirmed that sPD-1 competes with PD-1 and reduces IL-10 expression.74 The study conducted by Elhang et al has shown that sPD-1 can increase cytotoxicity and reduce TME suppression on T cells. Thus, sPD-1 is a promising molecule for the development of target therapies in many types of malignancies, including ovarian cancer.73
Data available in literature support that soluble forms of PD-1 may be an efficient predictor for treatment response, survival, and clinicopathological characteristics of cancer patients. They can also exert an influence on the PD-1/PD-L1 pathway by inhibition thereof.72,75–79 Although the mode of their action has been elucidated, their influence on clinicopathological aspects and survival still remains unclear.71 In malignant tumors, a reduced sPD-1 level is related to the absence of antitumor immune response. As suggested by Dillman et al, elevated levels of sPD-1 in plasma, noted also in our study, may be related to an active anticancer immune response, which is suppressed.78 Furthermore, the higher sPD-1 concentration in plasma is also related to shorter OS, which makes sPD-1 a potentially valuable diagnostic marker for OC patients, considering that sPD-1 can be easily detected during the diagnostic process.79
Conclusion
In summary, our study discovered for the first time that the higher percentage of CD4+PD-1+ T cells in the peripheral blood and the higher sPD-1 level in the plasma predict poor survival of ovarian cancer patients. We conclude that PD-1 may be a valuable biomarker to select patients with OC that will benefit from immunotherapy based on PD-1/PD-L1 inhibitors. Validation of these results is yet required – but may be clinically relevant in simple, noninvasive, real-time monitoring of OC patients. We hypothesize that PD-1 could be a predictive biomarker for OC patients and allow the implementation of novel target therapy for these patients in future.
Abbreviations
ALC, Absolute lymphocyte count; ANC, Absolute neutrophil count; DSB, Double-strand break; EMT, Epithelial–mesenchymal transition; FDA, Food and Drug Administration; FIGO, International Federation of Gynecology and Obstetrics; HR, Homologous recombination; mAbs, Monoclonal antibodies; MNCs, Mononuclear cells; NHEJ, Non-homologous end joining; NLR, Neutrophil to lymphocyte ratio; NSCLC, Non-small-cell lung carcinoma; OC, Ovarian cancer; OS, Overall survival; PARP, Poly (ADP-ribose) polymerase; PARPi, Poly (ADP-ribose) polymerase inhibitor; PB, Peripheral blood; PD-1, Programmed cell death protein 1; PD-L1, Programmed death-ligand 1; PD-L2, Programmed death-ligand 2; PF, Peritoneal fluid; PFS, Progression-free survival; sPD-1, Soluble programmed death protein 1; SSB, Single-strand break; TILs, Tumor-infiltrating lymphocytes; TME, Tumor microenvironment; Tregs, Regulatory T cells.
Data Sharing Statement
All data generated or analyzed during this study are included in this published.
Ethics Approval and Informed Consent
The research received the approval of the Bioethics Committee at the Medical University of Lublin (KE-0254/280/2015). Written informed consent was obtained from all patients.
Acknowledgments
We thank the staff from The First Department of Gynecologic Oncology and Gynecology, Medical University of Lublin for collecting some samples. We thank all blood donors and patients for participation in the study.
Funding
This work was supported by the Medical University of Lublin DS124 grant from the Ministry of Science and Higher Education. The study was carried out using the equipment purchased within the Project: ‘The equipment of innovative laboratories doing research of new medicines used in the therapy of civilization and neoplastic diseases’ within Operational Program Development of Eastern Poland 2007–2013, Priority Axis I Modern Economy, Operations I.3 Innovation Promotion.
Disclosure
The author reports no conflicts of interest in this work.
References
1. Chatterjee J, Dai W, Aziz NHA, et al. Clinical use of programmed cell death-1 and its ligand expression as discriminatory and predictive markers in ovarian cancer. Clin Cancer Res. 2017;23:3453–3460. doi:10.1158/1078-0432.CCR-16-2366
2. Zhu X, Lang J. Programmed death-1 pathway blockade produces a synergistic antitumor effect: combined application in ovarian cancer. J Gynecol Oncol. 2017;28:e64. doi:10.3802/jgo.2017.28.e64
3. Siegel RL, Miller KD, Jemal A. Cancer statistics, 2017. CA Cancer J Clin. 2017;67(1):7–30. doi:10.3322/caac.21387
4. Kurman RJ, Shih IM. The dualistic model of ovarian carcinogenesis: revisited, revised, and expanded. Am J Pathol. 2016;186:733–747. doi:10.1016/j.ajpath.2015.11.011
5. Shih IM, Kurman RJ. Ovarian tumorigenesis: a proposed model based on morphological and molecular genetic analysis. Am J Pathol. 2004;164:1511–1518. doi:10.1016/S0002-9440(10)63708-X
6. Gadducci A, Guerrieri ME. Immune checkpoint inhibitors in gynecological cancers: update of literature and perspectives of clinical research. Anticancer Res. 2017;37:5955–5965.
7. Boussios S, Abson C, Moschetta M, et al. Poly (ADP-Ribose) polymerase inhibitors: talazoparib in ovarian cancer and beyond. Drugs R D. 2020;20:55–73. doi:10.1007/s40268-020-00301-8
8. Gaillard SL, Secord AA, Monk B. The role of immune checkpoint inhibition in the treatment of ovarian cancer. Gynecol Oncol Res Pract. 2016;3. doi:10.1186/s40661-016-0033-6
9. Auer K, Bachmayr-Heyda A, Sukhbaatar N, et al. Role of the immune system in the peritoneal tumor spread of high grade serous ovarian cancer. Oncotarget. 2016;7:61336–61354. doi:10.18632/oncotarget.11038
10. Rådestad E, Klynning C, Stikvoort A, et al. Immune profiling and identification of prognostic immune-related risk factors in human ovarian cancer. OncoImmunology. 2019;8:1535730. doi:10.1080/2162402X.2018.1535730
11. Matanes E, Gotlieb WH. Immunotherapy of gynecological cancers. Best Pract Res Clin Obstet Gynaecol. 2019;60:97–110.
12. Hamanishi J, Mandai M, Iwasaki M, et al. Programmed cell death 1 ligand 1 and tumor-infiltrating CD8+ T lymphocytes are prognostic factors of human ovarian cancer. Proc Natl Acad Sci USA. 2007;104:3360–3365. doi:10.1073/pnas.0611533104
13. Yao S, Chen L. PD-1 as an immune modulatory receptor. Cancer J. 2014;20:262–264. doi:10.1097/PPO.0000000000000060
14. Basu P, Mukhopadhyay A, Konishi I. Targeted therapy for gynecologic cancers: toward the era of precision medicine. Int J Gynaecol Obstet. 2018;143:131–136. doi:10.1002/ijgo.12620
15. Abiko K, Matsumura N, Hamanishi J, et al. IFN-γ from lymphocytes induces PD-L1 expression and promotes progression of ovarian cancer. Br J Cancer. 2015;112:1501–1509. doi:10.1038/bjc.2015.101
16. Lin H, Wei S, Hurt EM, et al. Host, expression of PD-L1 determines efficacy of PD-L1 pathway blockade–mediated tumor regression. J Clin Invest. 2018;128:805–815. doi:10.1172/JCI96113
17. Fan BS, Reader J, Roque DM. Review of immune therapies targeting ovarian cancer. Curr Treat Options Oncol. 2018;19:74. doi:10.1007/s11864-018-0584-3
18. Moschetta M, Uccello M, Kasenda B, et al. Dynamics of neutrophils-to-lymphocyte ratio predict outcomes of PD-1/PD-L1 blockade. Biomed Res Int. 2017;2017:1506824. doi:10.1155/2017/1506824
19. Boland JL, Zhou Q, Martin M, et al. Early disease progression and treatment discontinuation in patients with advanced ovarian cancer receiving immune checkpoint blockade. Gynecol Oncol. 2019;152:251–258. doi:10.1016/j.ygyno.2018.11.025
20. Boussios S, Karihtala P, Moschetta M, et al. Combined strategies with poly (ADP-Ribose) polymerase (PARP) inhibitors for the treatment of ovarian cancer: a literature review. Diagnostics. 2019;9(3):87. doi:10.3390/diagnostics9030087
21. Saner FAM, Herschtal A, Nelson BH, et al. Going to extremes: determinants of extraordinary response and survival in patients with cancer. Nat Rev Cancer. 2019;19:339–348.
22. Wang Z, Sun K, Xiao Y, et al. Niraparib activates interferon signaling and potentiates anti-PD-1 antibody efficacy in tumor models. Sci Rep. 2019;9:1853. doi:10.1038/s41598-019-38534-6
23. Muinelo-Romay L, Casas-Arozamena C, Abal M. Liquid biopsy in endometrial cancer: new opportunities for personalized oncology. Int J Mol Sci. 2018;19:2311. doi:10.3390/ijms19082311
24. Palmirotta R, Lovero D, Cafforio P, et al. Liquid biopsy of cancer: a multimodal diagnostic tool in clinical oncology. Ther Adv Med Oncol. 2018;10:175883591879463. doi:10.1177/1758835918794630
25. Wang J, Chang S, Li G, Sun Y. Application of liquid biopsy in precision medicine: opportunities and challenges. Front Med. 2017;11:522–527.
26. Poulet G, Massias J, Taly V. Liquid biopsy: general concepts. Acta Cytol. 2019;63:449–455. doi:10.1159/000499337
27. Prat J. FIGO committee on gynecologic oncology. Staging classification for cancer of the ovary, fallopian tube, and peritoneum. Int J Gynaecol Obstet. 2014;124:1–5.
28. Silverberg SG. Histopathologic grading of ovarian carcinoma: a review and proposal. Int J Gynecol Pathol. 2000;19:7–15. doi:10.1097/00004347-200001000-00003
29. Wang JJ, Siu MK, Jiang YX, et al. Aberrant upregulation of PDK1 in ovarian cancer cells impairs CD8+ T cell function and survival through elevation of PD-L1. OncoImmunology. 2019;8:e1659092. doi:10.1080/2162402X.2019.1659092
30. Liu JY, Yang GF, Chen FF, Peng CW. Evaluating the prognostic significance of tumor-infiltrating lymphocytes in solid tumor: practice of a standardized method from the international immuno-oncology biomarkers working group. Cancer Manag Res. 2019;11:6815–6827.
31. Webb JR, Milne K, Kroeger DR, Nelson BH. PD-L1 expression is associated with tumor-infiltrating T cells and favorable prognosis in high-grade serous ovarian cancer. Gynecol Oncol. 2016;141:293–302. doi:10.1016/j.ygyno.2016.03.008
32. Darb-Esfahani S, Kunze CA, Kulbe H, et al. Prognostic impact of programmed cell death-1 (PD-1) and PD-ligand 1 (PD-L1) expression in cancer cells and tumor-infiltrating lymphocytes in ovarian high grade serous carcinoma. Oncotarget. 2016;7:1486–1499. doi:10.18632/oncotarget.6429
33. Suh DH, Kim M, Lee KH, et al. Major clinical research advances in gynecologic cancer in 2017. J Gynecol Oncol. 2017;29:e31. doi:10.3802/jgo.2018.29.e31
34. Pawłowska A, Suszczyk D, Okła K, Barczyński B, Kotarski J, Wertel I. Immunotherapies based on PD‐1/PD‐L1 pathway inhibitors in ovarian cancer treatment. Clin Exp Immunol. 2019;195:334–344.
35. Udall M, Rizzo M, Kenny J, et al. PD-L1 diagnostic tests: a systematic literature review of scoring algorithms and test-validation metrics. Diagn Pathol. 2018;13:12. doi:10.1186/s13000-018-0689-9
36. Normann MC, Türzer M, Diep LM, et al. Early experiences with PD-1 inhibitor treatment of platinum resistant epithelial ovarian cancer. J Gynecol Oncol. 2019;30:e56. doi:10.3802/jgo.2019.30.e56
37. Clinical Trials. Available from: http://clinicaltrials.gov.
38. Rafehi S, Ramos Valdes Y, Bertrand M, et al. TGFβ signaling regulates epithelial-mesenchymal plasticity in ovarian cancer ascites-derived spheroids. Endocr Relat Cancer. 2016;23(3):147–159. doi:10.1530/ERC-15-0383
39. Sun S, Fei X, Mao Y, et al. PD-1+ immune cell infiltration inversely correlates with survival of operable breast cancer patients. Cancer Immunol Immunother. 2014;63:395–406. doi:10.1007/s00262-014-1519-x
40. Owens GL, Sheard VE, Kalaitsidou M, et al. Preclinical assessment of CAR T-cell therapy targeting the tumor antigen 5T4 in ovarian cancer. J Immunother. 2018;41:130–140. doi:10.1097/CJI.0000000000000203
41. Toor SM, Murshed K, Al-Dhaheri M, Khawar M, Nada MA, Elkord E. Immune checkpoints in circulating and tumor-infiltrating CD4+ T cell subsets in colorectal cancer patients. Front Immunol. 2019;10. doi:10.3389/fimmu.2019.02936
42. Hwang WT, Adams SF, Tahirovic E, Hagemann IS, Coukos G. Prognostic significance of tumor-infiltrating T cells in ovarian cancer: a meta-analysis. Gynecol Oncol. 2012;124:192–198. doi:10.1016/j.ygyno.2011.09.039
43. Corgnac S, Boutet M, Kfoury M, Naltet C, Mami-Chouaib F. The emerging role of CD8+ tissue resident memory T (TRM) cells in antitumor immunity: a unique functional contribution of the CD103 integrin. Front Immunol. 2018;9:1904. doi:10.3389/fimmu.2018.01904
44. Zhang L, Conejo-Garcia JR, Katsaros D, et al. Intratumoral T cells, recurrence, and survival in epithelial ovarian cancer. N Engl J Med. 2003;348:203–213. doi:10.1056/NEJMoa020177
45. Sato E, Olson SH, Ahn J, et al. Intraepithelial CD8+ tumor‐infiltrating lymphocytes and a high CD8+regulatory T cell ratio are associated with favorable prognosis in ovarian cancer. Proc Natl Acad Sci USA. 2005;102:18538–18543. doi:10.1073/pnas.0509182102
46. Bachmayr-Heyda A, Aust S, Heinze G, et al. Prognostic impact of tumor infiltrating CD8+ T cells in association with cell proliferation in ovarian cancer patients–a study of the OVCAD consortium. BMC Cancer. 2013;13:422. doi:10.1186/1471-2407-13-422
47. Clarke CL, Kushi LH, Chubak J, et al. Predictors of long-term survival among high-grade serous ovarian cancer patients. Cancer Epidemiol Biomarkers Prev. 2019;28:996–999. doi:10.1158/1055-9965.EPI-18-1324
48. Webb JR, Milne K, Watson P, Deleeuw RJ, Nelson BH. Tumor-infiltrating lymphocytes expressing the tissue resident memory marker CD103 are associated with increased survival in high-grade serous ovarian cancer. Clin Cancer Res. 2014;20:434–444.
49. Li J, Wang J, Chen R, Bai Y, Lu X. The prognostic value of tumor-infiltrating T lymphocytes in ovarian cancer. Oncotarget. 2017;28:15621–15631. doi:10.18632/oncotarget.14919
50. Zhang Y, Huang S, Gong D, Qin Y, Shen Q. Programmed death-1 upregulation is correlated with dysfunction of tumor-infiltrating CD8+ T lymphocytes in human non-small cell lung cancer. Cell Mol Immunol. 2010;7:389–395. doi:10.1038/cmi.2010.28
51. Chang LC, Huang CF, Lai MS, Shen LJ, Wu FLL, Cheng WF. Prognostic factors in epithelial ovarian cancer: a population-based study. PLoS One. 2018;13:e0194993. doi:10.1371/journal.pone.0194993
52. Rooth C. Ovarian cancer: risk factors, treatment and management. Br J Nurs. 2013;22:S23–30. doi:10.12968/bjon.2013.22.Sup17.S23
53. Thompson RH, Dong H, Lohse CM, et al. PD-1 is expressed by tumor infiltrating immune cells and is associated with poor outcome for patients with renal cell carcinoma. Clin Cancer Res. 2007;13:1757–1761. doi:10.1158/1078-0432.CCR-06-2599
54. Imai Y, Hasegawa K, Matsushita H, et al. Expression of multiple immune checkpoint molecules on T cells in malignant ascites from epithelial ovarian carcinoma. Oncol Lett. 2018;1:6457–6468.
55. Xu M, Zhang B, Zhang M, et al. Clinical relevance of expression of B7-H1 and B7-H4 in ovarian cancer. Oncol Lett. 2016;11:2815–2819. doi:10.3892/ol.2016.4301
56. Bellmunt J, Mullane SA, Werner L, et al. Association of PD-L1 expression on tumor infiltrating mononuclear cells and overall survival in patients with urothelial carcinoma. Ann Oncol. 2015;26:812–817. doi:10.1093/annonc/mdv009
57. Muenst S, Soysal SD, Gao F, Obermann EC, Oertli D, Gillanders WE. The presence of programmed death 1 (PD-1)-positive tumor-infiltrating lymphocytes is associated with poor prognosis in human breast cancer. Breast Cancer Res Treat. 2013;139:667–676. doi:10.1007/s10549-013-2581-3
58. Badoual C, Hans S, Merillon N, et al. PD-1-expressing tumor-infiltrating T cells are a favourable prognostic biomarker in HPV-associated head and neck cancer. Cancer Res. 2013;73:128–138. doi:10.1158/0008-5472.CAN-12-2606
59. Lafuente-Sanchis A, Á Z, Estors M, et al. Association of PD-1, PD-L1, and CTLA-4 gene expression and clinicopathologic characteristics in patients with non–small-cell lung cancer. Clin Lung Cancer. 2017;18:109–116. doi:10.1016/j.cllc.2016.09.010
60. Lipson EJ, Forde PM, Hammers HJ, Emens LA, Taube JM, Topalian SL. Antagonists of PD-1 and PD-L1 in cancer treatment. Semin Oncol. 2015;42:587–600. doi:10.1053/j.seminoncol.2015.05.013
61. de la Fuente LM, Westbom-Fremer S, Arildsen NS, et al. PD-1/PD-L1 expression and tumor-infiltrating lymphocytes are prognostically favorable in advanced high-grade serous ovarian carcinoma. Virchows Archiv. 2020;24. doi:10.1007/s00428-020-02751-6
62. Zhao YJ, Zhang J, Shi F, et al. Expression of PD-1 on CD4+ tumor-infiltrating lymphocytes in tumor microenvironment associated with pathological characteristics of breast cancer. J Immunol Res. 2018;2018:5690258. doi:10.1155/2018/5690258
63. Shen T, Zhou L, Hua Shen H, et al. Prognostic value of programmed cell death protein 1 expression on CD8+ T lymphocytes in pancreatic cancer. Sci Rep. 2017;7:7848. doi:10.1038/s41598-017-08479-9
64. Bartosińska J, Zakrzewska E, Raczkiewicz D, et al. Suppressed programmed death 1 expression on CD4. Mediators Inflamm. 2017;2017:5385102. doi:10.1155/2017/5385102
65. Li S, Liao W, Chen M, et al. Expression of programmed death-1 (PD-1) on CD4+ and CD8+ T cells in rheumatoid arthritis. Inflammation. 2014;37:116–121. doi:10.1007/s10753-013-9718-8
66. Wang Y, Pang N, Wang X, et al. Percentages of PD-1+CD4+T cells and PD-L1+DCs are increased and sPD-1 level is elevated in patients with immune thrombocytopenia. Hum Vaccin Immunother. 2018;14:832–838. doi:10.1080/21645515.2017.1342913
67. Allahmoradi E, Taghiloo S, Tehrani M, et al. CD4+ T cells are exhausted and show functional defects in chronic lymphocytic leukemia. Iran J Immunol. 2017;14:257–269.
68. Novak M, Prochazka V, Turcsanyi P, Papajik T. Numbers of CD8+PD-1+ and CD4+PD-1+ cells in peripheral blood of patients with chronic lymphocytic leukemia are independent of Binet stage and are significantly higher compared to healthy volunteers. Acta Haematol. 2015;134:208–214. doi:10.1159/000381468
69. Hejleh TA, Furqan M, Ballas Z, Clamon G. The clinical significance of soluble PD-1 and PD-L1 in lung cancer. Crit Rev Oncol Hematol. 2019;143:148–152. doi:10.1016/j.critrevonc.2019.08.009
70. Greisen SR, Rasmussen TK, Stengaard-Pedersen K, et al. Increased soluble programmed death-1 (sPD-1) is associated with disease activity and radiographic progression in early rheumatoid arthritis. Scand J Rheumtol. 2014;43:101–108.
71. Aarslev K, Dige A, Greisen SR, et al. Soluble programmed death-1 levels are associated with disease activity and treatment response in patients with autoimmune hepatitis. Scand J Gastroenterol. 2017;52:93–99. doi:10.1080/00365521.2016.1233576
72. Sorensen SF, Demuth C, Weber B, Sorensen BS, Meldgaard P. Increase in soluble PD-1 is associated with prolonged survival in patients with advanced EGFR-mutated non-small cell lung cancer treated with erlotinib. Lung Cancer. 2016;100:77–84. doi:10.1016/j.lungcan.2016.08.001
73. Elhag OA, Hu XJ, Wen-Ying Z, et al. Reconstructed adeno-associated virus with the extracellular domain of murine PD-1 induces antitumor immunity. Asian Pac J Cancer Prev. 2012;1:4031–4036. doi:10.7314/APJCP.2012.13.8.4031
74. Gu D, Ao X, Yang Y, Chen Z, Xu X. Soluble immune checkpoints in cancer: production, function and biological significance. J Immunother Cancer. 2018;6:132. doi:10.1186/s40425-018-0449-0
75. Nagato T, Ohkuri T, Ohara K, et al. Programmed death-ligand 1 and its soluble form are highly expressed in nasal natural killer/T-cell lymphoma: a potential rationale for immunotherapy. Cancer Immunol Immunother. 2017;66:877–890. doi:10.1007/s00262-017-1987-x
76. Wang DH, Guo L, Wu XH. Checkpoint inhibitors in immunotherapy of ovarian cancer. Tumor Biol. 2015;36:33–39. doi:10.1007/s13277-014-2848-2
77. Li Y, Xiao Y, Su M, et al. Role of soluble programmed death-1 (sPD-1) and sPD-ligand 1 in patients with cystic echinococcosis. Exp Ther Med. 2016;11:251–256. doi:10.3892/etm.2015.2876
78. Dillman RO, Nistor GI, McLelland BT, et al. Preliminary observations on soluble programmed cell death protein-1 as a prognostic and predictive biomarker in patients with metastatic melanoma treated with patient-specific autologous vaccines. Oncotarget. 2019;10:5359–5371. doi:10.18632/oncotarget.27164
79. Zhu X, Lang J. Soluble PD-1 and PD-L1: predictive and prognostic significance in cancer. Oncotarget. 2017;8:97671–97682. doi:10.18632/oncotarget.18311
 © 2020 The Author(s). This work is published and licensed by Dove Medical Press Limited. The
full terms of this license are available at https://www.dovepress.com/terms
and incorporate the Creative Commons Attribution
- Non Commercial (unported, 3.0) License.
By accessing the work you hereby accept the Terms. Non-commercial uses of the work are permitted
without any further permission from Dove Medical Press Limited, provided the work is properly
attributed. For permission for commercial use of this work, please see paragraphs 4.2 and 5 of our Terms.
© 2020 The Author(s). This work is published and licensed by Dove Medical Press Limited. The
full terms of this license are available at https://www.dovepress.com/terms
and incorporate the Creative Commons Attribution
- Non Commercial (unported, 3.0) License.
By accessing the work you hereby accept the Terms. Non-commercial uses of the work are permitted
without any further permission from Dove Medical Press Limited, provided the work is properly
attributed. For permission for commercial use of this work, please see paragraphs 4.2 and 5 of our Terms.