")
Back to Journals » International Journal of General Medicine » Volume 14
Prognostic Value of SLC16A3(MCT4) in Lung Adenocarcinoma and Its Clinical Significance
Authors Xue L, Liu J, Xie J , Luo J
Received 16 September 2021
Accepted for publication 8 November 2021
Published 17 November 2021 Volume 2021:14 Pages 8413—8425
DOI https://doi.org/10.2147/IJGM.S337615
Checked for plagiarism Yes
Review by Single anonymous peer review
Peer reviewer comments 4
Editor who approved publication: Dr Scott Fraser
Lei Xue,1,* Jinyuan Liu,1,* Jiaheng Xie,2,* Jinhua Luo1
1Department of Thoracic Surgery, The First Affiliated Hospital of Nanjing Medical University, Nanjing, Jiangsu, 210029, People’s Republic of China; 2Department of Burn and Plastic Surgery, The First Affiliated Hospital of Nanjing Medical University, Nanjing, Jiangsu, 210029, People’s Republic of China
*These authors contributed equally to this work
Correspondence: Jinhua Luo
Department of Thoracic Surgery, The First Affiliated Hospital of Nanjing Medical University, Nanjing, Jiangsu, 210029, People’s Republic of China
Email [email protected]
Jiaheng Xie
Department of Burn and Plastic Surgery, The First Affiliated Hospital of Nanjing Medical University, Nanjing, Jiangsu, 210029, People’s Republic of China
Email [email protected]
Background: Currently, lung adenocarcinoma is the most common form of lung cancer. Although the pathogenesis of lung adenocarcinoma is progressing rapidly, the mortality rate of lung adenocarcinoma is still high. Therefore, it is necessary to search for a new biomarker to guide the prognosis of lung adenocarcinoma.
Methods: The significance of SLC16A3 in lung adenocarcinoma was investigated by multi-database analysis. GEPIA, UALCAN, TIMER, Cbioportal, and R software were used for research.
Results: Our study found that SLC16A3 was highly expressed in lung adenocarcinoma and was associated with poor prognosis. Further studies have shown that SLC16A3 is involved in some metabolic pathways. Not only that, SLC16A3 is associated with immune cell infiltration and tumor mutation burden (TMB).
Conclusion: SLC16A3 has good prognostic significance in lung adenocarcinoma, based on which to explore treatment options may improve the prognosis of patients.
Keywords: lung adenocarcinoma, transporter, SLC, glucose metabolism, immunotherapy
Introduction
Compared to normal tissue, the tumor undergoes a series of changes.1 Among them, changes in metabolism are the characteristics of cancer and the focus of research.2 Tumors increase their metabolic rate through metabolic reprogramming to provide adequate energy support for their complex biological processes.3 The Warburg effect in tumors is well known. Tumors tend to undergo anaerobic glycolysis to quickly meet their energy requirements, even when oxygen is adequate.4 Current emerging studies have found that the anaerobic metabolism of tumors is not only to meet their high metabolic requirements.5 Some products of anaerobic metabolism, such as lactic acid and pyruvate, may play an important role in the tumor microenvironment.5 In addition, the hypoxic environment promotes the survival of tumor cells, and hypoxia-induced overactivation of a series of signaling pathways is involved in the regulation of a variety of biological processes in tumors.6 Therefore, it is of great significance to explore the metabolic process and metabolism-related products in cancer.
The transport of monocarboxylic acids, such as lactic acid and pyruvate, is mainly mediated by four kinds of MCT in the human body.7 MCT1 (encoded by SLC16A1), MCT2 (encoded by SLC16A7), MCT3 (encoded by SLC16A8), and MCT4 (encoded by SLC16A3) constitute the main monocarboxylic acid transport systems in the human body.7 It is worth mentioning that the number of MCT proteins and their related encoding gene is not the same. MCTs are numbered primarily by their functions, while the SLC16 family is numbered in order of when DNA was sequenced.8 In the past, it was thought that MCT was only a channel for the transport of metabolic wastes. However, with the deepening of research on tumor biology, more studies have revealed that MCT may play an important role in the formation of the tumor microenvironment and the occurrence of tumor immune escape.8,9 MCT4, encoded by SLC16A3, is mainly involved in the transport of lactate and ketone bodies.10 Previous studies have confirmed that hypoxia can induce SLC16A3 expression through HIF-1 pathway and participate in the occurrence and development of tumors.11
Lung cancer is now one of the most deadly tumors in the world.12 It can be divided into non-small cell lung cancer (NSCLC) and small cell lung cancer (SCLC).13 Among them, NSCLC can be subdivided into squamous cell carcinoma, adenocarcinoma, and large cell carcinoma.14 Lung adenocarcinoma is by far the most common subtype of lung cancer.12 Although the pathogenesis of lung adenocarcinoma is progressing rapidly and targeted therapies based on driver genes have been initially developed, the prognosis of lung adenocarcinoma is still poor.14 Patients with lung adenocarcinoma showed certain resistance to conventional chemotherapy and targeted therapy, which may be caused by tumor heterogeneity.15 Therefore, finding a new biomarker, exploring its mechanism of action and establishing a targeted therapy regimen based on this biomarker can improve the prognosis of patients with lung adenocarcinoma.
In this study, we investigated the role of SLC16A3 in lung adenocarcinoma. We performed expression analysis, survival analysis, clinical characteristic correlation analysis, co-expression pattern analysis, enrichment analysis, and immune correlation analysis. Our results can provide new ideas for guiding the prognosis of patients with lung adenocarcinoma and exploring new treatment options.
Methods
Data Download and Processing
We downloaded the TCGA Lung Adenocarcinoma data queue GDC TCGA Lung Adenocarcinoma (LUAD) from the official website of Xena database, with a total of 58 normal and 510 Lung cancer samples, and annotated the genes through the genecode.V22 version file provided by the website. A total of 460 patients with lung cancer were matched with clinical data and expression data. The data for subsequent analysis was log2 (FPKM +1).
Alteration Frequency Analysis
CbioPortal (cbioportal.org) is a platform for the comprehensive analysis of various sequencing results. Users can use the “Query by Gene” module for various analyses, such as alteration analysis, survival analysis, and signaling pathway analysis. We performed the alteration frequency analysis of SLC16A3 using CbioPortal. The gene was set as “SLC16A3”, and the data set was set as “TCGA pan-cancer”.
Expression of SLC16A3 Across Cancers
UALCAN (http://ualcan.path.uab.edu) is an open, user-friendly platform for TCGA analysis.16 We used UALCAN to conduct pan-cancer analysis of SLC16A3, with the set gene as “SLC16A3” and the set analysis method as “pan-cancer review”.
Expression of SLC16A3 in Lung Adenocarcinoma
To further explore the expression of SLC16A3 in LUAD, we used UALCAN for expression analysis. The gene was set as “SLC16A3”, the cancer was set as “lung adenocarcinoma”, and the analysis method was set as “expression analysis”.
The Clinical Correlation Analysis of the SLC16A3 in LUAD
Patients with lung adenocarcinoma in TCGA were divided into groups according to the stage, smoking history, lymph node metastasis, and TP53 mutation, to study the differences in SLC16A3 expression among these groups. Then, the Sanguini diagram was built based on the R software package “ggalluval”. All the above analysis methods and R package were implemented by R foundation for statistical computing (2019) version 4.0.3. To exclude the effects of confounders, univariate COX regression was performed to explore the prognostic value of SLC16A3 in lung adenocarcinoma. In order to find independent prognostic factors for lung adenocarcinoma, we combined SLC16A3 gene expression with other disease-related factors, including pathological stage, T stage, gender, age, etc., to conduct multivariate COX regression. To explore the diagnostic value of SLC16A3 gene in lung cancer, we performed diagnostic ROC analysis of SLC16A3 gene in 58 normal subjects and 510 lung cancer patients, and calculated the area under the curve (AUC).
Co-Expression Pattern of SLC16A3 in LUAD
To further study the mechanism of SLC16A3 in LUAD, we obtained the top 100 genes that have the closest effect on SLC16A3 through Pearson correlation analysis and displayed them in a heat map.
Gene Ontology (GO) and Kyoto Encyclopedia of Genes and Genomes (KEGG) Enrichment Analysis of Co-Expression Genes
To study the functions and pathways involved in the co-expression pattern of SLC16A3, GO and KEGG enrichment analysis was conducted. The “Clusterprofiler” package in the R software was used for the analysis.
Protein-Protein Interaction Network of the Co-Expression Pattern
To further explore the interaction between co-expressed genes and SLC16A3, we constructed a protein-protein interaction network of these 100 proteins. We use the STRING database to study the associations between proteins and visualize them with Cytoscape.17 The more lines attached to the protein, the more critical the protein’s role in the co-expression pattern.
Correlation Between SLC16A3 and Immune Cells in LUAD
Timer 2.0 (http://timer.comp-genomics.org) is an open platform for studying tumor immune infiltration. We further investigated the role of SLC16A3 in the immune microenvironment of LUAD. The gene was set as “SLC16A3” and the tumor was set as “lung adenocarcinoma”.
Results
Alteration Frequency of SLC16A3 Across Cancers
Through the “alteration frequency” module in cbioportal, we can see the alteration frequency of SLC16A3 in many tumors (Figure 1A). Among them, the alteration frequency of SLC16A3 in LUAD is 14th across cancers.
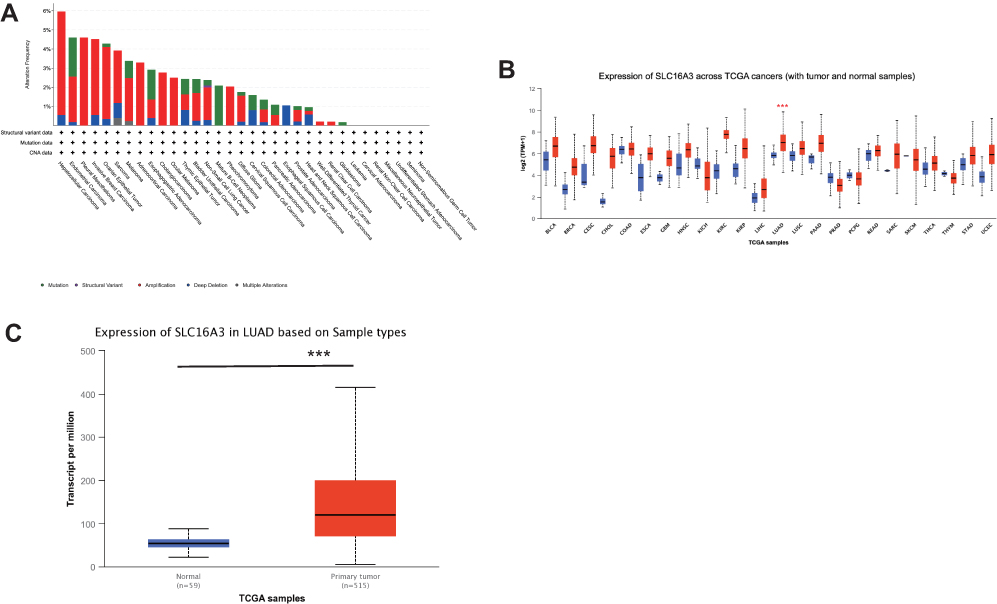 |
Figure 1 (A) The alteration frequency of SLC16A3 across cancers in cbioPortal database. (B) Expression of SLC16A3 in a variety of cancers and normal tissues (UALAN database): SLC16A3 was highly expressed in lung adenocarcinoma (***P<0.001). (C) Expression of SLC16A3 in LUAD based on sample types: we analyzed 515 cases of lung adenocarcinoma and 59 cases of normal tissue from the TCGA database and the results showed that SLC16A3 was significantly overexpressed in primary lung adenocarcinoma (***P<0.001). |
Expression of SLC16A3 Across Cancers
Through the “Expression” module in UALCAN, we obtained the expression of SLC16A3 in a variety of cancers and normal tissues (Figure 1B). As can be seen, SLC16A3 is differentially expressed in a variety of cancers. Among them, SLC16A3 was highly expressed in lung adenocarcinoma.
Expression of SLC16A3 in Lung Adenocarcinoma
To further investigate the expression of SLC16A3 in lung adenocarcinoma, we analyzed 515 cases of lung adenocarcinoma and 59 cases of normal tissue from the TCGA database. The results showed that SLC16A3 was significantly overexpressed in primary lung adenocarcinoma (***P<0.001, Figure 1C).
The Clinical Correlation Analysis of the SLC16A3 in LUAD
Next, we divided lung adenocarcinoma patients in TCGA into different groups to study the relationship between SLC16A3 expression and stage, smoking history, lymph node metastasis, and TP53 mutation (Figure 2). First, analysis by different stages showed that SLC16A3 was significantly overexpressed in patients with stages 1–4 compared to normal tissue (Figure 2A). And SLC16A3 expression was higher in stage 2 and stage 3 than in stage 1 (Figure 2A). Then, analysis of groups based on smoking history showed that SLC16A3 expression was higher in lung adenocarcinoma patients than in normal tissues, regardless of smoking history (Figure 2B). Among patients with lung adenocarcinoma, patients who smoked for more than 15 years had higher expression of SLC16A3 than non-smokers and patients who smoked for less than 15 years. Subsequent grouping analysis based on lymph node metastases showed that SLC16A3 was highly expressed in patients with lung adenocarcinoma, regardless of lymph node conditions, compared with normal tissue (Figure 2C). In patients with lung adenocarcinoma, SLC16A3 was highly expressed in both N1 and N2 patients compared with patients with stage N0. Finally, grouping analysis based on TP53 mutations showed that SLC16A3 was highly expressed in patients with lung adenocarcinoma compared with normal tissues regardless of TP53 mutations (Figure 2D). In patients with lung adenocarcinoma, SLC16A3 expression was higher in the TP53 mutant group than in the TP53 non-mutant group. From the Sanguini diagram, we can see the relationship between the SLC16A3 and the age, gender, stage, and survival of LUAD patients. Each column represents a characteristic variable, different colors represent different types or stages, and lines represent the distribution of the same sample in different characteristic variables (Figure 2E).
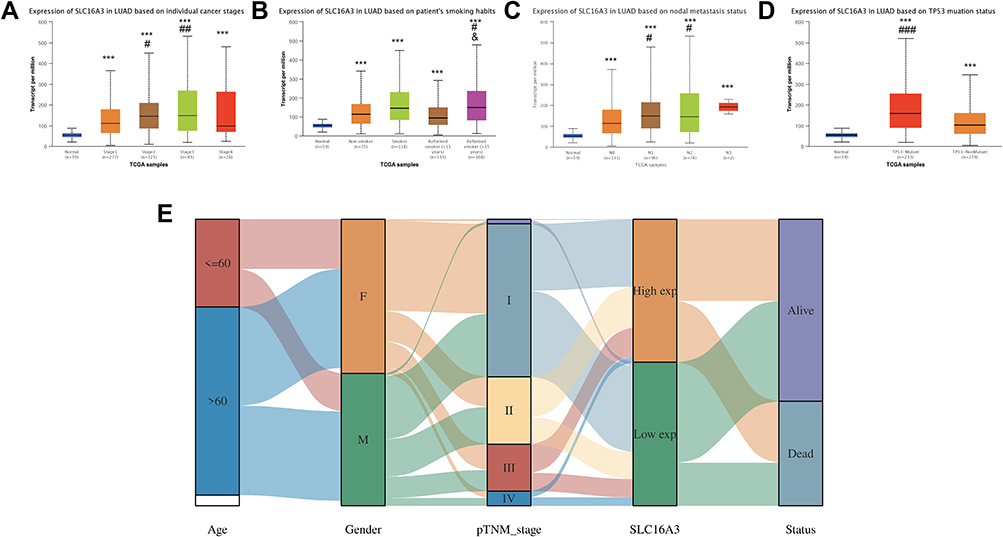 |
Figure 2 The clinical correlation analysis of the SLC16A3 in LUAD: (A) SLC16A3 was significantly overexpressed in patients with stages 1–4 compared to normal tissue. And SLC16A3 expression was higher in stage 2 and stage 3 than in stage 1. * stands for comparison with normal group, # stands for comparison with stage 1. ***P<0.001; #P<0.05, ##P<0.01. (B) SLC16A3 expression was higher in lung adenocarcinoma patients than in normal tissues, regardless of smoking history. Among patients with lung adenocarcinoma, patients who smoked for more than 15 years had higher expression of SLC16A3 than non-smokers and patients who smoked for less than 15 years. * stands for comparison with normal group, # stands for comparison with non-smoking group. and stands for comparison with patients who had smoked for less than 15 years. ***P<0.001; #P<0.05; and P<0.05 (C) SLC16A3 was highly expressed in patients with lung adenocarcinoma, regardless of lymph node conditions, compared with normal tissue. In patients with lung adenocarcinoma, SLC16A3 was highly expressed in both N1 and N2 patients compared with patients with stage N0. * stands for comparison with normal group, # stands for comparison with N0 group. ***P<0.001; #P<0.05 (D) SLC16A3 was highly expressed in patients with lung adenocarcinoma compared with normal tissues regardless of TP53 mutations. In patients with lung adenocarcinoma, SLC16A3 expression was higher in the TP53 mutant group than in the TP53 non-mutant group. * stands for comparison with normal group, # stands for comparison with TP53 non-mutant group. ***P<0.001; ###P<0.001 (E) The sanguini diagram from which can see the relationship between the SLC16A3 and the age, gender, stage, and survival of LUAD patients. |
Survival Analysis of SLC16A3 in LUAD
To investigate the significance of SLC16A3 in guiding prognosis, we performed the survival analysis. We used three databases, UALCAN, KM-Plotter, and GFEPIA, to increase the accuracy of the results. First, survival analysis of UALCAN showed that 124 patients with high expression of LUAD had a worse prognosis than LUAD patients with lower expression of SLC16A3 (P=0.00084, Figure 3A). Secondly, KM-Plotter survival analysis showed that the prognosis of 962 LUAD patients with high SLC16A3 expression was worse than that of 963 LUAD patients with low SLC16A3 expression (P =3.1e-10, Figure 3B). Survival analysis of GEPIA was performed in 239 LUAD patients with high SLC16A3 expression and 238 LUAD patients with low SLC16A3 expression, and the results showed that both overall and disease-free survival rates were poor in the group with high SLC16A3 expression (Figures 3C and D).
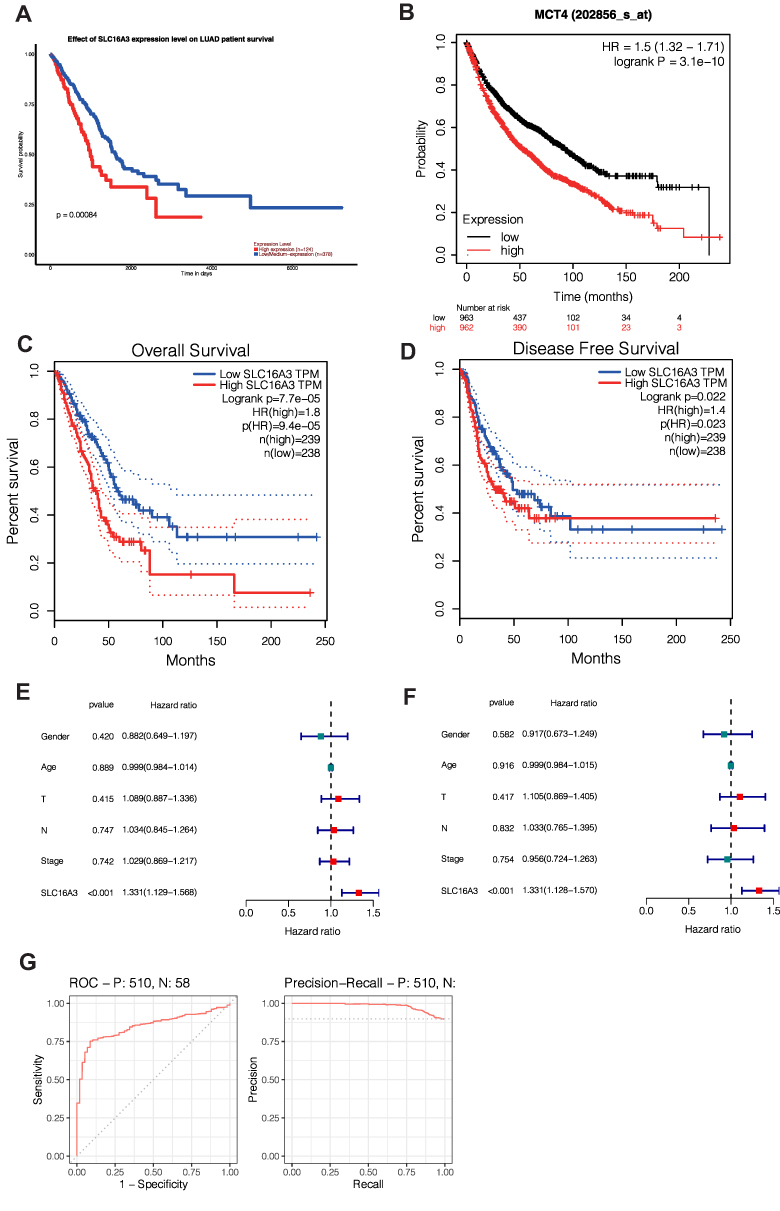 |
Figure 3 Survival analysis of SLC16A3 in LUAD: (A) survival analysis of UALCAN showed that 124 patients with high expression of LUAD had a worse prognosis than LUAD patients with lower expression of SLC16A3 (P=0.00084). (B) KM-Plotter survival analysis showed that the prognosis of 962 LUAD patients with high SLC16A3 expression was worse than that of 963 LUAD patients with low SLC16A3 expression (P =3.1e-10). (C and D) Survival analysis of GEPIA was performed in 239 LUAD patients with high SLC16A3 expression and 238 LUAD patients with low SLC16A3 expression, and the results showed that both overall and disease-free survival rates were poor in the group with high SLC16A3 expression. (E) Univariate COX regression showed that SLC16A3 was an independent prognostic factor for lung adenocarcinoma (P<0.001). (F) Multivariate COX regression showed that SLC16A3 was an independent prognostic factor for lung adenocarcinoma (P<0.001). (G) ROC analysis showed that the area under the curve (AUC) was 0.850. Meanwhile, the area under the curve (AUC) was 0.981 according to PRC analysis. These results suggest that this gene may be a good diagnostic molecule for lung cancer. |
Univariate COX Analysis and Multivariate COX Analysis
To explore the prognostic value of SLC16A3 gene in lung cancer, univariate COX analysis was performed and SLC16A3 gene was found to be a independent prognostic factor (Figure 3E, P <0.001). SLC16A3 was also found to be an independent prognostic factor by multivariate COX analysis (Figure 3F, P <0.001). To explore the diagnostic value of SLC16A3 gene in lung cancer, diagnostic ROC analysis of SLC16A3 gene in 58 normal subjects and 510 lung cancer patients was performed. ROC analysis showed that the area under the curve (AUC) was 0.850 (Figure 3G). Meanwhile, the area under the curve (AUC) was 0.981 according to PRC analysis. These results suggest that this gene may be a good diagnostic molecule for lung cancer.
Co-Expression Patterns of SLC16A3 in LUAD
To further study the action of SLC16A3 in LUAD, we constructed a co-expression pattern of SLC16A3. The first 100 co-expressed genes of SLC16A3 were shown in the heat map (Figures 4A–D).
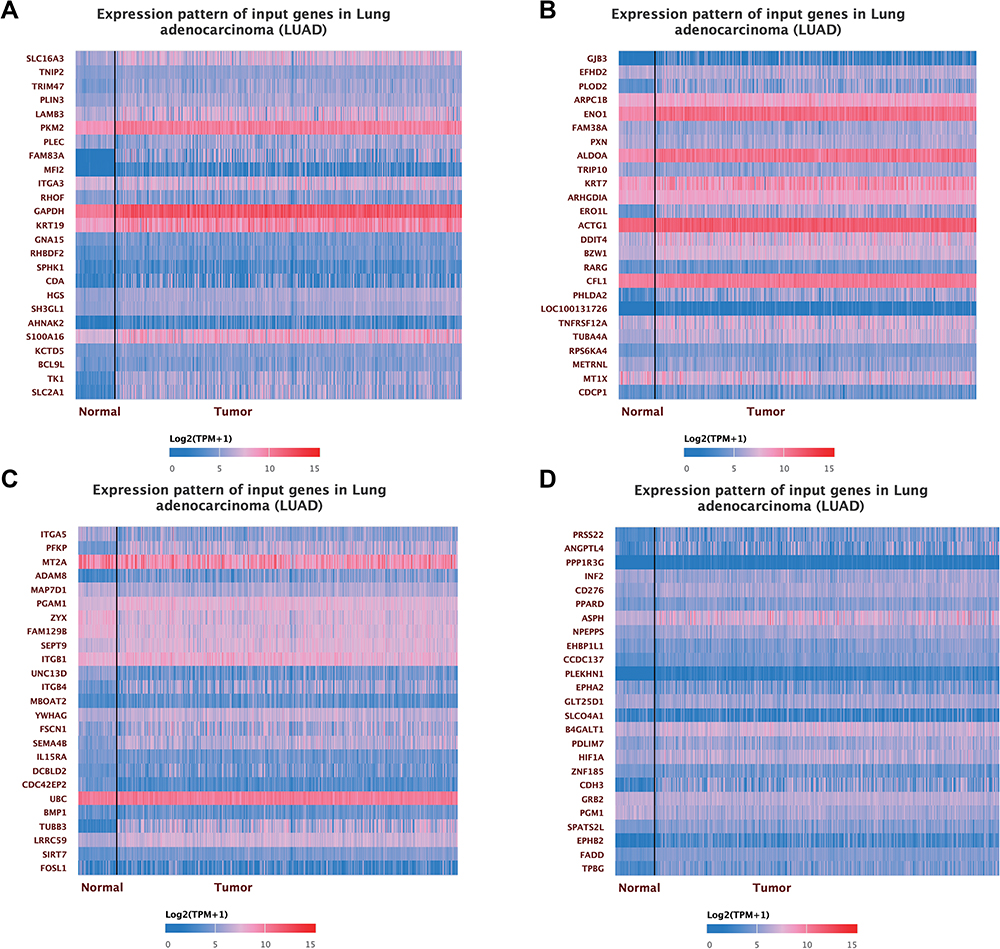 |
Figure 4 (A) The heat map of the first 25 co-expressed genes with SLC16A3 in LUAD. (B) The heat map of the 25 to 50 co-expressed genes with SLC16A3 in LUAD. (C) The heat map of the top 50 to 75 co-expressed genes with SLC16A3 in LUAD. (D) The heat map of the top 75 to 100 co-expressed genes with SLC16A3 in LUAD. |
Gene Ontology (GO) and Kyoto Encyclopedia of Genes and Genomes (KEGG) Enrichment Analysis of Co-Expression Genes
GO and KEGG enrichment analysis can obtain the function and pathway of co-expressed genes so that we can further study the role of SLC16A3. Firstly, in the biological process (BP), the co-expression pattern of SLC16A3 is mainly concentrated in cell junction assembly, actin filament composition, glycolysis, etc (Figures 5A and C). Secondly, in the cell composition (CC), the co-expression pattern of SLC16A3 is mainly concentrated in focal adhesion, cell-substrate junction, and cell-cell junction (Figures 5A and C). Finally, in the molecular function (MF), the co-expression patterns of SLC16A3 were mainly concentrated in calcitonin binding, actin binding, and 2-oxoglutarate-dependent dioxygenase activity (Figures 5A and C). KEGG enrichment analysis showed that the co-expression pattern of SLC16A3 was mainly concentrated in focal adhesion, glycolysis, HIF-1 signaling pathway, carbon metabolism in cancer, and other pathways (Figures 5B and D).
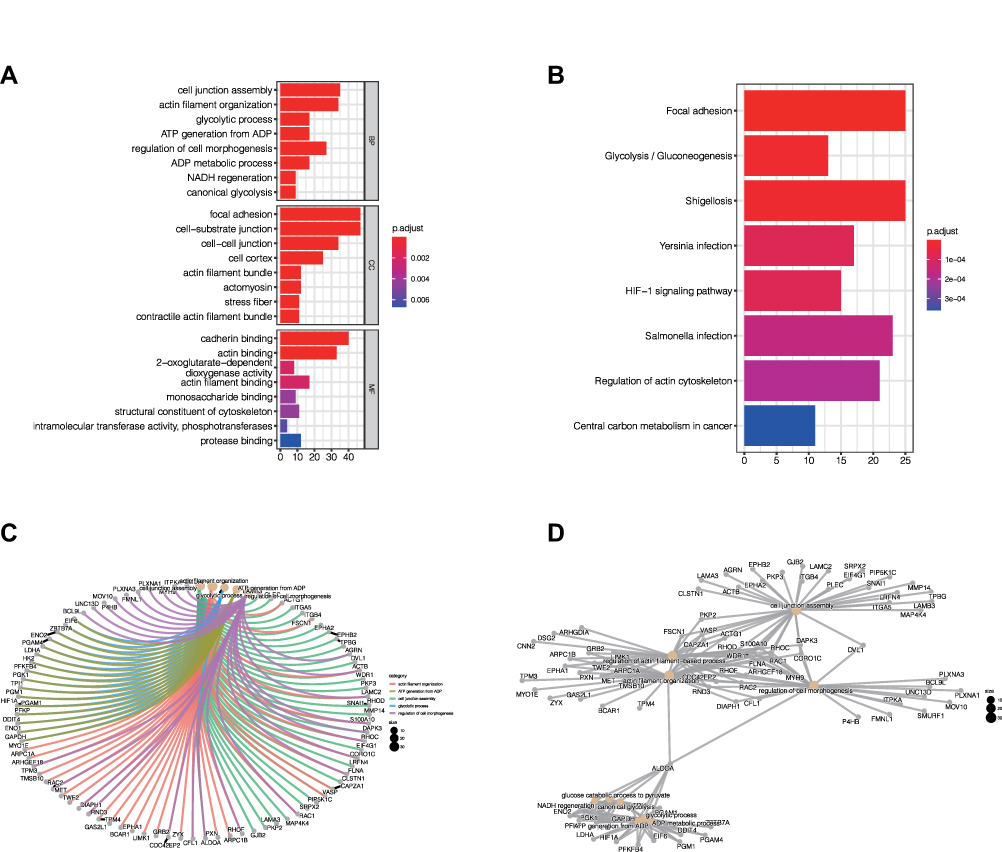 |
Figure 5 (A) GO enrichment analysis showed that the co-expressed genes were significantly enriched in biological process (BP), cellular component (CC), and molecular function (MF) of LUAD. (B) KEGG enrichment analysis showed that the co-expression pattern of SLC16A3 was mainly concentrated in focal adhesion, glycolysis, HIF-1 signaling pathway, carbon metabolism in cancer, and other pathways. (C) The network diagram of GO enrichment analysis shows the relationships between the major enrichment functions and related genes. (D) The network diagram of KEGG enrichment analysis shows the relationship between the main enrichment pathways and related genes. |
Protein-Protein Interaction Networks of the Co-Expression Patterns of SLC16A3
In order to explore the interaction between various proteins in the co-expression pattern of SLC16A3 and to find out the hub proteins, we constructed the protein-protein interaction network (Figure 6). The more lines there are, the more the protein is linked to other proteins, which may have a more central role.
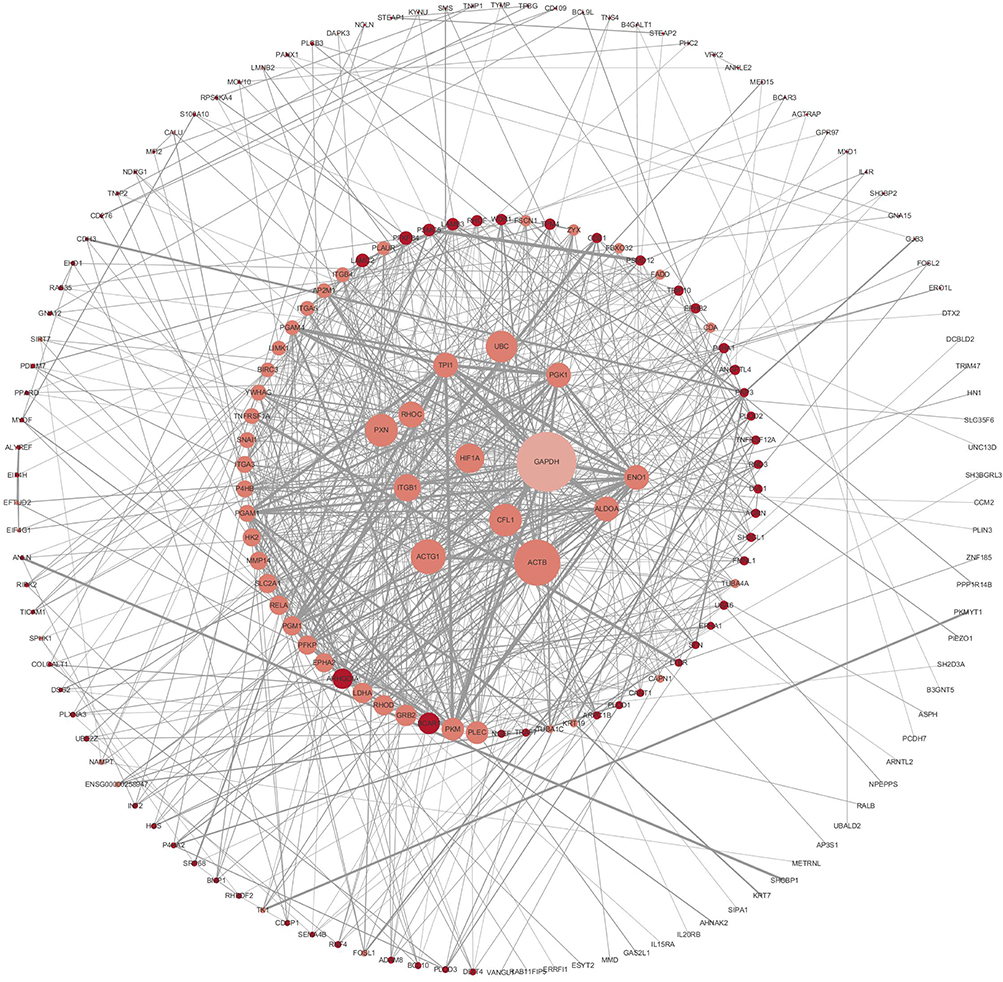 |
Figure 6 Protein-protein interaction (PPI) network for co-expressing genes: The key proteins in the interaction network have potential significance for further study. |
Immune Infiltration Linked to SLC16A3 in LUAD
Studying the relationship between genes and immune cells can help us understand their role in the immune microenvironment to facilitate the development of immunotherapy. SLC16A3 was found to be associated with multiple immune cells in LUAD, including B cells (p=9.73E-03), CD4+T cells (p=1.23E-03), macrophages (p=2.81E-03), neutrophils (p=3.30E-10), and dendritic cells (p=3.58E-06) (Figure 7).
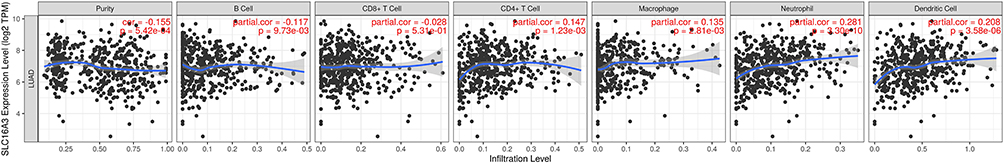 |
Figure 7 SLC16A3 was found to be associated with multiple immune cells in LUAD, including B cells (p=9.73E-03), CD4+T cells (p=1.23E-03), macrophages (p=2.81E-03), neutrophils (p=3.30E-10), and dendritic cells (p=3.58E-06). |
Relationship Between SLC16A3 and Mutation
Then we downloaded the mutation data of lung cancer through mafTools package, and showed the landscape map of the top 20 genes with the highest mutation frequency, among which TP53 and TTN genes are more prone to mutation (Figure 8A). Moreover, we found a certain correlation between SLC16A3 and tumor mutation load (TMB) through correlation analysis (Figure 8B, COR = 0.21, P <0.05). With the increase of SLC16A3 expression, TMB increased, which may be a reason for the poor prognosis of lung cancer.
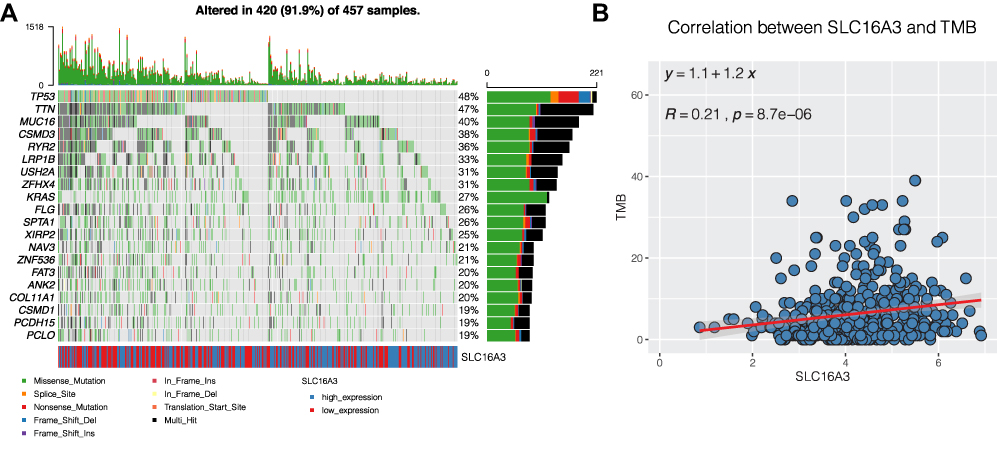 |
Figure 8 Mutation analysis of lung adenocarcinoma. (A) The landscape map of the top 20 genes with the highest mutation frequency, among which TP53 and TTN genes are more prone to mutation. (B) SLC16A3 was associated with tumor mutation load (TMB). (COR = 0.21, P <0.05). |
The Construction of a Nomogram
To further explore the role of this gene in guiding clinical practice, we constructed a Nomogram according to the expression of SLC16A3. As shown in the figure, the 1, 3 and 5 mortality rates of patient “TCGA-95-7567” were 0.0967, 0.323 and 0.563 respectively (Figure 9), which is helpful for clinical decision-making and later treatment.
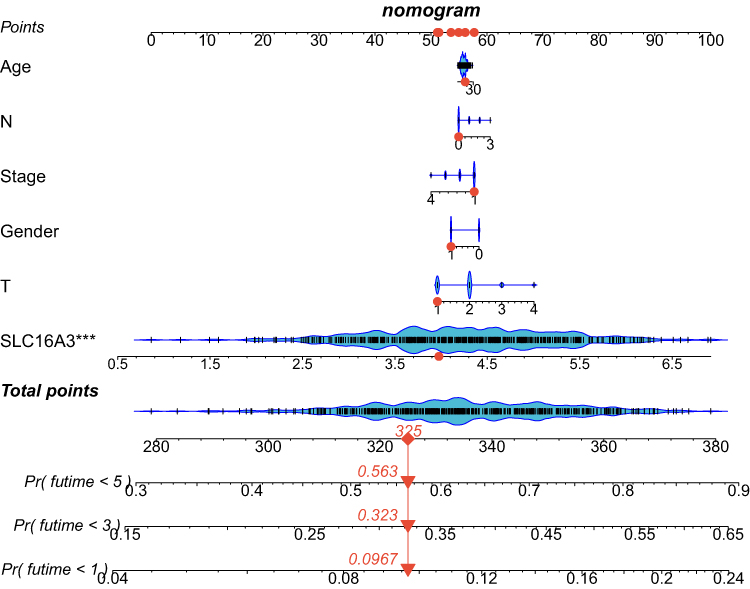 |
Figure 9 The construction of a Nomogram according to the expression of SLC16A3. The 1, 3 and 5 mortality rates of patient “TCGA-95-7567” were 0.0967, 0.323 and 0.563 respectively. |
Discussion
Lung cancer is one of the tumors with the high morbidity and mortality.12 Lung adenocarcinoma is the most common type of lung cancer in which tumor cell heterogeneity and genomic instability are common.14 EGFR mutation and ALK rearrangement often occur in lung adenocarcinoma, and many studies in recent years have proved that BRAF mutation also exists in lung adenocarcinoma.13 At present, the research on the pathogenesis of lung cancer has made rapid progress. Minimally invasive diagnosis of lung cancer, such as ctDNA, has also achieved initial results.18 Besides, targeted treatment of lung adenocarcinoma has improved the prognosis of advanced lung cancer.19 However, the emergence of drug resistance has greatly hindered the development of treatment for lung adenocarcinoma.19 Therefore, it is of great significance to find a new marker and establish a therapeutic plan based on this marker.
It is well known that cancer cells have a higher metabolic rate than normal cells as a result of environmental selection and the accumulation of mutations.20 Metabolic changes in tumors include nucleotide metabolism, amino acid metabolism, and glucose metabolism.21 Targeting metabolism therapy has been widely used in clinical practice. Sidney Farber’s 1947 discovery of aminopterin for the treatment of acute lymphoblastic leukemia in children is an example of targeted nucleotide-metabolism therapy.22 Glucose metabolism is an important energy source for tumors.23 Some substances produced by glucose metabolism, such as lactic acid, play an important role in the microenvironment of tumor cells.24 Hence, targeting glucose metabolism and reducing the production or transport of lactic acid may have significant value in the treatment of tumors.
In our study, we explored the role of SLC16A3 (MCT4) in lung adenocarcinoma. We found that compared with normal tissues, SLC16A3 expression was up-regulated in lung adenocarcinoma and was higher in the TP53 mutant group. Then, survival analysis found that SLC16A3 expression was associated with a poor prognosis of lung adenocarcinoma. Further study on the function of the co-expression pattern of SLC16A3 revealed that the co-expression pattern of SLC16A3 is associated with many metabolic functions and intercellular adhesion. Firstly, in the biological process (BP), the co-expression pattern of SLC16A3 is mainly concentrated in cell junction assembly, actin filament composition, glycolysis, etc. Secondly, in the cell composition (CC), the co-expression pattern of SLC16A3 is mainly concentrated in focal adhesion, cell-substrate junction, and cell-cell junction. Finally, in the molecular function (MF), the co-expression patterns of SLC16A3 were mainly concentrated in calcitonin binding, actin binding, and 2-oxoglutarate-dependent dioxygenase activity. KEGG enrichment analysis showed that the co-expression pattern of SLC16A3 was mainly concentrated in focal adhesion, glycolysis, HIF-1 signaling pathway, carbon metabolism in cancer, and other pathways. In addition, we found that SLC16A3 was associated with immune cell infiltration in lung adenocarcinoma.
It is important to find an effective prognostic biomarker for the treatment of a tumor with a poor prognosis. We identified SLC16A3, a valuable prognostic marker for lung adenocarcinoma, and found that it was significantly higher in the TP53 mutant group. It is well known that the occurrence of cancer requires the activation of proto-oncogenes and the inactivation of tumor suppressor genes.25 TP53 mutation is one of the most classical mutations in the tumorigenesis mechanism.25 Further study on the relationship between SLC16A3 and TP53 has potential therapeutic value.
GO enrichment analysis of the co-expression pattern of SLC16A3 found that it was related to some glucose metabolic pathways, which was consistent with known studies because SLC16A3 is a monocarboxylic acid transporter and is involved in the transport of various substances such as lactic acid and pyruvate in glycolysis.12 And on top of that, we have discovered some new things, like cell-substrate adhesion. The tumor microenvironment is composed of many substances, among which the extracellular matrix (ECM) is an important one. Cell-ECM adhesion can activate multiple pathways in tumor cells, leading to the occurrence and development of tumors, and may be related to drug resistance.26 In addition, KEGG enrichment analysis found that the co-expression pattern of SLC16A3 is related to focal adhesion and the HIF-1 signaling pathway. Focal adhesion has been proved to be associated with acquired drug resistance of tumors by multiple studies.27 The drug resistance induced by focal adhesion consists of cell adhesion-mediated drug resistance (CAMDR) and cell adhesion-mediated radioresistance (CAMRR).28 The over-activation of growth signals caused by focal adhesion makes some antitumor drugs ineffective, so reducing focal adhesion becomes a feasible solution to reduce drug resistance.
Because of the “Warburg effect” in cancer cells, that is, anaerobic glycolysis in the presence of aerobic conditions, the tumor microenvironment is often hypoxic.5 Hypoxia-related signaling pathways have been proven to be involved in tumor genesis, development, metastasis, and angiogenesis.6 The HIF-1 signaling pathway is the main signaling pathway of tumor hypoxia, Choi et al have found that SLC16A3 expression is higher under hypoxia conditions.11 The results of our KEGG enrichment analysis showed that the co-expression pattern of SLC16A3 was correlated with HIF-1, which confirmed the results of their study. At the same time, it shows the role of regulating hypoxia in the treatment of lung adenocarcinoma.
Changes in the tumor immune microenvironment are complex.29 Exploring the mechanism of immune tolerance can promote the development of immunotherapy. Current immune checkpoint inhibitors are one of the most promising therapies for oncology, such as PD-1/PD-L1 inhibitors, which have been approved by the FDA for the treatment of melanoma, non-small cell lung cancer, and other cancers.30 After finding a new prognostic marker, it is necessary to explore its role in the immune microenvironment in order to promote the development of immunotherapy. We found that SLC16A3 is associated with a variety of immune cells in lung adenocarcinomas, such as B cells, CD4+T cells, macrophages, neutrophils, and dendritic cells. This shows that SLC16A3 plays an important role in the immune system and has great research value.
A growing body of evidence reveals the potential role of SLC16A3 in cancer. Li et al found that Alkbh5 regulates the expression of Mct4/Slc16a3 and lactic acid content in the tumor microenvironment in melanoma, thus changing the level of immune cell infiltration in melanoma and affecting patient prognosis and drug response.31 Yu et al found SLC16A3 to be an effective prognostic marker for pancreatic cancer through bioinformatics analysis.32 Corbet et al found that SLC16A3 (MCT1) inhibition may be a future anticancer target.33 Yang et al found that LINC00035 promotes the OC process by promoting glycolysis and apoptosis through CEBPB mediated SLC16A3 transcription.34 Therefore, SLC16A3 is attractive in the field of cancer diagnosis and treatment in the future.
In conclusion, our study provides a novel prognostic biomarker for lung adenocarcinoma that has clinical therapeutic significance. However, due to the lack of in vivo and in vitro experimental verification, our study has limitations, which we will improve in the future.
Conclusion
SLC16A3 is an effective prognostic biomarker for lung adenocarcinoma. Its co-expression pattern is associated with multiple metabolic pathways. In addition, SLC16A3 is closely related to immune cells infiltration, and the exploration of SLC16A3-based treatment is of significant significance for improving the prognosis of lung adenocarcinoma.
Data Sharing Statement
All data can be obtained in TCGA, GEO, GEPIA, etc.
Ethics Approval
All procedures performed were in accordance with the declaration of the ethical standards of the institutional research committee and with the 1964 Helsinki 387 Declaration and its later amendments. The ethics committee has approved this study of the First Affiliated Hospital of Nanjing Medical University.
Acknowledgments
We are very grateful for data provided by databases such as TCGA, GEO, GEPIA.
Lei Xue, Jinyuan Liu, and Jiaheng Xie are the joint first authors. Jiaheng Xie and Jinhua Luo are co-corresponding authors.
Funding
No funding was received.
Disclosure
All authors declare no conflicts of interest for this work.
References
1. Graham TA, Sottoriva A. Measuring cancer evolution from the genome. J Pathol. 2017;241(2):183–191. doi:10.1002/path.4821
2. Vazquez A, Kamphorst JJ, Markert EK, Schug ZT, Tardito S, Gottlieb E. Cancer metabolism at a glance. J Cell Sci. 2016;129(18):3367–3373. doi:10.1242/jcs.181016
3. Koundouros N, Poulogiannis G. Reprogramming of fatty acid metabolism in cancer. Br J Cancer. 2020;122(1):4–22. doi:10.1038/s41416-019-0650-z
4. Liberti MV, Locasale JW. The Warburg effect: how does it benefit cancer cells? Trends Biochem Sci. 2016;41(3):211–218. doi:10.1016/j.tibs.2015.12.001
5. Pascale RM, Calvisi DF, Simile MM, Feo CF, Feo F. The Warburg Effect 97 Years after Its Discovery. Cancers. 2020;12(10):2819. doi:10.3390/cancers12102819
6. Jing X, Yang F, Shao C, et al. Role of hypoxia in cancer therapy by regulating the tumor microenvironment. Mol Cancer. 2019;18(1):157. doi:10.1186/s12943-019-1089-9
7. Xie J, Ruan S, Zhu Z, et al. Database mining analysis revealed the role of the putative H+/sugar transporter solute carrier family 45 in skin cutaneous melanoma. Channels. 2021;15(1):496–506. doi:10.1080/19336950.2021.1956226
8. Xie J, Zhu Z, Cao Y, Ruan S, Wang M, Shi J. Solute carrier transporter superfamily member SLC16A1 is a potential prognostic biomarker and associated with immune infiltration in skin cutaneous melanoma. Channels. 2021;15(1):483–495. doi:10.1080/19336950.2021.1953322
9. Watson MJ, Vignali PDA, Mullett SJ, et al. Metabolic support of tumour-infiltrating regulatory T cells by lactic acid. Nature. 2021;591(7851):645–651. doi:10.1038/s41586-020-03045-2
10. Park SJ, Smith CP, Wilbur RR, et al. An overview of MCT1 and MCT4 in GBM: small molecule transporters with large implications. Am J Cancer Res. 2018;8(10):1967–1976.
11. Choi SH, Kim MY, Yoon YS, et al. Hypoxia-induced RelA/p65 derepresses SLC16A3 (MCT4) by downregulating ZBTB7A. Biochim Biophys Acta Gene Regul Mech. 2019;1862(8):771–785. doi:10.1016/j.bbagrm.2019.06.004
12. Nasim F, Sabath BF, Eapen GA. Lung Cancer. Med Clin North Am. 2019;103(3):463–473. doi:10.1016/j.mcna.2018.12.006
13. Collins LG, Haines C, Perkel R, Enck RE. Lung cancer: diagnosis and management. Am Fam Physician. 2007;75(1):56–63.
14. Mao Y, Yang D, He J, Krasna MJ. Epidemiology of Lung Cancer. Surg Oncol Clin N Am. 2016;25(3):439–445. doi:10.1016/j.soc.2016.02.001
15. de Sousa VML, Carvalho L. Heterogeneity in Lung Cancer. Pathobiology. 2018;85(1–2):96–107. doi:10.1159/000487440
16. Chandrashekar DS, Bashel B, Balasubramanya SAH, et al. UALCAN: a Portal for Facilitating Tumor Subgroup Gene Expression and Survival Analyses. Neoplasia. 2017;19(8):649–658. doi:10.1016/j.neo.2017.05.002
17. Szklarczyk D, Morris JH, Cook H, et al. The STRING database in 2017: quality-controlled protein-protein association networks, made broadly accessible. Nucleic Acids Res. 2017;45(D1):D362–D368. doi:10.1093/nar/gkw937
18. Chae YK, Oh MS. Detection of Minimal Residual Disease Using ctDNA in Lung Cancer: current Evidence and Future Directions. J Thorac Oncol. 2019;14(1):16–24. doi:10.1016/j.jtho.2018.09.022
19. Villalobos P, Wistuba II. Lung Cancer Biomarkers. Hematol Oncol Clin North Am. 2017;31(1):13–29. doi:10.1016/j.hoc.2016.08.006
20. Park JH, Pyun WY, Park HW. Cancer Metabolism: phenotype, Signaling and Therapeutic Targets. Cells. 2020;9(10):2308. doi:10.3390/cells9102308
21. Momcilovic M, Shackelford DB. Imaging Cancer Metabolism. Biomol Ther (Seoul). 2018;26(1):81–92. doi:10.4062/biomolther.2017.220
22. Farber S, Farber S. Some observations on the effect of folic acid antagonists on acute leukemia and other forms of incurable cancer. Blood. 1949;4(2):160–167. doi:10.1182/blood.V4.2.160.160
23. Li Z, Zhang H. Reprogramming of glucose, fatty acid and amino acid metabolism for cancer progression. Cell Mol Life Sci. 2016;73(2):377–392. doi:10.1007/s00018-015-2070-4
24. Semenza GL. Hypoxia-inducible factors: coupling glucose metabolism and redox regulation with induction of the breast cancer stem cell phenotype. EMBO J. 2017;36(3):252–259. doi:10.15252/embj.201695204
25. Duffy MJ, Synnott NC, Crown J. Mutant p53 as a target for cancer treatment. Eur J Cancer. 2017;83:258–265. doi:10.1016/j.ejca.2017.06.023
26. He X, Lee B, Jiang Y. Cell-ECM Interactions in Tumor Invasion. Adv Exp Med Biol. 2016;936:73–91.
27. Paluch EK, Aspalter IM, Sixt M. Focal Adhesion-Independent Cell Migration. Annu Rev Cell Dev Biol. 2016;32:469–490. doi:10.1146/annurev-cellbio-111315-125341
28. Eke I, Cordes N. Focal adhesion signaling and therapy resistance in cancer. Semin Cancer Biol. 2015;31:65–75. doi:10.1016/j.semcancer.2014.07.009
29. Desrichard A, Snyder A, Chan TA. Cancer Neoantigens and Applications for Immunotherapy. Clin Cancer Res. 2016;22(4):807–812. doi:10.1158/1078-0432.CCR-14-3175
30. Lei Q, Wang D, Sun K, Wang L, Zhang Y. Resistance Mechanisms of Anti-PD1/PDL1 Therapy in Solid Tumors. Front Cell Dev Biol. 2020;8:672. doi:10.3389/fcell.2020.00672
31. Li N, Kang Y, Wang L, et al. ALKBH5 regulates anti-PD-1 therapy response by modulating lactate and suppressive immune cell accumulation in tumor microenvironment. Proc Natl Acad Sci U S A. 2020;117(33):20159–20170. doi:10.1073/pnas.1918986117
32. Yu S, Wu Y, Li C, et al. Comprehensive analysis of the SLC16A gene family in pancreatic cancer via integrated bioinformatics. Sci Rep. 2020;10(1):7315. doi:10.1038/s41598-020-64356-y
33. Corbet C, Bastien E, Draoui N, et al. Interruption of lactate uptake by inhibiting mitochondrial pyruvate transport unravels direct antitumor and radiosensitizing effects. Nat Commun. 2018;9(1):1208. doi:10.1038/s41467-018-03525-0
34. Yang S, Wang J, Cheng R, Pang B, Sun P. LINC00035 Transcriptional Regulation of SLC16A3 via CEBPB Affects Glycolysis and Cell Apoptosis in Ovarian Cancer. Evid Based Complement Alternat Med. 2021;2021:5802082. doi:10.1155/2021/5802082
 © 2021 The Author(s). This work is published and licensed by Dove Medical Press Limited. The full terms of this license are available at https://www.dovepress.com/terms.php and incorporate the Creative Commons Attribution - Non Commercial (unported, v3.0) License.
By accessing the work you hereby accept the Terms. Non-commercial uses of the work are permitted without any further permission from Dove Medical Press Limited, provided the work is properly attributed. For permission for commercial use of this work, please see paragraphs 4.2 and 5 of our Terms.
© 2021 The Author(s). This work is published and licensed by Dove Medical Press Limited. The full terms of this license are available at https://www.dovepress.com/terms.php and incorporate the Creative Commons Attribution - Non Commercial (unported, v3.0) License.
By accessing the work you hereby accept the Terms. Non-commercial uses of the work are permitted without any further permission from Dove Medical Press Limited, provided the work is properly attributed. For permission for commercial use of this work, please see paragraphs 4.2 and 5 of our Terms.