Back to Journals » OncoTargets and Therapy » Volume 14
Prognostic Value and Biological Functions of RNA Binding Proteins in Stomach Adenocarcinoma
Authors Li J, Zhou W, Wei J ![]() , Xiao X, An T
, Xiao X, An T ![]() , Wu W, He Y
, Wu W, He Y ![]()
Received 18 December 2020
Accepted for publication 19 February 2021
Published 4 March 2021 Volume 2021:14 Pages 1689—1705
DOI https://doi.org/10.2147/OTT.S297973
Checked for plagiarism Yes
Review by Single anonymous peer review
Peer reviewer comments 2
Editor who approved publication: Dr Arseniy Yuzhalin
Junqing Li,1,2,* Wenjie Zhou,1,2,* Jitao Wei,3 Xing Xiao,3 Tailai An,1 Wenhui Wu,1 Yulong He1,2
1Digestive Disease Center, Seventh Affiliated Hospital, Sun Yat-sen University, Shenzhen, 518000, People’s Republic of China; 2Department of Gastrointestinal Surgery, First Affiliated Hospital, Sun Yat-sen University, Guangzhou, 510080, People’s Republic of China; 3Scientific Research Center, Seventh Affiliated Hospital, Sun Yat-sen University, Shenzhen, 518000, People’s Republic of China
*These authors contributed equally to this work
Correspondence: Wenhui Wu Tel +86 18928805498
Email [email protected]
Yulong He Tel +86 18922282223
Email [email protected]
Purpose: To investigate the prognostic value and biological function of RNA binding proteins (RBPs) in stomach adenocarcinoma (STAD).
Materials and Methods: Datasets of the differentially expressed genes (DEGs) were downloaded from the TCGA-based (The Cancer Genome Atlas) GEPIA database, from which the differentially expressed RBPs were determined. Functions and prognostic values of these determined RBPs were systematically investigated by a series of methods in bioinformatics analysis. In addition, transwell assays were performed to explore the effect of PTBP1 in STAD cells.
Results: Three hundred and sixty-two differentially expressed RBPs were determined, with 331 up-regulated and 31 down-regulated. Seven RBPs (PTBP1, PPIH, SMAD5, MSI2, RBM15, MRPS17, and ADAT3) were identified to be prognosis-related and adopted to construct a prognostic model. Compared with low-risk patients in TCGA training cohort, TCGA testing cohort and GEO cohort, high-risk patients had poorer overall survival (OS). The area under the ROC curves of this prognostic model were 0.804, 0.644 and 0.581 for TCGA training cohort, TCGA testing cohort and GEO cohort, respectively, justifying itself as a good prognostic model with reliable predictive ability. Using the seven identified RBPs, we then constructed a nomogram to generate a clinical utility model. The regulatory networks and functions of the seven RBPs were then investigated, the results of which demonstrated that MRPS17 and PTBP1 reduced the number of infiltrated immune cells. In-vitro experiments showed that the downregulation of PTBP1 weakened the migration and invasion capability of AGS and HGC27 cells.
Conclusion: The seven-gene signature can be used as a reliable STAD prognostic biomarker, and these findings help us better understand the prognostic roles and functions of RBPs in STAD.
Keywords: RNA binding proteins, stomach adenocarcinoma, TCGA, prognostic model, infiltrated immune cells
Introduction
Globally, stomach adenocarcinoma (STAD) is a common malignant tumor with high mortality.1 Survival of patients with early STAD has been remarkably improved due to progress made in diagnosis and treatment over the last few decades.2 Unfortunately, the prognosis of advanced STAD patients remains dismal due to the lack of effective treatment. Little progress has been made in improving patients, survival despite the application of chemotherapy, targeted therapy and immunotherapy.3 The role of immunotherapy still needs further verification.3 Thus, it is still an urgent task for scientists to elucidate molecular mechanisms of STAD that may help us design new therapeutic strategies and improve the prognosis of patients with advanced STAD.
RNA binding proteins (RBPs) are a class of proteins that interact with various types of RNA, such as mRNAs, tRNAs, snRNAs, snoRNAs and others4,5. In human cells, more than 1500 RBPs have been identified through genome-wide screening, accounting for more than 7.5% of protein-encoding genes.4,5 By regulating processing, translation, export, and localization of target RNAs, RBPs play crucial roles in post-transcriptional regulation.6 It has demonstrated that the abnormal expression of RBPs is associated with cancer and many other diseases.7 For example, as one of the most RBP implicated in tumorigenesis, HuR has been reported to be associated with the prognosis of many malignant tumors, such as lung cancer, gallbladder cancer, ovarian cancer, breast cancer and colon cancer.8 Nucleolin promotes the occurrence of breast cancer through activating ERBB2.9 FOXK2 promotes colorectal cancer metastasis by upregulating mRNA expression of ZEB1 and EGFR.10 ESPR1 promotes the mesenchymal-epithelial transition of ovarian cells.11 AGO2 facilitates cancer progression by increasing oncogenic miR-19b biogenesis.12 Taken together, these studies indicate that RBPs are closely related to the occurrence and development of human tumors. However, till today, the roles of RBPs in STAD have only been superficially investigated.6 Thus, a systematic investigation of RBPs, roles in STAD is warranted since it can help us better understand novel mechanisms of SATD development and improve the prognosis of STAD patients.
In the present study, data of STAD were downloaded from TCGA, from which differentially expressed RBPs were identified and the potential functions and mechanisms of these RBPs were explored. An RBPs-based prognostic model was also developed and validated as some RBPs could be used as potential prognostic biomarkers.
Materials and Methods
Data Processing
STAD RNA-sequencing and clinical dataset were downloaded from TCGA (https://portal.gdc.cancer.gov/) and GEO datasets (GSE84437). GSE84437 dataset included gene expression data from 433 samples, which was obtained through the Illumina HumanHT-12 V3.0 Expression BeadChip platform. We used the ANOVA method to obtain the differently expressed genes (DEGs) from the GEPIA online database (http://gepia.cancer-pku.cn/index.html) in view of |log2fold change (FC)|>1 and p<0.01. We extracted 1542 RBPs gene names from Gerstberger’s article.5 Volcanic maps of DEGs and differently expressed RBPs were produced via an online tool (https://www.omicstudio.cn/tool).
GO Enrichment and KEGG Pathway Analysis
Gene ontology (GO) enrichment and kyoto encyclopedia of genes and genomes (KEGG) pathway analysis were performed by utilizing an online WEB-based Gene Set Analysis Toolkit (WebGestalt, http://www.webgestalt.org/).13
Construction and Validation of Prognostic Models
STAD database in TCGA was randomly divided into training and testing cohorts. Univariate Cox regression analysis was performed on all differently expressed RBPs in the TCGA training dataset using the survival R package. The significance of candidate genes was verified by Log rank test. Subsequently, a multivariate Cox proportional hazards regression model was constructed based on the above significant candidate genes, and the risk score (RS) was calculated to assess patient prognosis outcomes. The RS formula for each sample was as follows: RS= β1*Exp1 + β2*Exp2 + βi*Expi, where β represented the coefficient value, and Exp represented the gene expression level. According to the median RS survival analysis, STAD patients were divided into low-risk and high-risk groups. OS of the two subgroups were compared by Log rank test. The predictive capability of the aforementioned prognostic model was evaluated by SurvivalROC package.14 TCGA testing cohort and GEO cohort were used as the validation groups to confirm the predictive capability of this prognostic model. The prognostic value of hub RBPs in STAD was also verified by the Kaplan-Meier plotter (https://kmplot.com/analysis/)15 online tool. Finally, the nomogram was conducted using R package to forecast the likelihood of OS. P<0.05 was considered as a significant difference.
Biology Network
To understand the mechanisms and functions of hub RBPs in STAD, we created tissue-specific protein–protein interaction (PPI), transcription factor (TF)–gene interaction and miRNA–gene interaction network of prognosis-related hub RBPs under the condition that betweenness was greater than 1 using Cytoscape 3.7.2, based on the data from NetworkAnalyst 3.0 (https://www.networkanalyst.ca/NetworkAnalyst/home.xhtml).16 Function enrichment analysis of prognosis-related hub RBPs was performed by the ClueGO plug to Cytoscape 3.7.2.
Tumor Immune Infiltrating Analysis
To fully understand the function of hub RBPs, we assessed the relationship between hub RBPs expression and tumor-infiltrating lymphocytes (TILs) abundance via TISIDB (http://cis.hku.hk/TISIDB/).17 TISIDB is a web portal for tumor and immune system interaction, which integrates multiple heterogeneous data types.
Cell Culture and siRNA Transfection
AGS and HGC27 cell lines were purchased from the Cell Bank of the Chinese Academy of Sciences (Shanghai, China). HGC27 cells were cultured in RPMI-1640 medium (Biological Industries, Shanghai, China), while AGS cells were cultured in DMEM/F-12 medium (Biological Industries, Shanghai, China). All media were supplemented with 10% fetal bovine serum (FBS; Gibco, Logan, UT, USA). Cells were grown at 37°C in an atmosphere of 5% CO2. The genOFF PTBP1 siRNA and negative control siRNA oligonucleotides were designed and synthesized by Ribobio (Guangzhou, China). Sequences of si-1 and si-2 were as follows: GCCTCAACGTCAAGTACAA, and GCACAGTGTTGAAGATCAT. The siRNA transfections were performed with Ribo FECT™CP Transrection Kit (Ribobio, Guangzhou, China) in accordance with the manufacturer’s instructions. In-vitro experiments were approved by the Ethics Committee of The Seventh Affiliated Hospital of Sun Yat-sen University.
RNA Extraction and Quantitative Real-Time PCR
Under instructions provided by the manufacture, total RNA was retrieved with AG RNAex Pro Reagent (Accurate Biology, Changsha, China) and was reverse‐transcribed into cDNA by Evo M-MLV RT Premix Kit (Accurate Biology). Quantitative real-time PCR (RT-PCR) assays were performed using SYBR® Green Premix Pro Taq HS qPCR Kit (Accurate Biology) by CFX96 Touch Deep Well Real-Time PCR System (Bio-Rad, Guangzhou, China) according to the manufacturers’ protocols. The PCR primer sequences were: GAPDH(F):ACAACTTTGGTATCGTGGAAGG; GAPDH(R):GCCATCACGCCACAGTTTC; PTBP1(F):AGCGCGTGAAGATCCTGTTC; PTBP1(R):CAGGGGTGAGTTGCCGTAG.
Western Blotting
Cells were washed with PBS and lysed with RIPA lysis buffer containing phosphatase and protease inhibitor reagents (Beyotime Biotechnology, Shanghai, China), which were then separated with the method of SDS-PAGE. Then, the proteins separated by SDS-PAGE were transferred onto PVDF membranes (Merck Millipore, Billerica, MA, USA). After being loaded with transferred proteins, these PVDF membranes were soaked in 5% BSA (Beyotime Biotechnology) solution for at least 1 hour at room temperature, which was immediately followed by incubation with different primary antibodies at 4°C overnight. Then on the second day, after being washed three times, the PVDF membranes were soaked into a solution containing HRP-conjugated goat anti-rabbit IgG (SA00001-2, Proteintech, Wuhan, China) for at least 1 hour at room temperature. After being washed with TBST solution for 20 minutes, these PVDF membranes containing antibody-conjugated protein bands were visualized with a BeyoECL Plus Kit (Beyotime Biotechnology). Anti-GADPH (10,494-1-AP) and anti-PTBP1 antibody (12,582-1-AP) were purchased from Proteintech.
Cell Migration and Invasion Assays
In order to assess the effects of PTBP1 expression on the migration and invasion capability of STAD cells, we subsequently performed transwell assays. For migration assay, 5 × 10^4 cells were seeded into the upper chamber containing serum-free medium (8-μm pore size, Corning, NY, USA), while the lower chamber was filled with 10% fetal bovine serum-supplemented medium. For invasion assay, 5 × 10^4 cells were seeded into the upper chamber covered with 10% Matrigel (Corning). AGS and HGC27 cells were incubated for 24 h. Cells left in the upper chamber after the incubation period were wiped off by swabs. Then, cells that have transpassed the membrane were fixed with 4% paraformaldehyde and stained with 0.1% crystal violet. These cells migrating or invading the lower chamber were counted using five different fields under a microscope.
Statistical Analysis
For in-vitro experiments, all quantitative data are presented as the mean ± standard deviation of three independent experiments. Differences between the three groups were analyzed with one-way ANOVA using GraphPad Prism 8.0 (GraphPad, La Jolla, CA, USA). A P-value <0.05 was considered statistically significant.
Results
Differentially Expressed RBPs in STAD
The study design is illustrated in Figure 1. It was revealed by GEPIA analysis that DEGs in STAD included 896 downregulated genes and 3475 upregulated genes (Figure 2A). Among the 1542 RBPs, 362 were differentially expressed with 331 upregulated and 31 downregulated (Figure 2B, Table S1).
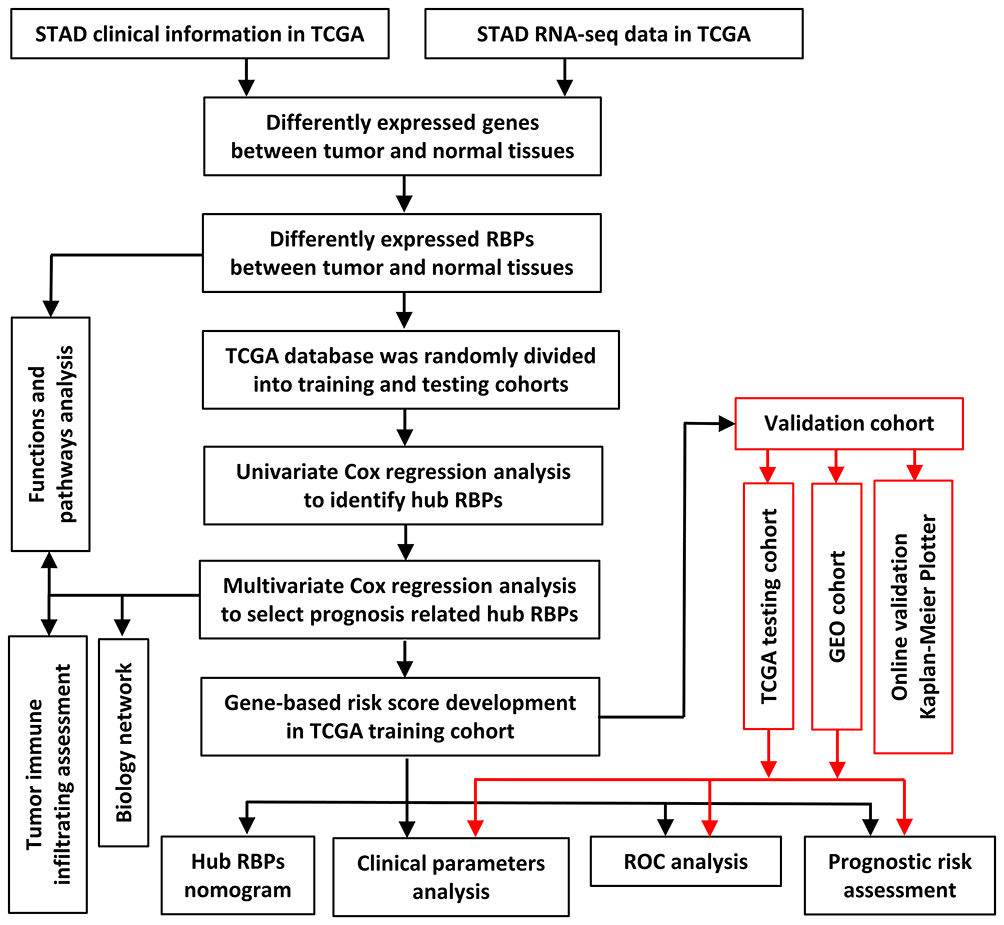 |
Figure 1 Framework for analyzing RBPs in STAD. |
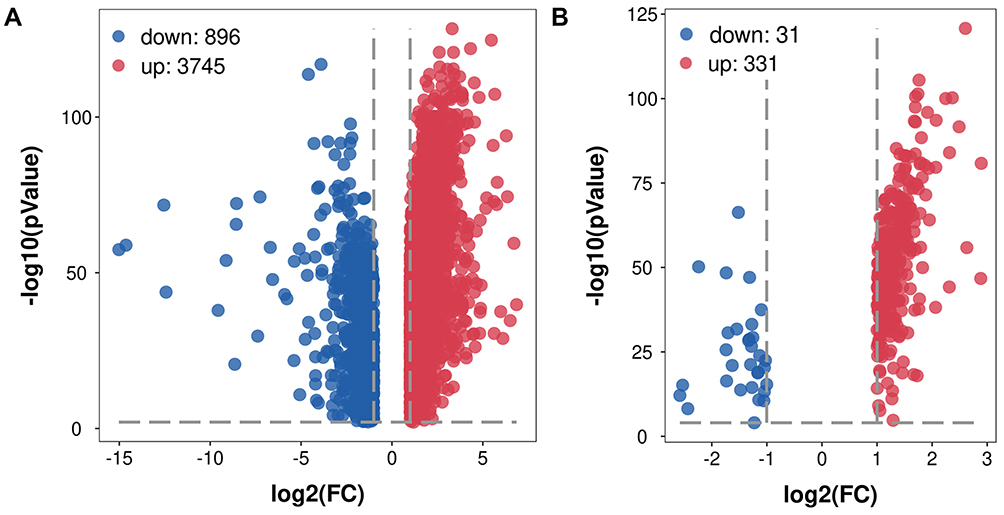 |
Figure 2 Volcano plot of related DEGs in STAD. (A) Volcano plot of all DEGs in STAD. (B) Volcano plot of differentially expressed RBPs in STAD. |
GO and KEGG Pathway Enrichment Analysis of the Differentially Expressed RBPs
To explore the functions and mechanisms of these differentially expressed RBPs, we performed the functional analysis for downregulated and upregulated RBPs via WebGestalt.
As shown in Table 1, significant differences were observed in functional enrichment of downregulated and upregulated RBPs. As for localization within the cell, downregulated RBPs were enriched in U2-type spliceosomal complex, spliceosomal snRNP complex, U2-type prespliceosome, prespliceosome and U1 snRNP, and upregulated RBPs in U1 snRNP, U4 snRNP, U12-type spliceosomal complex, box H/ACA snoRNP complex and histone pre-mRNA 3ʹend processing complex. Differences in localization within the cell meant different molecular function, which was further confirmed by molecular functional analysis. Molecular functional analysis demonstrated that downregulated RBPs participated in RNA binding, mRNA binding and snRNA binding and upregulated RBPs in RNA 7-methylguanosine cap binding, exoribonuclease activity, transforming growth factor-beta receptor, box H/ACA snoRNA binding and snRNP binding (Table 1). Biological process analysis showed that downregulated RBPs were related to positive regulation of mRNA processing, mRNA splice site selection, positive regulation of RNA splicing, positive regulation of mRNA splicing and regulation of chaperone-mediated autophagy while upregulated RBPs to ribosomal subunit export from the nucleus, termination of RNA polymerase II transcription, positive regulation of cytoplasmic mRNA processing body assembly, regulation of ribonuclease activity and mRNA cleavage involved in gene silencing (Table 1).
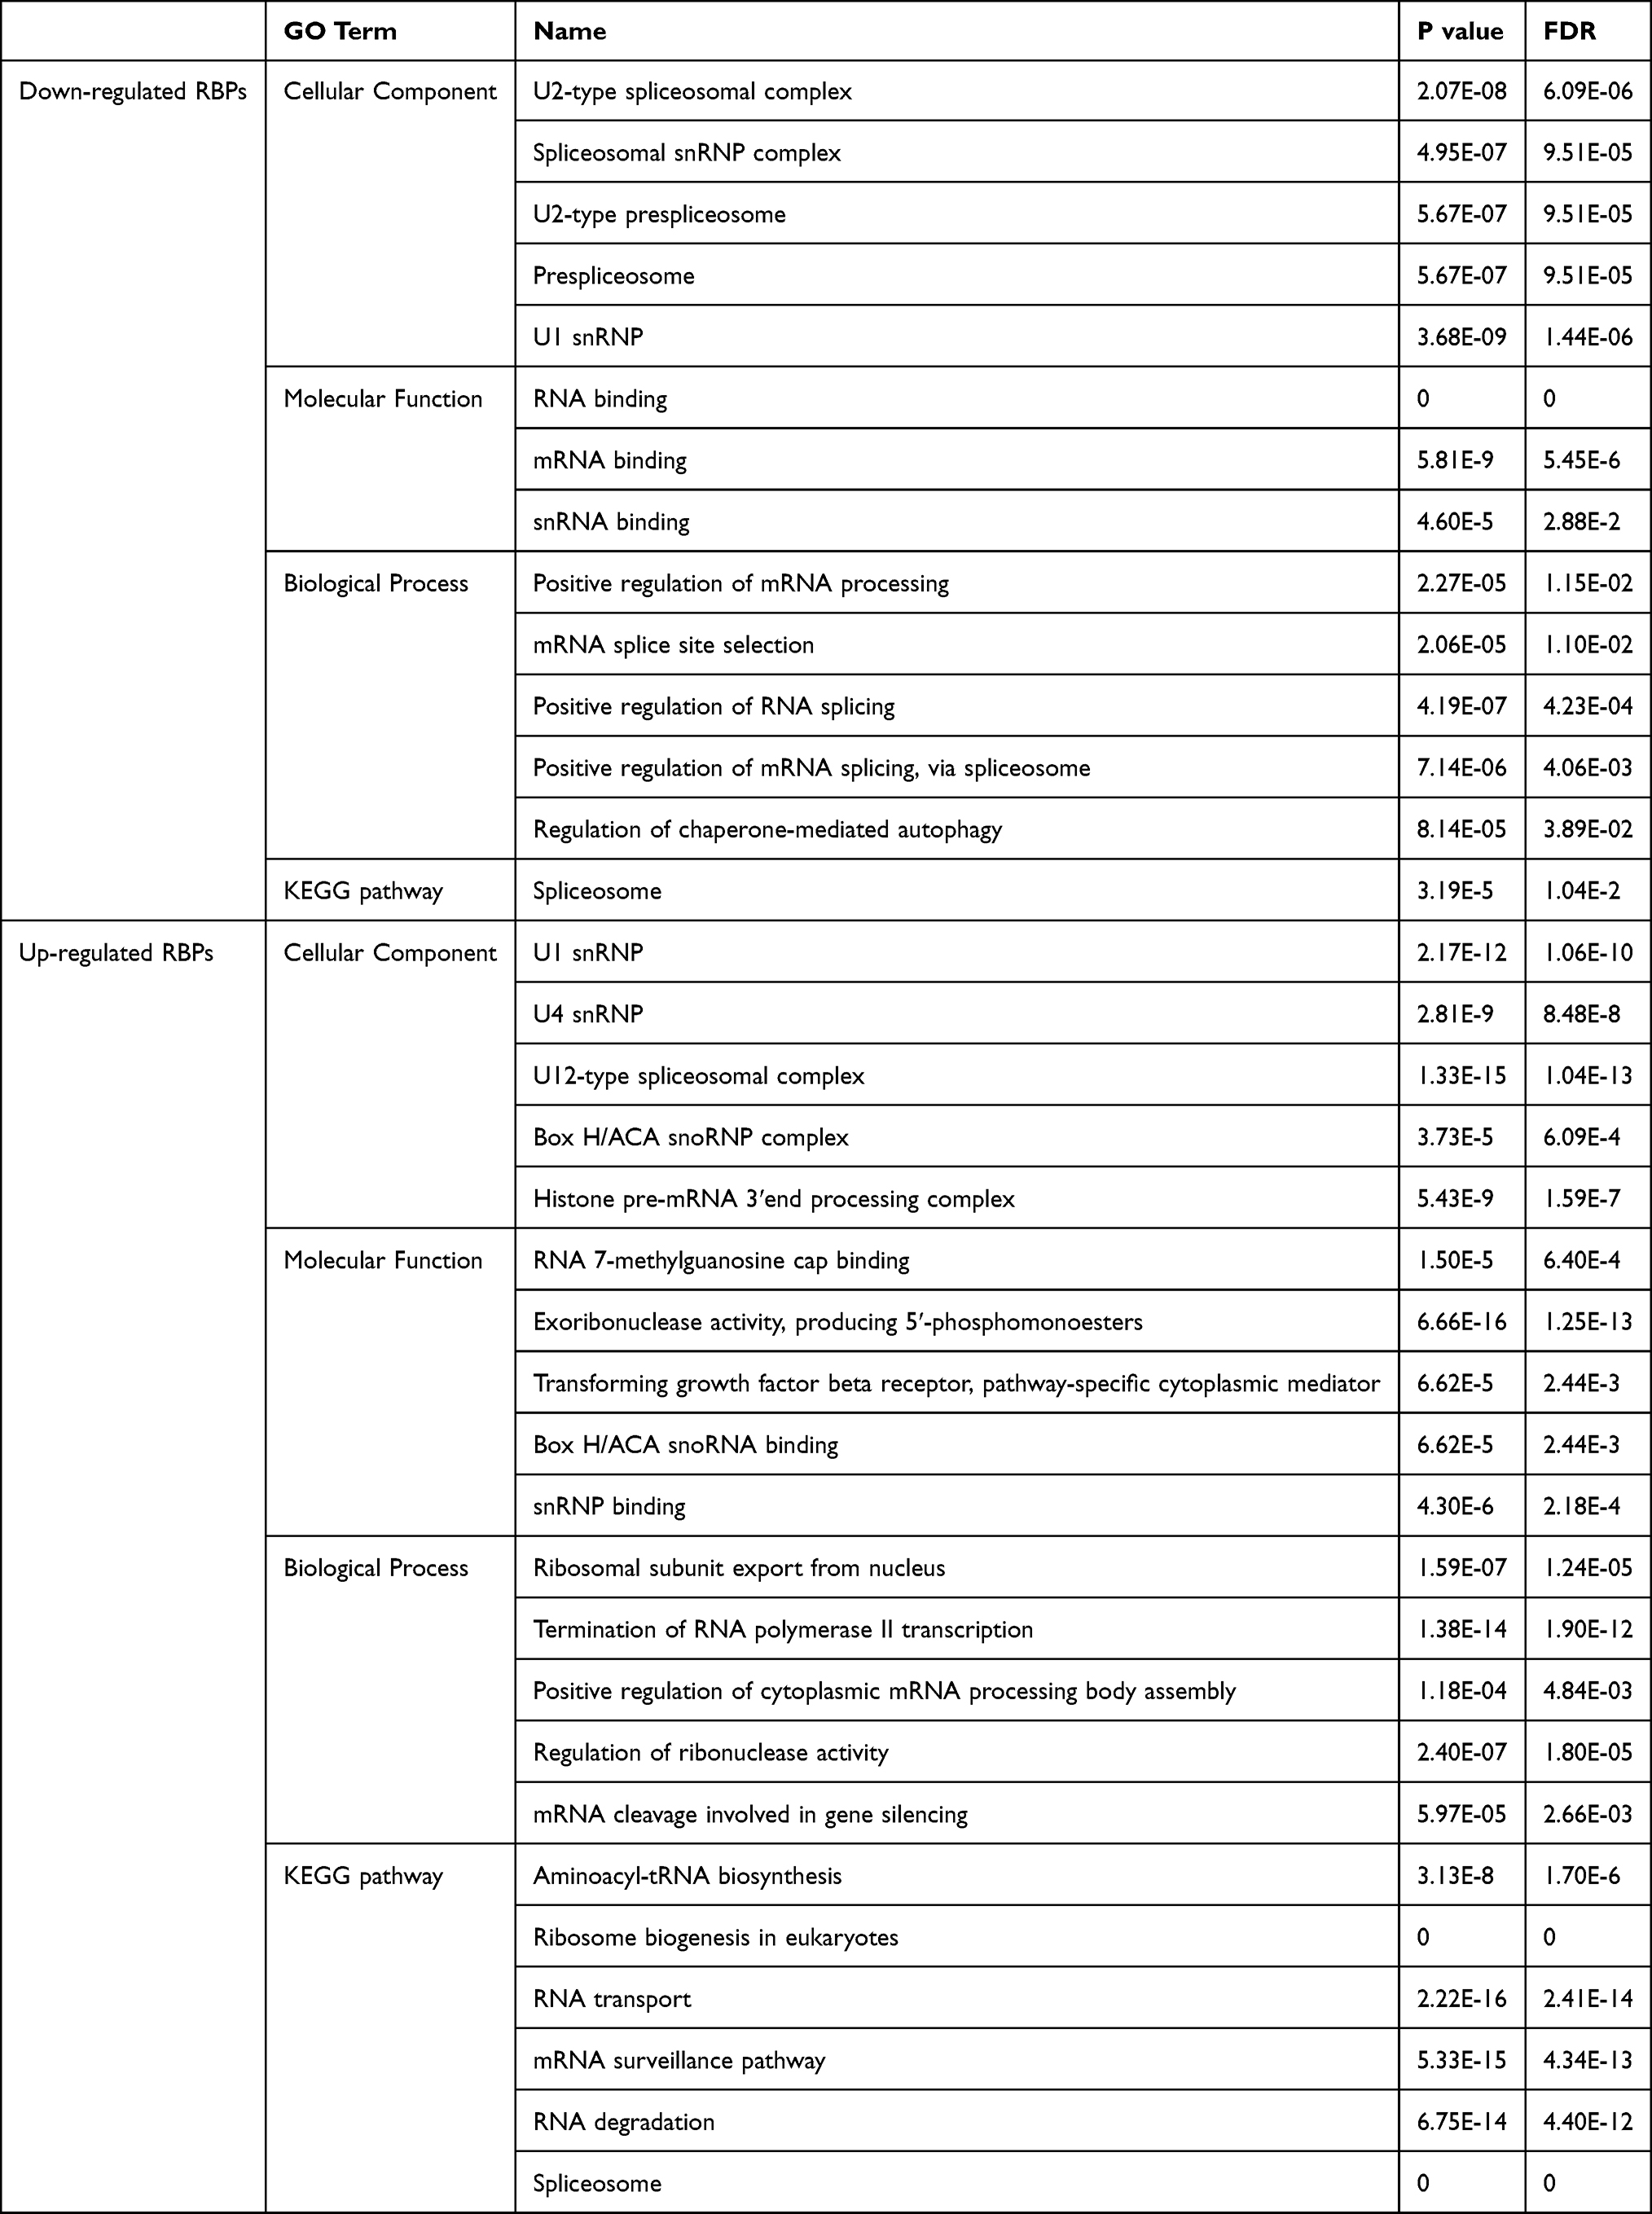 |
Table 1 GO Enrichment and KEGG Pathway Analysis of Differently Expressed RBPs |
Moreover, downregulated RBPs were only enriched in the spliceosome pathway, while upregulated RBPs significantly in aminoacyl-tRNA biosynthesis, ribosome biogenesis in eukaryotes, RNA transport, mRNA surveillance pathway, RNA degradation and spliceosome (Table 1).
Prognosis-Related Hub RBPs
To further analyze the effects of RBPs on the prognosis of STAD patients, we assessed the relationship between the differentially expressed RBPs and OS through the univariate Cox regression analysis and Kaplan–Meier method in the TCGA training cohort, the results of which suggested that 25 candidate hub RBPs were significantly associated with OS (Table 2). Afterwards, the impacts of these 25 candidate hub RBPs on OS were evaluated by multivariate analysis, the results of which demonstrated that seven hub RBPs were independent prognostic predictors for STAD patients (Table 2).
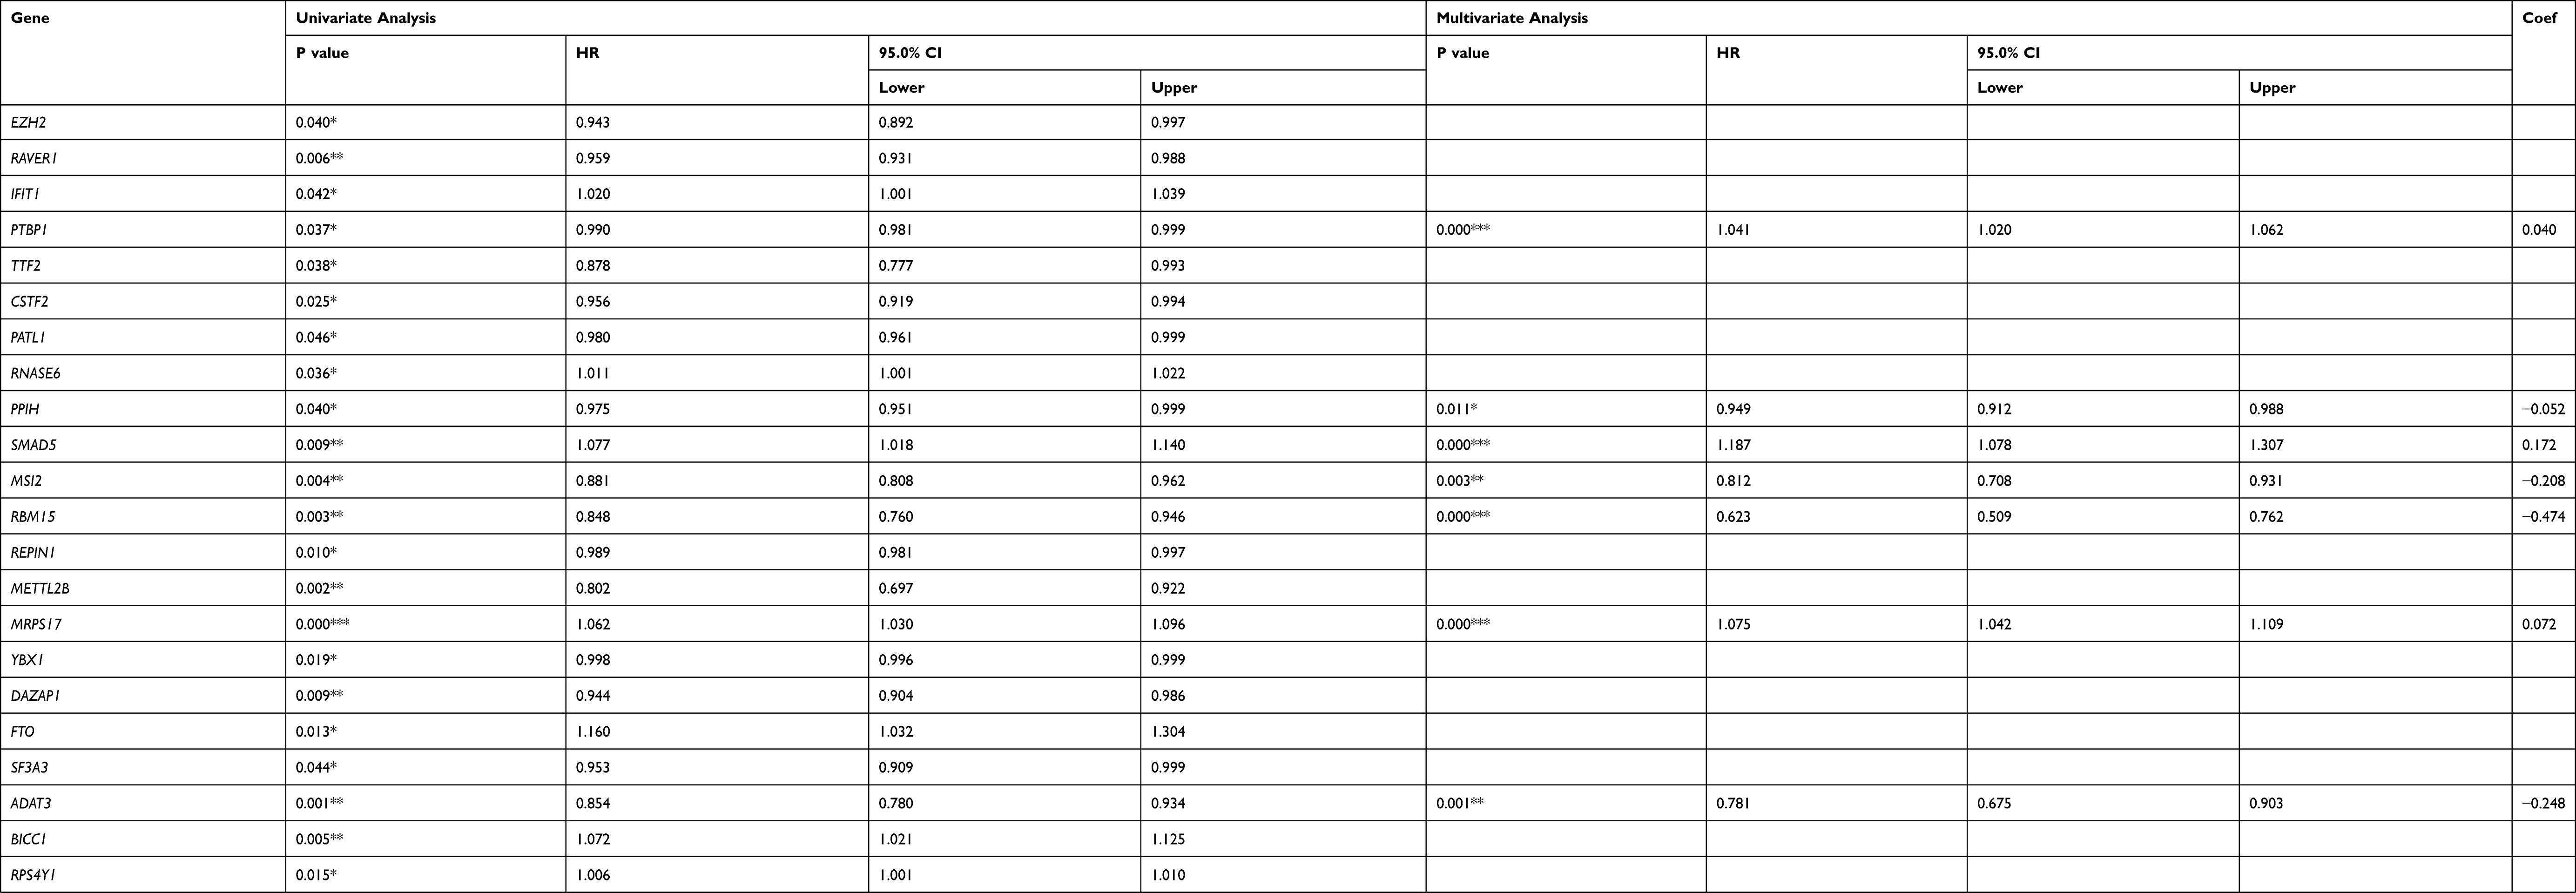 |
Table 2 Cox Regression Analysis for Identification of Hub RBPs in the Training Dataset |
Construction of Prognostic Model
A predictive model based on the aforementioned seven hub RBPs was then established. According to the formula: RS= (0.040* Exp PTBP1) + (−0.052* Exp PPIH) + (0.172* Exp SMAD5) + (−0.208* Exp MSI2) + (−0.474* Exp RBM15) + (0.072* Exp MRPS17) + (−0.248* Exp ADAT3), RS of each individual patient was assessed. The predictive capability of RS was evaluated by survival analysis. According to the median RS, the 187 patients from TCGA training cohort were assigned into low-risk group and high-risk group. Results of survival analysis demonstrated that compared with patients of the low-risk group, those of high-risk group had significantly poorer OS (p<0.001, Figure 3A). In order to further evaluate the prognostic capability of the seven identified hub RBPs, we subsequently performed a time-dependent ROC analysis, the results of which demonstrated that the area under the ROC curve (AUC) of this RBPs RS model was 0.804 (Figure 3B), indicating the moderate diagnostic performance of this model. The survival status of patients, RS and expression heat map of the signature consisting of seven hub RBPs in the low- and high-risk subgroups are displayed in Figure 3C–E.
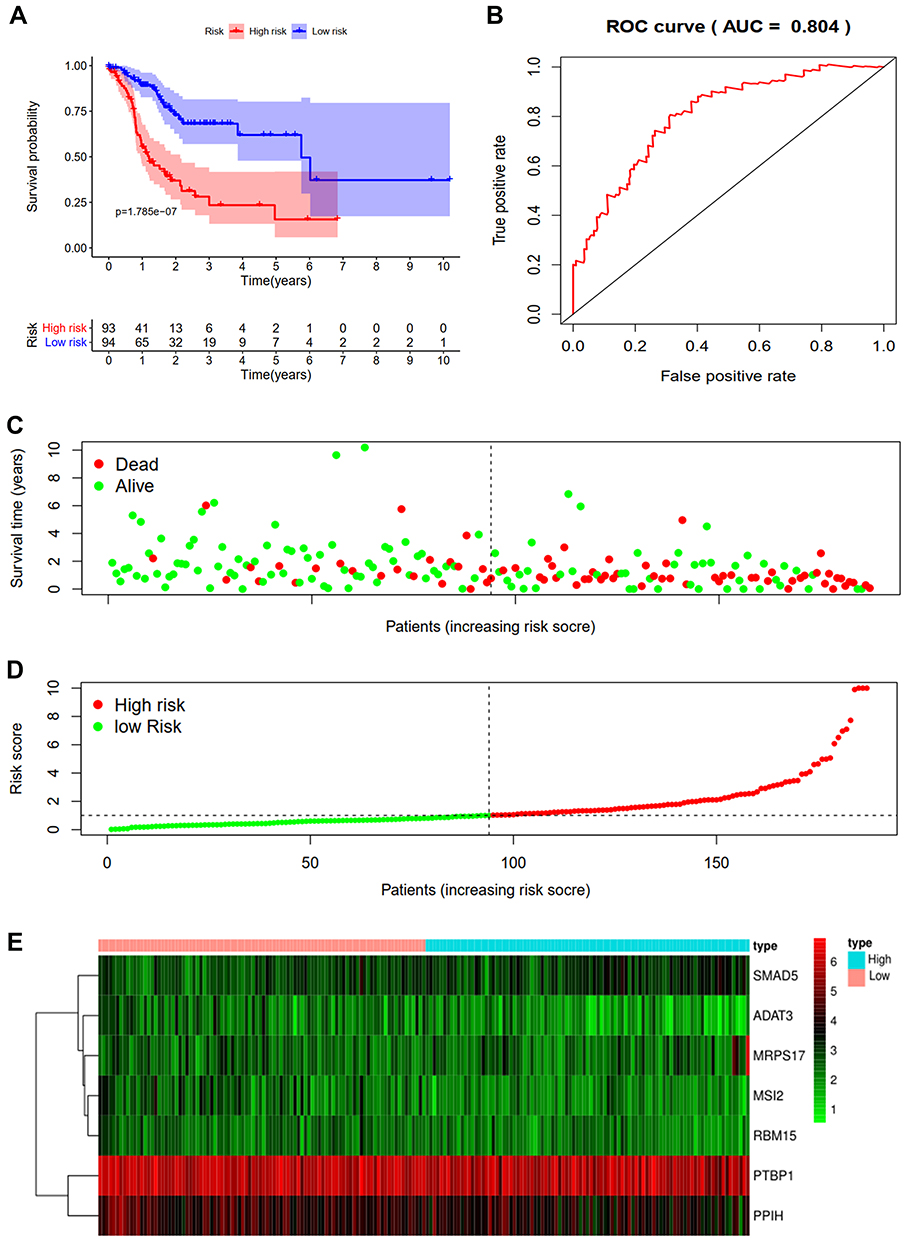 |
Figure 3 Risk score analysis of seven-genes prognostic model in the TCGA training cohort. (A) Survival curve for low- and high-risk subgroups. (B) ROC curves for forecasting OS based on risk score. (C) Survival status. (D) Risk score. (E) Expression heat map. |
Validation of Prognostic Model
To further verify the validity of the seven RBPs-based predictive model, we analyzed the TCGA testing cohort included 184 STAD patients and GEO cohort (GSE84437) included 433 STAD patients, the results of which showed that compared with patients with low-risk score, those with high-risk score had significantly worse OS (p<0.05, Figure 4A; p<0.05, Figure S1A). AUC of the TCGA testing cohort and GEO cohort were 0.644 (Figure 4B) and 0.581 (Figure S1B), which suggested good sensitivity and specificity of the predictive model. The survival status of patients, RS and expression heat map of seven hub RBPs in the TCGA testing cohorts and GEO cohort are shown in Figure 4C–E and Figure S1C–E. Additionally, the prognostic significance of different variables was assessed among patients of TCGA training cohort, TCGA testing cohort and GEO cohort by Cox regression analysis, the results of which demonstrated that for three cohorts, RS were independent prognostic factors of OS (p<0.01, Figure 5A; p<0.05, Figure 5B; p<0.01, Figure S1F). The prognostic values of the seven hub RBPs were also further investigated by Kaplan-Meier plotter online tool, the results of which revealed that all the seven hub RBPs were not only significantly associated with OS but also with relapse free survival (RFS) (Figure S2). In summary, all the aforementioned results suggested that the seven RBPs-based prognostic model was reliable in predicting outcomes of STAD patients.
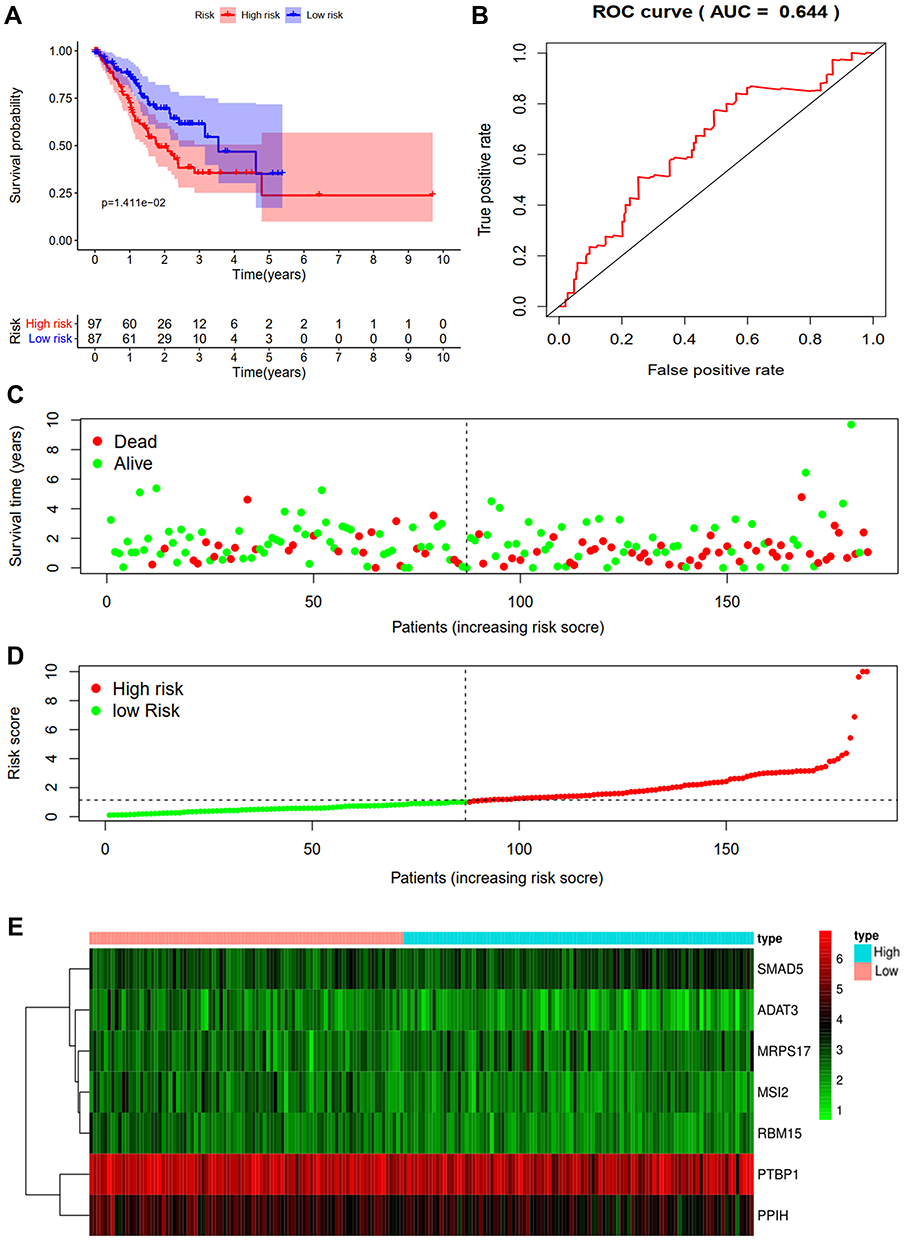 |
Figure 4 Risk score analysis of seven-genes prognostic model in the TCGA testing cohort. (A) Survival curve for low- and high-risk subgroups. (B) ROC curves for forecasting OS based on risk score. (C) Survival status. (D) Risk score. (E) Expression heat map. |
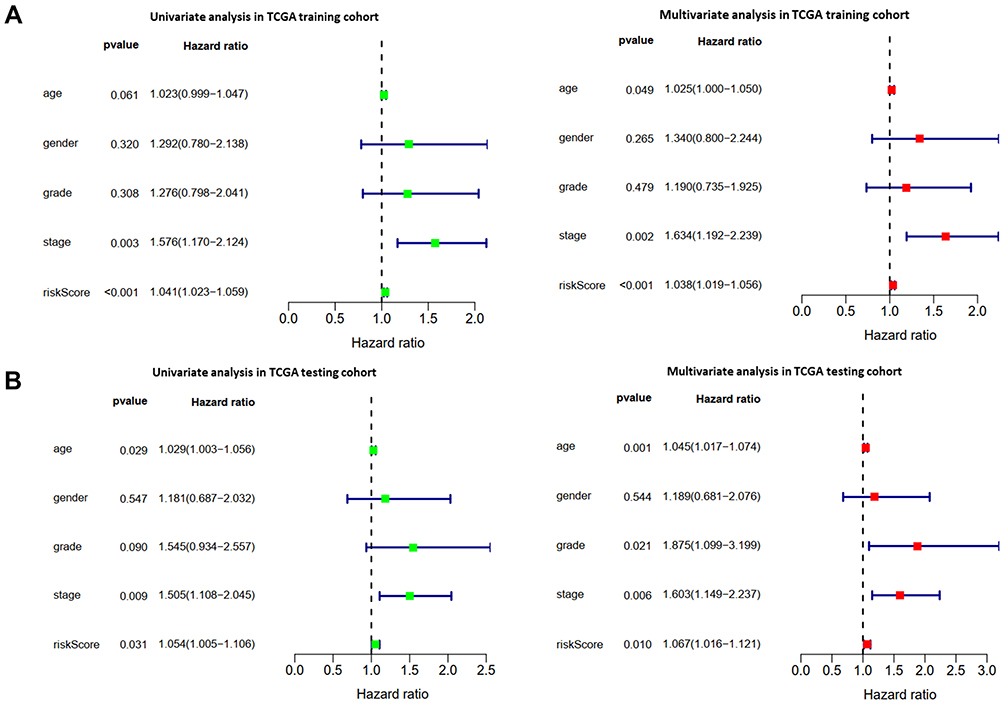 |
Figure 5 The prognostic value of different clinical parameters. (A, B) Univariate and multivariate COX regression analysis of different clinical parameters in TCGA training and TCGA testing cohort. |
Building a Predictive Nomogram
A nomogram was constructed to generate a clinically practical model that would enable physicians to evaluate the prognosis of STAD patients using the seven hub RBPs (Figure 6). Based on the results of multivariate Cox analysis, the corresponding points were assigned to each individual variable according to the point scale in the nomogram. A horizontal line was drawn to determine the point of each variable. The total point for each patient was calculated by adding up the points of all variables, based on which we estimated the survival rate of each patient at 1 year, 2 years, and 3 years.
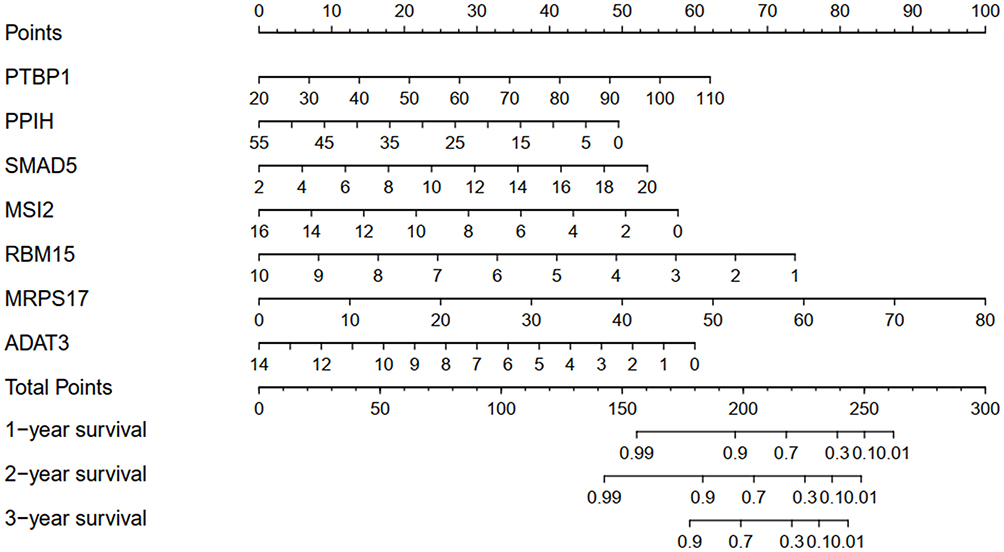 |
Figure 6 Nomogram for predicting 1, 2, and 3 year OS of STAD patients in the TCGA training cohort. |
Biology Network and Functions of the Seven Hub RBPs
To further investigate the functions of the seven hub RBPs in STAD, we created TF-gene, micro-RNA and tissue-specific PPI network of the seven hub RBPs. TF-gene-specific network included 68 nodes, 152 edges and 7 seeds (PTBP1, PPIH, SMAD5, MSI2, RBM15, MRPS17, and ADAT3) (Figure 7A), miRNA-gene-specific network 36 nodes, 64 edges and 4 seeds (MRPS17, MSI2, SMAD5 and PTBP1) (Figure 7B), and tissue-specific PPI network 14 nodes, 19 edges and 5 seeds (PPIH, RBM15, PTBP1, SMAD5 and MSI2) (Figure 7C). Finally, function enrichment analysis revealed that they were enriched in tRNA wobble base modification, thrombopoietin-mediated signaling pathway, Mullerian duct regression, poly-pyrimidine tract binding and U4/U6 snRNP (Figure 7D). All these results suggested that the seven hub RBPs were widely involved in many biological processes.
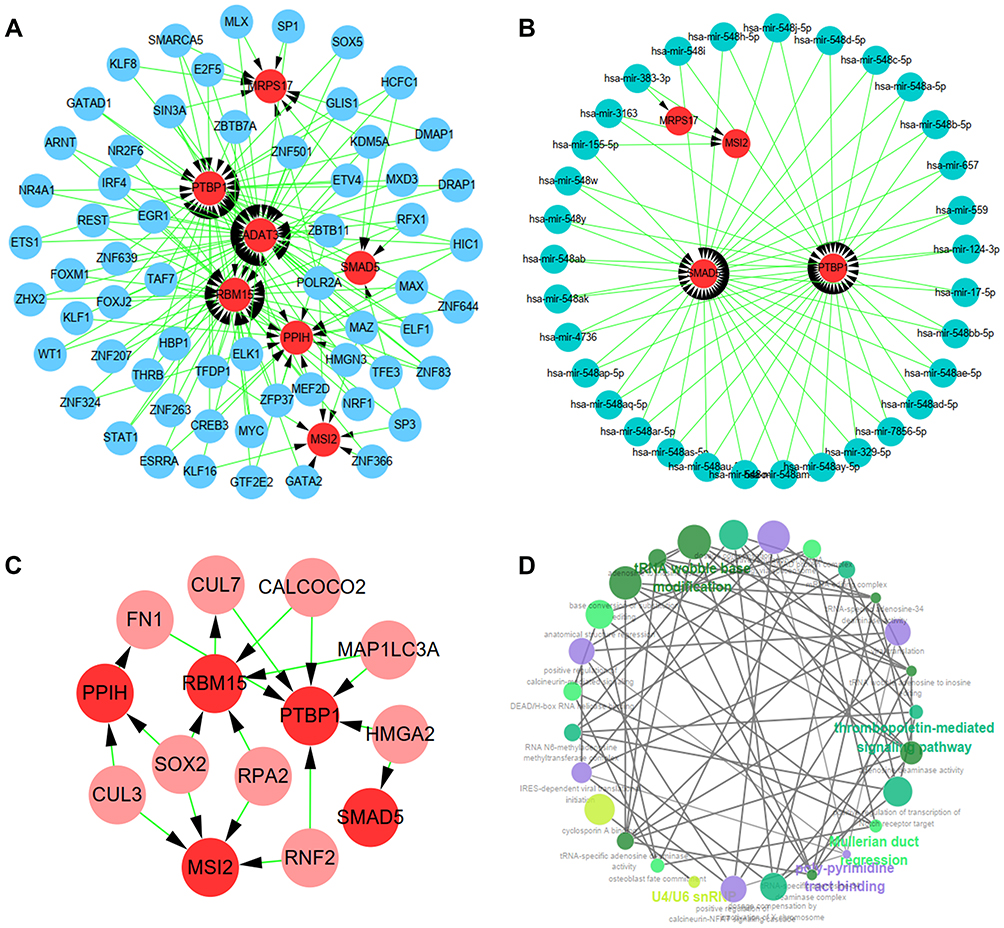 |
Figure 7 Biology network and functions of the seven hub RBPs. (A) TF-gene network. (B) miRNA-gene network. (C) Tissue-specific PPI network. (D) Functional enrichment network. |
Assessment of Tumor Immune Infiltration
The effects of the seven RBPs on tumor immune infiltration were also explored, the results of which demonstrated that expression of MRPS17 and PTBP1 was negatively significantly correlated with the abundance of TILs. It was also revealed that expression of MRPS17 was negatively correlated with Th1 cell, Tem-CD8 cell, NKT cell and NK cell abundance (Figure 8A). The expression of PTBP1 was also revealed to be negatively correlated with Th1 cell, Tem-CD4 cell, NKT cell and eosinophil abundance (Figure 8B). All these results indicated that MRPS17 and PTBP1 may reduce the infiltration of immune cells.
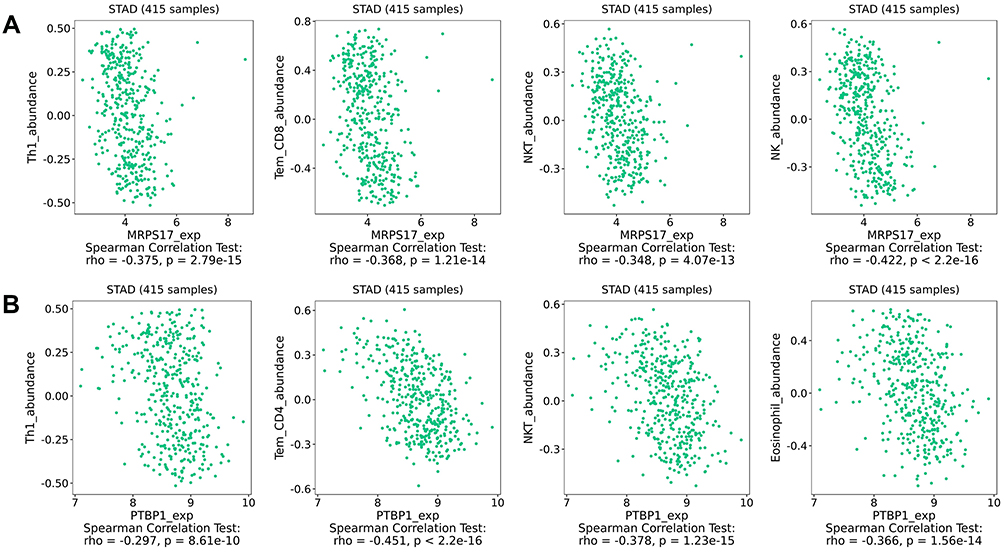 |
Figure 8 The relationship between the hub RBPs expression and TILs abundance. (A) The relationship between MRPS17 expression and TILs abundance. (B) The relationship between PTBP1 expression and TILs abundance. |
The Downregulation of PTBP1 Weakened the Migration and Invasion Capability of STAD Cells
Since the role of PTBP1 in STAD is still unclear, we further explored the effect of PTBP1 on the migration and invasion capability of STAD cells. PTBP1 mRNA expression in multiple STAD cell lines was detected by RT-PCR (Figure 9A). Subsequently, siRNAs (si-NC, si-1, and si-2) were transfected into AGS and HGC27 cells. RT-PCR and Western Blotting assays showed that PTBP1 expression was significantly down-regulated in STAD cells (AGS and HGC27) transfected with si-1 or si-2 compared with those transfected with si-NC (Figure 9B). Then, it was proven by transwell assays that both migration and invasion of AGS (p<0.01, Figure 9C) and HGC27 (p<0.01, Figure 9D) were significantly reduced by knockdown of PTBP1. Therefore, we could infer that PTBP1 played important roles in promoting metastasis of STAD.
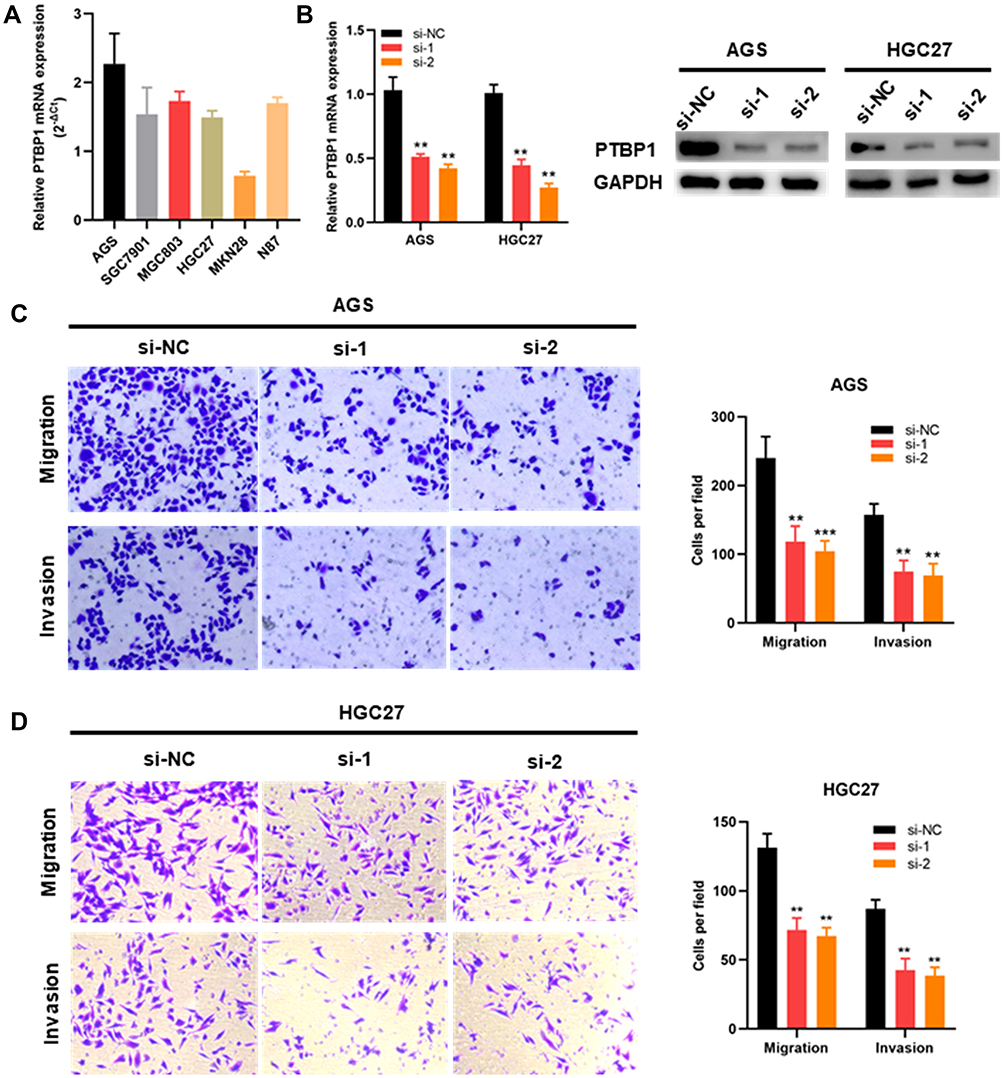 |
Figure 9 The downregulation of PTBP1 weakened the migration and invasion capability of STAD cells. (A) PTBP1 mRNA expression level in STAD cells. (B) PTBP1 knockdown AGS and HGC27 cells were constructed and then confirmed by RT-PCR and Western blotting. (C, D) Migration and invasion capability of AGS and HGC27 cells were significantly weakened by downregulation of PTBP1. (**p<0 0.01, ***p <0.001). |
Discussion
In the present study, 362 differentially expressed RBPs were identified from GEPIA based on STAD TCGA data. We comprehensively analyzed the relevant biological functions and pathways. Additionally, seven hub RBPs were found to be prognosis-related by univariate and multivariate Cox regression analysis, and ROC analysis. A risk model based on the seven hub RBPs was established in TCGA training cohort and validated in TCGA testing cohort and GEO cohort. The risk model was proved reliable in predicting OS. To improve its clinical practicality, we then constructed a nomogram to evaluate the survival of STAD patients at 1 year, 2 years and 3 years. Furthermore, to understand the mechanisms and functions through which they contributed to STAD, we investigated TF gene, miRNA gene, and tissue-specific PPI network and assessed their effects on tumor immune infiltration. In addition, we assessed the effects of PTBP1 expression on the migration and invasion capability of STAD cells. These findings may enable us to better understand the mechanisms involved in the occurrence and progression of STAD and develop novel biomarkers for diagnosis and predicting prognoses of STAD patients.
Although 362 differentially expressed RBPs were identified in STAD, functional enrichment analysis demonstrated that they were significantly enriched in post-transcriptional regulation of RNA, including mRNA processing, RNA splicing, termination of RNA polymerase II transcription, cytoplasmic mRNA processing body assembly, ribonuclease activity, and mRNA cleavage involved in gene silencing. As known to all, it has been reported that post-transcriptional regulation of RNA plays an important role in many types of cancers.6 A recently published study revealed that RBPs significantly affected the mRNA alternative splicing process and led to altered expression of tumor-associated genes.18 As one kind of RBP, SRSF1 promoted the occurrence and progression of non-small cell lung cancer through stabilizing LIG1 mRNA.19 Additionally, it was revealed by KEGG pathway analysis that it was by affecting spliceosome, aminoacyl-tRNA biosynthesis, RNA transport, mRNA surveillance pathway and RNA degradation that RBPs contributed to the occurrence and progression of STAD.
To explore the prognostic significance of the hub RBPs, we performed Cox survival analysis for these differentially expressed RBPs in TCGA training cohort. A total of seven RBPs that included PTBP1, PPIH, SMAD5, MSI2, RBM15, MRPS17, and ADAT3 were proven to be prognosis-related. Subsequently, based on the seven identified hub RBPs, we established a risk model for predicting prognoses of STAD patients in TCGA training cohort. The ROC analysis demonstrated that the seven RBPs-based risk model was reliable in selecting out STAD patients with poor prognosis, which was further validated by the TCGA testing cohort and GEO cohort. The aforementioned reliability of the risk model was also revealed by Kaplan-Meier plotter online tool. Consistent with our findings, Su et al20 demonstrated that high expression of RBM15 was associated with better survival of STAD patients. Additionally, revealed by multiple Cox regression analysis of the three cohorts, RS was an independent prognostic factor for STAD patients. All the aforementioned findings of our study suggested the clinical practicality of this seven RBPs-based prognostic model. To enable the physicians to predict patients, survival at 1 year, 2 years, and 3 years more intuitively, we constructed a nomogram.
Nevertheless, the molecular mechanisms through which these seven RBPs contribute to the pathogenesis of STAD remains poorly understood. To solve this puzzle, we further investigated the potential mechanisms at different levels. As shown in the network of TF-gene, these RBPs can be regulated by various TFs. As we all have known TF, MYC promotes the progression of STAD through regulating downstream genes and different pathways.21 FOXM1 has also been testified to play a crucial role in the occurrence and chemoresistance of gastric cancer.22 As the potential targets of TFs, RBPs and their roles in STAD deserve our further efforts. Network analysis of miRNA-gene revealed that many miRNAs could target PTBP1, MSI2, MRPS17, and SMAD5. The roles miRNAs play in cancer need no further illumination as it has been revealed by many studies that miRNA acts as oncogene or tumor suppressor gene in many kinds of cancers.23 It has been reported that miRNA-133b inhibited the growth of gastric cancer cells through silencing PTBP1.24 Despite the crucial roles played by miRNA155-5p,25 miRNA-12426 and miRNA-17,27 it remains unclear whether they regulate RBPs. Thus, the roles of miRNA-RBPs axis in STAD deserve to be further investigated. In our study, tissue-specific PPI was also constructed to confirm the proteins that interacted with the seven RBPs, the results of which demonstrated that PTBP1, MSI2, PPIH, RBM15, and SMAD5 interacted with nine other proteins that included HMGA2, FN1, SOX2, CUL3, CUL7, RPA2, RNF2, CALCOCO2, and MAP1LC3A. HMGA2 promoted the metastasis and epithelial-to-mesenchymal transition of chemoresistant gastric cancer.28 Down-regulation of FN1 suppressed the proliferation, migration and invasion of gastric cancer cells.29 The role of SOX2 in gastric cancer is still controversial.30,31 Thus, it is necessary to confirm the roles of these hub RBPs and other proteins to help us understand the mechanisms contributing to STAD. For the last part, the effects of the seven RBPs on tumor immune infiltration were explored, the results of which demonstrated that both MRPS17 and PTBP1 were negatively associated with the abundance of TILs, such as Th1 cell, NKT cell, Tem CD8 cell, and Tem CD4 cell. As known to all, these infiltrated cells are indispensable in killing cells,32 which may explain the phenomenon that MRPS17 and PTBP1 affect the prognosis of STAD. Multiple studies have reported that PTBP1 is closely associated with immune response. PTBP1 is crucial to B-cell receptor-mediated activation33 and knockdown of PTBP1 inhibits tumor-promoting functions of SASP and influences immune surveillance.34 All these studies remind us that RBPs play multiple roles at different levels.
To further verify the role of these hub RBPs in STAD, we performed functional experiments in STAD cells. PTBP1 was selected for in-vitro experiments because its role in STAD is still unclear. Transwell assays showed that the downregulation of PTBP1 significantly weakened the migration and invasion capability of STAD cells. These results suggested that PTBP1 played important roles in the metastasis of STAD, which provided more powerful support for us to further explore the roles of RBPs in STAD. Although the mechanisms through which RBPs contribute to STAD remain to be solved, comprehensive investigation of abnormally expressed RBPs that are closely related to the occurrence and progression of STAD may bring us the potential targets to design novel strategies and the chances to improve outcomes of STAD patients.
Conclusion
In conclusion, we comprehensively investigated the prognostic values and potential functions of differentially expressed RBPs in STAD. A risk model that can reliably predict the prognosis of STAD patients was constructed based on the seven identified RBPs and validated by the TCGA testing cohort and GEO cohort. Our study may provide important evidences for future studies on the roles of RBPs in STAD.
Data Sharing Statement
The data used to support the findings of this study are from TCGA (https://cancergenome.nih.gov/) and GEO datasets (GSE84437).
Author Contributions
All authors contributed to data analysis, drafting or revising the article, have agreed on the journal to which the article will be submitted, gave final approval of the version to be published, and agree to be accountable for all aspects of the work.
Funding
This study was supported by grants from the National Natural Science Foundation of China (81772579), the Guangdong Province Science and Technology Plan Projects (2014A020212693), “3&3” Project of The First Affiliated Hospital of Sun Yat-Sen University (Yulong He) and Sanming Project of Medical in Shenzhen (SZSM201911010).
Disclosure
The authors declare that they have no conflicts of interest for this work.
References
1. Torre LA, Bray F, Siegel RL, Ferlay J, Lortet-Tieulent J, Jemal A. Global cancer statistics, 2012. CA Cancer J Clin. 2015;65(2):87–108. doi:10.3322/caac.21262
2. Bertuccio P, Chatenoud L, Levi F, et al. Recent patterns in gastric cancer: a global overview. Int J Cancer. 2009;125(3):666–673. doi:10.1002/ijc.24290
3. Vrána D, Matzenauer M, Neoral Č, et al. From tumor immunology to immunotherapy in gastric and esophageal cancer. Int J Mol Sci. 2018;20(1):13. doi:10.3390/ijms20010013
4. Gerstberger S, Hafner M, Ascano M, Tuschl T. Evolutionary conservation and expression of human RNA-binding proteins and their role in human genetic disease. Adv Exp Med Biol. 2014;825:1–55.
5. Gerstberger S, Hafner M, Tuschl T. A census of human RNA-binding proteins. Nat Rev Genet. 2014;15(12):829–845.
6. Masuda K, Kuwano Y. Diverse roles of RNA-binding proteins in cancer traits and their implications in gastrointestinal cancers. Wiley Interdiscip Rev RNA. 2019;10(3):e1520. doi:10.1002/wrna.1520
7. Neelamraju Y, Hashemikhabir S, Janga SC. The human RBPome: from genes and proteins to human disease. J Proteomics. 2015;127(Pt A):61–70. doi:10.1016/j.jprot.2015.04.031
8. Wang J, Guo Y, Chu H, Guan Y, Bi J, Wang B. Multiple functions of the RNA-binding protein HuR in cancer progression, treatment responses and prognosis. Int J Mol Sci. 2013;14(5):10015–10041. doi:10.3390/ijms140510015
9. Wolfson E, Goldenberg M, Solomon S, Frishberg A, Pinkas-Kramarski R. Nucleolin-binding by ErbB2 enhances tumorigenicity of ErbB2-positive breast cancer. Oncotarget. 2016;7(40):65320–65334. doi:10.18632/oncotarget.11323
10. Du F, Qiao C, Li X, et al. Forkhead box K2 promotes human colorectal cancer metastasis by upregulating ZEB1 and EGFR. Theranostics. 2019;9(13):3879–3902. doi:10.7150/thno.31716
11. Jeong HM, Han J, Lee SH, et al. Erratum: ESRP1 is overexpressed in ovarian cancer and promotes switching from mesenchymal to epithelial phenotype in ovarian cancer cells. Oncogenesis. 2017;6(11):e391. doi:10.1038/oncsis.2017.89
12. Zhang H, Wang Y, Dou J, et al. Acetylation of AGO2 promotes cancer progression by increasing oncogenic miR-19b biogenesis. Oncogene. 2019;38(9):1410–1431. doi:10.1038/s41388-018-0530-7
13. Liao Y, Wang J, Jaehnig EJ, Shi Z, Zhang B. WebGestalt 2019: gene set analysis toolkit with revamped UIs and APIs. Nucleic Acids Res. 2019;47(W1):W199–W205. doi:10.1093/nar/gkz401
14. Heagerty PJ, Lumley T, Pepe MS. Time-dependent ROC curves for censored survival data and a diagnostic marker. Biometrics. 2000;56(2):337–344. doi:10.1111/j.0006-341X.2000.00337.x
15. Szász AM, Lánczky A, Nagy Á, et al. Cross-validation of survival associated biomarkers in gastric cancer using transcriptomic data of 1065 patients. Oncotarget. 2016;7(31):49322–49333. doi:10.18632/oncotarget.10337
16. Zhou G, Soufan O, Ewald J, Hancock REW, Basu N, Xia J. NetworkAnalyst 3.0: a visual analytics platform for comprehensive gene expression profiling and meta-analysis. Nucleic Acids Res. 2019;47(W1):W234–W241. doi:10.1093/nar/gkz240
17. Ru B, Wong CN, Tong Y, et al. TISIDB: an integrated repository portal for tumor-immune system interactions. Bioinformatics. 2019;35(20):4200–4202. doi:10.1093/bioinformatics/btz210
18. Shao Y, Chong W, Liu X, et al. Alternative splicing-derived intersectin1-L and intersectin1-S exert opposite function in glioma progression. Cell Death Dis. 2019;10(6):431. doi:10.1038/s41419-019-1668-0
19. Martínez-Terroba E, Ezponda T, Bértolo C, et al. The oncogenic RNA-binding protein SRSF1 regulates LIG1 in non-small cell lung cancer. Lab Invest. 2018;98(12):1562–1574. doi:10.1038/s41374-018-0128-2
20. Su Y, Huang J, Hu J. m(6)A RNA methylation regulators contribute to malignant progression and have clinical prognostic impact in gastric cancer. Front Oncol. 2019;9:1038. doi:10.3389/fonc.2019.01038
21. Anauate AC, Leal MF, Calcagno DQ, et al. The complex network between MYC oncogene and microRNAs in gastric cancer: an overview. Int J Mol Sci. 2020;21(5):1782. doi:10.3390/ijms21051782
22. Wang H, Huang C. FOXM1 and its oncogenic signaling in gastric cancer. Recent Pat Anticancer Drug Discov. 2015;10(3):270–279. doi:10.2174/1574892810666150617112421
23. Rupaimoole R, Slack FJ. MicroRNA therapeutics: towards a new era for the management of cancer and other diseases. Nat Rev Drug Discov. 2017;16(3):203–222. doi:10.1038/nrd.2016.246
24. Sugiyama T, Taniguchi K, Matsuhashi N, et al. MiR-133b inhibits growth of human gastric cancer cells by silencing pyruvate kinase muscle-splicer polypyrimidine tract-binding protein 1. Cancer Sci. 2016;107(12):1767–1775. doi:10.1111/cas.13091
25. Zheng F, Tang Q, Zheng XH, et al. Inactivation of Stat3 and crosstalk of miRNA155-5p and FOXO3a contribute to the induction of IGFBP1 expression by beta-elemene in human lung cancer. Exp Mol Med. 2018;50(9):121. doi:10.1038/s12276-018-0146-6
26. Zhao B, Lu Y, Cao X, et al. MiRNA-124 inhibits the proliferation, migration and invasion of cancer cell in hepatocellular carcinoma by downregulating lncRNA-UCA1. Onco Targets Ther. 2019;12:4509–4516. doi:10.2147/OTT.S205169
27. Wu DM, Hong XW, Wang LL, et al. MicroRNA-17 inhibition overcomes chemoresistance and suppresses epithelial-mesenchymal transition through a DEDD-dependent mechanism in gastric cancer. Int J Biochem Cell Biol. 2018;102:59–70. doi:10.1016/j.biocel.2018.06.007
28. Dong J, Wang R, Ren G, et al. HMGA2-FOXL2 axis regulates metastases and epithelial-to-mesenchymal transition of chemoresistant gastric cancer. Clin Cancer Res. 2017;23(13):3461–3473. doi:10.1158/1078-0432.CCR-16-2180
29. Zhang H, Sun Z, Li Y, Fan D, Jiang H. MicroRNA-200c binding to FN1 suppresses the proliferation, migration and invasion of gastric cancer cells. Biomed Pharmacother. 2017;88:285–292. doi:10.1016/j.biopha.2017.01.023
30. Luo J, Yan R, He X, He J. SOX2 inhibits cell proliferation and metastasis, promotes apoptotic by downregulating CCND1 and PARP in gastric cancer. Am J Transl Res. 2018;10(2):639–647.
31. Gan L, Meng J, Xu M, et al. Extracellular matrix protein 1 promotes cell metastasis and glucose metabolism by inducing integrin β4/FAK/SOX2/HIF-1α signaling pathway in gastric cancer. Oncogene. 2018;37(6):744–755. doi:10.1038/onc.2017.363
32. Zamarron BF, Chen W. Dual roles of immune cells and their factors in cancer development and progression. Int J Biol Sci. 2011;7(5):651–658. doi:10.7150/ijbs.7.651
33. Sasanuma H, Ozawa M, Yoshida N. RNA-binding protein Ptbp1 is essential for BCR-mediated antibody production. Int Immunol. 2019;31(3):157–166. doi:10.1093/intimm/dxy077
34. Georgilis A, Klotz S, Hanley CJ, et al. PTBP1-mediated alternative splicing regulates the inflammatory secretome and the pro-tumorigenic effects of senescent cells. Cancer Cell. 2018;34(1):85–102.e109. doi:10.1016/j.ccell.2018.06.007
 © 2021 The Author(s). This work is published and licensed by Dove Medical Press Limited. The
full terms of this license are available at https://www.dovepress.com/terms
and incorporate the Creative Commons Attribution
- Non Commercial (unported, 3.0) License.
By accessing the work you hereby accept the Terms. Non-commercial uses of the work are permitted
without any further permission from Dove Medical Press Limited, provided the work is properly
attributed. For permission for commercial use of this work, please see paragraphs 4.2 and 5 of our Terms.
© 2021 The Author(s). This work is published and licensed by Dove Medical Press Limited. The
full terms of this license are available at https://www.dovepress.com/terms
and incorporate the Creative Commons Attribution
- Non Commercial (unported, 3.0) License.
By accessing the work you hereby accept the Terms. Non-commercial uses of the work are permitted
without any further permission from Dove Medical Press Limited, provided the work is properly
attributed. For permission for commercial use of this work, please see paragraphs 4.2 and 5 of our Terms.