Back to Journals » Clinical Epidemiology » Volume 14
Prognostic Utility of the Gleason Grading System Revisions and Histopathological Factors Beyond Gleason Grade
Authors Zelic R ![]() , Giunchi F, Fridfeldt J, Carlsson J
, Giunchi F, Fridfeldt J, Carlsson J ![]() , Davidsson S, Lianas L, Mascia C
, Davidsson S, Lianas L, Mascia C ![]() , Zugna D
, Zugna D ![]() , Molinaro L, Vincent PH, Zanetti G, Andrén O, Richiardi L
, Molinaro L, Vincent PH, Zanetti G, Andrén O, Richiardi L ![]() , Akre O, Fiorentino M, Pettersson A
, Akre O, Fiorentino M, Pettersson A
Received 26 September 2021
Accepted for publication 14 December 2021
Published 18 January 2022 Volume 2022:14 Pages 59—70
DOI https://doi.org/10.2147/CLEP.S339140
Checked for plagiarism Yes
Review by Single anonymous peer review
Peer reviewer comments 2
Editor who approved publication: Professor Vera Ehrenstein
Renata Zelic,1 Francesca Giunchi,2 Jonna Fridfeldt,3 Jessica Carlsson,3 Sabina Davidsson,3 Luca Lianas,4 Cecilia Mascia,4 Daniela Zugna,5 Luca Molinaro,6 Per Henrik Vincent,7,8 Gianluigi Zanetti4 ,† Ove Andrén,3 Lorenzo Richiardi,5 Olof Akre,7,8 Michelangelo Fiorentino,9 Andreas Pettersson1
1Clinical Epidemiology Division, Department of Medicine Solna, Karolinska Institutet, Stockholm, Sweden; 2Pathology Department, IRCCS Azienda Ospedaliero-Universitaria di Bologna, Bologna, Italy; 3Department of Urology, Faculty of Medicine and Health, Örebro University, Örebro, Sweden; 4Data-Intensive Computing Division, Center for Advanced Studies, Research and Development in Sardinia (CRS4), Pula, Italy; 5Cancer Epidemiology Unit, Department of Medical Sciences, University of Turin, and CPO-Piemonte, Turin, Italy; 6Division of Pathology, A.O. Città della Salute e della Scienza Hospital, Turin, Italy; 7Department of Molecular Medicine and Surgery, Karolinska Institutet, Stockholm, Sweden; 8Department of Urology, Karolinska University Hospital, Stockholm, Sweden; 9Pathology Service, Maggiore Hospital, University of Bologna, Bologna, Italy
†Dr Gianluigi Zanetti passed away on September 7, 2019
Correspondence: Renata Zelic
Clinical Epidemiology Division, Department of Medicine Solna, Karolinska Institutet, K2 Medicin, Solna, K2 Klinisk epidemiologi K Ekström Smedby, Stockholm, 171 77, Sweden
Tel +46703136037
Fax +46851779304
Email [email protected]
Background: The International Society of Urological Pathology (ISUP) revised the Gleason system in 2005 and 2014. The impact of these changes on prostate cancer (PCa) prognostication remains unclear.
Objective: To evaluate if the ISUP 2014 Gleason score (GS) predicts PCa death better than the pre-2005 GS, and if additional histopathological information can further improve PCa death prediction.
Patients and Methods: We conducted a case–control study nested among men in the National Prostate Cancer Register of Sweden diagnosed with non-metastatic PCa 1998– 2015. We included 369 men who died from PCa (cases) and 369 men who did not (controls). Two uro-pathologists centrally re-reviewed biopsy ISUP 2014 Gleason grading, poorly formed glands, cribriform pattern, comedonecrosis, perineural invasion, intraductal, ductal and mucinous carcinoma, percentage Gleason 4, inflammation, high-grade prostatic intraepithelial neoplasia (HGPIN) and post-atrophic hyperplasia. Pre-2005 GS was back-transformed using i) information on cribriform pattern and/or poorly formed glands and ii) the diagnostic GS from the registry. Models were developed using Firth logistic regression and compared in terms of discrimination (AUC).
Results: The ISUP 2014 GS (AUC = 0.808) performed better than the pre-2005 GS when back-transformed using only cribriform pattern (AUC = 0.785) or both cribriform and poorly formed glands (AUC = 0.792), but not when back-transformed using only poorly formed glands (AUC = 0.800). Similarly, the ISUP 2014 GS performed better than the diagnostic GS (AUC = 0.808 vs 0.781). Comedonecrosis (AUC = 0.811), HGPIN (AUC = 0.810) and number of cores with ? 50% cancer (AUC = 0.810) predicted PCa death independently of the ISUP 2014 GS.
Conclusion: The Gleason Grading revisions have improved PCa death prediction, likely due to classifying cribriform patterns, rather than poorly formed glands, as Gleason 4. Comedonecrosis, HGPIN and number of cores with ? 50% cancer further improve PCa death discrimination slightly.
Keywords: prostate cancer, prognosis, prognostic markers, Gleason score, virtual microscopy, histopathology
Plain Language Summary
The Gleason score, the most powerful prognostic factor in prostate cancer, has undergone major revisions in 2005 and 2014. While these revisions have changed clinical practice around the world, it remains unclear if they have also improved prostate cancer prognostication. Our study shows that the Gleason score revisions have indeed improved prostate cancer death prediction. We also show that other histopathological factors, including comedonecrosis, high-grade prostatic intraepithelial neoplasia and number of cores with ≥50% cancer, have potential prognostic utility beyond the Gleason score.
Introduction
The Gleason score (GS) is a powerful prognostic factor in prostate cancer (PCa). In 2005 and 2014, the International Society of Urological Pathology (ISUP) conducted major revisions of the Gleason grading system. In 2005, ISUP recommended against assigning Gleason pattern 1 and 2, included most cribriform and poorly formed glands in the definition of Gleason pattern 4, and defined the GS as the sum of the most common and the highest Gleason pattern rather than the first and second most common pattern.1 In 2014, all cribriform and glomeruloid glands were defined as Gleason pattern 4. Furthermore, ISUP endorsed the five-tired Gleason Grade Group (GGs) system as prognostically more accurate and “patient friendly” than the standard GS grouping.2,3 The ISUP 2014 revision has been adopted by the World Health Organization (WHO 2016).4
A key goal of the ISUP Gleason grading system revisions is to improve prognostication. Whether the revisions actually have improved prognostication, and, if so, what specific changes have led to the improvement, remains unclear. Only a few studies have compared the ISUP 2005 GS to the pre-2005 GS and found either small or no improvement in predicting biochemical recurrence (BCR).5–7 Most studies assessing the prognostic utility of the GGs performed no central re-review of the diagnostic biopsies according to the ISUP 2014/WHO 2016 criteria,8–16 but rather simply compared the GGs to different groupings of the GS, such as the three-tiered GS (≤6, 7, ≥8).10–16 Importantly, no study has evaluated if the ISUP 2014 GS in diagnostic biopsies improves prediction of PCa death, a clinically more important outcome than BCR.
It is possible that the prognostic utility of the Gleason grading system can be further improved by incorporating additional histopathological prognostic factors, such as cribriform pattern and/or intraductal carcinoma,17,18 percentage of Gleason pattern 4,19–21 measures of tumor extent22–25 and perineural invasion.26,27 No study has, however, performed a central re-review according to the latest ISUP/WHO criteria and systematically evaluated if these or other histopathological features can improve PCa prognostication beyond GS.
Therefore, in this large nested case–control study with centrally re-reviewed diagnostic biopsies, we evaluated i) if the ISUP 2014 GS predicts PCa death better than the previous Gleason grading systems, and ii) if additional histopathological features can further improve PCa death prediction.
Materials (Patients) and Methods
Study Design, Study Population and Data Sources
We performed a case–control study nested in the National Prostate Cancer Register (NPCR) of Sweden. The NPCR contains detailed information on cancer characteristics and primary treatment for 98% of all incident PCa cases in Sweden since 1998.28 Information on cause of death is obtained through linkage to the Swedish Cause of Death Register. PCa death (ICD-10: C61) is defined as death where PCa was the underlying cause of death and has 86–96% agreement with medical records review.29,30
Cases and controls were selected from all men diagnosed with non-metastatic PCa (ie non-M1) between January 1, 1998 and December 31, 2015 in a subset of the full NPCR (Figure 1). To be able to detect a 0.05 difference in the area under the ROC curve (AUC) for the ISUP 2005 GS vs pre-2005 GS in predicting PCa death with a power of 80% (two-sided z-test, α=0.05), we needed to include 372 cases and 372 controls in the study.31 As we further anticipated a 30% reduction in sample size due to inability to retrieve the diagnostic biopsy slides, we decided to include 500 cases and 500 controls in the study. Cases were randomly selected among all men who had died from PCa by December 31, 2015. Controls were then randomly selected among men who were alive at the date of death of the respective case, matched to cases on year and county of diagnosis.
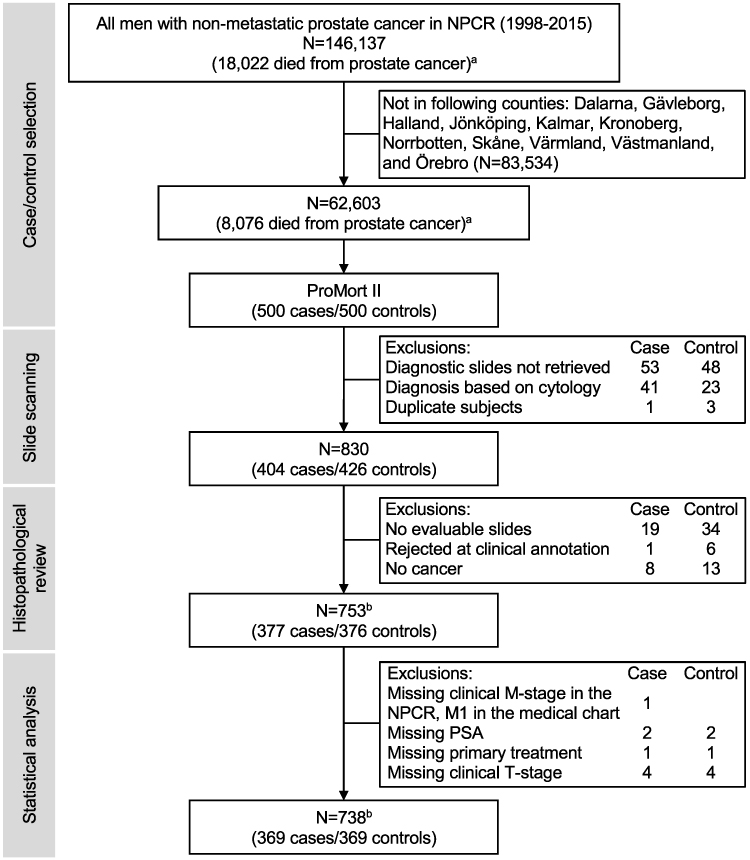 |
Figure 1 Flow-chart of the patients’ selection. Abbreviation: NPCR, the National Prostate Cancer Register of Sweden. Notes: aBased on the data extracted from NPCR June 5, 2020, but restricted to match conditions at April 11, 2017, when ProMort II was sampled. bIncludes duplicate subjects (cases selected as controls (N=1) and controls selected more than once (N=3)). |
The diagnostic biopsy slides were successfully retrieved from the Pathology wards across Sweden for 830 men (83%) (Figure 1). The slides were scanned at 40X at Örebro University Hospital, Örebro, Sweden, using a Pannoramic 250 Flash II digital slide scanner (3DHistech Ltd., Budapest, Hungary). In total, we scanned 5536 slides. The scanned images were uploaded to an internally developed validated virtual microscopy system (Supplementary Methods).32
Information on age, prostate-specific antigen (PSA), clinical TNM stage, primary and secondary Gleason pattern, and planned primary treatment was abstracted from the NPCR. In addition, for the 830 men whose diagnostic slides we had successfully scanned, we performed a medical chart review. Medical charts were successfully reviewed for 282 cases (69.8%) and 297 controls (69.7%). The medical chart information was used when information abstracted from the NPCR was missing.
Histopathological Review
Two genitourinary pathologists (F.G. and M.F.), with 10 and 21 years of experience as genitourinary pathologists, respectively, performed the histopathological re-review according to the 2016 WHO criteria.4 Each case was reviewed by one pathologist. The pathologists were blinded to the diagnostic GS and case–control status. In total, 8982 cores were reviewed, of which 3713 cores contained cancer.
For each core, we circled the core area, recorded the core length and the presence of cancer. For each core with cancer, we circled the tumor area, recorded the tumor length, primary and secondary Gleason pattern, GGs, poorly formed glands, cribriform pattern, comedonecrosis, perineural invasion, intraductal, ductal and mucinous carcinoma. For each core with GS 7, we circled the area of Gleason pattern 4. The percentage of Gleason pattern 4 was calculated as: (area of Gleason pattern 4/tumor area) × 100. Finally, for each slide (but not for each core), we recorded the presence of acute, chronic, periglandular, intraglandular and stromal inflammation, high-grade prostatic intraepithelial neoplasia (HGPIN) and post-atrophic hyperplasia. Case level summaries were calculated as the sum across all cores for continuous features, and as presence in at least one of the cores/slides for binary features. The highest core-level ISUP 2014 GS and GGs was used as an overall score for a case. Case level percentage of Gleason pattern 4 was calculated as the average percentage of Gleason pattern 4 in all cores with GG2-3 for the subjects with a case level GG2-3.
Pre-2005 Gleason Grading
We used two approaches to compare the ISUP 2014 GS with the pre-2005 GS. First, we used information on cribriform pattern and poorly formed glands to approximate the pre-2005 Gleason patterns. Gleason pattern 4 (primary or secondary) was downgraded to Gleason pattern 3 whenever Gleason pattern 4 was assigned based on the i) cribriform pattern only, ii) poorly formed glands only and iii) cribriform pattern and/or poorly formed glands. The pre-2005 GS was calculated as the sum of the back-transformed primary and secondary Gleason pattern. Second, we used the diagnostic GS recorded in the NPCR and in the medical charts as the pre-2005 GS. This approach was restricted to men diagnosed with PCa before 2006.
Statistical Analyses
For the main analysis, we used a complete-case approach (N = 369 cases and N = 369 controls, Figure 1). We used Firth logistic regression adjusted for the matching variables to estimate odds ratios (ORs) and 95% confidence intervals (CIs) of the association between pre-2005 GS, ISUP 2014 GS and GGs, and all other histopathological features and PCa death.33 As a sensitivity analysis, we repeated all the analyses using conditional logistic regression.
We fit two models for the comparison of the different Gleason grading systems and three models for other histopathological features. Model 1, the “crude” model, was adjusted only for primary treatment. For the comparison of the different Gleason grading systems, Model 2 included primary treatment, age, PSA and clinical tumor stage at diagnosis. For other histopathological characteristics, Model 2 included primary treatment and GGs at diagnosis, and Model 3 included primary treatment, GGs, age, PSA and clinical tumor stage at diagnosis. Model performance was compared by calculating bootstrap corrected AUC.34,35 Two correlated AUCs were compared using DeLong’s method.36
All analyses were conducted in Stata (version 16.1, StataCorp, College Station, Texas, USA) and R (version 3.5.3, R Foundation for Statistical Computing, Vienna, Austria).
Results
Of 500 cases and 500 controls in ProMort2 (Supplementary Table S1), 369 cases and 369 controls remained for the main analysis; there were no major differences between included and excluded cases/controls (Table 1, Supplementary Table S2). The baseline and re-reviewed histopathological characteristics for the 369 cases and 369 controls are presented in Table 1 and Supplementary Table S3. The distribution of the back-transformed pre-2005 GS is presented in Supplementary Table S4. Compared to controls, cases were on average older (median age: 75.0 vs 68.0 years), had higher PSA (26.0 vs 11.4 ng/mL), clinical tumor stage (≥cT3: 55.6% vs 22.8%) and the diagnostic GS (GS > 7: 46.2% vs 12.6%), and were more often treated without curative intent (73.8% vs 29.8%) (Table 1). Of 707 subjects who had information on both the diagnostic GS and ISUP 2014 GS, 426 (60.3%) were upgraded at re-review, while 46 (6.5%) were downgraded (Figure 2, Supplementary Table S5).
 |
Table 1 Baseline Characteristics Including Centrally Re-Reviewed Histopathological Information Among 369 Cases and 369 Controls Included in the Main Analysis |
 |
Figure 2 Gleason score upgrade/downgrade among 707 subjects who had information on both the diagnostic and the centrally re-reviewed ISUP 2014 Gleason score. |
The ORs for the associations between pre-2005 GS, ISUP 2014 GS and GGs and PCa death are presented in Table 2. The GGs and ISUP 2014 GS performed equally in discriminating PCa death (Model 1: AUC = 0.807 vs 0.808; Model 2: AUC = 0.818 vs 0.819). The ISUP 2014 GS performed better than the pre-2005 GS back-transformed using only cribriform pattern (Model 1: AUC = 0.785; Model 2: AUC = 0.808) or both cribriform and poorly formed glands (Model 1: AUC = 0.792; Model 2: AUC = 0.814). In contrast, there was no difference in discrimination between the ISUP 2014 GS and the pre-2005 GS back-transformed using only poorly formed glands (Model 1: AUC: 0.800; Model 2: AUC = 0.818) (Table 2). In the analysis restricted to men diagnosed before 2006, the ISUP 2014 GS discriminated death from PCa better than the diagnostic GS (Model 1: AUC = 0.808 vs 0.781; Model 2: AUC = 0.818 vs 0.802) (Supplementary Table S6).
 |
Table 2 Odds Ratios and 95% Confidence Intervals of the Association Between Different Gleason Grading System Revisions and Death from Prostate Cancer Among 369 Cases and 369 Controls |
Almost all evaluated histopathological characteristics were associated with PCa death in Model 1 (Figure 3). Comedonecrosis, HGPIN and number of cores with ≥50% cancer predicted PCa death independently from GGs; however, only comedonecrosis (OR: 5.1, 95% CIs: 1.2–21.0) and HGPIN (OR: 0.6, 95% CIs: 0.4–1.0) remained individual predictors in Model 3 (Figure 3). Adding comedonecrosis and HGPIN to the models with GGs, clinical tumor stage, PSA and age changed the discrimination only slightly (AUC = 0.822 and 0.821, respectively) (Supplementary Table S7). Using different cut-offs for percentage of cancer in individual cores had a minor influence on the discrimination (Supplementary Tables S8 and S9).
 |
Figure 3 Odds ratios and 95% confidence intervals of the association between different histopathological features and death from prostate cancer among 369 cases and 369 controls. Notes: aAdjusted for the matching variables (year and county of diagnosis and follow-up time) and primary treatment (deferred treatment (ie active surveillance or watchful waiting), curative treatment (ie radical prostatectomy or radiotherapy) and primary androgen deprivation therapy). bAdjusted for the matching variables, Gleason Grade Groups and primary treatment. cAdjusted for the matching variables, Gleason Grade Groups, clinical tumor stage (cT1, cT2, cT3 and cT4), age (continuous) and PSA (transformed using restricted cubic splines with knots at 4.5, 16 and 105.65 ng/mL) at diagnosis and primary treatment. dOdds ratios per 10% increase. eCalculated as a number of cores with (tumor length/core length) × 100 ≥50. fCalculated as a number of cores with (tumor area/core area) × 100 ≥50. gEvaluated only for the subjects with a case-level Gleason Grade Group 2 and 3. |
The results from sensitivity analysis using conditional logistic regression were similar (Supplementary Tables S10–S14).
Discussion
We found that the ISUP 2005 and 2014 revisions of the Gleason grading system have improved PCa prognostication. Our results suggest that the improvement in discrimination was due to classifying cribriform patterns, rather than poorly formed glands, as Gleason pattern 4. We further found that the number of cores with ≥50% cancer, comedonecrosis and HGPIN predicted PCa death independently of the GGs, while comedonecrosis and HGPIN predicted PCa death independently of the GGs, clinical tumor stage, PSA and age at diagnosis. Among men with GG2 and GG3, the percentage of Gleason pattern 4 did not predict PCa death.
The main motivation behind the ISUP 2005 and 2014 revisions was to better define the Gleason patterns, particularly 3 and 4, in order to improve inter-pathologist agreement and, ultimately, prognostication.1–3 Since ISUP endorsed the GGs in 2014, a plethora of studies have evaluated the ability of the GGs to predict BCR10–15,37,38 and/or PCa death.8,9,15,16,38–40 However, only four studies had information from centrally re-reviewed diagnostic biopsies,37–40 and in only one of those studies had the re-review been conducted according to the ISUP 2014 criteria.37 The study modelled the GGs and the diagnostic GS in predicting BCR, but their prognostic performance was not compared.37 Our study is the first study that has centrally re-reviewed diagnostic biopsies according to ISUP 2014/WHO 2016 criteria and has PCa death as the outcome. We approximated pre-2005 Gleason pattern 3 and 4 by using information on cribriform pattern and poorly formed glands. Although imperfect, when using this approximation, the ISUP 2014 GS discriminated PCa death better than the pre-2005 GS. We also confirmed this finding by comparing the ISUP 2014 GS to the diagnostic GS among men diagnosed before 2006. Importantly, when we re-created the pre-2005 GS based on poorly formed glands alone it did not change discrimination whereas when we re-created it based on cribriform patterns it did, indicating that the improvement in discrimination was due to grading all cribriform patterns as Gleason pattern 4.
Different measures of tumor extent, such as the percentages of cores with cancer or total length of cancer in mm, have been evaluated as potential prognostic factors in PCa.22–25,41 The results for the percentage of cores with cancer are most consistent,22–24 though the contribution to discrimination seems to be minimal.25,41 Furthermore, it is included in several risk grouping systems such as the CAPRA score42 and NCCN.43 In our study, the percentage of cores with cancer predicted PCa death in the baseline model, but not after adjustment for the GGs. Of all evaluated measures of tumor extent, only the number of cores with ≥50% cancer predicted PCa death independently from the GGs. However, after adjustment for clinical tumor stage, PSA and age at diagnosis, the association disappeared. Taken together with previous studies, our results point to the limited prognostic utility of measures of tumor extent when GS and other standard prognostic factors are available. This has implications for the evolving era of MRI-guided biopsies, as it suggests that the prognostic information lost, in terms of measures of tumor extent, when using MRI-guided biopsies instead of systematic biopsies is not too large.
This is the first study to show that comedonecrosis predicts PCa death independently of the GGs. In one previous study, comedonecrosis in radical prostatectomy samples was associated with BCR.44 Given that comedonecrosis is a Gleason pattern 5 feature and men with Gleason pattern 5 are already recommended treatment, the clinical utility of this finding is questionable. However, it is possible that comedonecrosis captures a biological entity with strong prognostic value beyond GS. Finally, in our study, HGPIN was inversely associated with PCa death. To the best of our knowledge, only one previous study has evaluated HGPIN as a predictor of lethal PCa with opposite findings.45 We see no obvious explanation for different findings and our results regarding HGPIN should thus be interpreted with care.
Several other histopathological features, such as cribriform pattern and/or intraductal cancer,17,18,46 perineural invasion,26,27 and the percentage of Gleason pattern 4,19–21 have been extensively studied as prognostic factors in PCa. The effect estimates we observed for these features were in line with previous studies; however, they did not predict PCa death independently from the GGs. It is possible that these factors are not predictors when using contemporary ISUP Gleason grading. It is also unclear how histopathological features reported on the core level, such as percentage of Gleason pattern 4, should be used for predictions on the case/patient level. We defined the case level percentage of Gleason pattern 4 as the average proportion of Gleason pattern 4 area in all the cores with GG2 or GG3 cancer for the subjects with the case-level GG2 or GG3. While our definition corresponds to the overall percentage of Gleason pattern 4 described in other studies,19–21 in all these studies, the percentage of Gleason pattern 4 for subjects with case-level GG4 or GG5 is completely ignored, regardless of how many cores with GG2 or GG3 these subjects have had. By using a single-summary case-level measure, we are thus losing a lot of potentially prognostic information. One of the next steps in improving prognostic models in PCa should thus be finding optimal ways of using the core-level information.
This study has limitations. Our back-transformation to the pre-2005 GS was suboptimal. Gleason pattern 1 and 2 were not assigned at review, and the secondary Gleason pattern was defined as the highest less represented pattern in the core and not the second most common pattern as was done before the ISUP 2005 revision. However, tertiary pattern is uncommon in biopsy cores and the highest Gleason pattern often corresponds to the second most common Gleason pattern. In addition, we also confirmed our results using the diagnostic GS as another proxy of the pre-2005 GS. Another potential limitation of our study is the sample size, and we could have lacked power to identify all independent predictors especially if their effect is small or they are rare.
Conclusion
This is the first study to use information from re-reviewed diagnostic biopsies and PCa death as the outcome. We found that the GGs and ISUP 2014 GS discriminate death from PCa better than pre-2005 GS, and our results suggest that the improvement in discrimination is mostly due to classifying all cribriform patterns as Gleason pattern 4. The number of cores with ≥50% cancer, comedonecrosis and HGPIN predict PCa death independently from the GGs, and comedonecrosis and HGPIN also independently from other clinical variables.
Abbreviations
AUC, Area under the ROC curve; BCR, Biochemical recurrence; CI, Confidence interval; PCa, Prostate cancer; GGs, Gleason Grade Groups; GS, Gleason Score; HGPIN, High-grade prostatic intraepithelial neoplasia; ISUP, International Society of Urological Pathology; NPCR, National Prostate Cancer Register of Sweden; OR, Odds ratio; PSA, Prostate-specific antigen; WHO, World Health Organization.
Data Sharing Statement
The data underlying this article cannot be shared publicly due to the privacy concerns. The data could be available after appropriate ethical committee approval and should be handled in compliance with relevant data protection and privacy regulations.
Ethics Approval and Informed Consent
This study was approved by the regional Swedish Ethics Review Authority (Etikprövningsmyndigheten) in Stockholm, Sweden (reference numbers: 2016/613-31/2, 2016/2171-32). In registry-based studies, such as this one, the requirement for informed consent is typically waived because the benefits to patients and the health care in general outweigh potential liabilities. The data handling complied with relevant data protection and privacy regulation (eg, was pseudonymized, stored on a secure server at the Clinical Epidemiology Division at Karolinska Institutet, Stockholm, Sweden, and handled according to the institution’s guidelines for information security).
Acknowledgments
This project was made possible by the continuous work of the National Prostate Cancer Register of Sweden (NPCR) steering group: Pär Stattin (chairman), Anders Widmark, Camilla Thellenberg, Ove Andrén, Ann-Sofi Fransson, Magnus Törnblom, Stefan Carlsson, Marie Hjälm-Eriksson, David Robinson, Mats Andén, Jonas Hugosson, Ingela Franck Lissbrant, Maria Nyberg, Ola Bratt, René Blom, Lars Egevad, Calle Walller, Olof Akre, Per Fransson, Eva Johansson, Fredrik Sandin and Karin Hellström. We would also like to acknowledge Amanda Thorstenson for the help with obtaining medical charts.
Author Contributions
All authors made a significant contribution to the work reported, whether that is in the conception, study design, execution, acquisition of data, analysis and interpretation, or in all these areas; took part in drafting, revising or critically reviewing the article; gave final approval of the version to be published; have agreed on the journal to which the article has been submitted; and agree to be accountable for all aspects of the work.
Funding
The study was supported by the Strategic Research Programme in Epidemiology at Karolinska Institutet to AP; Strategic Research Programme in Cancer at Karolinska Institutet to OA; the Swedish Prostate Cancer Federation to AP; the Swedish Cancer Society to OA (grant number 2011/825); the Sardinian Regional Authority (the DIFRA Project) to CRS4 and partially by the H2020 DeepHealth Project to OA (grant number 825111). The funders had no role in study design, data collection, management, analysis and interpretation nor in preparation, review and approval of the manuscript.
Disclosure
Mr Luca Lianas reports grants from European Commission, grants from Sardinian Regional Authority, during the conduct of the study. Dr Cecilia Mascia reports grants from European Commission, grants from Sardinian Regional Authority, during the conduct of the study. The authors report no conflicts of interest in this work.
References
1. Epstein JI, Allsbrook WC
2. Epstein JI, Egevad L, Amin MB, et al. The 2014 International Society of Urological Pathology (ISUP) consensus conference on Gleason grading of prostatic carcinoma: definition of grading patterns and proposal for a new grading system. Am J Surg Pathol. 2016;40(2):244–252. doi:10.1097/PAS.0000000000000530
3. Epstein JI, Amin MB, Reuter VE, Humphrey PA. Contemporary Gleason grading of prostatic carcinoma: an update with discussion on practical issues to implement the 2014 International Society of Urological Pathology (ISUP) consensus conference on Gleason grading of prostatic carcinoma. Am J Surg Pathol. 2017;41(4):e1–e7. doi:10.1097/PAS.0000000000000820
4. Humphrey PA, Moch H, Cubilla AL, Ulbright TM, Reuter VE. The 2016 WHO classification of tumours of the urinary system and male genital organs-Part B: prostate and bladder tumours. Eur Urol. 2016;70(1):106–119. doi:10.1016/j.eururo.2016.02.028
5. Billis A, Guimaraes MS, Freitas LL, Meirelles L, Magna LA, Ferreira U. The impact of the 2005 international society of urological pathology consensus conference on standard Gleason grading of prostatic carcinoma in needle biopsies. J Urol. 2008;180(2):
6. Uemura H, Hoshino K, Sasaki T, et al. Usefulness of the 2005 International Society of Urologic Pathology Gleason grading system in prostate biopsy and radical prostatectomy specimens. BJU Int. 2009;103(9):1190–1194. doi:10.1111/j.1464-410X.2008.08197.x
7. Delahunt B, Lamb DS, Srigley JR, et al. Gleason scoring: a comparison of classical and modified (international society of urological pathology) criteria using nadir PSA as a clinical end point. Pathology. 2010;42(4):339–343. doi:10.3109/00313021003787924
8. He J, Albertsen PC, Moore D, Rotter D, Demissie K, Lu-Yao G. Validation of a contemporary five-tiered Gleason grade grouping using population-based data. Eur Urol. 2017;71(5):760–763. doi:10.1016/j.eururo.2016.11.031
9. Leapman MS, Cowan JE, Simko J, et al. Application of a prognostic Gleason grade grouping system to assess distant prostate cancer outcomes. Eur Urol. 2017;71(5):750–759. doi:10.1016/j.eururo.2016.11.032
10. Bondarenko HD, Zanaty M, Harmouch SS, et al. External validation of the novel International Society of Urological Pathology (ISUP) Gleason grading groups in a large contemporary Canadian cohort. Can Urol Assoc J. 2018. doi:10.5489/cuaj.5284
11. Dell’Oglio P, Karnes RJ, Gandaglia G, et al. The new prostate cancer grading system does not improve prediction of clinical recurrence after radical prostatectomy: results of a large, two-center validation study. Prostate. 2017;77(3):263–273. doi:10.1002/pros.23265
12. Epstein JI, Zelefsky MJ, Sjoberg DD, et al. A contemporary prostate cancer grading system: a validated alternative to the Gleason score. Eur Urol. 2016;69(3):428–435. doi:10.1016/j.eururo.2015.06.046
13. Loeb S, Folkvaljon Y, Robinson D, Lissbrant IF, Egevad L, Stattin P. Evaluation of the 2015 Gleason grade groups in a nationwide population-based cohort. Eur Urol. 2016;69(6):1135–1141. doi:10.1016/j.eururo.2015.11.036
14. Mathieu R, Moschini M, Beyer B, et al. Prognostic value of the new Grade Groups in Prostate Cancer: a multi-institutional European validation study. Prostate Cancer Prostatic Dis. 2017;20(2):197–202. doi:10.1038/pcan.2016.66
15. Chen C, Chen Y, Hu LK, Jiang CC, Xu RF, He XZ. The performance of the new prognostic grade and stage groups in conservatively treated prostate cancer. Asian J Androl. 2018;20(4):366–371. doi:10.4103/aja.aja_5_18
16. Pompe RS, Davis-Bondarenko H, Zaffuto E, et al. Population-based validation of the 2014 ISUP Gleason grade groups in patients treated with radical prostatectomy, brachytherapy, external beam radiation, or no local treatment. Prostate. 2017;77(6):686–693. doi:10.1002/pros.23316
17. van Leenders G, Kweldam CF, Hollemans E, et al. Improved prostate cancer biopsy grading by incorporation of invasive cribriform and intraductal carcinoma in the 2014 grade groups. Eur Urol. 2020;77(2):191–198. doi:10.1016/j.eururo.2019.07.051
18. Kweldam CF, Kummerlin IP, Nieboer D, et al. Disease-specific survival of patients with invasive cribriform and intraductal prostate cancer at diagnostic biopsy. Mod Pathol. 2016;29(6):630–636. doi:10.1038/modpathol.2016.49
19. Sauter G, Steurer S, Clauditz TS, et al. Clinical utility of quantitative Gleason grading in prostate biopsies and prostatectomy specimens. Eur Urol. 2016;69(4):592–598. doi:10.1016/j.eururo.2015.10.029
20. Cole AI, Morgan TM, Spratt DE, et al. Prognostic value of percent Gleason grade 4 at prostate biopsy in predicting prostatectomy pathology and recurrence. J Urol. 2016;196(2):405–411. doi:10.1016/j.juro.2016.01.120
21. Berney DM, Beltran L, Sandu H, et al. The percentage of high-grade prostatic adenocarcinoma in prostate biopsies significantly improves on Grade Groups in the prediction of prostate cancer death. Histopathology. 2019;75(4):589–597. doi:10.1111/his.13888
22. Quintal MM, Meirelles LR, Freitas LL, Magna LA, Ferreira U, Billis A. Various morphometric measurements of cancer extent on needle prostatic biopsies: which is predictive of pathologic stage and biochemical recurrence following radical prostatectomy? Int Urol Nephrol. 2011;43(3):697–705. doi:10.1007/s11255-011-9901-5
23. Rajab R, Fisher G, Kattan MW, et al. Measurements of cancer extent in a conservatively treated prostate cancer biopsy cohort. Virchows Arch. 2010;457(5):547–553. doi:10.1007/s00428-010-0971-z
24. Harnden P, Shelley MD, Naylor B, Coles B, Mason MD. Does the extent of carcinoma in prostatic biopsies predict prostate-specific antigen recurrence? A systematic review. Eur Urol. 2008;54(4):728–739. doi:10.1016/j.eururo.2008.06.068
25. Briganti A, Chun FK, Hutterer GC, et al. Systematic assessment of the ability of the number and percentage of positive biopsy cores to predict pathologic stage and biochemical recurrence after radical prostatectomy. Eur Urol. 2007;52(3):733–743. doi:10.1016/j.eururo.2007.02.054
26. Harnden P, Shelley MD, Clements H, et al. The prognostic significance of perineural invasion in prostatic cancer biopsies: a systematic review. Cancer. 2007;109(1):13–24. doi:10.1002/cncr.22388
27. Strom P, Nordstrom T, Delahunt B, et al. Prognostic value of perineural invasion in prostate needle biopsies: a population-based study of patients treated by radical prostatectomy. J Clin Pathol. 2020;73(10):630–635. doi:10.1136/jclinpath-2019-206300
28. Tomic K, Berglund A, Robinson D, et al. Capture rate and representativity of The National Prostate Cancer Register of Sweden. Acta Oncol. 2015;54(2):158–163. doi:10.3109/0284186X.2014.939299
29. Fall K, Stromberg F, Rosell J, Andren O, Varenhorst E; South-East Region Prostate Cancer G. Reliability of death certificates in prostate cancer patients. Scand J Urol Nephrol. 2008;42(4):352–357. doi:10.1080/00365590802078583
30. Godtman R, Holmberg E, Stranne J, Hugosson J. High accuracy of Swedish death certificates in men participating in screening for prostate cancer: a comparative study of official death certificates with a cause of death committee using a standardized algorithm. Scand J Urol Nephrol. 2011;45(4):226–232. doi:10.3109/00365599.2011.559950
31. Obuchowski NA, McClish DK. Sample size determination for diagnostic accuracy studies involving binormal ROC curve indices. Stat Med. 1997;16(13):1529–1542. doi:10.1002/(SICI)1097-0258(19970715)16:13<1529::AID-SIM565>3.0.CO;2-H
32. Zelic R, Giunchi F, Lianas L, et al. Interchangeability of light and virtual microscopy for histopathological evaluation of prostate cancer. Sci Rep. 2021;11(1):3257. doi:10.1038/s41598-021-82911-z
33. Firth D. Bias reduction of maximum likelihood estimates. Biometrika. 1993;80(1):27–38. doi:10.1093/biomet/80.1.27
34. Bamber D. Area above ordinal dominance graph and area below receiver operating characteristic graph. J Math Psychol. 1975;12(4):387–415. doi:10.1016/0022-2496(75)90001-2
35. Brentnall AR, Cuzick J, Field J, Duffy SW. A concordance index for matched case-control studies with applications in cancer risk. Stat Med. 2015;34(3):396–405. doi:10.1002/sim.6335
36. DeLong ER, DeLong DM, Clarke-Pearson DL. Comparing the areas under two or more correlated receiver operating characteristic curves: a nonparametric approach. Biometrics. 1988;44(3):837–845. doi:10.2307/2531595
37. Offermann A, Hohensteiner S, Kuempers C, et al. Prognostic value of the new prostate cancer international society of urological pathology grade groups. Front Med. 2017;4:157. doi:10.3389/fmed.2017.00157
38. Spratt DE, Jackson WC, Abugharib A, et al. Independent validation of the prognostic capacity of the ISUP prostate cancer grade grouping system for radiation treated patients with long-term follow-up. Prostate Cancer Prostatic Dis. 2016;19(3):292–297. doi:10.1038/pcan.2016.18
39. Berney DM, Beltran L, Fisher G, et al. Validation of a contemporary prostate cancer grading system using prostate cancer death as outcome. Br J Cancer. 2016;114(10):1078–1083. doi:10.1038/bjc.2016.86
40. Delahunt B, Egevad L, Srigley JR, et al. Validation of International Society of Urological Pathology (ISUP) grading for prostatic adenocarcinoma in thin core biopsies using TROG 03.04 “RADAR” trial clinical data. Pathology. 2015;47(6):520–525. doi:10.1097/PAT.0000000000000318
41. Cuzick J, Fisher G, Kattan MW, et al. Long-term outcome among men with conservatively treated localised prostate cancer. Br J Cancer. 2006;95(9):1186–1194. doi:10.1038/sj.bjc.6603411
42. Cooperberg MR, Pasta DJ, Elkin EP, et al. The University of California, San Francisco Cancer of the Prostate Risk Assessment score: a straightforward and reliable preoperative predictor of disease recurrence after radical prostatectomy. J Urol. 2005;173(6):1938–1942. doi:10.1097/01.ju.0000158155.33890.e7
43. Mohler JL, Antonarakis ES, Armstrong AJ, et al. Prostate Cancer, Version 2.2019, NCCN Clinical Practice Guidelines in Oncology. J Natl Compr Canc Netw. 2019;17(5):479–505. doi:10.6004/jnccn.2019.0023
44. Flood TA, Schieda N, Sim J, et al. Evaluation of tumor morphologies and association with biochemical recurrence after radical prostatectomy in grade group 5 prostate cancer. Virchows Arch. 2018;472(2):205–212. doi:10.1007/s00428-017-2241-9
45. Davidsson S, Fiorentino M, Andren O, et al. Inflammation, focal atrophic lesions, and prostatic intraepithelial neoplasia with respect to risk of lethal prostate cancer. Cancer Epidemiol Biomarkers Prev. 2011;20(10):2280–2287. doi:10.1158/1055-9965.EPI-11-0373
46. Kweldam CF, Kummerlin IP, Nieboer D, et al. Presence of invasive cribriform or intraductal growth at biopsy outperforms percentage grade 4 in predicting outcome of Gleason score 3+4=7 prostate cancer. Mod Pathol. 2017;30(8):1126–1132. doi:10.1038/modpathol.2017.29
 © 2022 The Author(s). This work is published and licensed by Dove Medical Press Limited. The
full terms of this license are available at https://www.dovepress.com/terms
and incorporate the Creative Commons Attribution
- Non Commercial (unported, 3.0) License.
By accessing the work you hereby accept the Terms. Non-commercial uses of the work are permitted
without any further permission from Dove Medical Press Limited, provided the work is properly
attributed. For permission for commercial use of this work, please see paragraphs 4.2 and 5 of our Terms.
© 2022 The Author(s). This work is published and licensed by Dove Medical Press Limited. The
full terms of this license are available at https://www.dovepress.com/terms
and incorporate the Creative Commons Attribution
- Non Commercial (unported, 3.0) License.
By accessing the work you hereby accept the Terms. Non-commercial uses of the work are permitted
without any further permission from Dove Medical Press Limited, provided the work is properly
attributed. For permission for commercial use of this work, please see paragraphs 4.2 and 5 of our Terms.