Back to Journals » OncoTargets and Therapy » Volume 11
Prognostic significance of NANOG expression in solid tumors: a meta-analysis
Authors Zhao LQ ![]() , Liu J
, Liu J ![]() , Chen S
, Chen S ![]() , Fang C
, Fang C ![]() , Zhang XQ
, Zhang XQ ![]() , Luo ZB
, Luo ZB ![]()
Received 29 March 2018
Accepted for publication 23 June 2018
Published 6 September 2018 Volume 2018:11 Pages 5515—5526
DOI https://doi.org/10.2147/OTT.S169593
Checked for plagiarism Yes
Review by Single anonymous peer review
Peer reviewer comments 4
Editor who approved publication: Dr Samir Farghaly
Lingqiong Zhao,1,* Jie Liu,2,* Shu Chen,1 Chun Fang,1 Xianquan Zhang,1 Zhibin Luo3
1Department of Oncology, The Second Affiliated Hospital of Chongqing Medical University, Chongqing 400010, China; 2Department of Cardiology, The Affiliated Hospital of North Sichuan Medical College, Sichuan 637000, China; 3Department of Oncology, Chongqing General Hospital, Chongqing 400010, China
*These authors contributed equally to this work
Purpose: NANOG is a tumor marker and indicates poor prognosis in various neoplasms; however, the evidence is controversial. This meta-analysis investigated the association of NANOG expression and clinicopathological features, and it impact on survival of patients with malignant tumors.
Methods: Studies published through May 31, 2018 were retrieved from PubMed, Web of Science, Embase, and the China National Knowledge Infrastructure. Two researchers independently screened the content and quality of studies and extracted data. Correlations of NANOG expression, clinicopathological variables, and survival were analyzed and the combined odds ratios (ORs) and hazard ratios (HRs) with 95% confidence intervals (95% CIs) were calculated.
Results: Thirty-three articles including 35 data sets of 3,959 patients were analyzed. Overall, elevated NANOG expression was associated with poor overall survival (HR = 2.19; 95% CI: 1.87–2.58, P<0.001) and poor disease-free survival (HR = 2.21, 95% CI: 1.54–3.18, P<0.001). Subgroup analysis found that NANOG expression was associated with worse overall survival in non–small cell lung (HR = 1.87; 95% CI: 1.26–2.76, P = 0.002), head and neck (HR = 2.29; 95% CI: 1.75–3.02, P<0.001), and digestive system (HR = 2.38; 95% CI: 1.95–2.91, P<0.001) cancers. Moreover, we found that high NANOG expression was associated with poor tumor differentiation (OR = 2.63; 95% CI: 1.59–4.55, P = 0.001), lymph node metastasis (OR = 2.59; 95% CI: 1.50–4.47, P = 0.001), advanced TNM stage (OR = 2.22; 95% CI: 1.42–3.45, P<0.001), and T stage (OR = 0.44; 95% CI: 0.20–0.93, P = 0.031).
Conclusion: The evidence supports NANOG as a tumor biomarker to guide clinical management and indicate prognosis. Additional studies are needed to further validate these results.
Keywords: NANOG, cancer, prognosis, meta-analysis
Introduction
NANOG is a transcription factor that contains a DNA-binding domain, and acts to maintain pluripotency, self-renewal, and the undifferentiated state of embryonic stem cells.1 It belongs to the NK-2 gene of the ANTP superfamily, which is primarily expressed in the blastocyst inner cell mass.2 However, cancer stem cells (CSCs) involved in tumor recurrence and metastasis express NANOG as a surface marker in addition to CD133, CD90, EpCAM, and CD44.3,4 NANOG protein expression is a biomarker that indicates poor clinical outcome in lung, breast, gastric, colorectal, pancreatic, and ovarian cancer as well as in hepatocellular, oral squamous cell, esophageal, and nasopharyngeal carcinoma.5–14 Ravindran et al reported that elevated NANOG expression was associated with poor overall survival (OS) and disease-free survival (DFS), lymph node metastasis, tumor stage, and differentiation of oral squamous cell carcinoma (OSCC),15 but Hwang et al found no association of NANOG expression with clinical stage or OS.10 Vaz et al found that NANOG expression was not related to prognosis in rectal cancer.16 Therefore, the prognostic value of NANOG expression in solid tumors is controversial. This meta-analysis was conducted to overcome design limitations and sample size limitations of previous studies to further evaluate the potential prognostic and clinical values of NANOG in patients with malignant cancers.
Materials and methods
Search strategy
Articles published through May 31, 2018 were retrieved from PubMed, the Web of Science, Embase, and the China National Knowledge Infrastructure (CNKI). Combinations of the MeSH headings and keywords “NANOG or NANOG homeobox protein or NANOGP8”, “cancer or malignancy or neoplasm or tumor or carcinoma”, and “prognosis or outcome or survival” were used in the searches. The reference lists of the retrieved articles were searched manually to supplement the literature retrieval.
Selection criteria
Studies with a pathologically confirmed solid tumor diagnosis, immunohistochemical (IHC) assay of NANOG expression in primary and tumor tissue, OS and/or DFS as primary outcomes, and reporting HRs with 95% CIs for OS and DFS or with the possibility of calculating them from survival curves were eligible. Moreover, the inclusion criteria included stratification of patients into NANOG-positive and -negative or high and low expression groups for the survival analysis. A sample size of ≥40 cancer patients was required, and the publications were limited to those in English and Chinese. Articles reporting overlapping or duplicate results, lacking information on survival outcomes, reviews, letters, expert opinions, conference abstracts, case reports, and animal studies were excluded. A flow diagram of article selection is shown in Figure 1.
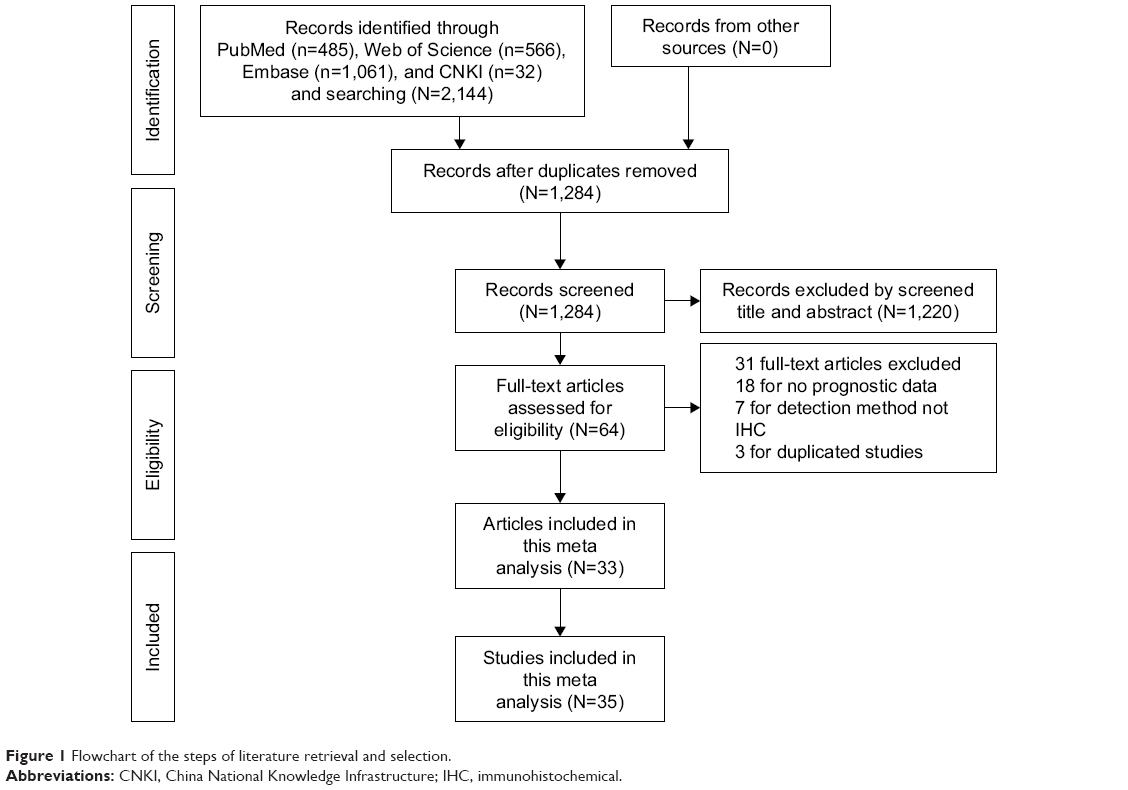 | Figure 1 Flowchart of the steps of literature retrieval and selection. |
Data extraction and quality assessment
Two investigators (LZ and JL) independently undertook data extraction and data quality evaluation. Disagreements were resolved by consultation with a third investigator (SC). The study information included the first author, country, language, publication year, cancer type, sample size, follow-up duration, assay methods, cutoff scores, and outcome measures. Patient characteristics included age, sex ratio, tumor differentiation, T stage, tumor size, TNM stage, lymph node metastasis, lymphatic infiltration, and vascular infiltration. HRs and 95% CIs of survival outcome were directly retrieved from the study or were estimated from Kaplan–Meier survival curves. The Newcastle–Ottawa Scale (NOS) was used to evaluate quality of selected literature.17 An NOS score ≥5 indicated high quality; low-quality studies were excluded. Discrepancies were resolved through discussion.
Statistical analysis
STATA version 14.0 (Stata Corporation, College Station, TX, USA) was used for the meta-analysis, and Engauge Digitizer version 4.1 (http://markummitchell.github.io/engauge-digitizer/) was used to extract survival data from Kaplan–Meier curves as previously described by Tierney et al.18 HRs and 95% CIs were pooled to estimate the impact of NANOG on OS and DFS. An HR >1.0 indicated a poor prognosis. ORs and 95% CIs were used to assess the relationship of NANOG expression and clinical pathological features. The chi-squared test and Cochrane’s I2 coefficient were calculated to assess heterogeneity in pooled studies. A chi-square P>0.10 or an I2<50% indicated low heterogeneity. If P was ≥0.1 and I2<50%, the fixed-effects model was used for analysis; otherwise (P<0.1 and/or I2≥50%), a random-effects model was used, and subgroup analysis was carried out to determine the origin of the heterogeneity. Sensitivity analysis was conducted by continuous omission of individual studies to evaluate the effectiveness and reliability of the meta-analysis. Publication bias was assessed in Begg’s funnel plots and Egger’s test. P<0.05 was considered as statistically significant.
Results
Study inclusion and characteristics
The study selection process is described in Figure 1. A total of 33 studies5–16,19–39 published from 2008–2018 and including 35 data sets with 3,959 patients were selected to evaluate the relationship of NANOG expression and tumor prognosis. The average study population size was 113, ranging from 42 to 312 patients. Twenty studies were conducted in China, five were conducted in Korea, and three in Japan. Twenty-eight were published in English and five in Chinese. Four studies evaluated non-small cell lung cancer (NSCLC),5,32–34 four evaluated gastric cancer (GC),9,26,27,38 and five evaluated OSCC;8,15,28,29,36 breast cancer,6,30,31 hepatocellular carcinoma (HCC),7,25,39 and ovarian cancer (OC)13,21,22 were each evaluated in three studies. Esophageal squamous cell carcinoma (ESCC),10,23 colorectal cancer (CRC),11,16 and pancreatic cancer (PC)12,24 were each evaluated in two studies. Nasopharyngeal carcinoma (NPC),14 astrocytoma,20 cervical cancer (CC),37 tongue squamous cell carcinoma (TSCC),35 and mucoepidermoid carcinoma (MEC)19 were each evaluated in one study. Thirty-three studies5–16,19–39 reported OS and nine studies6,9,13,15,21,22,31,32,38 reported DFS. NANOG expression was assayed in all tumor tissues by IHC and stratified by high and low expression. In most studies, the threshold of high NANOG expression included both staining percentage and intensity scores. Some studies reported the percentage of positively stained cells as the cutoff value. The quality scores of the selected studies ranged from 6 to 8, indicating that they were adequate for inclusion in the quantitative meta-analysis. Table 1 shows the characteristics of the included studies.
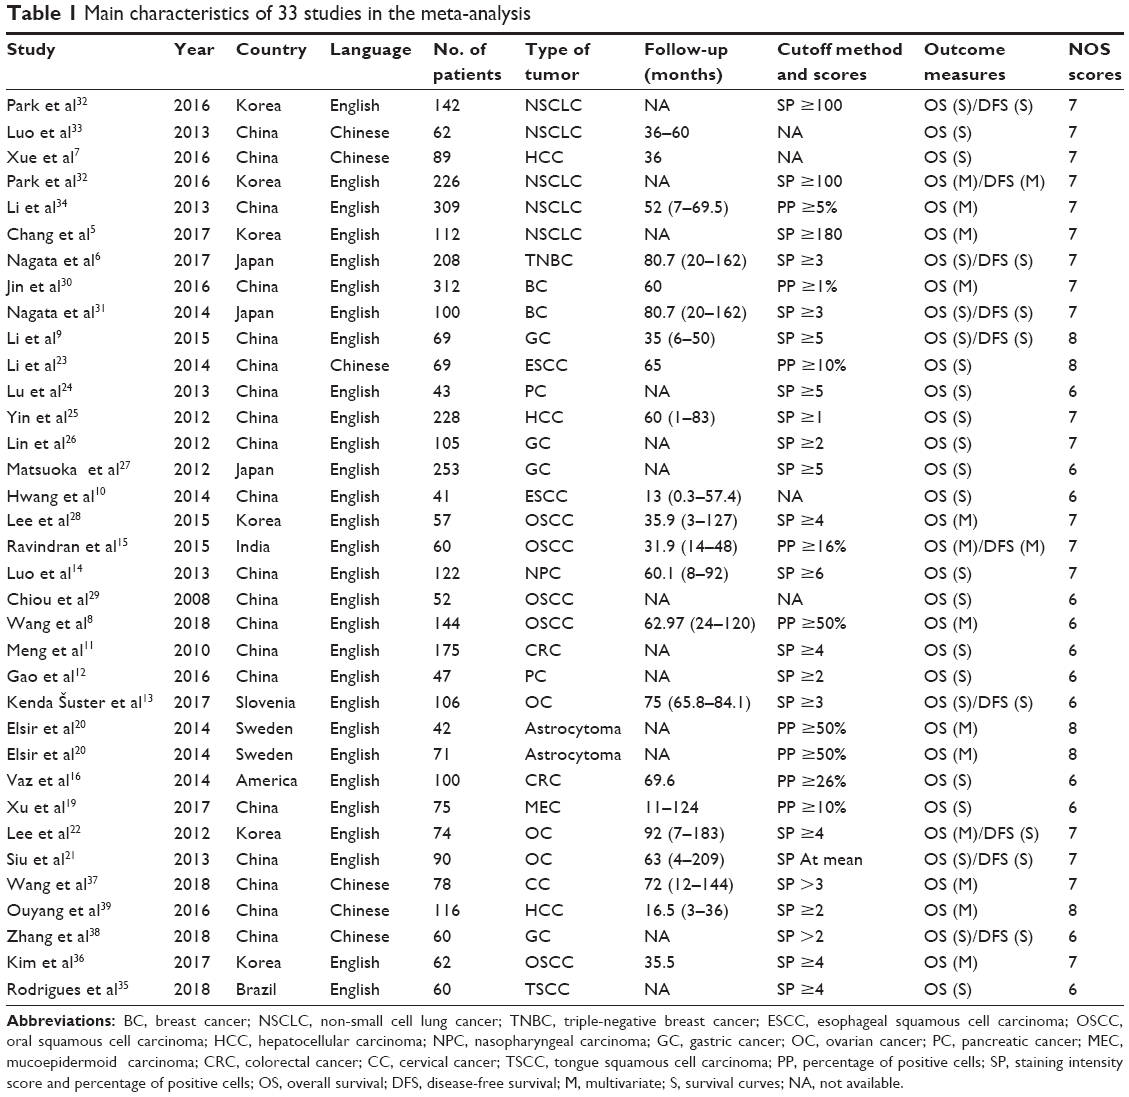 | Table 1 Main characteristics of 33 studies in the meta-analysis |
High NANOG expression and OS
All 33 articles reported the relationship of the NANOG expression and prognosis. Because of heterogeneity (I2 = 37%, P = 0.016), a random-effects model was used to pool HRs and 95% CIs. High NANOG expression was significantly associated with worse OS (HR = 2.19; 95% CI: 1.87–2.58, P<0.001, Figure 2).The effects of NANOG expression on OS in different solid tumors are shown in Figure 3. Elevated NANOG expression was significantly related to worse OS in NSCLC (HR = 1.87; 95% CI: 1.26–2.76, P = 0.002), head and neck cancers (HR = 2.29; 95% CI: 1.75–3.02, P<0.001), and digestive system cancers (HR = 2.38; 95% CI: 1.95–2.91, P<0.001), which included liver, gastric, colorectal, esophageal, and pancreatic cancer. Table 2 shows the results of subgroup analysis of OS. The pooled HR for OS was 2.26 (95% CI: 1.95–2.62, P<0.001) in Asians and 1.87 (95% CI: 1.08–3.23, P = 0.025) in Caucasians. The pooled HR estimate of OS was 2.09 (95% CI: 1.06–2.74, P<0.001) in studies with sample sizes >100 cases and 2.25 (95% CI: 1.86–2.72, P<0.001) for sample sizes of <100. The association of high NANOG expression and poor OS was significant in both multivariate (HR = 2.16; 95% CI: 1.77–2.62, P<0.001) and non-multivariate (HR = 2.19; 95% CI: 1.73–2.77, P<0.001) analysis.
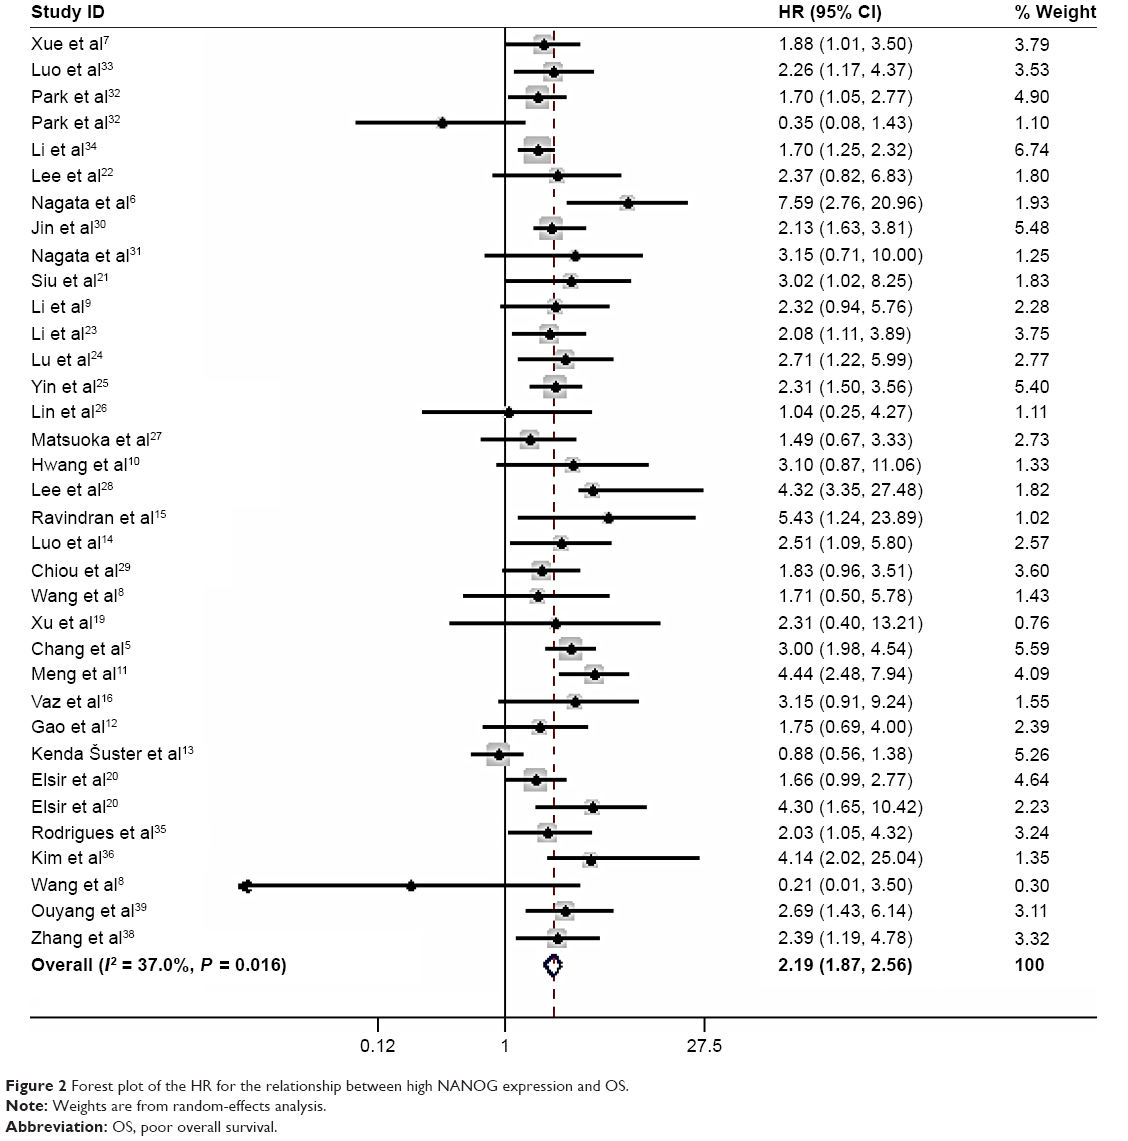 | Figure 2 Forest plot of the HR for the relationship between high NANOG expression and OS. |
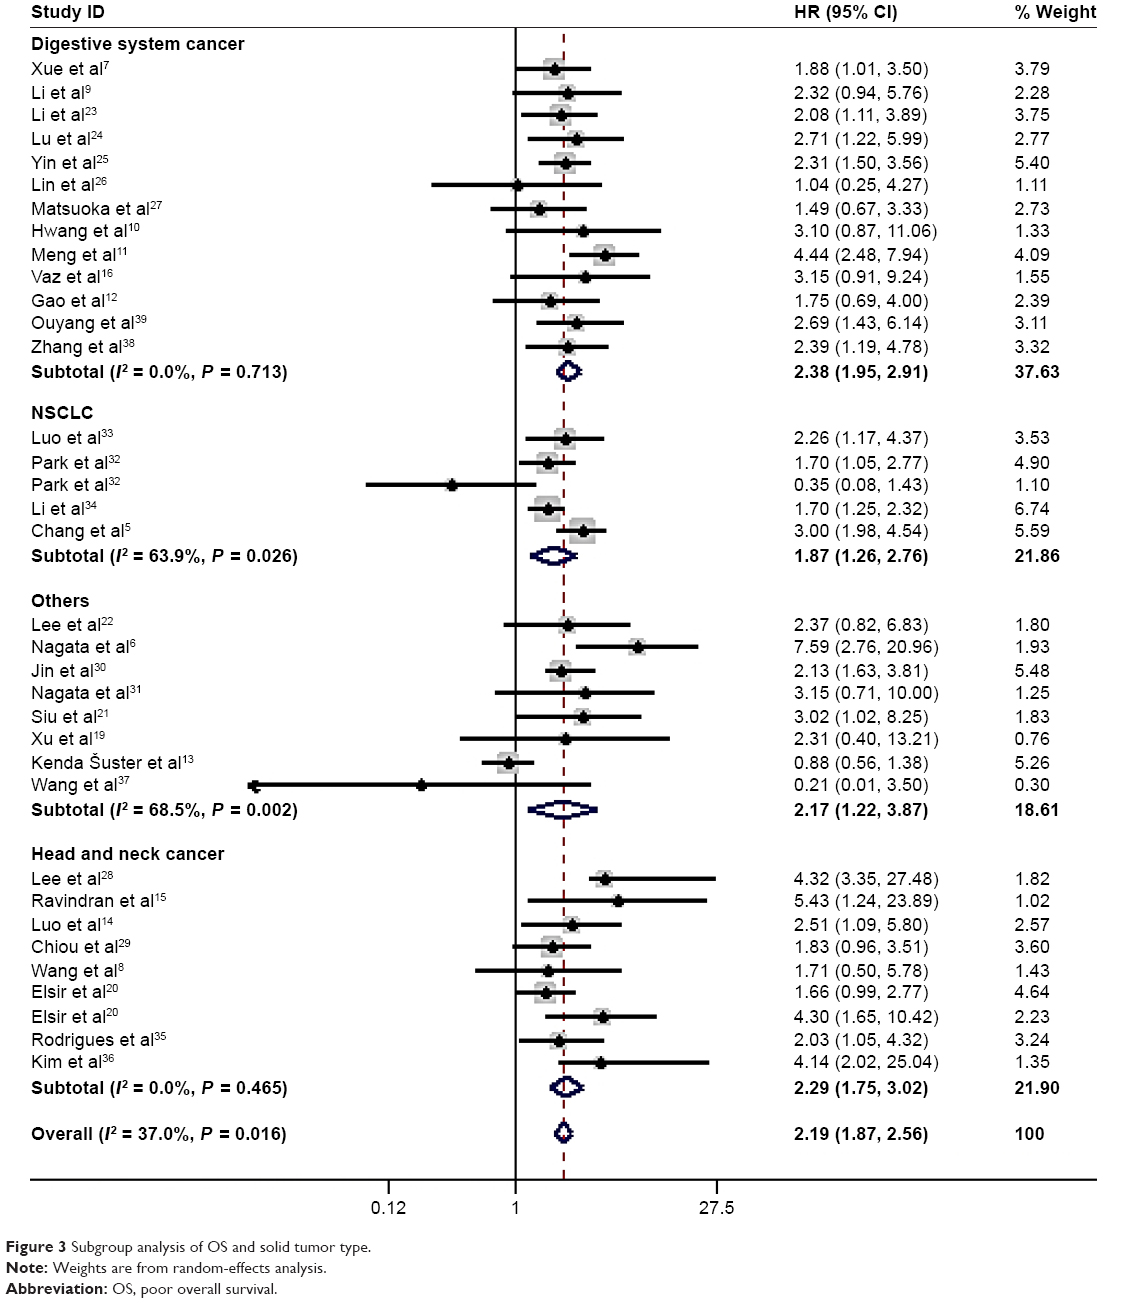 | Figure 3 Subgroup analysis of OS and solid tumor type. |
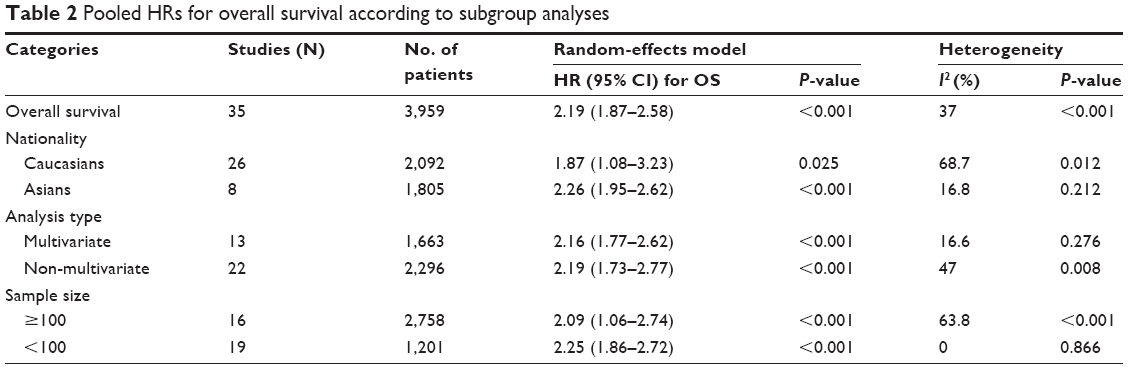 | Table 2 Pooled HRs for overall survival according to subgroup analyses |
High NANOG expression and DFS
Nine studies6,9,13,15,21,22,31,32,38 with ten data sets reported the association of high NANOG expression and DFS. Because of heterogeneity (I2 = 64.4%; P = 0.003), a random-effects model was used to pool HRs and 95% CI. As shown in Figure 4, NANOG expression was associated with worse DFS (HR = 2.21, 95% CI: 1.54–3.18, P<0.001). A subgroup analysis was conducted to investigate the origin of heterogeneity depending on the type of cancer (Figure 5). Elevated NANOG expression was significantly associated with worse DFS in ovarian (HR = 2.95; 95% CI: 1.65–5.27, P<0.001), and breast cancer (HR = 4.75; 95% CI: 2.70–8.34, P<0.001) but not NSCLC (HR = 1.23; 95% CI: 0.65–2.36, P = 0.524). Additional studies with larger sample sizes are required to reach a consensus.
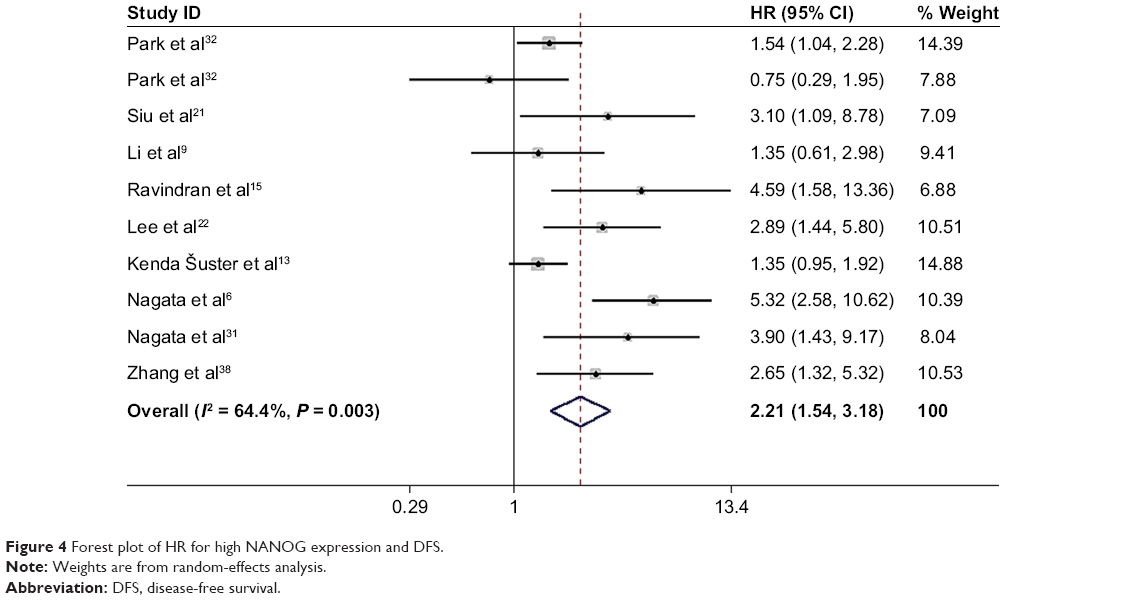 | Figure 4 Forest plot of HR for high NANOG expression and DFS. |
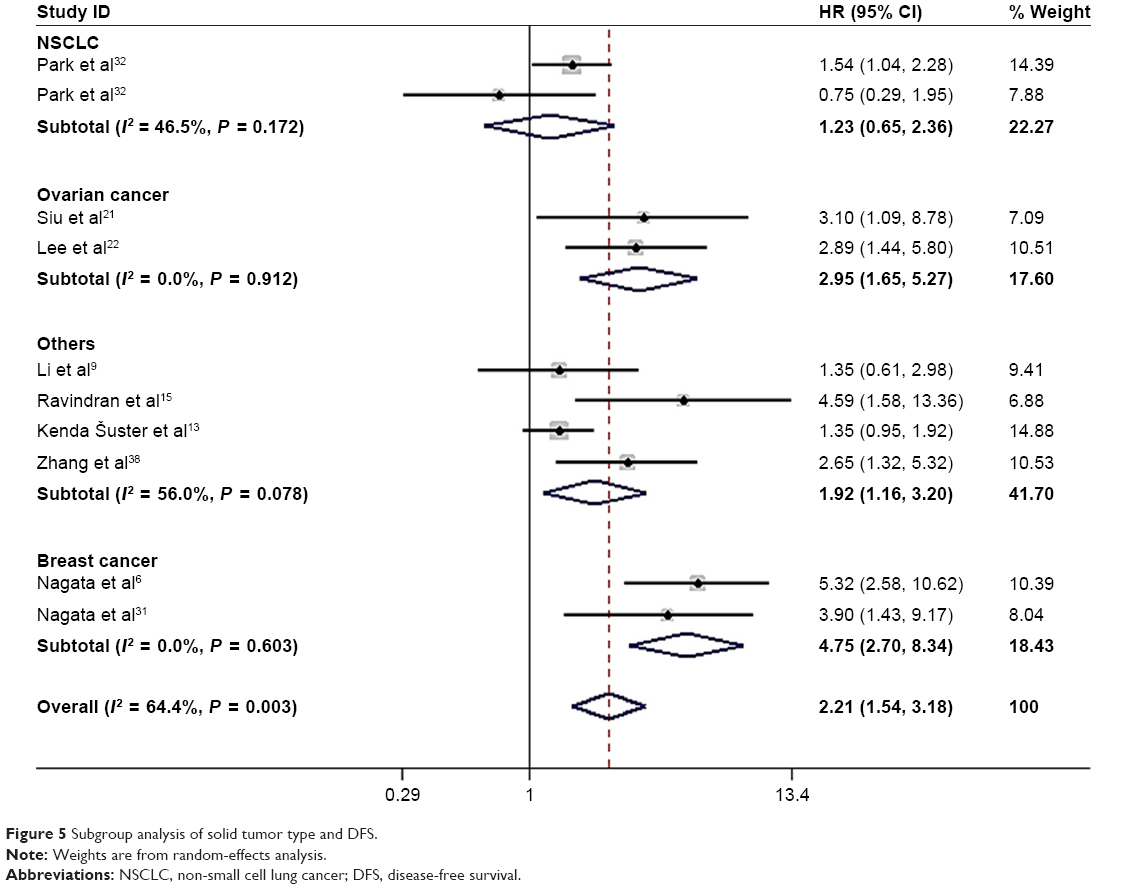 | Figure 5 Subgroup analysis of solid tumor type and DFS. |
High NANOG expression: clinical, and pathological characteristics
High NANOG expression was associated with poor tumor differentiation (OR = 2.63; 95% CI: 1.52–4.55, P = 0.001), lymph node metastasis (OR = 2.59; 95% CI: 1.50–4.47, P = 0.001), more advanced TNM stage (OR = 2.22; 95% CI: 1.42–3.45, P<0.001), and more advanced T stage (OR = 0.44; 95% CI: 0.20–0.93, P = 0.031). NANOG expression was not significantly correlated with age, sex, tumor size, lymphatic infiltration, and vascular infiltration. Because of the lack of data, the relationships of NANOG expression and other clinicopathological variables were not determined. The results are shown in Table 3.
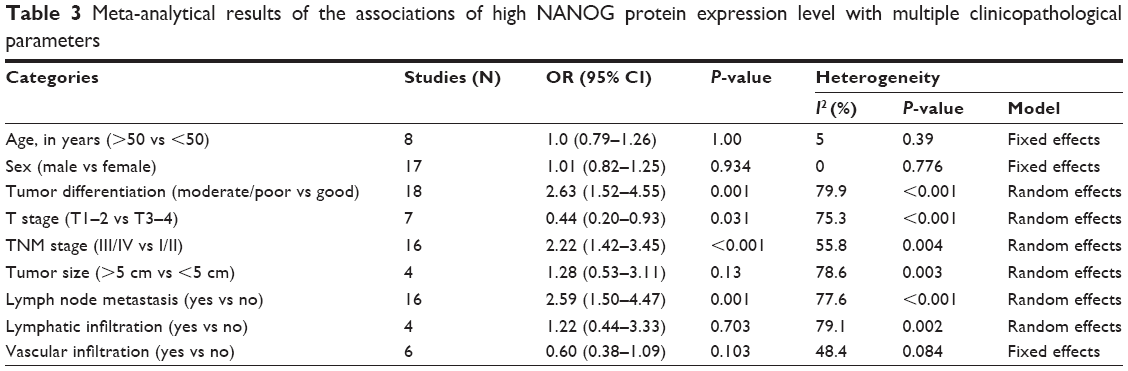 | Table 3 Meta-analytical results of the associations of high NANOG protein expression level with multiple clinicopathological parameters |
Sensitivity analysis and publication bias
The sensitivity analysis conducted by sequential deletion of each study to assess the credibility of the pooled results found that no individual study influenced the relationship of NANOG expression and survival outcome (Figures 6 and 7). This confirmed the credibility of this meta-analysis. Publication bias was assessed by Begg’s funnel plots and Egger’s test. The Begg’s funnel plots in Figures 8 and 9 show that there was no significant publication bias in the estimates of OS and DFS. The Egger’s test P-values of 0.286 for OS and 0.103 for DFS confirmed the lack of significant publication bias.
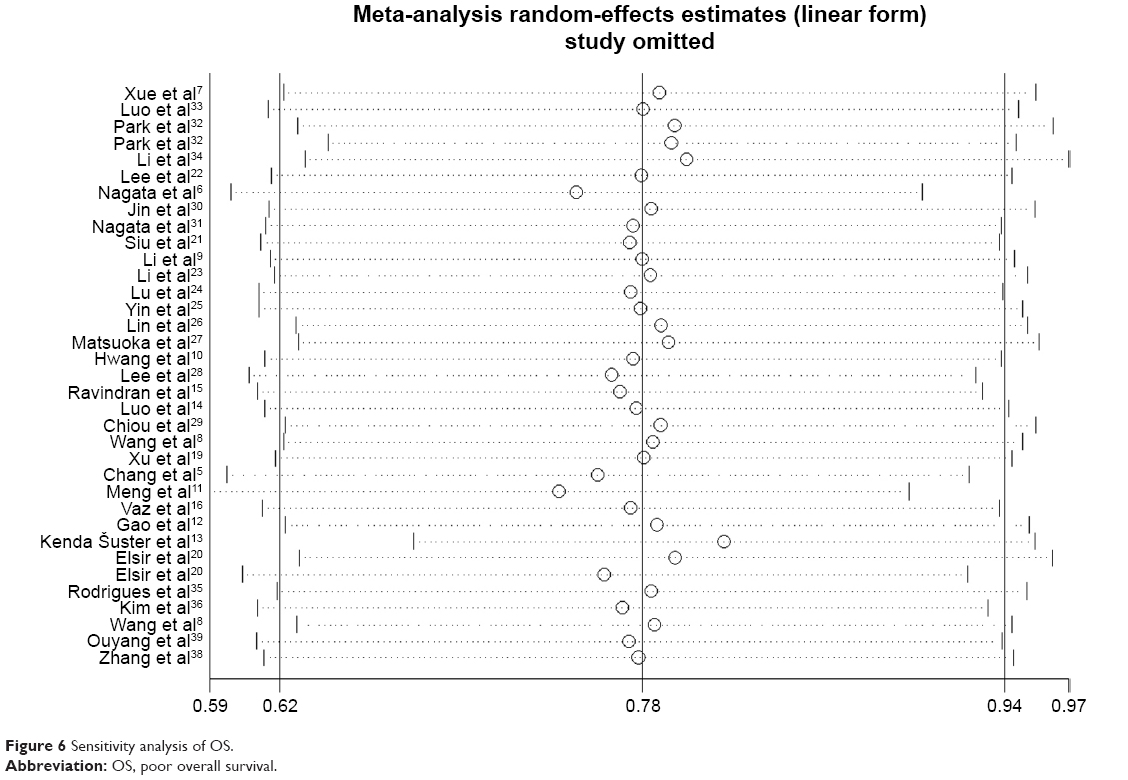 | Figure 6 Sensitivity analysis of OS. |
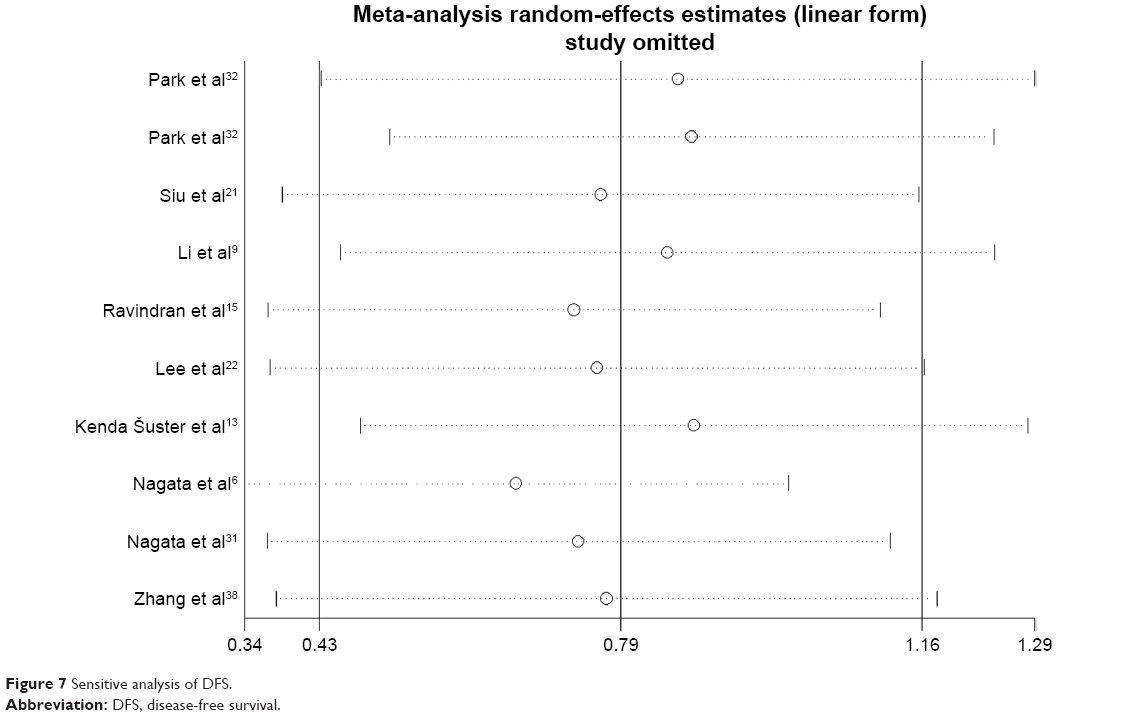 | Figure 7 Sensitive analysis of DFS. |
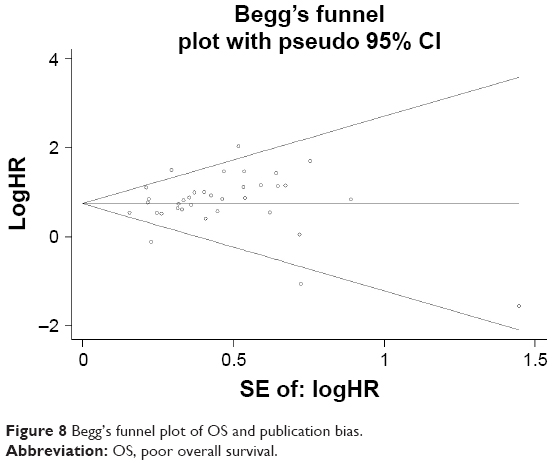 | Figure 8 Begg’s funnel plot of OS and publication bias. |
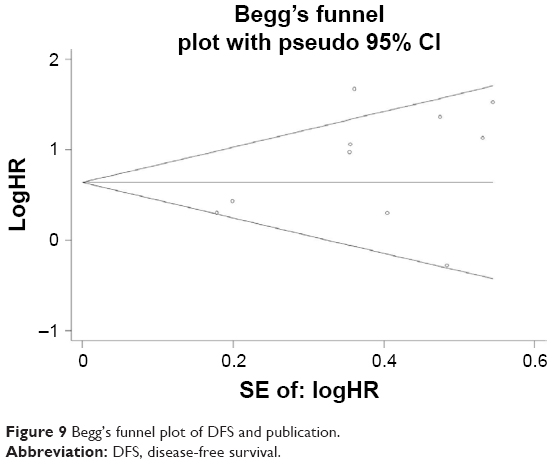 | Figure 9 Begg’s funnel plot of DFS and publication. |
Discussion
Cancer is a public health problem and the second leading cause of death worldwide, with 1,735,350 new cancer cases and 609,640 cancer deaths projected in the United States in 2018.40 Improved understanding of cancer mechanisms and prognosis will help to improve patient survival. Nanog gene expression decreases with cell differentiation, and is not detectable in terminally differentiated cells.41 However, NANOG protein is overexpressed in germ cell tumors and in many solid tumor types, where it is expressed in CSCs.42 The Nanog gene is active during the malignant conversion of normal cells; maintains self-renewal of tumor stem cells; regulates the proliferation, migration, and invasion of tumor cells; and promotes tumor immune escape.1,43,44
Recent preclinical studies have investigated the effects of targeting NANOG expression in CSCs on treatment resistance, invasiveness, and tumorigenesis. Huang et al found that targeting NANOG significantly inhibited the tumorigenicity of CSCs in head and neck squamous cell carcinoma, and increased cisplatin sensitivity.45 Tsai et al found that the OCT4 and NANOG expression increased with the development of cisplatin resistance in OSCC tumors.46 Stable transfection of NANOG into EC-9706 esophageal cancer cells increases drug resistance by upregulating expression of the multidrug resistance gene MDR-1.47 Interfering with NANOG-mediated transcription by genome editing, small-molecule inhibitors, transcription factor bait, and small interfering RNA may prove effective for targeting CSCs.48 Rad et al demonstrated that ODN decoys downregulated NANOG expression in P19 embryonal cancer cells.49 Ding et al reported that the invasiveness and chemoresistance of HeLa cells decreased when NANOG was destroyed by genomic editing with transcriptional activator like effect nuclease (TalEN),50 and CRISPR/CAS9 knockout of NANOG or NANOP8 confirmed their involvement in the in vivo tumorigenicity of DU145 prostate cancer cells in an experimental mouse model.51 Furthermore, inhibition of NANOG was found to enhance the cytotoxicity of BH3 mimetic targeting of Bcl-2 family members in CRC cells.52
The evidence supports NANOG as a novel indicator of cancer prognosis. Studies of the relationship of clinicopathological variables, NANOG expression, and prognosis are listed in Table 1. The data of individual studies are inconclusive. This meta-analysis was conducted to clarify the prognostic influence of NANOG expression in solid tumors.
To our knowledge, this meta-analysis is the most thorough appraisal of the clinical studies that investigated the prognostic value of NANOG expression in human solid tumors. Thirty-three eligible studies comprising 35 data sets met the selection criteria. The evidence supports NANOG overexpression as an independent, predictive biomarker of poor OS and DFS in solid tumors. Elevated NANOG expression was associated with poor prognosis in most digestive system cancers (I2 = 0%), NSCLC (I2 = 63.9%), and head and neck cancer (I2 = 0%). Moreover, subgroup analysis indicated that high NANOG expression was significantly correlated with OS regardless of sample size, nationality, or type of analysis, which further supported its prognostic value. Elevated NANOG expression was significantly associated with worse DFS in ovarian and breast cancers but not in NSCLC. Because of the limited number of articles, it cannot be concluded that NANOG expression, when compared with the tumor type, had a greater impact on survival. The sensitivity analysis failed to find the cause of heterogeneity; therefore, the random-effects model was adopted for the combined results. Study heterogeneity may have resulted from differences in follow-up intervals, threshold values of high NANOG expression, and the types of solid tumors studied.
In this meta-analysis, NANOG expression was associated with age in eight, sex in 17, tumor size in four, lymphatic infiltration in four, and vascular infiltration in six studies. The pooled results did not find statistically significant correlations of NANOG expression and those variables. NANOG expression was correlated with TNM stage in 16, tumor differentiation in 18, lymph node metastasis in 16, and T stage in seven studies. The pooled results found that NANOG expression was correlated with tumor differentiation, lymph node metastasis, T stage, and TNM stage.
This meta-analysis was intended to be comprehensive, but it has limitations. First, the threshold value of high NANOG expression was not the same in each study, and may have led to an increase in the heterogeneity. A common cutoff value should be defined. Second, HRs estimated from Kaplan–Meier curves as previously described by Tierney et al might not be as dependable as those extracted directly from the original text of the report, and may have affected the summary analysis. Third, many included studies did not report clinicopathological features, which may lead to bias. Finally, differences in analysis methods, sample sources, follow-up duration, and tumor types might have introduced statistical bias. Additional studies with larger samples and standard testing methods are required to reach a consensus.
Conclusion
Increased NANOG protein expression in various human solid tumors was significantly correlated with poor OS and DFS. NANOG is a potential biomarker to guide clinical treatment and may have prognostic value in human solid tumors. The results of this meta-analysis warrant performance of additional clinical studies of NANOG in human solid tumors.
Acknowledgment
The authors thank International Science Editing (http://www.internationalscienceediting.com) for editing this manuscript.
Disclosure
The authors report no conflicts of interest in this work.
References
Chambers I, Colby D, Robertson M, et al. Functional expression cloning of Nanog, a pluripotency sustaining factor in embryonic stem cells. Cell. 2003;113(5):643–655. | ||
do DV, Ueda J, Messerschmidt DM, et al. A genetic and developmental pathway from STAT3 to the OCT4-NANOG circuit is essential for maintenance of ICM lineages in vivo. Genes Dev. 2013;27(12):1378–1390. | ||
Visvader JE. Cells of origin in cancer. Nature. 2011;469(7330):314–322. | ||
Wang T, Shigdar S, Gantier MP, et al. Cancer stem cell targeted therapy: progress amid controversies. Oncotarget. 2015;6(42):44191–44206. | ||
Chang B, Park MJ, Choi SI, et al. NANOG as an adverse predictive marker in advanced non-small cell lung cancer treated with platinum-based chemotherapy. Onco Targets Ther. 2017;10:4625–4633. | ||
Nagata T, Shimada Y, Sekine S, et al. KLF4 and NANOG are prognostic biomarkers for triple-negative breast cancer. Breast Cancer. 2017;24(2):326–335. | ||
Xue YM, Yao BW, Liu ZK. Expression and clinical significance of NANOG in hepatocellular carcinoma. Journal of Xi’an Jiaotong University. 2016;37(5):684–688. | ||
Wang S, Fan H, Xu J, Zhao E. Prognostic implication of NOTCH1 in early stage oral squamous cell cancer with occult metastases. Clin Oral Investig. 2018;22(3):1131–1138. | ||
Li N, Deng W, Ma J, et al. Prognostic evaluation of Nanog, Oct4, Sox2, PCNA, Ki67 and E-cadherin expression in gastric cancer. Medical Oncology. 2015;32(1):1–9. | ||
Hwang CC, Nieh S, Lai CH, et al. A retrospective review of the prognostic value of ALDH-1, Bmi-1 and Nanog stem cell markers in esophageal squamous cell carcinoma. PLoS One. 2014;9(8):e105676. | ||
Meng HM, Zheng P, Wang XY, et al. Over-expression of Nanog predicts tumor progression and poor prognosis in colorectal cancer. Cancer Biol Ther. 2010;9(4):295–302. | ||
Gao S, Pan Y, Song L, et al. Nanog Predicts Poor Prognosis in Human Pancreatic Cancer and Is Downregulated by QingyihuaJi Formula in Pancreatic Cancer Stem Cells. Evid Based Complement Alternat Med. 2016;2016:7028289–9. | ||
Kenda Šuster N, Frković Grazio S, Virant-Klun I, Verdenik I, Smrkolj Š. Cancer Stem Cell-Related Marker NANOG Expression in Ovarian Serous Tumors: A Clinicopathological Study of 159 Cases. Int J Gynecol Cancer. 2017;27(9):2006–2013. | ||
Luo W, Li S, Peng B. Embryonic Stem Cells Markers SOX2, OCT4 and Nanog Expression and Their Correference are not relations with Epithelial-Mesenchymal Transition in Nasopharyngeal Carcinoma. Plos One. 2013;8(2):e56324. | ||
Ravindran G, Sawant SS, Hague A, Kingsley K, Devaraj H. Association of differential β-catenin expression with Oct-4 and Nanog in oral squamous cell carcinoma and their correlation with clinicopathological factors and prognosis. Head Neck. 2015;37(7):982–993. | ||
Vaz MA, Martinez JC, Devesa JM, et al. Prognostic value of stem cell quantification in stage II colon cancer. PLoS One. 2014;9(2):e88480. | ||
Stang A. Critical evaluation of the Newcastle-Ottawa scale for the assessment of the quality of nonrandomized studies in meta-analyses. Eur J Epidemiol. 2010;25(9):603–605. | ||
Tierney JF, Stewart LA, Ghersi D, Burdett S, Sydes MR. Practical methods for incorporating summary time-to-event data into meta-analysis. Trials. 2007;8:16. | ||
Xu W, Wang Y, Qi X, et al. Prognostic factors of palatal mucoepidermoid carcinoma: a retrospective analysis based on a double-center study. Sci Rep. 2017;7:43907. | ||
Elsir T, Edqvist PH, Carlson J, et al. A study of embryonic stem cell-related proteins in human astrocytomas: identification of Nanog as a predictor of survival. Int J Cancer. 2014;134(5):1123–1131. | ||
Siu MK, Wong ES, Kong DS, et al. Stem cell transcription factor NANOG controls cell migration and invasion via dysregulation of E-cadherin and FoxJ1 and contributes to adverse clinical outcome in ovarian cancers. Oncogene. 2013;32(30):3500–3509. | ||
Lee M, Nam EJ, Kim SW, et al. Prognostic impact of the cancer stem cell-related marker NANOG in ovarian serous carcinoma. Int J Gynecol Cancer. 2012;22(9):1489–1496. | ||
Li XJ, Zhao YF, Li MX, et al. Expression of Nanog and its prognostic significance in esophageal squamous cell carcinoma. Chinese Journal of Cancer Prevention and Treatment. 2014;21(24):1962–1965. | ||
Lu Y, Zhu H, Shan H, et al. Knockdown of Oct4 and Nanog expression inhibits the stemness of pancreatic cancer cells. Cancer Lett. 2013;340(1):113–123. | ||
Yin X, Li YW, Zhang BH, et al. Coexpression of stemness factors Oct4 and Nanog predict liver resection. Ann Surg Oncol. 2012;19(9):2877–2887. | ||
Lin T, Ding YQ, Li JM. Overexpression of Nanog protein is associated with poor prognosis in gastric adenocarcinoma. Med Oncol. 2012;29(2):878–885. | ||
Matsuoka J, Yashiro M, Sakurai K, et al. Role of the stemness factors sox2, oct3/4, and nanog in gastric carcinoma. J Surg Res. 2012;174(1):130–135. | ||
Lee HJ, Kang YH, Lee JS, et al. Positive expression of NANOG, mutant p53, and CD44 is directly associated with clinicopathological features and poor prognosis of oral squamous cell carcinoma. BMC Oral Health. 2015;15(1):153. | ||
Chiou SH, Yu CC, Huang CY, et al. Positive correlations of Oct-4 and Nanog in oral cancer stem-like cells and high-grade oral squamous cell carcinoma. Clin Cancer Res. 2008;14(13):4085–4095. | ||
Jin C, Zhang X, Sun M, et al. Clinical implications of the coexpression of SRC1 and NANOG in HER-2-overexpressing breast cancers. Onco Targets Ther. 2016;9:5483–5488. | ||
Nagata T, Shimada Y, Sekine S, et al. Prognostic significance of NANOG and KLF4 for breast cancer. Breast Cancer. 2014;21(1):96–101. | ||
Park E, Park SY, Sun PL, et al. Prognostic significance of stem cell-related marker expression and its correlation with histologic subtypes in lung adenocarcinoma. Oncotarget. 2016;7(27):42502–42512. | ||
Luo MQ, Pu Q, Cao YL, et al. Relationship between effect of GP regimen prognostic significance and Nanog expression in advanced lung cancer. Cancer Research and Clinic. 2013;25(9):609–611. | ||
Li XQ, Yang XL, Zhang G, et al. Nuclear β-catenin accumulation is associated with increased expression of Nanog protein and predicts poor prognosis of non-small cell lung cancer. J Transl Med. 2013;11(1):114. | ||
Rodrigues M, Xavier FCA, Andrade NP, et al. Prognostic implications of CD44, NANOG, OCT4, and BMI1 expression in tongue squamous cell carcinoma. Head Neck. 2018:1–15. | ||
Kim H-M, Kang Y-H, Byun J-H, et al. Midkine and NANOG Have Similar Immunohistochemical Expression Patterns and Contribute Equally to an Adverse Prognosis of Oral Squamous Cell Carcinoma. Int J Mol Sci. 2017;18(11):2339. | ||
Wang H, Jy H, Sw L, et al. Expression of stem cell related transcription factors 3, high-mobility groupbox1, and stem cell markers Nanog and their significance in cervical cancer. Medical Journal of Wuhan University. 2018;39(3):350–355. | ||
Zhang YM, Fan LX, Cai YQ. Nanog, Sox2 and TFF3 expression and their relationship with the prognosis of intestinal type gastric cancer. Oncology Progress. 2018;16(01):73–76. | ||
Ouyang XW, Feng TC, Zhang S. Relationship between expressions of cancer suppressor gene Merlin and stem cell marker Nanog in hepatocellular carcinoma and the significance. Chinese Journal of General Surgery. 2016;25(07):1011–1016. | ||
Siegel RL, Miller KD, Jemal A. Cancer statistics, 2018. CA: A Cancer Journal for Clinicians. 2018;68(1):7–30. | ||
Hyslop L, Stojkovic M, Armstrong L, et al. Downregulation of NANOG induces differentiation of human embryonic stem cells to extraembryonic lineages. Stem Cells. 2005;23(8):1035–1043. | ||
Iv Santaliz-Ruiz LE, Xie X, Old M, Teknos TN, Pan Q. Emerging role of nanog in tumorigenesis and cancer stem cells. Int J Cancer. 2014;135(12):2741–2748. | ||
Gawlik-Rzemieniewska N, Bednarek I. The role of NANOG transcriptional factor in the development of malignant phenotype of cancer cells. Cancer Biol Ther. 2016;17(1):1–10. | ||
Robitschek E, Mao C-P, Peng S, Hung C-F, Wu TC, et al. Abstract 448: The role of the Nanog transcription factor in tumor immune escape. Cancer Res. 2015;75(15):448. | ||
Huang CE, Yu CC, Hu FW, Chou MY, Tsai LL. Enhanced chemosensitivity by targeting Nanog in head and neck squamous cell carcinomas. Int J Mol Sci. 2014;15(9):14935–14948. | ||
Tsai LL, Yu CC, Chang YC, Yu CH, Chou MY. Markedly increased Oct4 and Nanog expression correlates with cisplatin resistance in oral squamous cell carcinoma. J Oral Pathol Med. 2011;40(8):621–628. | ||
Yang L, Zhang X, Zhang M, et al. Increased Nanog expression promotes tumor development and Cisplatin resistance in human esophageal cancer cells. Cell Physiol Biochem. 2012;30(4):943–952. | ||
Wong OG, Cheung AN. Stem cell transcription factor NANOG in cancers – is eternal youth a curse? Expert Opin Ther Targets. 2016;20(4):407–417. | ||
Rad SM, Bamdad T, Sadeghizadeh M, et al. Transcription factor decoy against stem cells master regulators, Nanog and Oct-4: a possible approach for differentiation therapy. Tumour Biol. 2015;36(4):2621–2629. | ||
Ding Y, Yu AQ, Li CL, Aq Y, Cl L, et al. TALEN-mediated Nanog disruption results in less invasiveness, more chemosensitivity and reversal of EMT in Hela cells. Oncotarget. 2014;5(18):8393–8401. | ||
Kawamura N, Nimura K, Nagano H, et al. CRISPR/Cas9-mediated gene knockout of NANOG and NANOGP8 decreases the malignant potential of prostate cancer cells. Oncotarget. 2015;6(26):22361–22374. | ||
Mattoo AR, Zhang J, Espinoza LA, Jessup JM. Inhibition of NANOG/NANOGP8 downregulates MCL-1 in colorectal cancer cells and enhances the therapeutic efficacy of BH3 mimetics. Clin Cancer Res. 2014;20(21):5446–5455. |
 © 2018 The Author(s). This work is published and licensed by Dove Medical Press Limited. The
full terms of this license are available at https://www.dovepress.com/terms
and incorporate the Creative Commons Attribution
- Non Commercial (unported, 3.0) License.
By accessing the work you hereby accept the Terms. Non-commercial uses of the work are permitted
without any further permission from Dove Medical Press Limited, provided the work is properly
attributed. For permission for commercial use of this work, please see paragraphs 4.2 and 5 of our Terms.
© 2018 The Author(s). This work is published and licensed by Dove Medical Press Limited. The
full terms of this license are available at https://www.dovepress.com/terms
and incorporate the Creative Commons Attribution
- Non Commercial (unported, 3.0) License.
By accessing the work you hereby accept the Terms. Non-commercial uses of the work are permitted
without any further permission from Dove Medical Press Limited, provided the work is properly
attributed. For permission for commercial use of this work, please see paragraphs 4.2 and 5 of our Terms.