Back to Journals » Cancer Management and Research » Volume 13
Prognostic Score Model Based on Ten Differentially Methylated Genes for Predicting Clinical Outcomes in Patients with Adenocarcinoma of the Colon
Authors Sun G, Duan H, Xing Y, Zhang D ![]()
Received 21 March 2021
Accepted for publication 27 May 2021
Published 28 June 2021 Volume 2021:13 Pages 5113—5125
DOI https://doi.org/10.2147/CMAR.S312085
Checked for plagiarism Yes
Review by Single anonymous peer review
Peer reviewer comments 2
Editor who approved publication: Dr Sanjeev K. Srivastava
Gongping Sun,1 He Duan,1 Yuanhao Xing,2 Dewei Zhang1
1Department of General Surgery, The Fourth Affiliated Hospital of the China Medical University, Shenyang, 110032, People’s Republic of China; 2China Medical University, Shenyang, 110000, People’s Republic of China
Correspondence: Dewei Zhang
Department of General Surgery, The Fourth Affiliated Hospital of the China Medical University, No. 4 Chongshan Road, Shenyang, 110032, People’s Republic of China
Tel +86-24-62043155
Email [email protected]
Purpose: We aimed to screen novel genetic biomarkers for use in a prognostic score (PS) model for the accurate prediction of survival outcomes for patients with colon adenocarcinoma (COAD).
Methods: Gene expression and methylation data were downloaded from The Cancer Genome Atlas database, and the samples were randomly divided into training and validation sets for the screening of differentially methylated genes (DMGs) and differentially expressed genes (DEGs). Co-methylated genes were screened using weighted gene co-expression network analysis. Functional enrichment analysis was performed using the Database for Annotation, Visualization, and Integrated Discovery. Univariate and multivariate Cox regression analyses were performed to identify prognosis-related genes and clinical factors. Receiver operating characteristic curve analysis was carried out to evaluate the predictive performance of the PS model.
Results: In total, 1434 DEGs and 1038 DMGs were screened in the training set, among which 284 were found to be overlapping genes. For 127 of these overlapping genes, the methylation and expression levels were significantly negatively correlated. An optimal signature from 10 DMGs was identified to construct the PS model. Patients with a high PS seemed to have worse outcomes than those with a low PS. Moreover, cancer recurrence and the PS model status were independent prognostic factors.
Conclusion: This PS model based on an optimal 10-gene signature would help in the stratification of patients with COAD and improve the assessment of their clinical outcomes.
Keywords: colon adenocarcinoma, methylation, prognostic score model, independent prognostic factor
Introduction
Colorectal cancer (CRC) ranks fourth among the most fatal malignancies in the world, resulting in approximately 900,000 deaths each year.1 Occurring in the colon or rectum, CRC had previously been regarded as a single entity, but the term is being abandoned owing to the different etiologies, pathologies, treatments, drug responses, and prognoses of the disease based on tumor location.2,3 During malignant transformation in the colon mucosa, 85–90% of tumors occur mostly in the form of adenomas, making colon adenocarcinoma (COAD) the most common pathological type of colon cancer.4 Despite that postoperative chemotherapy has been shown to decrease the risk of local cancer recurrence and metastasis, it has shown less benefits in improving the survival of patients with COAD. Additionally, although postoperative chemotherapy is considered beneficial for patients with stage III cancer, the benefits provided to those with stage II disease remain controversial.5 Therefore, there is an urgent need to identify more characteristic and valuable biomarkers for the early prediction and treatment of COAD in order to improve patient outcomes.
Recent studies have demonstrated the feasibility of stratifying the risk of COAD and predicting its outcome by combining molecular characteristics with pathological features of the tumor.6,7 For example, Yang et al developed a risk score model based on seven genes, which—when combined with tumor staging—showed good prognostic performance in predicting the outcome of patients with colon cancer.8 Additionally, alterations in gene methylation have been found to mediate changes in the tumor phenotype and heterogeneity by affecting gene transcription in the early stages of carcinogenesis.9,10 On the basis of DNA methylation levels, Yang et al categorized 424 patients with COAD into seven subgroups with different prognoses, which contributed to other studies exploring the tumor heterogeneity of COAD and to the development of personalized therapeutic strategies.11 Liu et al showed that heterogeneous nuclear ribonucleoprotein (HNRNPC) and YTH m6A RNA-binding protein 1 (YTHDF1)—two m6A RNA-methylated regulators that are abnormally expressed in COAD—were independent predictive indicators of the outcomes of patients with COAD and were not influenced by clinical factors.12 Zhao et al indicated that the CXC motif chemokine ligand 3 (CXCL3) and CXCL8 genes were aberrantly methylated and differentially expressed in COAD, with the decreased levels in expression of these two genes correlating with worse patient outcomes.13 However, considering the complexity and heterogeneity of COAD, additional genetic biomarkers need to be identified before the outcomes of patients with this disease can be predicted with accuracy. In this study, we used gene expression and methylation data of COAD from The Cancer Genome Atlas (TCGA) database to establish a prognostic score (PS) model based on differentially methylated gene (DMG) signals for improving the assessment of clinical outcomes and aiding the development of therapeutic strategies against this malignant disease.
Materials and Methods
Data Acquisition and Preprocessing
Gene expression data of 512 COAD samples and gene methylation data of 337 COAD samples together with the corresponding clinical data were downloaded from TCGA database (https://gdc-portal.nci.nih.gCOAD/). The gene expression data were generated using the Illumina HiSeq 2000 RNA Sequencing platform. The methylation data were generated using the Illumina Infinium Human Methylation 450 BeadChip Kit and annotated using the RIlluminaHumanMethylation 450kanno.ilmn12.hg19 package. In total, 304 samples (comprising 285 COAD and 19 normal samples) with overlapping gene expression and methylation data were used in this study. The analytical procedure is outlined in Figure S1. The 285 COAD samples were randomly divided into a training set (n = 142) and a validation set (n = 143); their clinical characteristics are listed in Table 1.
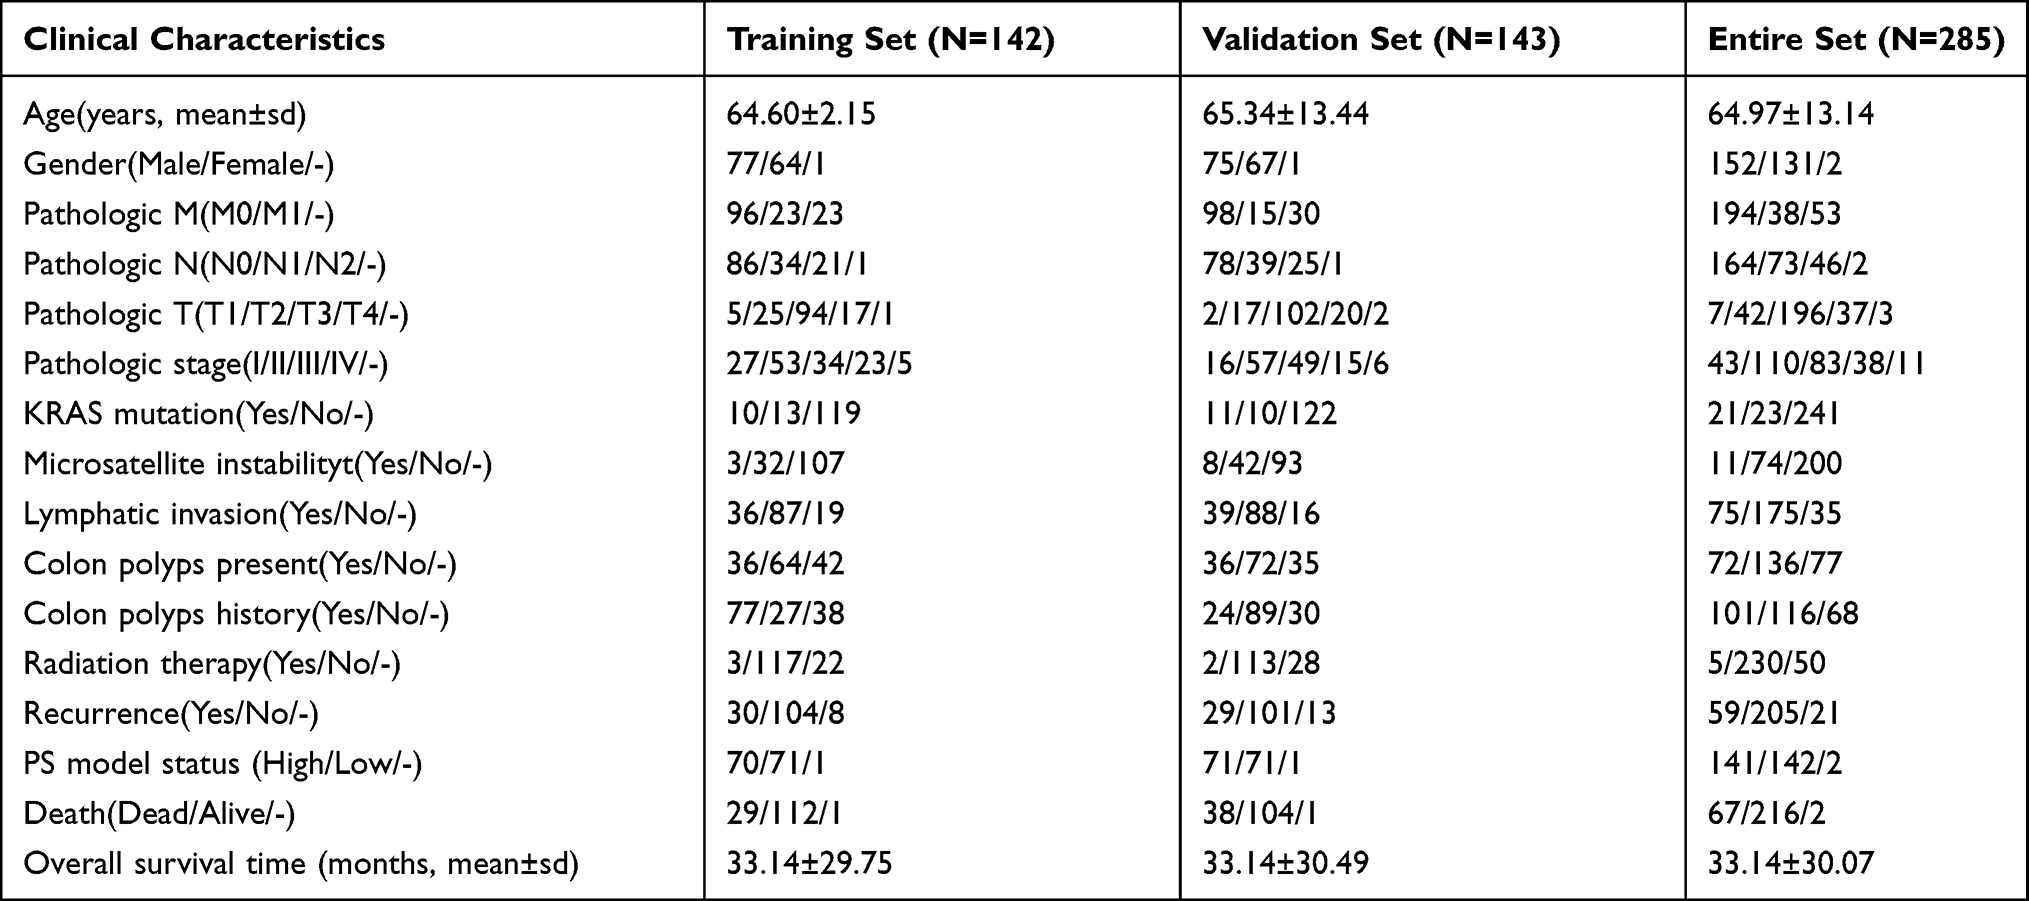 |
Table 1 Clinical Characteristics of the Included 285 COAD Samples |
Differential Analysis of the Gene Expression and Methylation Data
The limma package (version 3.34.7)14 in R3.6.1 was used to perform the differential analysis between the COAD and normal samples, with the screening of the DMGs and differentially expressed genes (DEGs) being based on a false discovery rate (FDR) of <0.05 and a |log2 fold change (FC)| of >0.5. For this, a centered Pearson correlation algorithm15 based on bidirectional hierarchical clustering was used together with the pheatmap package (version 1.0.8)16 in R3.6.1.
Screening of Co-Methylated Genes
Weighted gene co-expression network analysis (WGCNA) was used to assess the correlations between the genes obtained. In the WGCNA algorithm, genes with similar changes in expression in the same biological process category are clustered into one module. The methylation data were evaluated using the WGCNA (version 1.63) package17 in R3.6.1 to screen both the methylation level-related modules and the genes whose expression levels were considered to have a strong correlation with their methylation levels. Then, after mapping the DMGs to the WGCNA modules, the fold enrichment and the p values of the genes in each module whose expression and methylation levels were significantly correlated were calculated using the following hypergeometric algorithm:18  , where N represents the methylation site, M represents the gene number in each module, and n represents the number of DMGs mapped to the modules. A p value of <0.05 and a fold enrichment value of >1 were used to screen the significant modules.
Correlation Between the Gene Methylation and Expression Levels
The correlation between the methylation level of the DMGs and the expression level of the DEGs was evaluated. The cor. test function in R3.6.1 was used to calculate the Pearson and Spearman correlation coefficients,19 and the genes with significant negative correlations were selected. Thereafter, those genes involved in the Biological Processes category of Gene Ontology (GO) and in Kyoto Encyclopedia of Genes and Genomes (KEGG) pathways were enriched using the Database for Annotation, Visualization, and Integrated Discovery (DAVID, version 6.8) tool.20 A p value of <0.05 was selected to identify the significantly enriched results.
Construction of the Prognostic Score Model Based on Differentially Methylated Genes
The Survival package (version 2.41–1)21 in R3.6.1 was used to screen the prognosis-related DMGs by univariate Cox regression analysis, and then the independent prognostic DMGs were screened using multivariate Cox regression analysis. A p value of <0.05 in the Log rank test was selected to identify the significant results. The Penalized package22 (version 0.9–50) in R3.6.1 was used to screen the optimal prognostic gene signatures on the basis of the Cox proportional hazards (Cox-PH) model. The optimized parameter “lambda” in the Cox-PH model23 was obtained after performing 1000 rounds with the cross-validation likelihood method. Next, the optimal prognostic gene signatures were used to construct the PS model. The PS of each sample was calculated with the following formula:  , where coefDMGs represents the regression coefficient of the DMGs, and MethylationDMGs represents the methylation level of the DMGs. The samples were then categorized into high-risk and low-risk groups according to their median PS. Finally, Kaplan–Meier analysis was carried out to evaluate the associations between the model and the prognoses.
Screening of Independent Prognostic Clinical Factors
Univariate Cox regression analysis was used to screen the clinical factors associated with the disease prognosis, and multivariate Cox regression analysis was then applied to screen the independent prognostic clinical factors. Results with a p value of <0.05 in the Log rank test were considered significant. The samples were then categorized into different groups on the basis of the independent prognostic clinical factors, following which the prognostic model was evaluated by correlation analysis. Prognostic models based on the clinical factors and on the clinical factors combined with DMGs were also constructed and their predictive performances were compared using the area under the receiver operating characteristic (ROC) curve (AUC) and C-index values. The ROC curves were analyzed with the pROC24 package (version 1.14.0) in R3.6.1, whereas the C-index values were calculated using the survcomp25 package (version 1.34.0) in R3.6.1.
Real-Time Reverse Transcription–Polymerase Chain Reaction
Six COAD tissues and six paracancerous tissues were selected for the identification of their gene expression levels using the real-time reverse transcription–polymerase chain reaction (RT-qPCR). RNA was extracted from the tissues using RNAiso Plus (N8010560, Takara, Japan) and reversed transcribed to cDNA using the ReverTra Ace® qPCR RT Master Mix (FSQ-201, TOYOBO, Japan). The PCR mixture contained 5 μL of 2× PowerUp SYBR Green Master Mix (A25742, Thermo Fisher Scientific, USA), 4.6 μL of cDNA, 0.2 μL of forward primer, and 0.2 μL of reverse primer, and the reaction was carried out in a 7900HT Fast Real-Time PCR system (Applied Biosystems, USA). The primers used in this study are listed in Table S1. This study was approved by the Ethics Committee of the Fourth Affiliated Hospital of China Medical University (NO. EC-2021-HS-026) and conducted in accordance with the Declaration of Helsinki. All patients signed informed consent forms.
Results
Screening of DMGs and DEGs in the Training Set
In total, 1434 DEGs and 1038 DMGs between the COAD and normal samples were screened in the training set (Figure S2A–D). The heatmaps showed that both the DEGs and DMGs could be used to distinguish the tumor samples from the normal ones, suggesting the reliability of the results. Venn diagram analysis revealed that there were 284 overlapping genes between the DEGs and DMGs (Figure S2E). The expression and methylation levels of these genes were different between the COAD and normal samples.
Screening of Co-Methylated Genes Using WGCNA
In the WGCNA algorithm, the power value is the most important parameter influencing the average connectivity degree and the independence of the modules. An adjacency matrix was defined on the basis of preconditions for an approximate scale-free network distribution. Because the power value of the adjacency matrix was determined to be 7 when the square of the correlation coefficient was up to 0.9 (Figure 1A), this same power value was used to establish the co-methylation modules. In total, 11 modules were obtained using the following parameters: minSize = 150 and cutHeight = 0.995 (Figure 1B). We further determined the correlations between the modules and clinical factors. As shown in Figure 1C, the red module showed a significantly positive correlation with microsatellite instability (r = 0.44, p = 6 × 10–257) and disease status (r = 0.35, p = 8 × 10–157). There were also positive correlations between the green module and microsatellite instability (r = 0.46, p = 6 × 10–279). Additionally, the brown module was negatively correlated with Kirsten rat sarcoma viral oncogene (KRAS) mutations (r = –0.38, p = 4 × 10–184). We further mapped the DMGs onto modules obtained using the WGCNA algorithm. In total, 963 DMGs were common to the methylation site genes (Figure 1D and E and Table S2). In total, 521 DMGs were significantly enriched in four modules (black, blue, magenta, and red modules) with a fold enrichment value of >1.
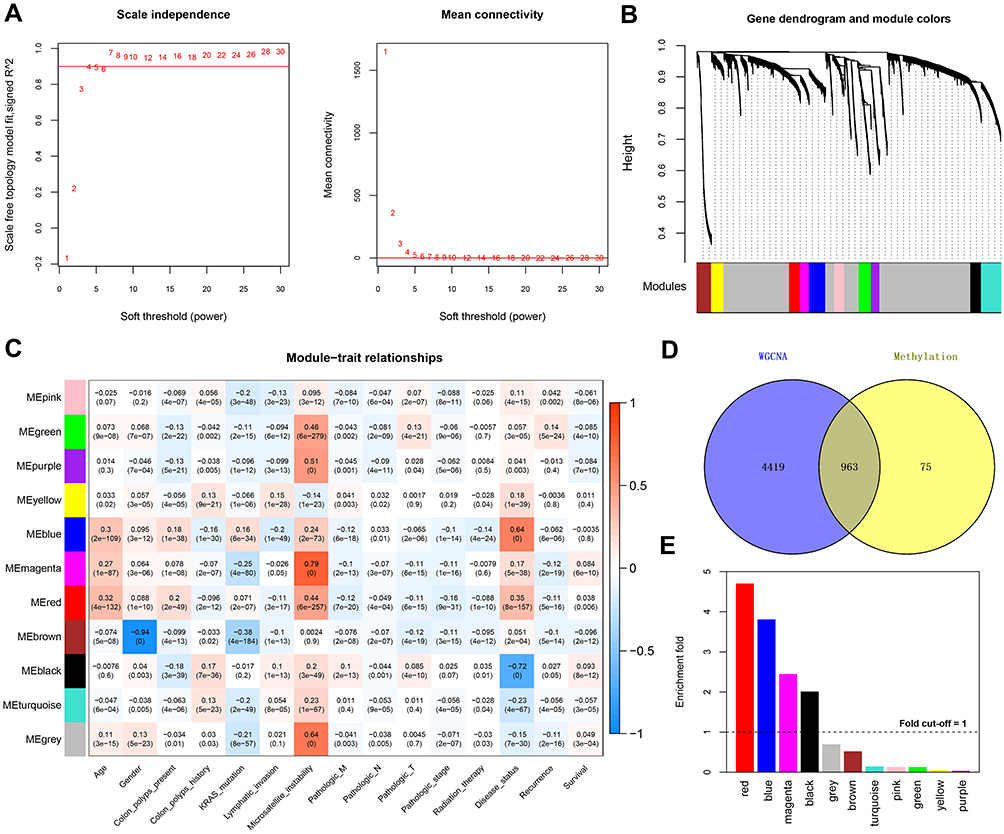 |
Figure 1 Co-methylation analysis using WGCNA. (A) Network topology for different soft-thresholding powers (left panel, the red line represents a scale-free fit index of 0.9) and mean connectivity values (right panel, the red line represents a mean connectivity of 1). (B) Clustering dendrograms of genes and module colors, in which 11 co-methylation modules with different colors were constructed. (C) Module–trait associations. Each row represents a module eigengene, and each column represents a clinical feature. Each cell contains the corresponding correlation coefficient and p value. (D) Venn plot of the differentially methylated genes (DMGs) in the WGCNA modules that overlapped with differentially expressed genes after DMG mapping to the WGCNA modules. (E) Histogram showing the enrichment-fold value of the different modules. |
Correlations Between Gene Methylation and Expression Levels
The 284 overlapping genes obtained from the Venn analysis of the DEGs and DMGs and the 521 DMGs obtained in the WGCNA co-methylation analysis were merged, whereupon 149 overlapping genes were obtained. We further calculated the correlations between the methylation and expression levels of these 149 genes and found significant negative correlations between the levels (p < 0.05) overall (Figure 2A). We then performed calculations for each of the 149 genes and found significant negative correlations between the methylation and expression levels in 127 genes. GO functional enrichment analysis of these 127 genes revealed them to being enriched in the Biological Processes terms, such as signal transduction, potassium ion transport, and cell−cell signaling. According to the KEGG pathway analysis, these genes were also enriched in pathways related to cell adhesion molecules, calcium signaling, PI3K−AKT signaling, and leukocyte transendothelial migration, among others (Figure 2B and C).
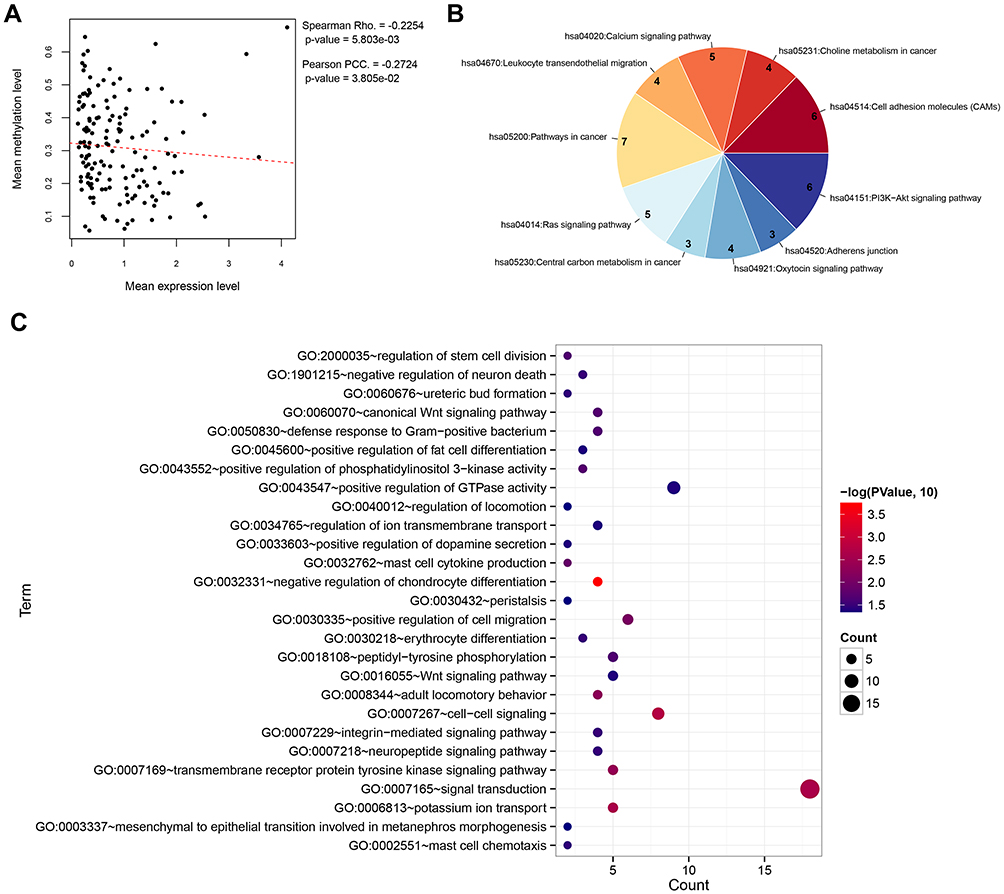 |
Figure 2 Correlation analysis and functional enrichment. (A) Correlation scatter plot showing the overall correlation between the methylation level and expression level. (B) Pie chart showing the significantly enriched KEGG pathways. (C) Bubble diagram showing the significantly enriched Gene Ontology biological processes. |
Construction of the Prognostic Score Model
Among the 142 samples in the training set, one sample had no corresponding prognostic data. Therefore, univariate Cox regression analysis was carried out using the other 141 samples to screen prognosis-related DMGs from the 127 DMGs. In total, 51 DMGs were found to be related to prognosis in COAD (Table S3). These 51 DMGs were further analyzed using multivariate Cox regression analysis, whereupon 24 independent prognostic DMGs were screened (Table S4). In order to use the least number of genes to produce the best prediction results, an optimal signature from 10 of these 24 independent prognostic DMGs was identified using the Cox-PH model (Table 2); namely, copine 8 (CPNE8), FGR proto-oncogene, Src family tyrosine kinase (FGR), frizzled class receptor 8 (FZD8), guanidinoacetate N-methyltransferase (GAMT), junctional adhesion molecule 2 (JAM2), proopiomelanocortin (POMC), PR/SET domain 6 (PRDM6), protein kinase AMP-activated catalytic subunit alpha 2 (PRKAA2), TAL bHLH transcription factor 1, erythroid differentiation factor (TAL1), and transmembrane inner ear (TMIE).
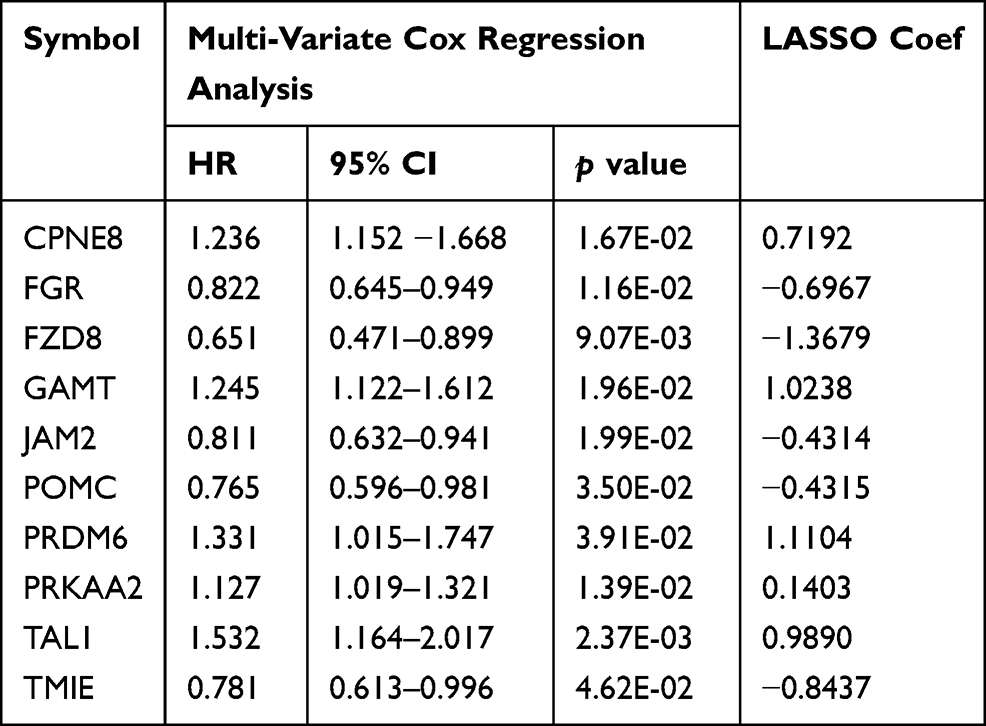 |
Table 2 The 10 Optimal DMGs Signatures Screened by Cox-PH Model |
The PS model was constructed on the basis of the least absolute shrinkage and selection operator (LASSO) coefficient and the methylation levels of the 10 optimal DMGs, and the PS was calculated for each sample. The samples were then categorized into high and low score groups according to their median PS. Patients with a high PS seemed to have worse outcomes than those with a low PS in the training set, validation set, and entire set (Figure 3A–C). Consistently, survival analyses of these three data sets showed that patients with a high PS were significantly associated with a worse survival ratio (Figure 3D–F). The ROC curves showed that the PS model had good predictive performance, with AUC values of 0.932, 0.816, and 0.890 in the training, validation, and entire set (Figure 3G), respectively, suggesting that reliable results were obtained.
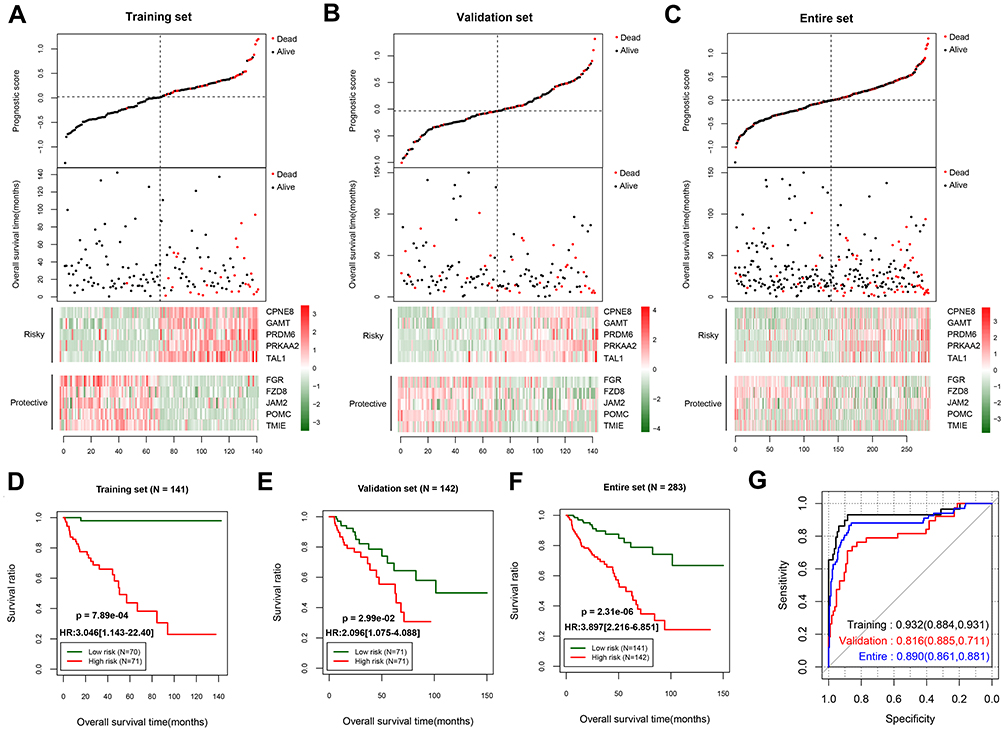 |
Figure 3 Predictive performance of the prognostic score model. Prognostic score distribution (upper panel), scatter plot of the overall survival time distribution of the samples (middle panel), and heatmaps of the methylation level patterns of the 10 differentially methylated genes with prognostic score changes (lower panel) in the training set (A), validation set (B), and entire set (C). Kaplan–Meier survival curves for patients with high and low prognostic scores in the training set (D), validation set (E), and entire set (F). (G) Receiver operating characteristic curves showing the predictive performance of the prognostic score model in the three data sets. |
Screening of Independent Prognostic Factors
Univariate Cox regression analysis was used to screen the clinical factors related to prognosis. The pathologic M (M0/M1), pathologic N (N0/N1/N2), pathologic T (T1/T2/T3/T4), pathologic stage (I/II/III/IV), lymphatic invasion, recurrence, and PS model status were the factors found to have an impact on prognosis. Next, those factors with statistical significance were analyzed using multivariate Cox regression analysis, with the results showing recurrence and the PS model status (high/low) as being independent prognostic factors in the training set, validation set, and entire set (Table 3). Moreover, in these three data sets, both the high and low PS model statuses had a higher hazard ratio than recurrence. As expected, in all three data sets, patients with tumor recurrence had poorer survival outcomes than those without recurrence. We further grouped the patients into those with and without tumor recurrence to evaluate the prognostic performance of the PS model. For all three data sets, patients with a high PS in the recurrence group were associated with a worse prognosis. Similarly, in the training set and entire set, patients with a high PS in the group without recurrence had poorer survival outcomes than those with a low PS. In the validation set, patients with a high PS in the group without recurrence also seemed to have poorer survival outcomes than patients with a low PS, but the differences were not statistically significant (Figure 4).
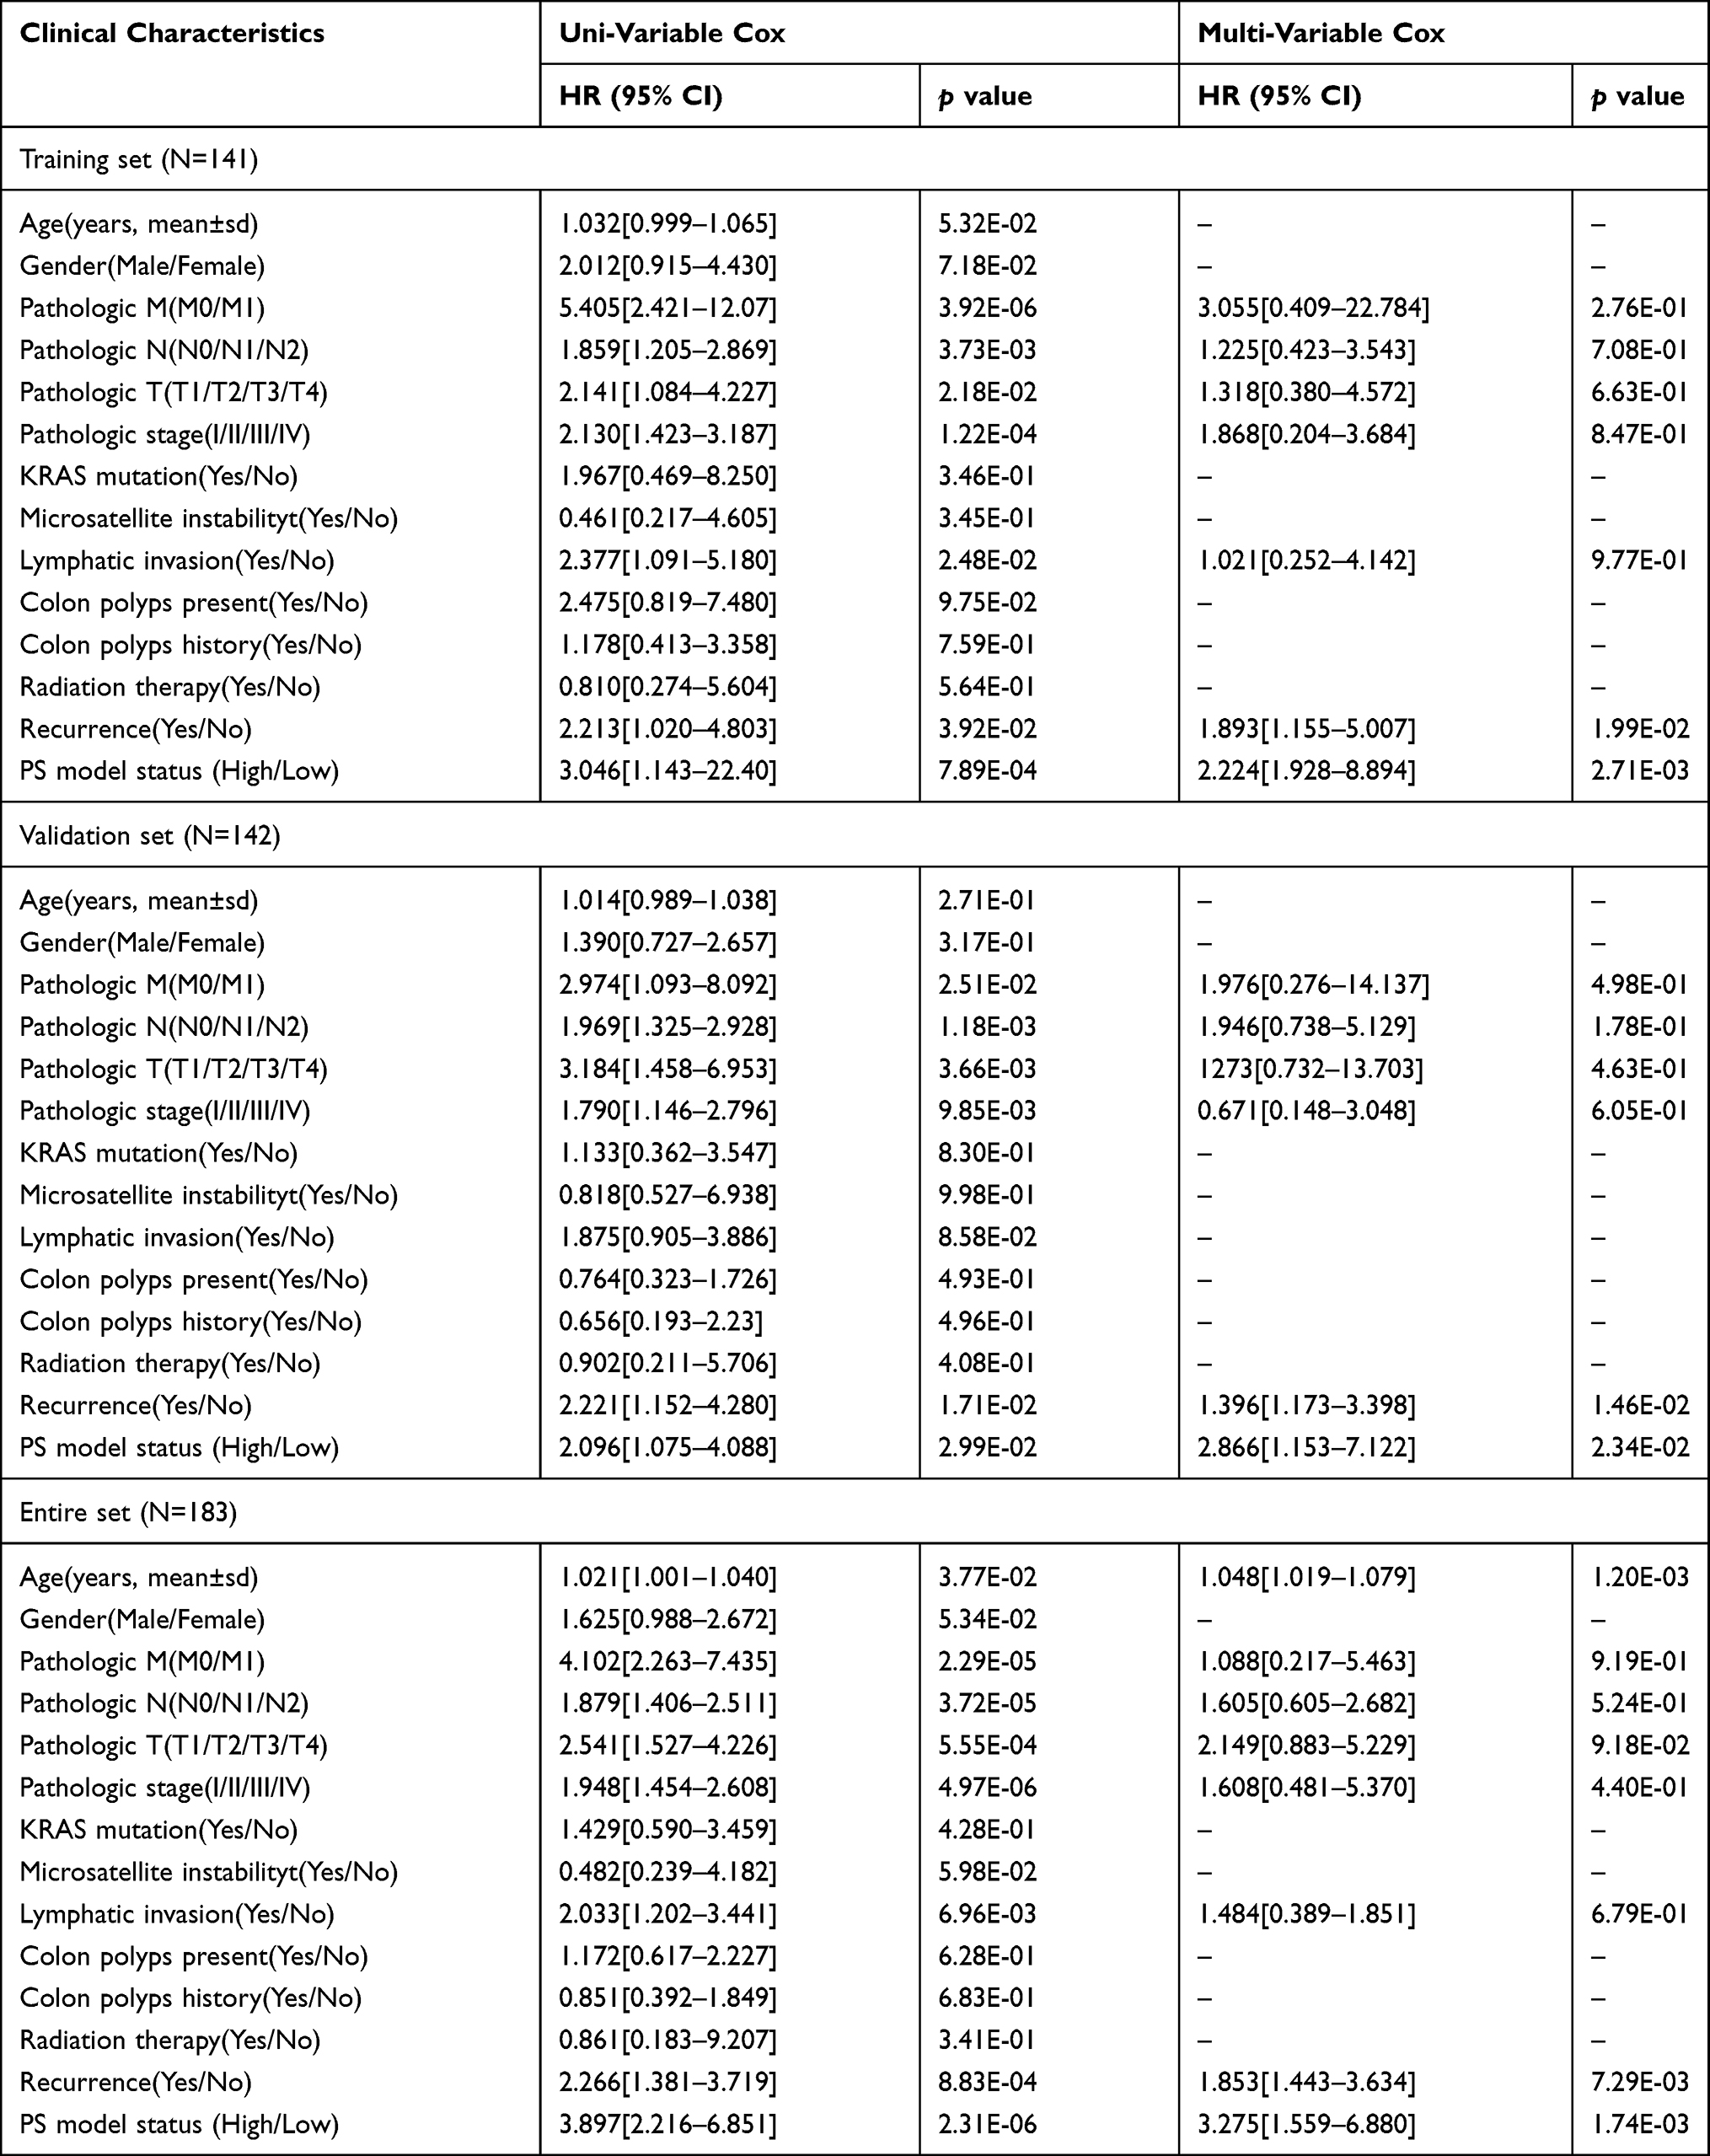 |
Table 3 Screening of Independent Prognostic Factors by Univariate and Multivariable Cox Regression Analysis |
 |
Figure 4 Survival analysis using recurrence as the independent prognostic factor. Kaplan–Meier survival curves for the training set (A), validation set (B), and entire data set (C). The left panel shows the survival status of patients with or without tumor recurrence in the three data sets; the middle panel shows the survival status of patients with a high or low prognostic score in the “recurrence” group; and the right panel shows the survival status of patients with a high or low prognostic score in the “without recurrence” group. |
Prognostic Performances of the Different Models
Considering the independent predictive value of recurrence, we also constructed a recurrence-based prognostic model for COAD. The ROC curve analysis showed that this model had limited predictive performance, with an AUC of 0.564 (0.569–0.823; p = 5.830E-02) and a C-index of 0.561. By contrast, the prognostic performance of the PS model was much better, with an AUC of 0.890 (0.861–0.881; p = 9.48E-10) and a C-index of 0.715. Furthermore, we constructed a combined model (ie, combining the recurrence score and PS), which the ROC curve analysis revealed to have the highest predictive performance (AUC = 0.912; 0.875–0.875; p = 3.14E-13) among the three prognostic models developed in this study (Table S5 and Figure 5).
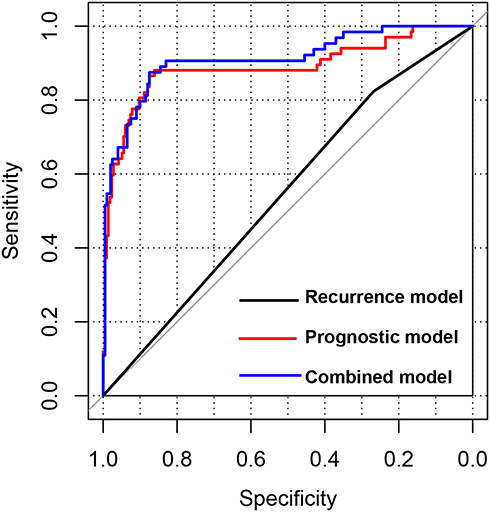 |
Figure 5 Receiver operating characteristic curves of different prognostic models. The curves show the predictive performances of the recurrence model, prognostic score model, and combined model (recurrence score and prognostic score combined). |
RT-qPCR Validation of the Results
The expression levels of the 10 optimal DMGs were evaluated using RT-qPCR. Except for the expression levels of FGR, FZD8, POMC, and TAL1, those of the other six genes were significantly lower in the tumor tissues than in the paracancerous tissues (p < 0.05) (Figure S3). Although the expression levels of FGR, FZD8, POMC, and TAL1 were also lower in the tumor tissues, the differences were not statistically significant (p > 0.05). The verification results were essentially consistent with the results of the bioinformatics analysis.
Discussion
With the development of medical technology, more studies have been carried out in recent years to elucidate the pathogenesis of COAD, the prognosis of which remains poor despite the great advancements in surgical treatments and drug therapies. Prognostic biomarkers could be a means by which to obtain feedback on the potential progression and recurrence of a disease or the survival outcomes, which would help in the stratification of the afflicted patients.26 An accurate prognosis has been shown to contribute to both the determination of healthcare decisions for patients and the development of individualized treatment strategies for patients with COAD.27,28
In this study, through the screening of gene expression and methylation data of COAD from TCGA database, combined with WGCNA, 127 genes were revealed to be differentially expressed and methylated between the COAD and normal samples and also showed a significant negative correlation between their methylation and expression levels, suggesting that the expression of these genes in COAD was regulated by their level of methylation. DNA methylation has been shown to alter various signaling pathways in the occurrence and development of COAD.29 For example, the accumulation of abnormal DNA sites in intestinal epithelial cells promotes the occurrence of COAD.30 It is well known that the overexpression of both JAK and STAT can promote the proliferative and invasive activities of tumor cells. In a study on gene methylation, abnormally methylated genes in COAD were found to be significantly enriched in the JAK–STAT signaling pathway.31 Additionally, the promoter methylation of Wnt target genes was proven to be a strong predictor of poor prognosis in patients with COAD.32 In our present study, enrichment analysis revealed that the 127 genes were mainly involved in pathways related to cell adhesion and cell migration, calcium signaling, and PI3K−AKT signaling. The altered expression of cell adhesion molecules has been demonstrated to be involved in the regulation of tumor cell migration and to promote the destruction of tissue cohesion, which is the central process during tumor progression.33 Calcium signaling has also been proven to play important roles in the development and progression of CRC. It has been suggested that a slightly elevated level of intracellular Ca2+ signaling could facilitate the occurrence and progression of CRC, whereas a sustained Ca2+ influx and a Ca2+ overload might lead to cancer cell death.34 Raynal et al revealed that targeting calcium signaling could reactivate tumor suppressor genes, which might be a novel cancer treatment strategy.35 Centuori et al found that deoxycholic acid could promote mitogen-activated protein kinase (MAPK) gene activation by regulating calcium signaling in colon cancer cells, which resulted in the continuous activation of the epidermal growth factor receptor (EGFR) gene, suggesting that this may be the mechanism underlying its role in the regulation of colon cancer progression.36 Hence, given that some of the 127 genes in our study were enriched in calcium signaling events, we speculate that these crucial genes are involved in the progression of COAD via these functional pathways.
Additionally, 24 of the 127 genes that had an independent prognostic value were screened, and a PS model was established on the basis of the optimal signature obtained from 10 of those genes (CPNE8, FGR, FZD8, GAMT, JAM2, POMC, PRDM6, PRKAA2, TAL1, and TMIE). The expression levels of these 10 genes were verified to be consistent with the results of the bioinformatics analysis. The expression of FZD8 has been found to be elevated in metastatic prostate cancer, with the high expression level being positively correlated with the tumor progression and metastasis.37 Chen et al showed that FZD8 could predict a worse prognosis in gastric cancer as well as facilitate tumor invasion and metastasis by regulating the beta-catenin pathway.38 GAMT, a p53 target, has been implicated in p53-dependent apoptosis and the regulation of ATP homeostasis, which might explain the metabolic features of tumor cell survival.39,40 As a junction adhesion molecule, JAM2 has been shown to be involved in tumor cell processes, with Lian et al suggesting that protein tyrosine phosphatase type IVA member 3 (PTP4A3) could facilitate colon cancer cell adhesion through its interaction with this molecule.41 POMC has been implicated in various cellular functions. Lin et al proposed that POMC could be a possible therapeutic target and used as a biomarker for predicting the outcome of breast cancer, given that its expression is a tumor-initiating feature.42 PRDM6, a transcriptional repressor, is involved in the inhibition of cell proliferation and survival.43 PRKAA2, also named adenosine monophosphate (AMP)-activated protein kinase (AMPK), regulates cellular energy balance, which has been found to be involved in tumor growth. The activation of AMPK has been demonstrated to inhibit colon cancer cell invasion44,45 and growth.46,47
The clinical prognosis of tumors is usually predicted through the histopathological evaluation of tumor tissue samples. However, recent studies have found that there may be significant differences in the clinical outcomes of patients at the same disease stage. The usual tumor pathologic T, N, and M staging provides limited information and cannot be used to predict the response to treatment.48 Some patients with advanced COAD can remain stable for many years, but recurrence, rapid tumor progression, and patient death are associated with approximately 20–25% of patients with TNM stage I/II disease.49 In this study, we found that the pathologic T, N, and M stages were not independent prognostic factors of COAD. In fact, the heterogeneity of the large number of samples that came from patients in different countries may also have affected the results of this study.
Compared with the recurrence model, the PS model based on the 10 genes had a better predictive performance, with high AUC and C-index values, and had an independent prognostic value in COAD. This model could be used to stratify patients with COAD into high and low PS groups, with different survival outcomes. Additionally, combining the PS model with clinical factors and tumor recurrence could further improve its predictive performance. To our best knowledge, there are not many published studies on the use of differential gene expression and methylation levels combined for predicting the prognosis of COAD. The prognosis prediction model constructed by Yin et al, which was based on more genes (13) than our PS model, had an AUC value of only 0.825, less than that of our model (0.912).50 However, the clinical value of our PS model should be further evaluated and confirmed in multicenter randomized controlled studies.
Conclusion
Through the screening of gene expression and methylation data of COAD from TCGA database, combined with WGCNA, crucial genes with differences at both the gene expression and methylation levels were found between the COAD and normal samples. These genes were involved in the progression of COAD via pathways related to cell adhesion molecules, cell migration, and calcium signaling. We established a PS model based on an optimal 10-gene signature and demonstrated that it had better predictive performance and independent prognostic value in COAD than other models. These findings should contribute to the improved assessment of the clinical outcomes of patients with COAD and the development of therapeutic strategies against the disease.
Data Sharing Statement
The gene expression, methylation, and clinical data can be downloaded from TCGA database. The RT-qPCR data are available from the authors upon request.
Acknowledgments
Gene expression, methylation, and clinical data were acquired from TCGA database.
Author Contributions
All authors made substantial contributions to conception and design, acquisition of data, or analysis and interpretation of data; took part in drafting the article or revising it critically for important intellectual content; agreed to submit to the current journal; gave final approval of the version to be published; and agree to be accountable for all aspects of the work.
Funding
There is no funding to report.
Disclosure
The authors report no conflicts of interest related to this work.
References
1. Dekker E, Tanis PJ, Vleugels JLA, Kasi PM, Wallace MB. Colorectal cancer. Lancet. 2019;394(10207):1467–1480. doi:10.1016/S0140-6736(19)32319-0
2. Paschke S, Jafarov S, Staib L. Are colon and rectal cancer two different tumor entities? A proposal to abandon the term colorectal cancer. Int J Mol Sci. 2018;19(9):2577–2590. doi:10.3390/ijms19092577
3. Buchwald P, Hall C, Davidson C, et al. Improved survival for rectal cancer compared to colon cancer: the four cohort study. ANZ J Surg. 2018;88(3):E114–e117. doi:10.1111/ans.13730
4. Arnold M, Sierra MS, Laversanne M, Soerjomataram I, Jemal A, Bray F. Global patterns and trends in colorectal cancer incidence and mortality. Gut. 2017;66(4):683–691. doi:10.1136/gutjnl-2015-310912
5. Dienstmann R, Salazar R, Tabernero J. Personalizing colon cancer adjuvant therapy: selecting optimal treatments for individual patients. J Clin Oncol. 2015;33(16):1787–1796. doi:10.1200/JCO.2014.60.0213
6. Zhou R, Zhang J, Zeng D, et al. Immune cell infiltration as a biomarker for the diagnosis and prognosis of stage I–III colon cancer. Cancer Immunol Immunother. 2019;68(3):433–442.
7. Xu G, Zhang M, Zhu H, Xu J. A 15-gene signature for prediction of colon cancer recurrence and prognosis based on SVM. Gene. 2017;604:33–40. doi:10.1016/j.gene.2016.12.016
8. Yang H, Liu H, Lin HC, et al. Association of a novel seven-gene expression signature with the disease prognosis in colon cancer patients. Aging. 2019;11(19):8710–8727. doi:10.18632/aging.102365
9. Galamb O, Kalmár A, Péterfia B, et al. Aberrant DNA methylation of WNT pathway genes in the development and progression of CIMP-negative colorectal cancer. Epigenetics. 2016;11(8):588–602. doi:10.1080/15592294.2016.1190894
10. Molnár B, Galamb O, Péterfia B, et al. Gene promoter and exon DNA methylation changes in colon cancer development - mRNA expression and tumor mutation alterations. BMC Cancer. 2018;18(1):695. doi:10.1186/s12885-018-4609-x
11. Yang C, Zhang Y, Xu X, Li W. Molecular subtypes based on DNA methylation predict prognosis in colon adenocarcinoma patients. Aging. 2019;11(24):11880–11892. doi:10.18632/aging.102492
12. Liu T, Li C, Jin L, Li C, Wang L. The prognostic value of m6A RNA methylation regulators in colon adenocarcinoma. Med Sci Monit. 2019;25:9435–9445.
13. Zhao QQ, Jiang C, Gao Q, et al. Gene expression and methylation profiles identified CXCL3 and CXCL8 as key genes for diagnosis and prognosis of colon adenocarcinoma. J Cell Physiol. 2020;235(5):4902–4912. doi:10.1002/jcp.29368
14. Ritchie ME, Phipson B, Wu D, et al. limma powers differential expression analyses for RNA-sequencing and microarray studies. Nucleic Acids Res. 2015;43(7):e47. doi:10.1093/nar/gkv007
15. Eisen MB, Spellman PT, Brown PO, Botstein D. Cluster analysis and display of genome-wide expression patterns. P Natl Acad Sci USA. 1998;95(25):14863–14868. doi:10.1073/pnas.95.25.14863
16. Wang L, Cao C, Ma Q, et al. RNA-seq analyses of multiple meristems of soybean: novel and alternative transcripts, evolutionary and functional implications. BMC Plant Biol. 2014;14:169. doi:10.1186/1471-2229-14-169
17. Langfelder P, Horvath S. WGCNA: an R package for weighted correlation network analysis. BMC Bioinform. 2008;9:559. doi:10.1186/1471-2105-9-559
18. Cao J, Zhang SA. Bayesian extension of the hypergeometric test for functional enrichment analysis. Biometrics. 2014;70(1):84–94. doi:10.1111/biom.12122
19. Zou KH, Tuncali K, Silverman SG. Correlation and simple linear regression. Radiology. 2003;227(3):617–622. doi:10.1148/radiol.2273011499
20. Huang da W, Sherman BT, Lempicki RA. Systematic and integrative analysis of large gene lists using DAVID bioinformatics resources. Nat Protoc. 2009;4(1):44–57. doi:10.1038/nprot.2008.211
21. Wang P, Wang Y, Hang B, Zou X, Mao JH. A novel gene expression-based prognostic scoring system to predict survival in gastric cancer. Oncotarget. 2016;7(34):55343–55351. doi:10.18632/oncotarget.10533
22. Wang D, Wu TT, Zhao Y. Penalized empirical likelihood for the sparse cox regression model. J Stat Plan Infer. 2019;201:71–85. doi:10.1016/j.jspi.2018.12.001
23. Tibshirani R. The lasso method for variable selection in the cox model. Stat Med. 1997;16(4):385–395. doi:10.1002/(SICI)1097-0258(19970228)16:4<385::AID-SIM380>3.0.CO;2-3
24. Robin X, Turck N, Hainard A, et al. pROC: an open-source package for R and S+ to analyze and compare ROC curves. BMC Bioinform. 2011;12:77. doi:10.1186/1471-2105-12-77
25. Shan S, Chen W, Jia JD. Transcriptome analysis revealed a highly connected gene module associated with cirrhosis to hepatocellular carcinoma development. Front Genet. 2019;10:305. doi:10.1007/s00262-018-2289-7
26. Costa-Pinheiro P, Montezuma D, Henrique R, Jerónimo C. Diagnostic and prognostic epigenetic biomarkers in cancer. Epigenomics. 2015;7(6):1003–1015. doi:10.2217/epi.15.56
27. Sauerbrei W, Taube SE, McShane LM, Cavenagh MM, Altman DG. Reporting Recommendations for Tumor Marker Prognostic Studies (REMARK): an abridged explanation and elaboration. J Natl Cancer Inst. 2018;110(8):803–811. doi:10.1093/jnci/djy088
28. Das V, Kalita J, Pal M. Predictive and prognostic biomarkers in colorectal cancer: a systematic review of recent advances and challenges. Biomed Pharmacother. 2017;87:8–19. doi:10.1016/j.biopha.2016.12.064
29. Hong SN. Genetic and epigenetic alterations of colorectal cancer. Intest Res. 2018;16(3):327–337. doi:10.5217/ir.2018.16.3.327
30. Ewing I, Hurley JJ, Josephides E, Millar A. The molecular genetics of colorectal cancer. Frontline Gastroenterol. 2014;5(1):26–30. doi:10.1136/flgastro-2013-100329
31. Wang Y, Zhang M, Hu X, Qin W, Wu H, Wei M. Colon cancer-specific diagnostic and prognostic biomarkers based on genome-wide abnormal DNA methylation. Aging. 2020;12(22):22626–22655. doi:10.18632/aging.103874
32. de Sousa EMF, Colak S, Buikhuisen J, et al. Methylation of cancer-stem-cell-associated Wnt target genes predicts poor prognosis in colorectal cancer patients. Cell Stem Cell. 2011;9(5):476–485. doi:10.1016/j.stem.2011.10.008
33. Moh MC, Shen S. The roles of cell adhesion molecules in tumor suppression and cell migration: a new paradox. Cell Adh Migr. 2009;3(4):334–336. doi:10.4161/cam.3.4.9246
34. Wang W, Yu S, Huang S, et al. A complex role for calcium signaling in colorectal cancer development and progression. Mol Cancer Res. 2019;17(11):2145–2153. doi:10.1158/1541-7786.MCR-19-0429
35. Raynal NJ, Lee JT, Wang Y, et al. Targeting calcium signaling induces epigenetic reactivation of tumor suppressor genes in cancer. Cancer Res. 2016;76(6):1494–1505. doi:10.1158/0008-5472.CAN-14-2391
36. Centuori SM, Gomes CJ, Trujillo J, et al. Deoxycholic acid mediates non-canonical EGFR-MAPK activation through the induction of calcium signaling in colon cancer cells. BBA-Biomembranes. 2016;1861(7):663–670. doi:10.1016/j.bbalip.2016.04.006
37. Li Q, Ye L, Zhang X, et al. FZD8, a target of p53, promotes bone metastasis in prostate cancer by activating canonical Wnt/β-catenin signaling. Cancer Lett. 2017;402:166–176. doi:10.1016/j.canlet.2017.05.029
38. Chen W, Liu Z, Mai W, Xiao Y, You X, Qin L. FZD8 indicates a poor prognosis and promotes gastric cancer invasion and metastasis via B-catenin signaling pathway. Ann Clin Lab Sci. 2020;50(1):13–23.
39. Ide T, Chu K, Aaronson SA, Lee SW. GAMT joins the p53 network: branching into metabolism. Cell Cycle. 2010;9(9):1706–1710. doi:10.4161/cc.9.9.11473
40. Ide T, Brown-Endres L, Chu K, et al. GAMT, a p53-inducible modulator of apoptosis, is critical for the adaptive response to nutrient stress. Mol Cell. 2009;36(3):379–392. doi:10.1016/j.molcel.2009.09.031
41. Lian S, Meng L, Xing X, Yang Y, Qu L, Shou C. PRL-3 promotes cell adhesion by interacting with JAM2 in colon cancer. Oncol Lett. 2016;12(3):1661–1666. doi:10.3892/ol.2016.4836
42. Lin X, Chen W, Wei F, Zhou BP, Hung MC, Xie X. POMC maintains tumor-initiating properties of tumor tissue-derived long-term-cultured breast cancer stem cells. Int J Cancer. 2017;140(11):2517–2525. doi:10.1002/ijc.30658
43. Davis CA, Haberland M, Arnold MA, et al. PRISM/PRDM6, a transcriptional repressor that promotes the proliferative gene program in smooth muscle cells. Mol Cell Biol. 2006;26(7):2626–2636. doi:10.1128/MCB.26.7.2626-2636.2006
44. Qiao L, Zheng J, Jin X, et al. Ginkgolic acid inhibits the invasiveness of colon cancer cells through AMPK activation. Oncol Lett. 2017;14(5):5831–5838. doi:10.3892/ol.2017.6967
45. Tong W, Wang Q, Sun D, Suo J. Curcumin suppresses colon cancer cell invasion via AMPK-induced inhibition of NF-κB, uPA activator and MMP9. Oncol Lett. 2016;12(5):4139–4146. doi:10.3892/ol.2016.5148
46. Liu J, Long S, Wang H, et al. Blocking AMPK/ULK1-dependent autophagy promoted apoptosis and suppressed colon cancer growth. Cancer Cell Int. 2019;19:336. doi:10.1186/s12935-019-1054-0
47. Yagi T, Kubota E, Koyama H, et al. Glucagon promotes colon cancer cell growth via regulating AMPK and MAPK pathways. Oncotarget. 2018;9(12):10650–10664. doi:10.18632/oncotarget.24367
48. Galon J, Pagès F, Marincola FM, et al. Cancer classification using the immunoscore: a worldwide task force. J Transl Med. 2012;10:205. doi:10.1186/1479-5876-10-205
49. Mlecnik B, Bindea G, Pagès F, Galon J. Tumor immunosurveillance in human cancers. Cancer Metastasis Rev. 2011;30(1):5–12. doi:10.1007/s10555-011-9270-7
50. Yin Z, Yan X, Wang Q, et al. Detecting prognosis risk biomarkers for colon cancer through multi-omics-based prognostic analysis and target regulation simulation modeling. Front Genet. 2020;11:524. doi:10.3389/fgene.2020.00524
 © 2021 The Author(s). This work is published and licensed by Dove Medical Press Limited. The
full terms of this license are available at https://www.dovepress.com/terms
and incorporate the Creative Commons Attribution
- Non Commercial (unported, 3.0) License.
By accessing the work you hereby accept the Terms. Non-commercial uses of the work are permitted
without any further permission from Dove Medical Press Limited, provided the work is properly
attributed. For permission for commercial use of this work, please see paragraphs 4.2 and 5 of our Terms.
© 2021 The Author(s). This work is published and licensed by Dove Medical Press Limited. The
full terms of this license are available at https://www.dovepress.com/terms
and incorporate the Creative Commons Attribution
- Non Commercial (unported, 3.0) License.
By accessing the work you hereby accept the Terms. Non-commercial uses of the work are permitted
without any further permission from Dove Medical Press Limited, provided the work is properly
attributed. For permission for commercial use of this work, please see paragraphs 4.2 and 5 of our Terms.