Back to Journals » International Journal of General Medicine » Volume 19
Prognostic Models for Small Hepatocellular Carcinoma Using Inflammatory Indices and Machine Learning: A Propensity Score-Matched Study
Authors Cong Y, Gou Y ![]() , Ma Z, Huang W, Zhang L
, Ma Z, Huang W, Zhang L ![]() , Guo Q, Aji T
, Guo Q, Aji T ![]() , Shao Y
, Shao Y ![]()
Received 3 March 2026
Accepted for publication 28 May 2026
Published 5 June 2026 Volume 2026:19 584395
DOI https://doi.org/10.2147/IJGM.S584395
Checked for plagiarism Yes
Review by Single anonymous peer review
Peer reviewer comments 2
Editor who approved publication: Professor Hyam Leffert
Yun Cong,1,* Yi Gou,2,* Ziwei Ma,1 Wei Huang,1 Lifeng Zhang,1 Qiang Guo,1 Tuerganaili Aji,1 Yingmei Shao1
1Hepatobiliary & Hydatid Disease Department, Digestive & Vascular Surgery Center, First Affiliated Hospital of Xinjiang Medical University, State Key Laboratory of Pathogenesis, Prevention and Treatment of High Incidence Diseases in Central Asia, Urumqi, People’s Republic of China; 2Emergency Trauma Center, The First Affiliated Hospital of Xinjiang Medical University, Urumqi, People’s Republic of China
*These authors contributed equally to this work
Correspondence: Yingmei Shao, Email [email protected] Tuerganaili Aji, Email [email protected]
Background: The prognosis for patients with small hepatocellular carcinoma (HCC) after curative resection is variable. Early recurrence (within 2 years) remains a significant clinical challenge, closely associated with poor long-term outcomes. Although inflammatory biomarkers have shown prognostic value, integrated models for predicting both early recurrence and long-term survival are lacking. This study developed and validated prognostic models for overall survival (OS) and recurrence-free survival (RFS) in HCC patients post-resection, employing propensity score matching (PSM) to control for confounders between small (≤ 3 cm) and non-small HCC, with an emphasis on assessing model performance within the small HCC subgroup.
Methods: A retrospective analysis of HCC patients who underwent hepatectomy was performed. PSM (1:1 nearest-neighbor with replacement) was applied to balance baseline characteristics between small and non-small HCC groups. After matching, a balanced cohort was used for survival analysis. Independent prognostic factors were identified through Cox regression. A traditional nomogram and risk score models were developed and compared against three machine learning models (LASSO-Cox, Random Forest, XGBoost) using time-dependent AUC.
Results: Following PSM, 165 patients (90 with small HCC and 75 with non-small HCC) were included. Small HCC patients demonstrated significantly better OS and RFS (both p < 0.01). Multivariate analysis identified tumor size, SII, and AAR as independent predictors for OS, and tumor size, PAR, NLR, and GPR for RFS. The LASSO-Cox model exhibited the best overall performance, achieving the highest accuracy for early recurrence (2-year RFS AUC = 0.727) and competitive accuracy for long-term survival (5-year OS AUC = 0.698). The nomogram retained good interpretability (5-year OS AUC = 0.691).
Conclusion: This study establishes a comprehensive prognostic framework for small HCC, integrating tumor size with systemic inflammation (SII, NLR), liver function (AAR, GPR), and nutritional-coagulation status (PAR). The LASSO-Cox model is recommended for predicting both early recurrence and long-term survival, offering refined risk stratification to guide postoperative management.
Keywords: small hepatocellular carcinoma, prognostic model, machine learning, propensity score matching, inflammatory indices
Introduction
Hepatocellular carcinoma (HCC) is a significant global health burden, with rising incidence rates worldwide.1 Despite advancements in early detection and treatment, patient outcomes remain heterogeneous, emphasizing the urgent need for improved risk prediction. Surgical resection offers a potential cure for early-stage HCC, particularly small solitary tumors (≤ 3 cm), with studies reporting favorable 5-year survival rates (82.5% for tumors < 2 cm and 66.3% for those 2–3 cm).2 However, high postoperative recurrence rates (30–40% within 5 years) pose a substantial threat to long-term survival, highlighting the critical need for reliable prognostic indicators.
Inflammation plays a pivotal role in cancer progression.3 Routine blood-based indices, including NLR, PLR, and SII, have demonstrated prognostic significance in HCC. Postoperative recurrence can be classified into two distinct categories: early (≤2 years) and late (> 2 years).4 Early recurrence is typically linked to more aggressive tumor biology and signifies a notably poorer prognosis, making its accurate prediction a clinical priority.5 Mechanistically, early recurrence is often driven by occult microvascular invasion (MVI), residual micrometastases, and a pro-inflammatory tumor microenvironment that promotes immune evasion and tumor cell dissemination.6–8 These biological characteristics highlight the potential of inflammatory biomarkers as non-invasive surrogates for tumor aggressiveness. However, comprehensive prognostic models integrating multi-dimensional inflammatory profiles for predicting early recurrence in resected small HCC patients remain scarce. Furthermore, the comparative efficacy of traditional statistical methods versus advanced machine learning algorithms in optimizing early recurrence prediction remains underexplored.
Recent bioinformatics studies have increasingly leveraged machine learning to identify prognostic signatures in HCC. For instance, He et al9 employed LASSO Cox regression to develop a predictive model for the progression from NAFLD to HCC, pinpointing CDT1 as a key gene. Similarly, Gudivada and Amajala10 integrated gene implicated and protein-protein interaction networks to identify 20 hub genes involved in HCC progression, many of which are associated with cell cycle and DNA replication pathways. In addition to protein-coding genes, non-coding RNAs also play vital roles. Xu et al11 demonstrated that miR-3130-5p enhances HCC growth by inhibiting FDX1, a regulator of cuproptosis. Furthermore, Vav1 protein has been identified as an independent prognostic factor for HCC, with its higher expression linked to poor differentiation, advanced TNM stage, and shorter overall survival (OS).12 These studies highlight the utility of integrating multi-omics and machine learning for HCC prognosis; however, few have focused on small HCC or compared traditional nomograms with advanced algorithms for early recurrence prediction.
This study, therefore, aimed to develop and validate integrated prognostic models for OS and RFS in patients undergoing curative resection for HCC, using PSM to balance confounders between small (≤ 3 cm) and non-small HCC. Prognostic models were constructed for the matched cohort, with specific evaluation of their predictive performance in the small HCC subgroup, particularly for early recurrence. The performance of a traditional nomogram was compared with that of several machine learning algorithms (LASSO-Cox, Random Forest, XGBoost) to identify the most effective predictive tool for individualized risk assessment, with an emphasis on early recurrence, to inform postoperative management.
Methods
A retrospective analysis was conducted on 381 HCC patients who underwent curative liver resection at the First Affiliated Hospital of Xinjiang Medical University between January 2015 and December 2025, with diagnosis confirmed by pathology.
Inclusion criteria were as follows: (1) Patients meeting the diagnostic criteria in the Primary Liver Cancer Diagnosis and Treatment Guidelines (2024 Edition),13 with postoperative pathology confirming HCC; (2) Patients who underwent curative resection with histopathologically confirmed negative surgical margins (R0 resection); (3) Patients with complete clinical and follow-up data; (4) Patients exhibiting good compliance, completing scheduled follow-up examinations on time. Exclusion criteria were as follows: (1) Patients who died during the perioperative period due to severe complications involving the heart, lungs, brain, kidneys, or other organs, or from infection/hemorrhage; (2) Patients with Barcelona Clinic Liver Cancer (BCLC) stage C or D; (3) Patients with Child-Pugh class C liver function; (4) Patients with a history of other malignancies; (5) Patients with autoimmune diseases, hematological disorders, etc; (6) Patients who underwent liver transplantation. All patients provided informed consent, and the study protocol was approved by the Ethics Committee of The First Affiliated Hospital of Xinjiang Medical University (Approval No. K202511-05). (Figure 1).
 |
Figure 1 Flow diagram of study treatments. |
Data
General Clinical Data (Preoperative)
- Demographic Data: Age, Gender, Body Mass Index (BMI); (2) Etiology: Hepatitis B Virus (HBV) infection, Hepatitis C Virus (HCV) infection; (3) Liver Function-Related Indicators: History of Liver Cirrhosis, Fatty Liver, Child-Pugh Class, Total Bilirubin (TBIL), Albumin (ALB), Aspartate Aminotransferase (AST), Alanine Aminotransferase (ALT), Lactate Dehydrogenase (LDH), Gamma-Glutamyl Transferase (GGT), Alkaline Phosphatase (ALP), Platelet-Albumin-Bilirubin Index (PALBI); (4) Laboratory Parameters: Hemoglobin (HB), Neutrophil Count (NEUT), Lymphocyte Count (LYM), Platelet Count (PLT), NLR, PLR, Prothrombin Time (PT), Prothrombin Activity (PTA), International Normalized Ratio (INR), Prognostic Nutritional Index (PNI), SII, AST to Platelet Ratio Index (APRI), Fibrosis-4 Index (FIB-4), PAR, Lymphocyte-to-Albumin Ratio (LAR), Albumin-to-Lymphocyte Ratio (ALR), Neutrophil-to-Albumin Ratio (NAR), AAR, GPR, Neutrophil-to-Lymphocyte Ratio (NrLR).
Tumor Characteristics and Perioperative Clinical Data
(1) Tumor Information: Tumor Size, Alpha-fetoprotein (AFP), MVI, BCLC Stage, Degree of Differentiation; (2) Surgical Data: Laparoscopic Hepatectomy, Intraoperative Blood Loss, Surgical Time.
Follow-Up
All participants were followed up through outpatient visits. Routine reexaminations included liver function tests, AFP, abdominal ultrasound, and enhanced computed tomography (CT) or magnetic resonance imaging (MRI). OS was defined as the time in months from the date of surgery to death or the last follow-up. The follow-up ended in December 2025 for this cohort.
Statistical Analysis
Statistical analyses were performed using R (version 4.5.1), with random seeds applied to key stochastic processes to ensure reproducibility. Missing data were addressed through Multiple Imputation by Chained Equations (MICE). Prior to imputation, variables containing special characters were standardized, and all variables were assigned appropriate types (continuous variables as numeric, categorical variables as factors). MICE was implemented with 10 imputations and 20 iterations, using predictive mean matching for continuous variables and logistic regression (binary/multinomial) for categorical variables. The predictor matrix was automatically generated with the quickpred () function, excluding patient ID variables and retaining predictors with a minimum correlation of 0.1. A threshold of 0.1 was selected to retain variables with at least a weak linear relationship to the incomplete variables, ensuring sufficient predictive information for imputation while excluding irrelevant predictors. This threshold is widely used in the MICE literature to balance imputation quality and computational efficiency.
To control for confounding bias, 1:1 nearest-neighbor propensity score matching (PSM) with replacement and a caliper width of 0.20 was applied to balance baseline characteristics. Matching with replacement allows each non-small HCC patient to be matched multiple times, maximizing the number of small HCC patients retained and reducing bias from incomplete matching.14 While this approach may increase the variance of the estimates, it was preferred in this study to preserve statistical power in the smaller group. The matched cohort, which balanced confounders between small and non-small HCC, was used to develop prognostic models. This balanced design facilitated an unbiased assessment of predictor effects across the tumor size spectrum, with model The performance specifically evaluated in the small HCC subgroup to ensure clinical relevance.
Data distribution was assessed using the Shapiro–Wilk test. Continuous variables with a normal distribution were expressed as mean ± SD and analyzed using Student’s t-test, while non-normally distributed data were presented as median (IQR) and compared using the Mann–Whitney U-test. Categorical data were presented as counts and/or percentages and compared using the chi-square (χ2) test. Survival curves were generated based on the matched dataset using the Kaplan-Meier method, and differences between groups were assessed with the Log rank test.
To address multicollinearity, Pearson correlation analysis was first conducted on continuous variables, excluding those with a correlation coefficient |r| > 0.8. Prognostic factor screening was performed in two steps: univariate Cox proportional hazards regression was initially used to identify candidate predictors (P < 0.05), followed by multivariate Cox regression to avoid overfitting. Variables were selected based on the Events Per Variable (EPV) criterion and the strength of association observed in univariate analysis. Bidirectional stepwise regression was subsequently applied to identify independent prognostic factors. Based on the final multivariate Cox model, a risk score formula and prognostic nomogram were developed. The discriminative ability of the model was evaluated through time-dependent ROC curve analysis.
The predictive performance of the nomogram was compared with that of several machine learning models, including Lasso-Cox, Random Forest, and XGBoost. Hyperparameter settings were as follows: For LASSO-Cox regression, the optimal regularization parameter λ was determined through 10-fold cross-validation using the glmnet package. The Random Survival Forest model was built with 100 trees and the log-rank splitting rule (randomForestSRC), with predictive performance evaluated using out-of-bag (OOB) estimates. The XGBoost model was trained with a Cox proportional hazards objective (survival:cox), a maximum tree depth of 3, a learning rate (eta) of 0.1, and 50 boosting rounds (xgboost package). The XGBoost model was trained with a Cox proportional hazards objective (survival:cox). Hyperparameters were tuned using grid search with 5-fold cross-validation, evaluating eta ∈ {0.01, 0.05, 0.1}, max_depth ∈ {2, 3, 4}, and nrounds ∈ {50, 100}. The optimal parameters were: for OS – eta = 0.1, max_depth = 2, nrounds = 39; for RFS – eta = 0.05, max_depth = 3, nrounds = 1. Predictive performance was quantified using time-dependent AUC, calculated with the timeROC package using inverse probability of censoring weighting to account for censored data. Censoring weights were estimated with the Kaplan–Meier method, as implemented in the timeROC package, assuming independent censoring. All stochastic processes were fixed with random seeds to ensure reproducibility. Specifically, set.seed (123) was used for random forest training and XGBoost hyperparameter tuning, and set.seed (2025) for the 10-fold cross-validation of LASSO-Cox and XGBoost models. To prevent overfitting and enhance generalizability, 10-fold cross-validation was performed for both LASSO-Cox and XGBoost models. The time-dependent AUCs for LASSO-Cox and XGBoost represent cross-validated averages, while for the nomogram, the training-set AUC is reported, and for the random forest, the OOB AUC is reported.
Results
During data preprocessing, variables containing special characters (“<”) were cleaned, and 15 categorical variables—including Child‑Pugh grade and BCLC stage—were converted to the factor type. Missing values for certain laboratory indicators (AFP, LDH) were addressed through multiple imputation, resulting in a complete dataset encompassing all 222 patients (Supplementary Figure S1). All subsequent analyses were performed using this finalized dataset.
A total of 222 patients were enrolled in the study, with 90 in the small HCC group and 132 in the non-small HCC group (Table 1). To control for potential confounding bias, 1:1 nearest-neighbor PSM with replacement and a caliper width of 0.20 was applied to balance baseline characteristics between the two groups. After matching, the final cohort comprised 165 patients (90 small HCC and 75 non-small HCC). Evaluation of matching effectiveness revealed a significant reduction in the absolute standardized mean differences (SMD) for all nine covariates. The SMD for fatty liver decreased from 0.254 to <0.001, and the SMDs for history of liver cirrhosis and HBV infection decreased from 0.363 and 0.372 to 0.080 and 0.110, respectively. Post-matching, the SMD for all variables was <0.4, with 7 out of 9 (77.8%) variables showing an SMD <0.2, indicating that the baseline characteristics between the groups were well balanced. Following matching, differences in key prognostic factors, such as age, HBV infection, and history of liver cirrhosis, were no longer significant, providing a more reliable foundation for subsequent survival analyses.
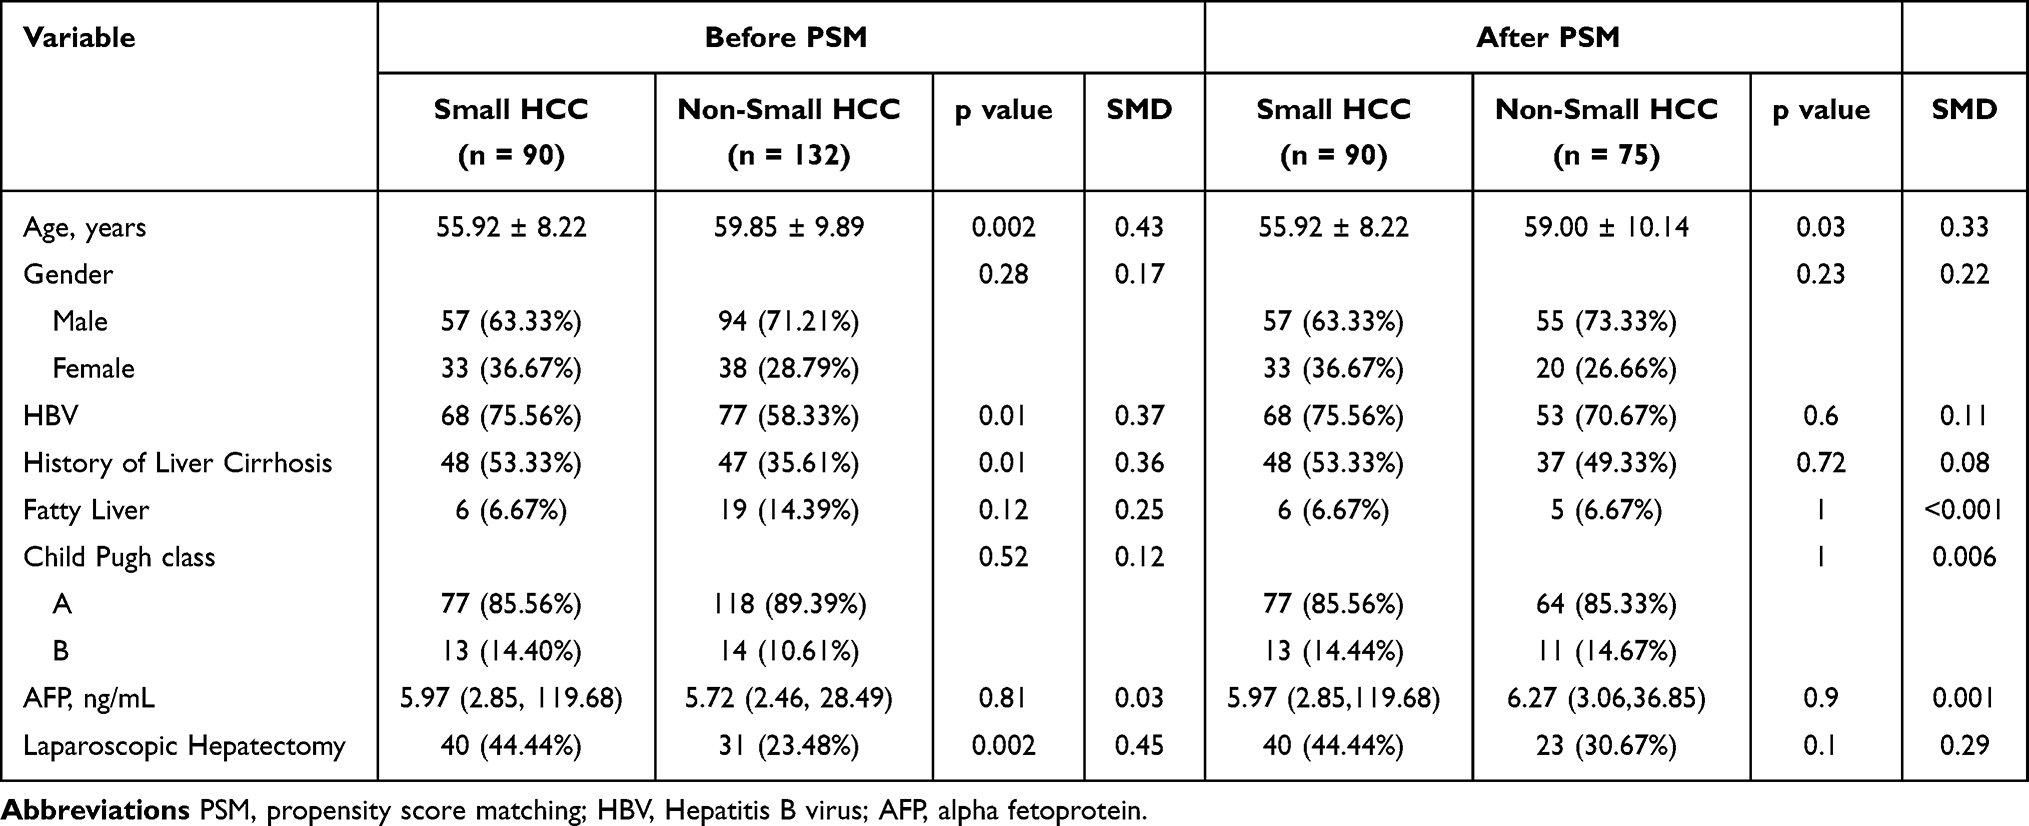 |
Table 1 Baseline Characteristics of the HCC Patients Before and After PSM |
Compared to non-small HCC patients, those with small HCC displayed a distinct laboratory indicator profile (Table 2). Key characteristics included lower levels of systemic inflammation, as evidenced by reduced NEUT, PLT, PLR, SII, and NAR, as well as milder liver - and cholestasis-related enzymatic changes, reflected by lower GGT and ALP levels. Notably, even after adjusting for major confounders such as age and etiology through PSM, most differences in inflammatory and immune indicators persisted. This suggests that tumor size itself may be intrinsically linked to the host inflammatory response and immune microenvironment, rather than being solely attributable to differences in baseline characteristics.
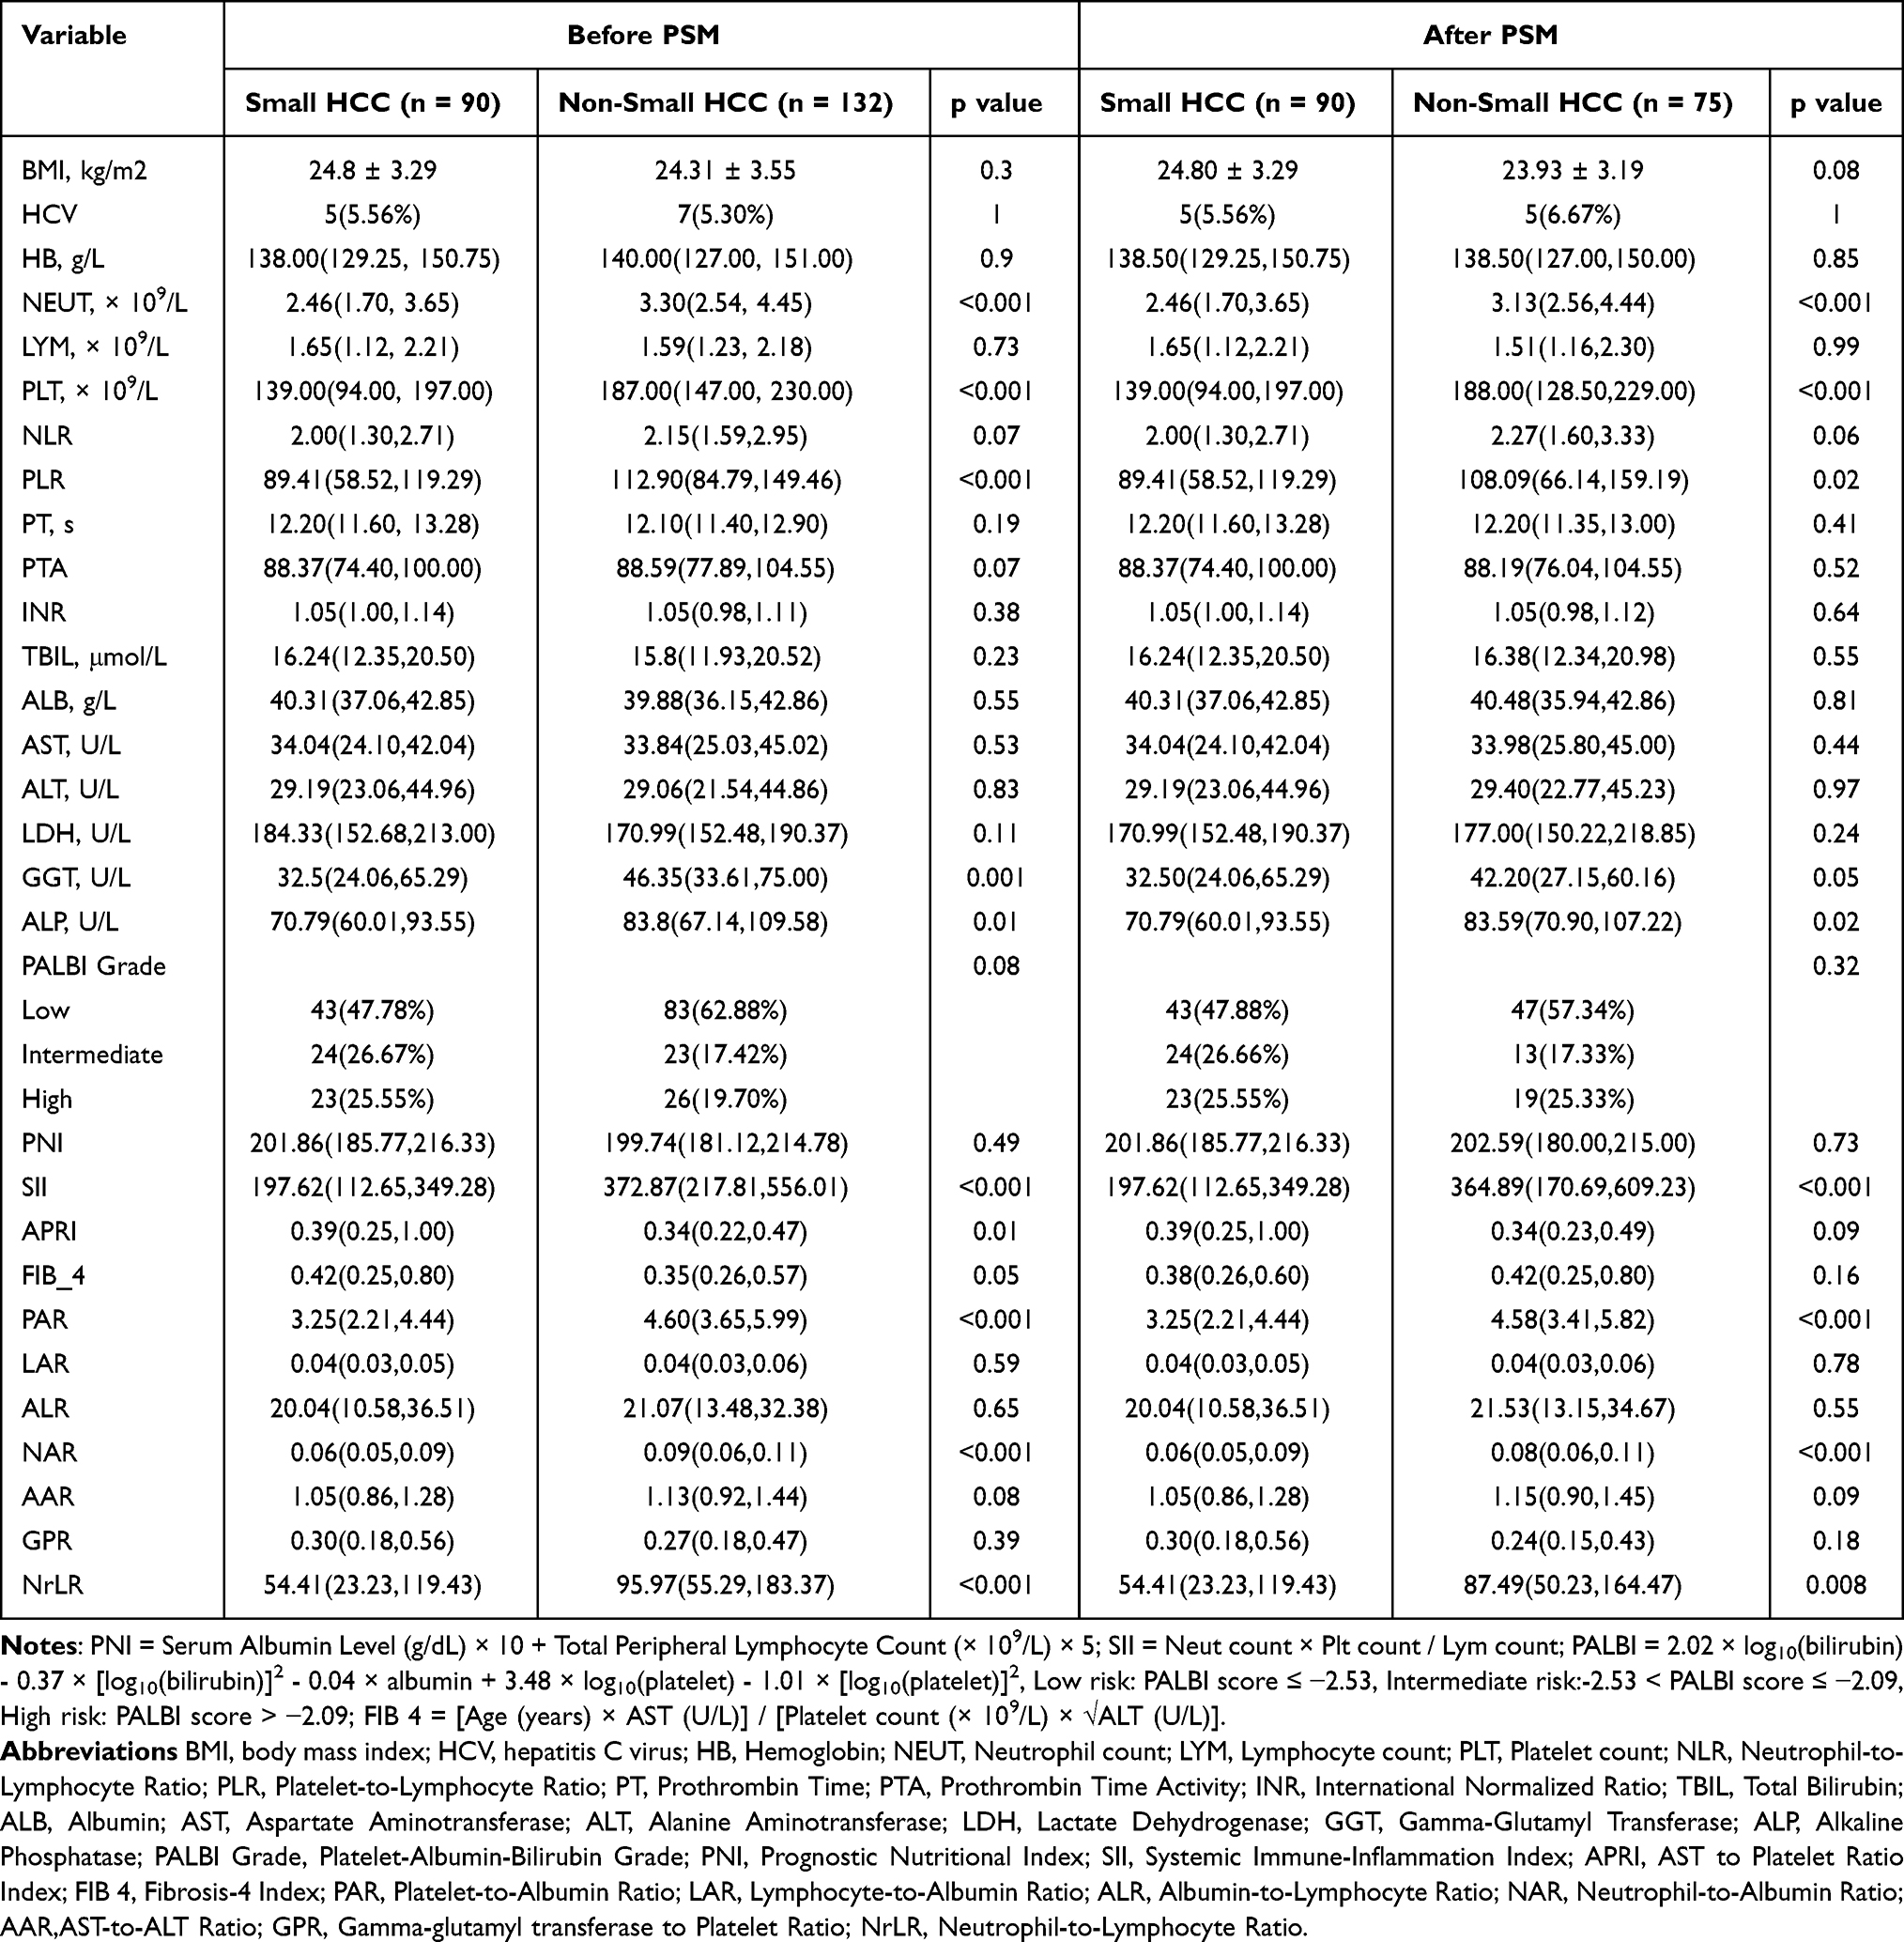 |
Table 2 Baseline Clinical Characteristics |
The results in Table 3 highlight that tumor size and stage are key characteristics distinguishing small HCC from non-small HCC. After matching, significant differences remained between the two groups in tumor diameter (2.50 cm vs. 5.82 cm) and BCLC stage distribution. Notably, following baseline confounder adjustment, the small HCC group exhibited better intraoperative bleeding control (200.00 mL vs. 400.00 mL) and a trend toward shorter surgical duration. However, no significant differences were found between the two groups in terms of tumor number, incidence of MVI, or degree of differentiation, either before or after matching. These results suggest that the favorable prognosis of small HCC is primarily due to its earlier disease stage and improved surgical operability, rather than an inherently more indolent tumor biology.
 |
Table 3 Tumor Characteristics and Perioperative Clinical Data |
In the propensity score-matched cohort (n = 165, 90 small HCC, 75 non-small HCC), survival analysis revealed a significantly better prognosis for patients in the small HCC group. For OS, the median OS in the small HCC group was 69 months, notably longer than the 64 months in the non-small HCC group (log-rank p = 0.00123, Figure 2A). The 1-year, 3-year, and 5-year survival rates in the small HCC group were 97.8%, 83.3%, and 75.6%, respectively, all significantly higher than the 92.0%, 66.7%, and 55.9% observed in the non-small HCC group (Log rank test, P < 0.001 for the 5-year survival rate comparison). For recurrence-free survival (RFS), the median RFS in the small HCC group was 66.5 months, substantially longer than the 24 months in the non-small HCC group (log-rank p < 0.0001, Figure 2B). Furthermore, the cumulative mortality rate (27.8% vs. 50.7%, P < 0.01) and cumulative recurrence rate (35.6% vs. 70.7%, P < 0.001) were both significantly lower in the small HCC group. These substantial differences, which persisted after balancing baseline characteristics, indicate that tumor size is a key determinant of prognostic disparity in HCC patients, with small HCC conferring a clear survival advantage.
 |
Figure 2 (A) Kaplan–Meier curve of OS after PSM (Log rank test, p = 0.001); (B) Kaplan–Meier curve of RFS after PSM (Log rank test, p < 0.001). |
Correlation Analysis of Continuous Variables
To examine the interrelationships among continuous variables associated with the prognosis of small HCC, Pearson correlation analysis was performed on 33 clinical and laboratory continuous variables. Several statistically significant correlations were observed, with some pairs showing high degrees of correlation (|r| > 0.8). Notable highly correlated pairs included PNI and ALB (r = 0.998, p < 0.001), LAR and LYM (r = 0.992, p < 0.001), GPR and GGT (r = 0.990, p < 0.001), NAR and NEUT (r = 0.959, p < 0.001), and PAR and PLT (r = 0.957, p < 0.001). Additionally, AST and ALT showed a strong positive correlation (r = 0.817, p < 0.001). To mitigate potential multicollinearity in subsequent regression models, variables exhibiting high informational overlap—ALB, LYM, GGT, NEUT, PLT, and AST—were excluded. The remaining 27 continuous variables were retained for univariate and multivariate Cox regression analyses (Figure 3).
 |
Figure 3 Heatmap of Clinical Variable Correlations in Small-HCC Patients. |
Univariate Cox regression analysis identified several clinicopathological and inflammatory factors significantly associated with prognosis (all P < 0.05, Table 4). Variables significantly associated with OS included age, hemoglobin, LDH, multiple inflammatory indices (PNI, PAR, NLR, PLR, SII, NAR, AAR), tumor size, and surgical factors. For RFS, significant predictors included inflammatory indices (NLR, PLR, SII, NAR, NrLR), liver-related parameters (LDH, ALP, GPR), tumor size, and intraoperative blood loss.
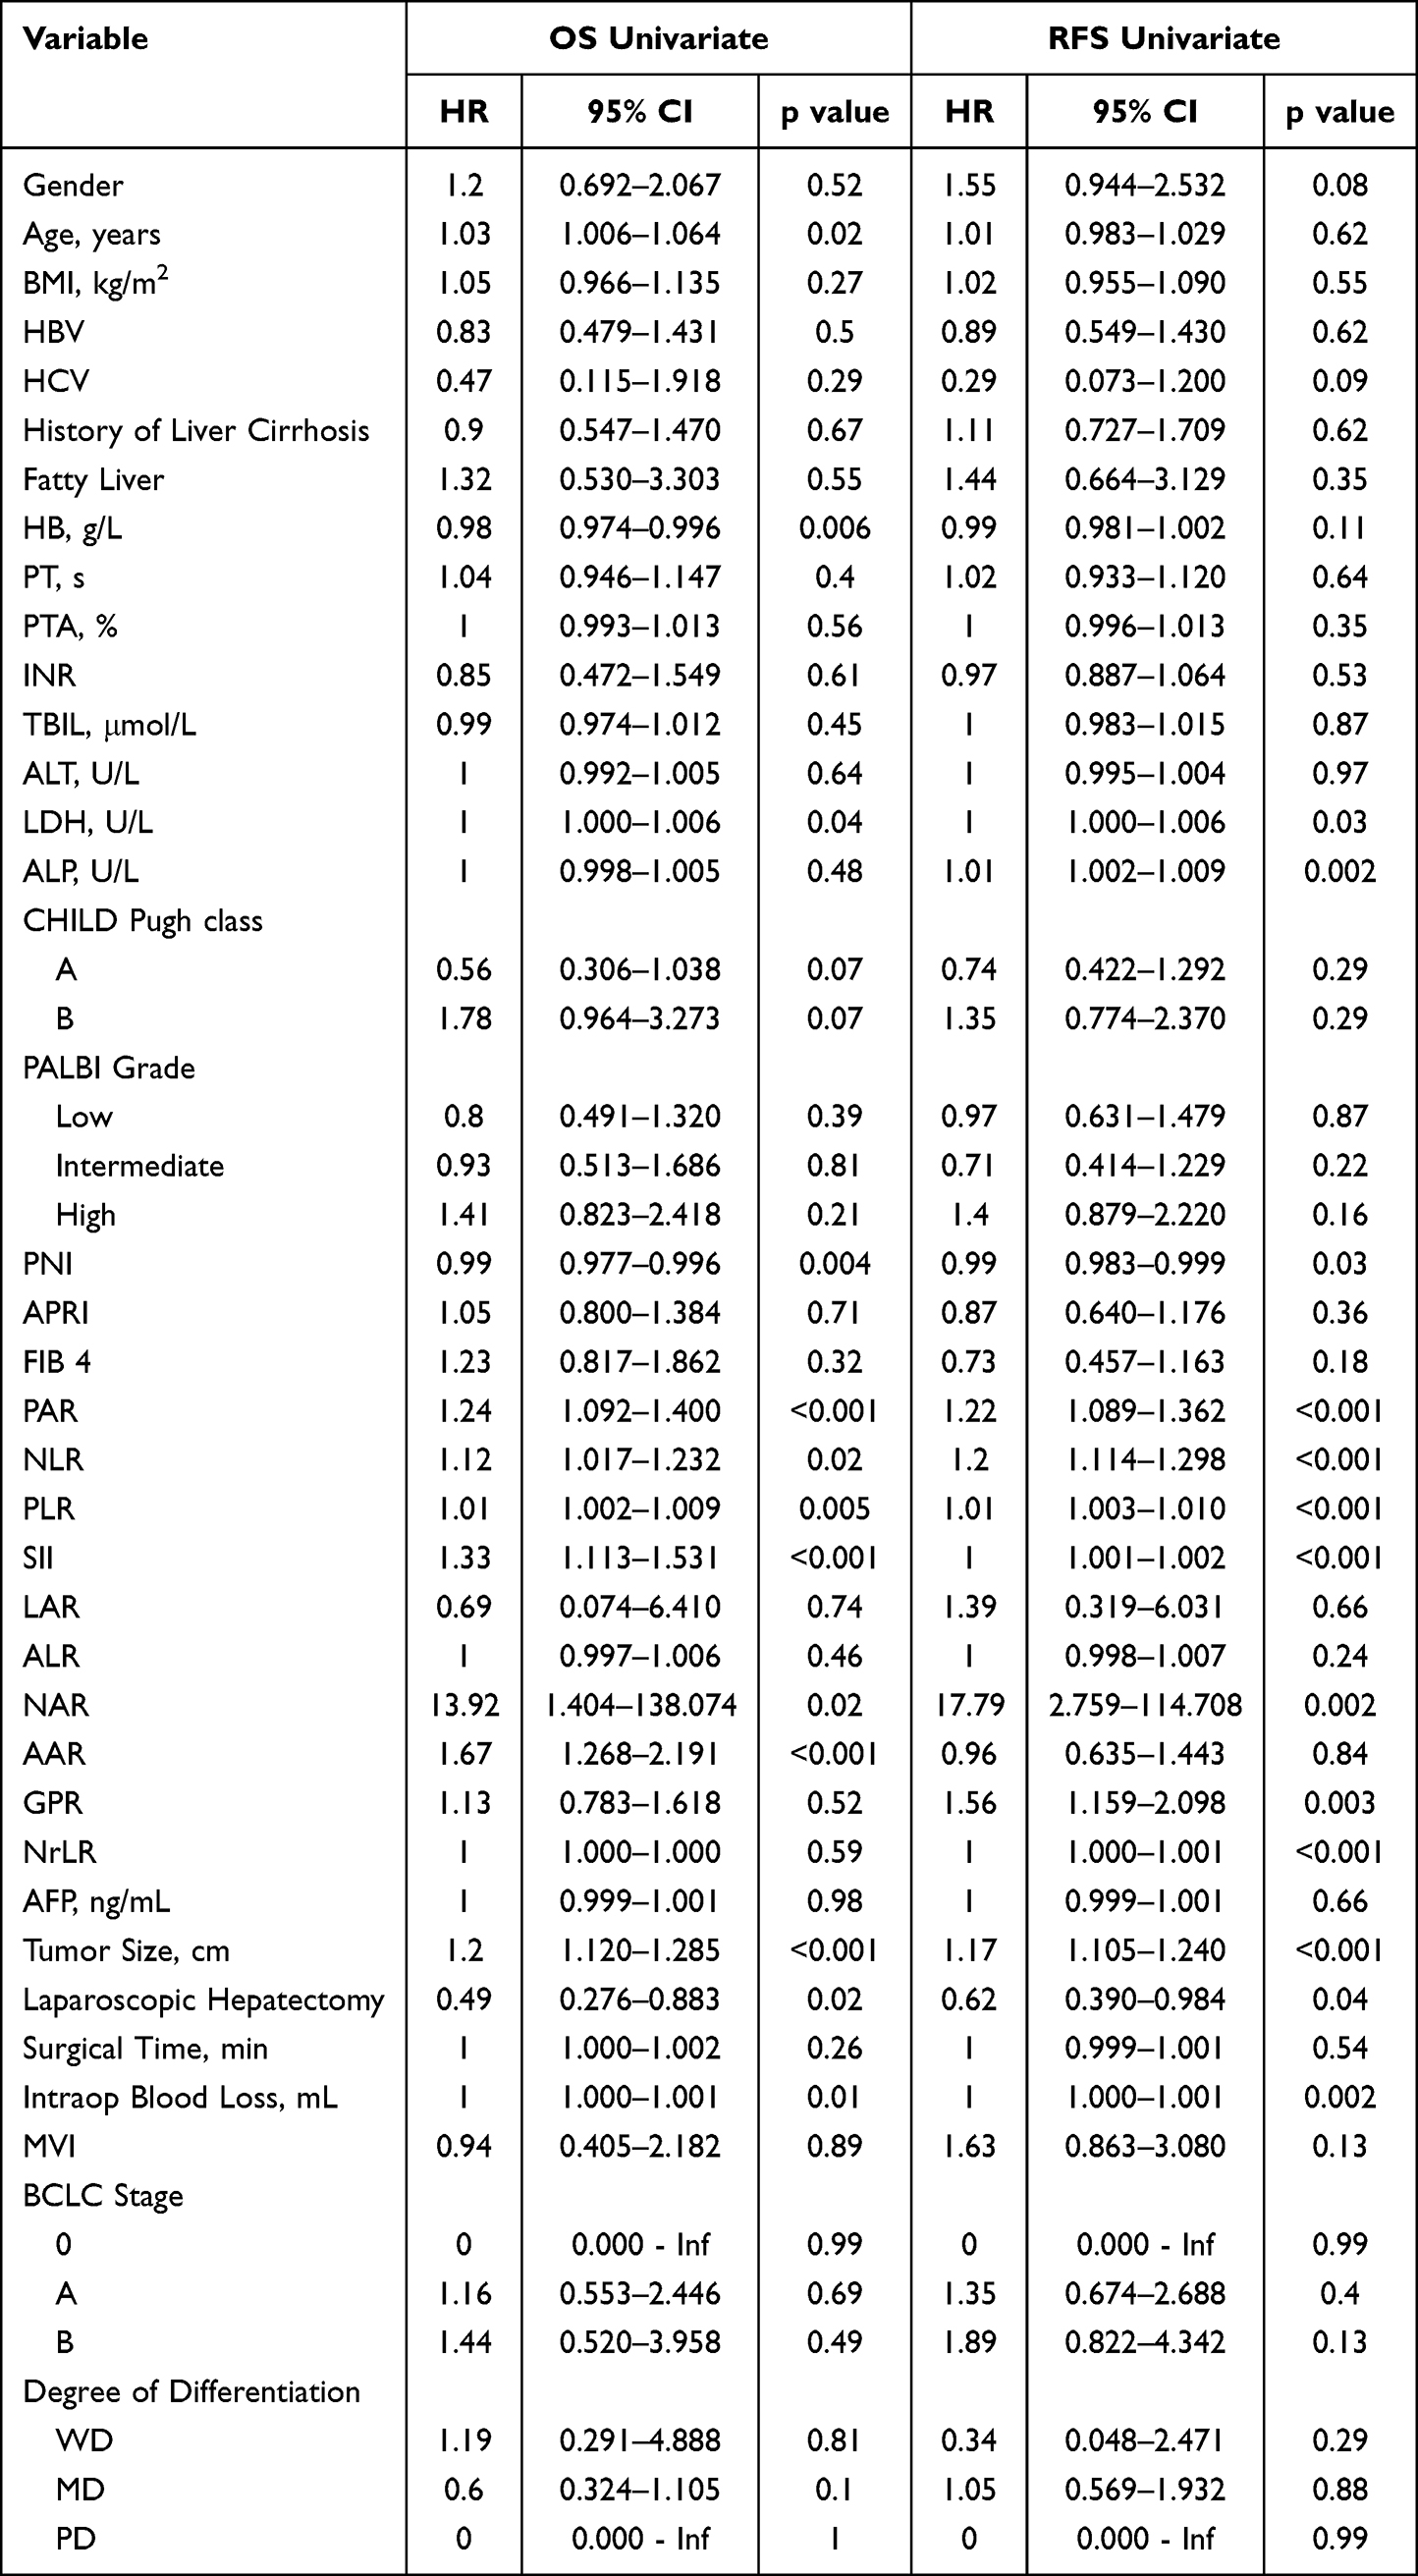 |
Table 4 Risk Factors of OS and RFS Outcome Univariate COX Analyses |
Forest Plots of Multivariate Cox Proportional Hazards Analyses for OS and RFS
In the univariate analysis, 13 variables were significantly associated with OS (p < 0.05). Based on the number of events (n = 63) and the EPV criterion, six variables (Tumor_Size, SII, AAR, PAR, PNI, PLR) were included in the multivariate Cox regression. Bidirectional stepwise regression further refined the model, identifying Tumor_Size, SII, and AAR as independent prognostic factors for OS (C-index = 0.698; Figure 4A). For RFS, among the 13 significant univariate predictors and considering recurrence events (n = 85), eight variables were initially screened. Stepwise regression retained Tumor_Size, NLR, PAR, and GPR as independent factors for RFS (C-index = 0.672; Wald test p = 7 × 10⁻¹¹; Figure 4B). Tumor size was the only common predictor in both models, while SII was specific to OS and NLR, PAR to RFS.
 |
Figure 4 Forest plots of multivariate Cox regression analyses for patients with small HCC. (A) Overall survival; (B) Recurrence-free survival. |
Construction and Validation of the Risk Scoring System
Using the β coefficients from multivariate Cox regression, two risk score formulas were constructed based on raw variable values: OS risk score = 0.146 × Tumor_Size + 0.001 × SII + 0.472 × AAR; RFS risk score = 0.119 × Tumor_Size + 0.176 × PAR + 0.171 × NLR + 0.590 × GPR. Patients were stratified into high-risk and low-risk groups using the median risk score as the cutoff (OS: 0.821; RFS: 0.812). Kaplan–Meier survival analysis demonstrated that patients in the high-risk group had significantly worse OS and RFS compared to those in the low-risk group (log-rank p < 0.001 for both) (Figure 5A and B). To assess the predictive performance of the risk scoring systems, time-dependent ROC curve analysis was conducted. The results showed good predictive accuracy at different time points: for the OS risk score, the AUC values were 0.685 at 1 year, 0.718 at 3 years, and 0.691 at 5 years, with the best performance observed at 3 years (Figure 6A).For the RFS risk score, the AUC values were 0.710 at 1 year, 0.723 at 2 years, and 0.785 at 5 years, with the highest performance at 5 years (Figure 6B).Overall, the RFS risk scoring system demonstrated superior predictive ability compared to the OS model.
 |
Figure 5 Kaplan–Meier survival curves stratified by risk score. (A) Overall survival; (B) Recurrence-free survival. |
 |
Figure 6 Time-Dependent ROC Curves for the Risk Score Models Predicting OS and RFS. (A) OS; (B) RFS. |
Construction and Visualization of Nomograms for OS and RFS
Based on the independent prognostic factors identified by multivariate Cox regression, clinical nomograms for predicting OS and RFS were developed. These visualization tools intuitively demonstrate the contribution of each variable to prognosis and facilitate the calculation of individualized survival probabilities. The OS nomogram incorporates three independent predictors: Tumor_Size, SII, and AAR, and can be used to predict the probability of 1-year, 3-year, and 5-year OS post-surgery. The AUC values at these time points were 0.685, 0.718, and 0.691, respectively (Figure 7A). The RFS nomogram includes four independent predictors: Tumor_Size, PAR, NLR, and GPR. Notably, this model is particularly useful for predicting 2-year RFS, as this time point is critical for distinguishing early recurrence in small HCC. The RFS nomogram showed excellent predictive performance for 1-year, 2-year, and 5-year RFS, with AUC values of 0.710, 0.727, and 0.785, respectively (Figure 7B). The nomograms provide strong predictive accuracy while offering advantages in clinical interpretability and ease of use.
 |
Figure 7 Nomograms for predicting survival probabilities. (A) 1-, 3-, and 5-year overall survival; (B) 1-, 2-, and 5-year recurrence-free survival. |
Construction and Comparative Analysis of Multiple Machine Learning Prediction Models
To evaluate the risk of overfitting and obtain more robust performance estimates, 10-fold cross-validation was performed for both the LASSO-Cox and XGBoost models. The cross-validated time-dependent AUCs are summarized in Table 5 and Table 6 and visualized in Figure 8. Detailed cross-validation results, including 95% confidence intervals, are provided in Supplementary Table S1 (LASSO-Cox) and Supplementary Table S2 (XGBoost).
 |
Table 5 Performance Comparison of Four Prediction Models for OS |
 |
Table 6 Performance Comparison of Four Prediction Models for RFS |
 |
Figure 8 Predictive Performance Comparison of Nomogram and Machine Learning Models (Lasso-Cox, Random Forest, and XGBoost) for OS and RFS in Patients with Small HCC. Annotation: The red dashed line indicates the reference AUC of 0.5 (random classifier). |
For OS prediction, the cross-validated AUCs for LASSO-Cox at 1, 3, and 5 years were 0.758, 0.718, and 0.698, respectively, while for XGBoost they were 0.671, 0.714, and 0.646. For RFS prediction, the cross-validated AUCs for LASSO-Cox were 0.718 (1 year), 0.727 (2 years), and 0.794 (5 years), whereas for XGBoost they were 0.715 (1 year), 0.708 (2 years), and 0.751 (5 years). The cross-validated AUCs for LASSO-Cox remained competitive and, at most time points, slightly outperformed XGBoost. Both the traditional nomogram and random forest models also demonstrated good performance, with AUCs that were either slightly lower or comparable to those of the machine learning models. Overall model performance is summarized in Figure 8.
Performance of the LASSO-Cox Model in the Small HCC Subgroup
To specifically assess the model’s applicability to patients with small HCC (tumor size ≤3 cm, n = 90), the LASSO-Cox model, trained on the full matched cohort of 165 patients, was applied to this subgroup without retraining. The model produced a 2-year RFS AUC of 0.667 (95% CI: 0.539–0.806) and a 5-year OS AUC of 0.532 (95% CI: 0.387–0.678). These values are lower than those observed in the full matched cohort (2-year RFS AUC = 0.727, 5-year OS AUC = 0.698), likely due to the smaller sample size, fewer events (25 deaths and 32 recurrences), and the limited tumor size range in the small HCC population. The ROC curves are shown in Supplementary Figure S2. These results indicate that the model’s predictive accuracy is highest when applied across a broader range of tumor sizes; its application in a strictly small HCC cohort requires further external validation.
Discussion
This study investigated the prognostic determinants of small HCC following curative resection. Using PSM to minimize confounding, this study found that postoperative outcomes are jointly influenced by tumor size, systemic inflammatory-immunological status (reflected by SII, NLR, and PAR), and liver-specific metabolic function (indicated by AAR and GPR). These multidimensional factors formed the foundation for two distinct prognostic models—one for OS and one for RFS—which were subsequently validated using multiple machine learning algorithms. The model’s performance was further assessed in the small HCC subgroup (n = 90) to determine its applicability to this clinically relevant population.
Tumor size emerged as the most fundamental anatomical determinant of prognosis in small HCC. Following PSM, the intergroup difference remained highly significant (2.50 cm vs. 5.82 cm, p < 0.001). Additionally, in the multivariate Cox models, tumor size was the only variable that independently predicted both OS (HR = 1.20) and RFS (HR = 1.17). This confirms that, after controlling for various confounders, tumor volume itself is a key driver of prognostic disparity, further supporting its role as a critical factor in HCC risk stratification.15,16 Notably, tumor size showed significant correlations with key systemic inflammatory markers (such as SII,17 NLR,18 and PAR19) and liver injury-related markers (GGT20 and ALP21), which were identified in the final model of this study. Building on the key findings from the multivariate models, specifically that SII and AAR22 jointly determine OS, while PAR, NLR, and GPR23 collectively determine RFS, it is hypothesized that tumor size influences prognosis by modulating the “tumor–immune–inflammation” axis. Smaller tumors may avoid triggering intense systemic inflammation and hepatic injury, thereby delaying disease progression. In contrast, larger tumors likely release higher quantities of inflammatory mediators and metabolites, exacerbating immunosuppression and deteriorating the tumor microenvironment, which ultimately leads to poorer outcomes. Based on this mechanistic insight, patients with small HCC approaching the 3 cm diameter threshold should be considered a potentially high-risk subgroup—even if other laboratory parameters remain within acceptable ranges—due to their larger tumor volume. Consequently, more proactive management is warranted for these patients, including considerations for wider surgical margins, increased postoperative surveillance, and more aggressive adjuvant therapy strategies. Beyond inflammation, cell cycle deregulation plays a critical role in HCC progression. Zhang et al24 demonstrated that cyclin-dependent kinase regulatory subunit 2 (CKS2) was overexpressed in HCC, promoting proliferation, chemoresistance, and invasion, and serving as an independent prognostic factor. This aligns with our finding that tumor size, in conjunction with inflammatory indices, may reflect underlying cell cycle activation and aggressive tumor behavior.
This study identified SII and AAR as independent risk factors for OS in patients with small HCC, each reflecting distinct but complementary biological processes. SII, a non-invasive composite biomarker integrating neutrophil, platelet, and lymphocyte counts, captures the dynamic balance between pro-tumor inflammation and anti-tumor immunity. Mechanistically, neutrophils promote tumor dissemination and pre-metastatic niche formation,25,26 lymphocytes reflect immune surveillance capacity—with reduced counts indicating T-cell exhaustion27—and activated platelets facilitate angiogenesis and tumor proliferation through VEGF and PDGF release.3 Extending previous observations in advanced HCC,17 our findings demonstrate that even in early-stage small tumors, elevated SII indicates an activated systemic inflammatory state that impacts long-term survival. Complementing this inflammatory axis, AAR provides insight into hepatic and systemic metabolic reprogramming. Traditionally considered a marker of liver injury, modern “omics” research reveals that AAR elevation more sensitively reflects mitochondrial stress and dysfunction, owing to the distinct subcellular localization of ALT (predominantly cytosolic) and AST (mitochondrial isoform).28 Additionally, within the tumor microenvironment, metabolic shifts toward glutaminolysis sustain energy production primarily through the glutamate dehydrogenase pathway—rather than ALT-mediated pathways—resulting in upregulation of AST-associated metabolic flux.29 Thus, AAR integrates mitochondrial function, tumor metabolic reprogramming, and host compensatory status. Together, these two biomarkers suggest that preoperative assessment of both systemic inflammation (SII) and metabolic dysfunction (AAR) may identify high-risk patients—despite small tumor burden—who could benefit from perioperative immunomodulation or intensified adjuvant therapy.
In contrast to OS, which is primarily influenced by tumor burden and systemic inflammation, RFS more directly reflects the risk of postoperative tumor recurrence. This study found that PAR, NLR, and GPR collectively constitute an independent risk model for predicting RFS, indicating that the risk of postoperative recurrence is closely associated with a persistently abnormal host state characterized by chronic liver disease, systemic inflammation, and disruptions in nutrition and coagulation. PAR, which integrates platelet count and albumin levels, reflects a host milieu characterized by hypercoagulability, heightened inflammation, and depleted nutritional reserves. Serum albumin has antioxidant, immunomodulatory, and detoxification functions, and its synthesis is reduced in malnutrition and inflammatory states.30,31 Notably, emerging evidence suggests that PAR may be more stable and less susceptible to dynamic physiological fluctuations than other platelet-derived parameters or inflammatory markers.32 This stability implies that a PAR-centered risk profile could offer a less confounded assessment of recurrence risk—one that is less vulnerable to acute-phase interference—thereby providing a more reliable foundation for identifying high-risk patients and guiding long-term management strategies. NLR, a well-established inflammatory biomarker, has been consistently linked to postoperative recurrence in HCC.33–35 The concurrent elevation of PAR and NLR thus signifies a synergistic biological pathway, identifying a more aggressive disease subtype or a distinct high-risk host state. GPR adds a liver-specific dimension by combining GGT and platelet count. Beyond its role as a cholestasis marker, GGT elevation is associated with tumor cell oxidative stress resistance, activation of proliferative signaling, and immunosuppressive myeloid cell function within the tumor microenvironment.30 Elevated GGT may also reflect extensive hepatocyte necrosis or impaired bile function.36 The platelet component captures the common hepatic complications of portal hypertension and hypercoagulability. Thus, an elevated GPR simultaneously captures two dimensions: ongoing hepatic disease activity that lays the foundation for recurrence, and a tumor-associated metabolic phenotype linked to aggressiveness. When integrated with PAR and NLR, our model provides a comprehensive “systemic-local” assessment of recurrence risk: systemic inflammation-coagulation-immunity homeostasis through PAR and NLR, and local hepatic pathology through GPR. This dual framework significantly enhances predictive accuracy for postoperative recurrence.
This systematic comparison revealed a critical insight: predictive performance does not exhibit a straightforward positive correlation with model complexity. Notably, for predicting the most clinically relevant endpoints—long-term survival and early recurrence—the LASSO-Cox regression model demonstrated superior discriminative accuracy. This model, which performs automatic feature selection within a regularized Cox framework, achieved the highest performance among machine learning models for both 5-year OS and 2-year RFS. This pattern suggests a fundamental difference in the underlying prognostic determinants: while OS may be shaped by a broader array of factors with potential non-linear interactions (where ensemble methods like Random Forest can be competitive), the risk of early recurrence appears to be effectively captured by a more parsimonious, linear combination of key host- and tumor-derived variables (tumor size, PAR, NLR, GPR). Consequently, appropriate model complexity tailored to the specific clinical endpoint is more critical than mere algorithmic sophistication for practical predictive utility.
Based on these findings, this study proposes a tiered, endpoint-specific clinical decision-support strategy: the traditional nomogram serves as an intuitive tool for rapid initial assessment due to its interpretability. For high-stakes decisions requiring optimal accuracy, the LASSO-Cox model is recommended for both long-term survival and early recurrence risk stratification to identify patients who may benefit from intensified adjuvant therapy or surveillance. The high specificity of XGBoost could be leveraged secondarily to confirm an “ultra-low-risk” subgroup suitable for simplified follow-up. This framework balances predictive performance, clinical interpretability, and practical workflow integration. Consistent with our findings, Ni et al37 also used LASSO regression to construct a robust prognostic signature for HCC based on ubiquitin-specific proteases and validated its performance in independent cohorts. Their work further supports the value of regularized regression approaches in HCC risk stratification.
Limitations
Several limitations of this study should be acknowledged. First, this was a single-center retrospective study with a relatively modest sample size, which may limit the generalizability of our findings. Second, although this study used PSM to balance baseline confounders, residual confounding from unmeasured variables (eg., detailed liver function reserve, tumor biomarkers beyond AFP) cannot be excluded. Third, different validation strategies were used for different models: the nomogram was evaluated on the training set (no internal validation), random forest was evaluated using OOB predictions, whereas LASSO-Cox and XGBoost were assessed using 10-fold cross-validation. Although this heterogeneous approach may limit direct comparability, this study prioritized the most appropriate validation method for each model. The cross-validated AUCs for LASSO-Cox and XGBoost were generally consistent with the original estimates, indicating only modest overfitting. External validation in independent cohorts is still warranted. Therefore, the model should be applied cautiously in strictly small HCC populations, and external validation in larger, independent small HCC cohorts is needed.
Conclusion
In conclusion, this study establishes a comprehensive prognostic framework for small HCC, integrating tumor size with systemic inflammatory and host-derived indices. Tumor size serves as the primary anatomical determinant, while systemic inflammation and hepatic metabolic function—reflected by SII and AAR—independently predict long-term OS. For postoperative recurrence, a risk profile centered on PAR, NLR, and GPR effectively captures the host’s inflammation-coagulation-immunity homeostasis and local hepatic disease activity. Our systematic comparison of modeling approaches identified LASSO-Cox regression as the optimal tool for clinical application, demonstrating superior predictive performance for both early recurrence (2-year RFS, AUC = 0.727) and long-term survival (5-year OS, AUC = 0.698). This model combines high accuracy with efficient feature selection, making it well-suited for clinical use. It holds considerable potential in risk-stratified postoperative management to identify high-risk patients who may benefit from intensified surveillance and adjuvant therapy and confirm low-risk individuals suitable for routine follow-up. These findings emphasize that clinical decision-making in small HCC should go beyond tumor staging alone. By integrating readily available biomarkers through the LASSO-Cox model, more refined risk stratification becomes feasible at the bedside. The limitations of this single-center, retrospective study call for validation in multicenter prospective cohorts to determine optimal cut-off values and explore targeted interventions, ultimately bridging the gap from prognostic prediction to personalized care in small HCC.
Data Statement
Data are available upon request from Yingmei Shao (Email: [email protected]).
Ethics Statement
This study adhered to the ethical standards outlined in the Helsinki Declaration of 1964 and its later amendments and was approved by the Medical Ethics Committee of The First Affiliated Hospital of Xinjiang Medical University (K202511-05).
Author Contributions
All authors made a significant contribution to the work reported, whether that is in the conception, study design, execution, acquisition of data, analysis and interpretation, or in all these areas; took part in drafting, revising or critically reviewing the article; gave final approval of the version to be published; have agreed on the journal to which the article has been submitted; and agree to be accountable for all aspects of the work. Yun Cong: Writing – original draft. Yi Gou: Writing – review & editing, Software. Ziwei Ma: Writing – review & editing, Validation. Wei Huang: Formal analysis. Qiang Guo: Software. Lifeng Zhang: Investigation. Tuerganaili Aji: Writing – review & editing, Visualization, Validation. Yingmei Shao: Writing – review & editing, Methodology, Funding acquisition.
Funding
This work was supported by State Key Laboratory of Pathogenesis, Prevention and Treatment of High Incidence Diseases in Central Asia Fund NO. SKL-HIDCA-2023-2; the NSFC No. 82360111; State Key Laboratory of Pathogenesis, Prevention and Treatment of High Incidence Diseases in Central Asia Fund NO. SKL-HIDCA-2024-22 and the in-hospital Program for the Cultivation of Excellent Talents and Innovative Teams of the First Affiliated Hospital of Xinjiang Medical University No. cxtd202416.
Disclosure
The authors declare that they have no known competing financial interests or personal relationships that could have appeared to influence the work reported in this paper.
References
1. Li P, Ding Z, Feng Y, et al. Global, regional, and national burden of hepatocellular carcinoma and contribution of nine modifiable risk factors across 185 countries/territories in 2022. Sci Bull. 2026; ;71(4):838–17. doi:10.1016/j.scib.2025.12.022
2. Zhou XD, Tang ZY, Yang BH, et al. Experience of 1000 patients who underwent hepatectomy for small hepatocellular carcinoma. Cancer. 2001;91(8):1479–1486. doi:10.1002/1097-0142(20010415)91:8<1479::aid-cncr1155>3.0.co;2-0
3. Sanghera C, Teh JJ, Pinato DJ. The systemic inflammatory response as a source of biomarkers and therapeutic targets in hepatocellular carcinoma. Liver Int. 2019;39(11):2008–2023. doi:10.1111/liv.14220
4. Portolani N, Coniglio A, Ghidoni S, et al. Early and late recurrence after liver resection for hepatocellular carcinoma: prognostic and therapeutic implications. Ann Surg. 2006;243(2):229–235. doi:10.1097/01.sla.0000197706.21803.a1
5. Jung SM, Kim JM, Choi GS, et al. Characteristics of early recurrence after curative liver resection for solitary hepatocellular carcinoma. J Gastrointest Surg. 2019;23(2):304–311. doi:10.1007/s11605-018-3927-2
6. Yao LQ, Chen ZL, Feng ZH, et al. Clinical features of recurrence after hepatic resection for early-stage hepatocellular carcinoma and long-term survival outcomes of patients with recurrence: a multi-institutional analysis. Ann Surg Oncol. 2022;29(8):5206. doi:10.1245/s10434-022-11454-y
7. Bule P, Aguiar SI, Aires-Da-Silva F, et al. Chemokine-Directed tumor microenvironment modulation in cancer immunotherapy. Int J Mol Sci. 2021;22(18):9804. doi:10.3390/ijms22189804
8. Guo B, Luo C, Lu Y, et al. Long-Term survival and beneficiaries of adjuvant Anti-PD-1 therapy in resected hepatocellular carcinoma. Ann Surg Oncol. 2026;33(2):1470–1480. doi:10.1245/s10434-025-18549-2
9. He X, Ma J, Yan X, et al. Identification of potential therapeutic targets in the progression from NAFLD to hepatocellular carcinoma. Curr Genomics. 2025;26(3):225–240. doi:10.2174/0113892029324624241015065812
10. Gudivada IP, Amajala KC. Integrative bioinformatics analysis for targeting hub genes in hepatocellular carcinoma treatment. Curr Genomics. 2025;26(1):48–80. doi:10.2174/0113892029308243240709073945
11. Xu W, Liao S, Hu Y, et al. Upregulation of miR-3130-5p enhances hepatocellular carcinoma growth by suppressing ferredoxin 1: miR-3130-5p enhances HCC growth via inhibiting FDX1. Curr Mol Pharmacol. 2024;17:e18761429358008. doi:10.2174/0118761429358008250305070518
12. Ye W, Wang J, Zheng J, et al. Association between higher expression of vav1 in hepatocellular carcinoma and unfavourable clinicopathological features and prognosis. Protein Pept Lett. 2024;31(9):706–713. doi:10.2174/0109298665330781240830042601
13. Zhou J, Sun H, Wang Z, et al. China liver cancer guidelines for the diagnosis and treatment of hepatocellular carcinoma (2024 Edition). Liver Cancer. 2025;14(6):779–835. doi:10.1159/000546574
14. Austin PC. An introduction to propensity score methods for reducing the effects of confounding in observational studies. Multivariate Behav Res. 2011;46(3):399–424. doi:10.1080/00273171.2011.568786
15. Ye QW, Pang SJ, Yang N, et al. Safety and efficacy of radiofrequency ablation for solitary hepatocellular carcinoma (3-5 cm): a Propensity Score Matching Cohort Study. J Gastrointest Surg. 2019;23(8):1549–1558. doi:10.1007/s11605-019-04229-6
16. Zhang W, Wang X, Jiang R, et al. Effect of tumor size on cancer-specific survival in small hepatocellular carcinoma. Mayo Clin Proc. 2015;90(9):1187–1195. doi:10.1016/j.mayocp.2015.06.018
17. Wang B, Huang Y, Lin T. Prognostic impact of elevated pre-treatment systemic immune-inflammation index (SII) in hepatocellular carcinoma: a meta-analysis. Medicine. 2020;99(1):e18571. doi:10.1097/MD.0000000000018571
18. Wu Y, Tu C, Shao C. Inflammatory indexes in preoperative blood routine to predict early recurrence of hepatocellular carcinoma after curative hepatectomy. BMC Surg. 2021;21(1):178. doi:10.1186/s12893-021-01180-9
19. Li C, Peng W, Zhang XY, et al. The preoperative platelet to albumin ratio predicts the prognosis of hepatocellular carcinoma patients without portal hypertension after liver resection. Medicine. 2019;98(45):e17920. doi:10.1097/MD.0000000000017920
20. Su TH, Huang SC, Chen CL, et al. Pre-operative gamma-glutamyl transferase levels predict outcomes in hepatitis B-related hepatocellular carcinoma after curative resection. J Formos Med Assoc. 2023;122(10):1008–1017. doi:10.1016/j.jfma.2023.04.009
21. Su K, Huang W, Li X, et al. Evaluation of lactate dehydrogenase and alkaline phosphatase as predictive biomarkers in the prognosis of hepatocellular carcinoma and development of a new nomogram. J Hepatocell Carcinoma. 2023;10:69–79. doi:10.2147/JHC.S398632
22. Peng W, Shen J, Dai J, et al. Preoperative aspartate aminotransferase to albumin ratio correlates with tumor characteristics and predicts outcome of hepatocellular carcinoma patients after curative hepatectomy: a multicenter study. BMC Surg. 2022;22(1):307. doi:10.1186/s12893-022-01751-4
23. Zhang J, Chen Q, Zhang Y, et al. Construction of a random survival forest model based on a machine learning algorithm to predict early recurrence after hepatectomy for adult hepatocellular carcinoma. BMC Cancer. 2024;24(1):1575. doi:10.1186/s12885-024-13366-4
24. Zhang J, Song Q, Liu J, et al. Cyclin-dependent kinase regulatory subunit 2 indicated poor prognosis and facilitated aggressive phenotype of hepatocellular carcinoma. Dis Markers. 2019;2019:8964015.
25. Xiong S, Dong L, Cheng L. Neutrophils in cancer carcinogenesis and metastasis. J Hematol Oncol. 2021;14(1):173. doi:10.1186/s13045-021-01187-y
26. W.j L, S.y K, M.s M, et al. Neutrophils facilitate ovarian cancer premetastatic niche formation in the omentum. J Exp Med. 2019;216:176–194. doi:10.1084/jem.20181170
27. Kalathil SG, Thanavala Y. Natural killer cells and T cells in hepatocellular carcinoma and viral hepatitis: current status and perspectives for future immunotherapeutic approaches. Cells. 2021;10(6):1332. doi:10.3390/cells10061332
28. Friday E, Oliver R, Welbourne T, et al. Glutaminolysis and glycolysis regulation by troglitazone in breast cancer cells: relationship to mitochondrial membrane potential. J Cell Physiol. 2011;226(2):511–519. doi:10.1002/jcp.22360
29. Sookoian S, Pirola CJ. Liver enzymes, metabolomics and genome-wide association studies: from systems biology to the personalized medicine. World J Gastroenterol. 2015;21(3):711–725. doi:10.3748/wjg.v21.i3.711
30. Don BR, albumin KGS. Relationship to inflammation and nutrition. Semin Dial. 2004;17:432–437. doi:10.1111/j.0894-0959.2004.17603.x
31. Garcia-Martinez R, Caraceni P, Bernardi M, et al. Albumin: pathophysiologic basis of its role in the treatment of cirrhosis and its complications. Hepatology. 2013;58:1836–1846. doi:10.1002/hep.26338
32. Liu CL, Wu QN, Deng ZY, et al. High platelet-to-albumin ratio is associated with 30-day mortality in critically ill patients. Eur J Med Res. 2024;29(1):620. doi:10.1186/s40001-024-02235-2
33. Mouchli M, Reddy S, Gerrard M, et al. Usefulness of neutrophil-to-lymphocyte ratio (NLR) as a prognostic predictor after treatment of hepatocellular carcinoma.” Review article. Ann Hepatol. 2021;22:100249. doi:10.1016/j.aohep.2020.08.067
34. Chen J, Fang Y, Tang Z, et al. Predictive value of neutrophil-to-lymphocyte ratio in recurrent HCC after repeat hepatectomy or salvage liver transplantation. Hepatol Int. 2025;19(4):856–865. doi:10.1007/s12072-025-10786-7
35. Gavriilidis P, Pawlik TM. Inflammatory indicators such as systemic immune inflammation index (SIII), systemic inflammatory response index (SIRI), neutrophil-to-lymphocyte ratio (NLR) and platelet-to-lymphocyte ratio (PLR) as prognostic factors of curative hepatic resections for hepatocellular carcinoma. Hepatobiliary Surg Nutr. 2024;13(3):509–511. doi:10.21037/hbsn-23-631
36. Fan Z, Wu M, Tang Z, et al. Predictive value of platelet-related measures in patients with hepatocellular carcinoma. Technol Cancer Res Treat. 2022;21:15330338211064414. doi:10.1177/15330338211064414
37. Ni W, Bian S, Zhu M, et al. Identification and validation of ubiquitin-specific proteases as a novel prognostic signature for hepatocellular carcinoma. Front Oncol. 2021;11:629327.
 © 2026 The Author(s). This work is published and licensed by Dove Medical Press Limited. The
full terms of this license are available at https://www.dovepress.com/terms
and incorporate the Creative Commons Attribution
- Non Commercial (unported, 4.0) License.
By accessing the work you hereby accept the Terms. Non-commercial uses of the work are permitted
without any further permission from Dove Medical Press Limited, provided the work is properly
attributed. For permission for commercial use of this work, please see paragraphs 4.2 and 5 of our Terms.
© 2026 The Author(s). This work is published and licensed by Dove Medical Press Limited. The
full terms of this license are available at https://www.dovepress.com/terms
and incorporate the Creative Commons Attribution
- Non Commercial (unported, 4.0) License.
By accessing the work you hereby accept the Terms. Non-commercial uses of the work are permitted
without any further permission from Dove Medical Press Limited, provided the work is properly
attributed. For permission for commercial use of this work, please see paragraphs 4.2 and 5 of our Terms.