Back to Journals » Journal of Inflammation Research » Volume 16
Prognostic Model and Tumor Immune Microenvironment Analysis of Complement-Related Genes in Gastric Cancer
Authors Gu X ![]() , Shen H
, Shen H ![]() , Zhu G, Li X
, Zhu G, Li X ![]() , Zhang Y, Zhang R
, Zhang Y, Zhang R ![]() , Su F
, Su F ![]() , Wang Z
, Wang Z ![]()
Received 29 June 2023
Accepted for publication 12 October 2023
Published 18 October 2023 Volume 2023:16 Pages 4697—4711
DOI https://doi.org/10.2147/JIR.S422903
Checked for plagiarism Yes
Review by Single anonymous peer review
Peer reviewer comments 4
Editor who approved publication: Professor Ning Quan
Xianhua Gu,1,* Honghong Shen,2,* Guangzheng Zhu,3 Xinwei Li,2 Yue Zhang,2 Rong Zhang,1 Fang Su,2 Zishu Wang2
1Department of Gynecology Oncology, First Affiliated Hospital of Bengbu Medical College, Bengbu, People’s Republic of China; 2Department of Medical Oncology, First Affiliated Hospital of Bengbu Medical College, Bengbu, People’s Republic of China; 3Department of Surgical Oncology, First Affiliated Hospital of Bengbu Medical College, Bengbu, People’s Republic of China
*These authors contributed equally to this work
Correspondence: Fang Su; Zishu Wang, Department of Medical Oncology, The First Affiliated Hospital of Bengbu Medical College, Anhui Province Key Laboratory of Translational Cancer Research, Bengbu Medical College, 287 Changhuai Road, Bengbu, Anhui, 233004, People’s Republic of China, Tel +8613605523272 ; +86 18909620171, Email [email protected]; [email protected]
Introduction: The complement system is integral to the innate and adaptive immune response, helping antibodies eliminate pathogens. However, the potential role of complement and its modulators in the tumor microenvironment (TME) of gastric cancer (GC) remains unclear.
Methods: This study assessed the expression, frequency of somatic mutations, and copy number variations of complement family genes in GC derived from The Cancer Genome Atlas (TCGA). Lasso and Cox regression analyses were conducted to develop a prognostic model based on the complement genes family, with the training and validation sets taken from the TCGA-GC cohort (n=371) and the International Gene Expression Omnibus (GEO) cohort (n=433), correspondingly. The nomogram assessment model was used to predict patient outcomes. Additionally, the link between immune checkpoints, immune cells, and the prognostic model was investigated.
Results: In contrast to patients at low risk, those at high risk had a less favorable outcome. The prognostic model-derived risk score was shown to serve as a prognostic marker of GC independently, as per the multivariate Cox analysis. Nomogram assessment showed that the model had high reliability for predicting the survival of patients with GC in the 1, 3, 5 years. Additionally, the risk score was positively linked to the expression of immune checkpoints, notably CTLA4, LAG3, PDCD1, and CD274, according to an analysis of immune processes. The core gene C5aR1 in the prognostic model was found to be upregulated in GC tissues in contrast to adjoining normal tissues, and patients with elevated expressed levels of C5aR1 had lower 10-year overall survival (OS) rates.
Conclusion: Our work reveals that complement genes are associated with the diversity and complexity of TME. The complement prognosis model help improves our understanding of TME infiltration characteristics and makes immunotherapeutic strategies more effective.
Keywords: complement genes, tumor microenvironment, gastric cancer, immune checkpoints, prognostic model
Introduction
One key component of the innate immune response is the complement system. In addition to maintaining tissue homeostatic balance, the complement system regulates humoral immunity and pathogenic immune surveillance.1,2 The complement system is involved in host defense mechanisms and pathological processes of inflammatory and immunological disorders and adaptive immune responses.3 In recent decades, the complement system is thought to act as an effector arm of the immune system, helping to destroy cancerous cells.4 Extensive research corroborates the clinical potential of complement inhibitors as a novel therapeutic approach for a variety of malignancies.5,6 An increasing number of studies have demonstrated the role of each complement component and its modulators in anti-tumor immunity.7 Activation of complement components C5 and C5a in cancer tissues and C5aR expression in breast cancer cells is associated with poor prognosis. Studies show that inhibiting the C5a/C5aR pathway helps treat breast cancer patients.8 At the same time, C5a is a potential new marker of prognosis in colon cancer and targeting the C5aR pathway might help treat colon cancer.9 Complement component C3 could also be used as a marker for the early diagnosis of pancreatic cancer.10 C3 plays a crucial role in the development and growth of cSCC as a core component of the complement system.11 The complement system is also critical in treating ovarian and lung cancers.12,13
Gastric cancer (GC) is the world’s fifth most prevalent malignancy and the fourth principal contributor to cancer-associated mortality globally. GC was responsible for almost 769,000 fatalities in 2020.14 Immunotherapies are used to treat GC in addition to radiotherapy, gastrectomy, chemotherapy, and targeted treatment.15 Despite recent advances in medicinal approaches, the death rate of GC individuals is still high.16
In both healthy gastric tissues and GC tissues, the expression of complement family genes was analyzed in this study. We also examined how these genes’ expression levels correlated with the survival outcomes of patients suffering from GC. We established a risk score model using complement family genes, constructed a prediction nomogram, and assessed the connection between the model, immune cells, and immune checkpoints. The results validated the application prospect of a novel complement family gene-based prediction model for GC.
Materials and Methods
GC Datasets and Pre-Processing
Supplementary Figure 1 displays our research flowchart. The GEO (http://www.ncbi.nlm.nih.gov/geo/) and TCGA databases were searched for common gene expression data and clinical information on the mortality and survival rate of GC patients.17,18 The GEO dataset (GSE84437) was coupled as the study object. We modified the background and carried out quantile normalization by combining the multi-array averaging techniques of simpleaffy and Affy. A thorough study of the cytogenetic mutation data and RNA sequencing (FPKM values) from the TCGA was carried out using the TCGAbiolink tool in.19,20 Transcripts per kilobase million (TPM) were converted from FPKM values. The R Bioconductor package was applied to analyze the data in R (version 4.1.2).
Copy Number and Mutation Analysis of Complement Genes
An analysis of complement family gene expression levels was conducted based on the TCGA database. The complement family genes’ chromosomal distribution was retrieved with the RCircos tool,21 whereas CNV analysis was conducted with the aid of the Perl software (5.32.1.1) and R. (4.1.2).22,23 The mutations were subjected to waterfall mapping using the Maftools software. The impact of individual mutations on the overall gene expression patterns was then assessed via the Student’s t-test. Additionally, the ggplot2 tool was employed to display the direction and magnitude of connections between gene expression and mutations.24
Model Development for Risk Scoring
By using the expression profiles and survival data of complement family genes, the full TCGA set was employed as the training dataset and the full GSE84437 set as the test dataset. The complement family genes model was developed using the training dataset and validated using the full and test datasets. The association of pyroptosis-related genes with OS rate was investigated via the Lasso and Cox regression (“glmnet” and “survival” packages).25 Cross-validation was implemented during the development of the Lasso model to guarantee reliability. We identified eight genes linked to survival using the penalty parameter (λ) and utilized these genes to develop a multivariate Cox regression model. The ideal gene set was selected and utilized to predict survival based on a forward-backward Cox regression method. The training and testing sets’ survival curves were generated utilizing a Kaplan-Meier (KM) method. The formula below was used to obtain the risk score:
The median risk score was used as cutoff for high-risk group (with higher risk score) and low-risk group (with lower risk score).
Nomogram Development and Validation for GC Patients
Based on the results of univariate and multivariate Cox regression analyses, a nomogram model was formulated for the prediction of GC patients’ OS at 1, 3, and 5 years. The nomogram was evaluated utilizing the “RMS” package26 in “R”. The KM method was applied to create calibration curves comparing the real values to the nomogram-predicted probabilities. The scatter points were found to follow a 45° diagonal line by a model for predicting nomograms that are properly calibrated. The Harrell concordance index (C-index), which has a range of 0.5 to 1, was utilized to evaluate the accuracy of the predictions made by the nomogram model. All two-tailed statistical analyses in the current study had a significance threshold of p < 0.05 for each test.
Gene Set Enrichment Analysis (GSEA)
To conduct GSEA, the mean value of the risk score was applied to classify the candidate genes into two categories: high- and low-risk.27 The Molecular Signatures Database (MSigDB [https://www.gsea-msigdb.org/gsea/msigdb]) served as the source for the functional pre-configured gene sets.28 The parameter threshold of p < 0.05 and false discovery rate (FDR) < 0.25, was adopted to pinpoint the candidate genes involved in the pathway with significant enrichment. The significantly enriched signaling pathways were identified utilizing the adjusted p-value and normalized enrichment score (NES).
Assessment of the TME’s Immunological Properties in GC
To examine the association of risk score with immune cell infiltration, the “preprocessCore” software and CIBERSORT approach were utilized to evaluate the infiltration levels of 22 different immune cells.29 In addition, the association of the risk score with 22 immune checkpoint molecules was examined in the TCGA. The significance criterion was established at a p-value of < 0.05.
Statistical Analysis
R software (v4.1.2),23 GSEA (v4.2.3),30 and Perl (v5.32.1.1)31 were used for analyzing the data in this study. Along with a description of the key R software packages applied, the statistical techniques used in the analysis were also provided. A p-value of < 0.05 indicated the cutoff criterion for significance.
Results
Expression of Complement Family Genes and Three Classical Pathways of the Complement System
The complement system consists of more than 50 protein components, and the exact number of complement genes is still unknown.32 In this study, a total of 53 complement-related genes were obtained as candidate genes by collating past literature and reviews32–35 (Supplementary Table 1), of which the expression of 42 genes was extracted after combining the TCGA and GSE84437 databases. The complement system is activated by the three pathways: the lectin, alternative, and classical pathways (Figure 1A). To determine if abnormal expression patterns were linked to malignancy, we examined the mRNA levels of these 42 genes in GC versus adjacent non-cancerous samples. The expression of thirty complement genes varied significantly between GC and non-cancerous samples (Figure 1B). Moreover, these results lend credence to the notion that complement gene mRNA expression is strikingly diverse in GC and that aberrant gene expression is involved in the onset and progression of GC.
 |
Figure 1 Expression of complement family genes and three classical pathways of the complement system. (A) Three classical pathways of the complement system. (B) Expression of 42 complement genes in normal gastric tissue (dark blue) and tumor tissue (dark Orange). Interquartile ranges are shown by box plots. Boxed rows represent medians, and P-values are depicted by asterisks (*p < 0.05; **p < 0.01; ***p < 0.001). |
Complement Family Genes’ Genetic Variation Patterns in GC
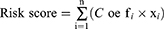
Forty-two complement genes had high copy number variations (CNV) frequencies, which were primarily manifested as copy number amplification. In contrast, CNV deletion frequencies were prevalent in C1S, C1R, C1RL, CFD, C3AR1, CPN1, C8A, C8B, CD209, C3, and CLU (Figure 2A). The locations of CNVs in the complement genes on the chromosome are shown in Figure 2B. Additionally, we summarized the frequency of CNV and somatic mutations of 42 complement regulators in GC. Of 433 samples screened, 144 (32.33%) exhibited genetic alterations of complement regulators. Among the complement genes, C3, CFH, CR1, CR2, CFI, VTN, C1S, C5, C6, CFHR4, CFHR5, C3AR1, C8B, C9, CFHR2, CPN1, C1R, C4BPB, C8A, CFHR1, CLU, C4BPA, MASP2, C1QA, C1RL, C5aR1, CD209, C4A, and CD55 were mutated in GC, while other regulators were not mutated (Figure 2C). By means of the univariate Cox proportional risk regression analysis, 10 prognostic genes were detected. Forest plots were created and hazard ratios were determined (Figure 2D).
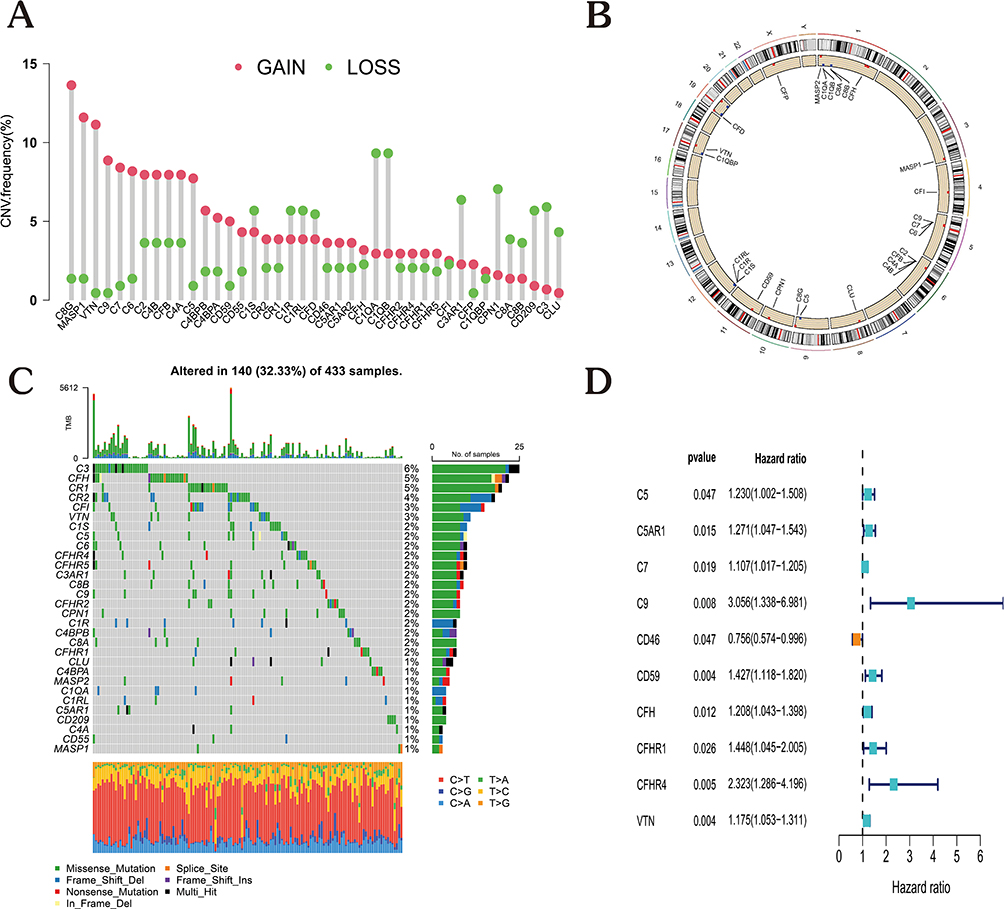 |
Figure 2 Molecular characterization and expression variants of complement family genes in GC. (A) Analyzing the frequencies of CNV in the complement family of genes in GC. The frequencies of deletions are shown by green dots, red dots represent amplification frequencies, and alteration in frequency is depicted by the column height. (B) Location of complement family gene CNV on 23 chromosomes. (C) The frequency of mutations in genes belonging to the complement family in 433 TCGA patients with GC. TMB is represented by the top bar, and each column denotes a single patient. In addition, each regulator’s mutation rate is shown to the right in the figure. The visual representation of the distribution of different types of regulatory systems is shown on the bar graph to the right. The percentage of conversions in each group is shown as a stack of horizontal bars. (D) The genes of the complement family were examined utilizing a univariate Cox regression analysis. |
Risk Score Model Constructed Using Genes in the Complement Family
The validation set consisted of 433 samples from the GSE84437 cohort, whereas the training set consisted of 371 samples from the TCGA-GC cohort. The coefficients of the chosen complement genes in the validation set were estimated by Lasso-Cox regression analysis followed by the construction of a risk score model. We arrived at the risk score equation shown below for this model: Risk score = (0.067 * C5aR1 exp.) + (0.016 * C7 exp.) + (0.099 * C9 exp.) + (-0.030 * CD46 exp.) + (0.185 * CD59 exp.) + (0.050 * CFH exp.) + (0.523 * CFHR4 exp.) + (0.081 * VTN exp.) (Figure 3A and B). Samples from both groups were classified into high- and low-risk categories as per the median risk score. Notably, the training and validation datasets included measurements of gene expression, risk score, and survival. Specifically, in the training set, the mortality rate was 51.89% in the high-risk category and 26.34% in the low-risk category; in the validation group, the mortality rate was 52.78% in the high-risk category and 43.78% in the low-risk category. Importantly, the results of the survival study illustrated that patients with low risk exhibited substantially longer OS compared to those with high risk (Figure 3C and D; p < 0.05). The distribution of scores, changes in gene expression patterns, and eight independent prognostic genes were employed to design heat maps showing patient survival rates. These heat maps were utilized for the evaluation of the risk model developed using information from the TCGA platform (Figure 3E–J). Remarkably, the prognostic model exhibited remarkable prognostic power, suggesting that it may anticipate the onset and advancement of GC.
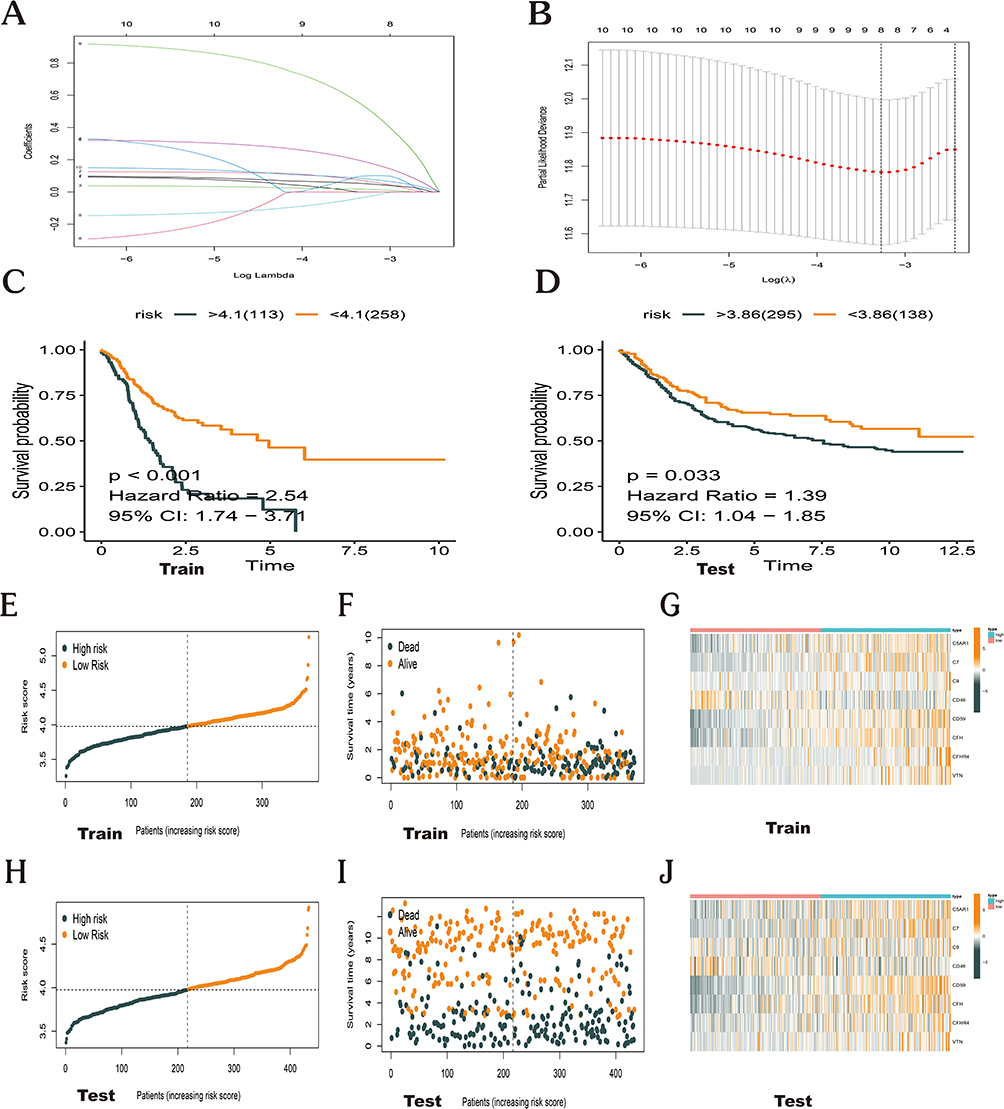 |
Figure 3 Construction of a prognostic model based on complement family genes. (A) The log (lambda) sequence is shown against the Lasso coefficient profiles of the 10 genes chosen for the OS analysis. (B) The 10-fold cross-validation error (the minimal error is represented by the first vertical line, and the error within 1 standard error of the minimal is represented by the second vertical line). (C and D) Survival probabilities for patients with high-risk score in contrast with those with low-risk score, as shown by Kaplan-Meier plots. (E–G) Distribution of risk scores, associated survival data, and expression of eight core genes in the TCGA cohort. (H–J) Distribution of risk scores, associated survival data, and expression of eight core genes in the GSE84437 cohort. |
The Development and Evaluation of a Nomogram
A nomogram was developed to examine the complement-based risk model’s clinical efficacy in clinical settings (Figure 4A). Patients were assigned a total score by adding the points of all prognostic parameters. When the sum of the points was greater, the patients’ clinical outcomes were less favorable. The calibration plot showed that the nomogram’s findings were somewhat similar to those of a perfect model (Figure 4B). The nomogram’s ability to make accurate predictions was further demonstrated by the ROC curve (Figure 4C). Cox regression analysis confirmed the associations of the GC patients’ prognoses with the prognostic risk score model, stage, age, and grade.
 |
Figure 4 Developing a nomogram and analyzing prognostic factors. (A) A nomogram model was constructed to predict the 1-, 3-, and 5-year OS probabilities of patients with GC. (B) Nomogram model-related calibration curves for estimating 1-, 3-, and 5-year OS for GC patients. (C) Nomogram model-related ROC curves for estimating 1-, 3-, and 5-year OS for GC patients. (D–E) The results of univariate (D) and multivariate Cox regression (E) for the OS of patients with EC are shown in forest plots. (**p <0.01; ***p < 0.001). |
We identified the model’s function in independently predicting the prognosis by comparing the risk score model with clinical prognostic variables in the two datasets using univariate and multivariate analyses. Additionally, it was established that age, risk score, and stage were linked to the GC patients’ prognosis, with the risk score being an independent prognostic predictor (Figure 4D–E).
Gene Set Enrichment Analysis (GSEA)
To probe which signaling pathways are most important in relation to the eight key prognostic genes in GC, a GSEA was conducted (Figure 5A). The findings demonstrated the enrichment of these genes in pathways linked to cell adhesion molecules cams, complement and coagulation cascades, cytokine cytokine receptor interaction, ecm receptor interaction, hematopoietic cell lineage, and neuroactive ligand receptor interaction (Figure 5B–G). The eight key prognostic genes could therefore be crucial in the inflammatory, immune, and hematologic systems, enhancing the onset and advancement of GC.
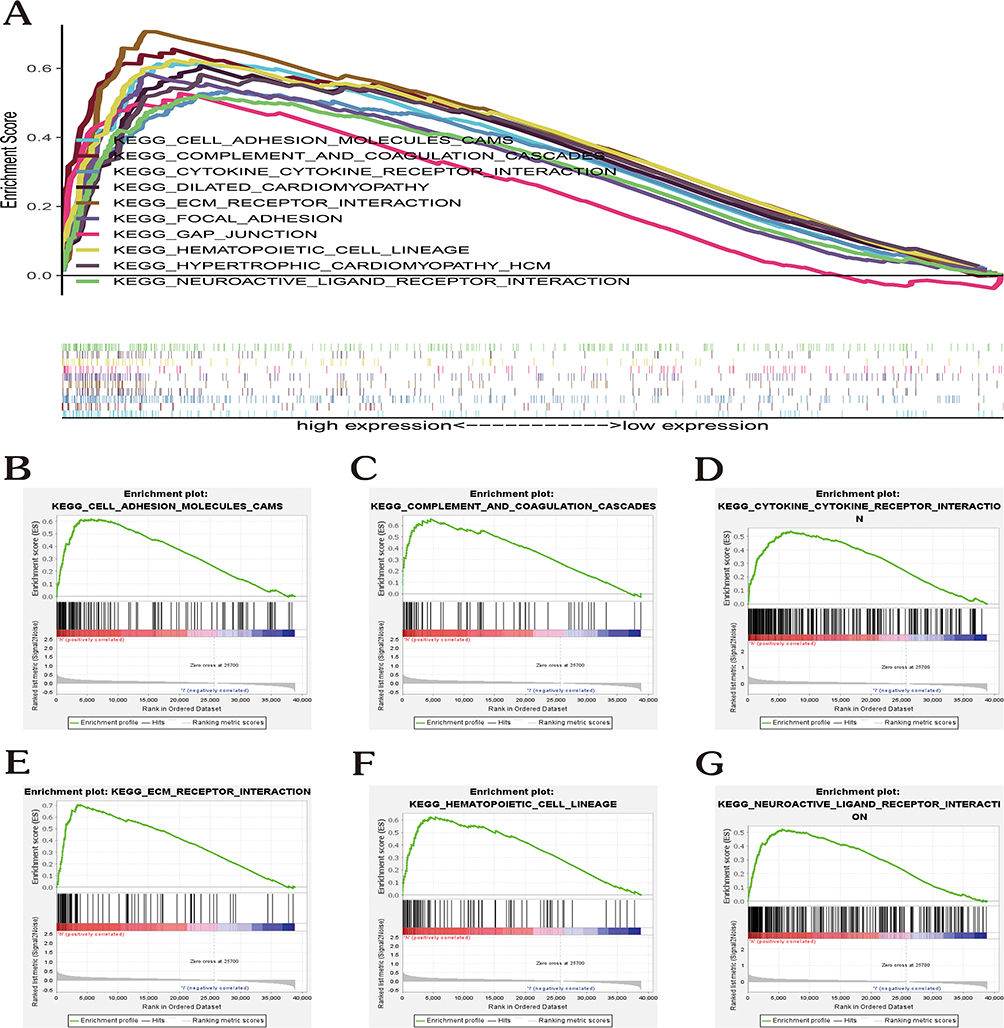 |
Figure 5 Gene set enrichment analysis. (A) Top 10 pathways related to risk score-associated gene enrichment. (B) Cell adhesion molecules cams. (C) Complement and coagulation cascades. (D) Cytokine cytokine receptor interaction. (E) Ecm receptor interaction. (F) Hematopoietic cell lineage. (G) Neuroactive ligand receptor interaction. |
The Prognostic Model’s Risk Score Was Correlated with 46 Prevalent Immune Checkpoint Genes (ICGs) in GC
In the TCGA-GC cohort, 46 ICGs and the risk score interactions were characterized (Figure 6). As opposed to the low-risk category, the high-risk patients’ ICG expression levels were remarkably elevated (Figure 6A). Moreover, the risk score and CTLA4, LAG3, CD274, and PDCD1 all showed favorable correlations (Figure 6B–F).
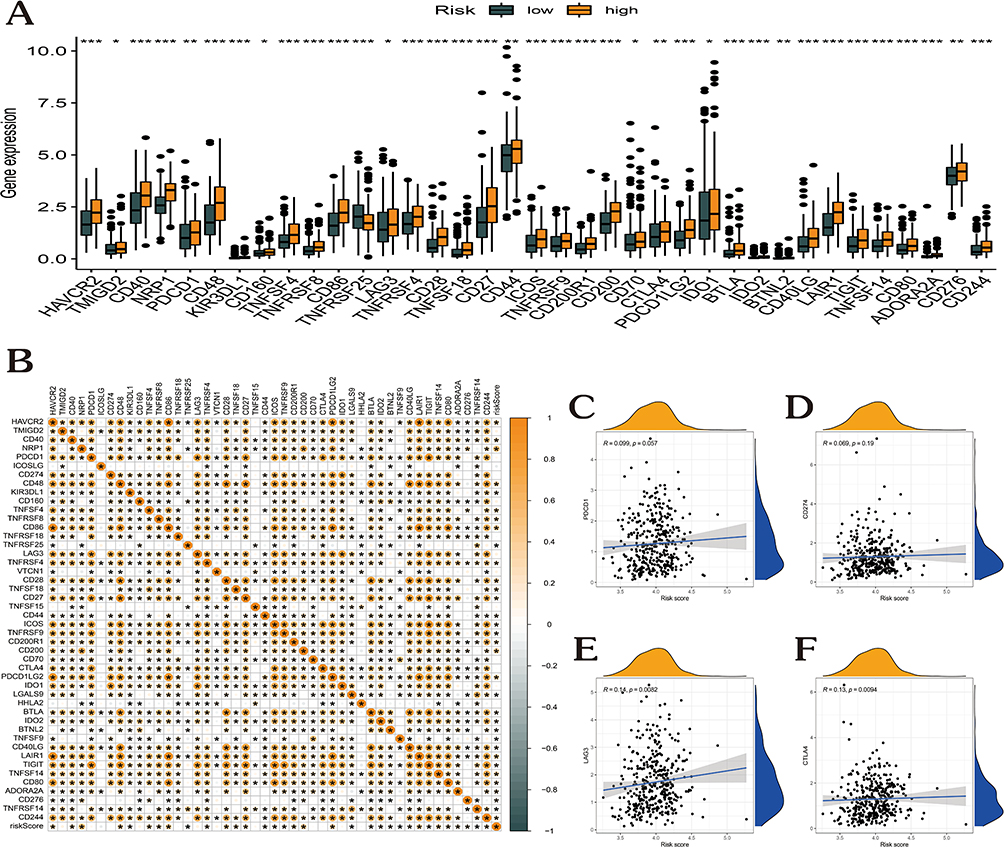 |
Figure 6 Correlational analysis of risk score with 46 GC common immune checkpoint genes. (A) Differential expression of the 46 immune checkpoint genes between high- and low-risk score groups. (B) Correlation of risk score with 46 immune checkpoint genes in GC. (C–F) Correlation of risk score with the expression of PDCD1, CD274, LAG3, and CTLA4 in TCGA-GC dataset. (*p < 0.05; **p <0.01; ***p < 0.001). |
Risk Score Correlation with Immune Cell Infiltration
By studying the connection between the eight major prognostic genes and the 22 distinct types of TIICs, the CIBERSORT method was utilized to examine the risk model correlation with immune cell infiltration (Figure 7). Patients with high and low risk were compared regarding the infiltration levels of immune cells. The proportion of regulatory T cells CD4 memory activated, and T cells follicular helper was significantly higher in the low-risk group, whereas that of T cells regulatory, dendritic cells resting, and monocytes was significantly higher in the high-risk group (Figure 7A). The risk score was negatively correlated with monocytes, dendritic cells resting, macrophages M2, and eosinophils and positively correlated with T cells CD4 memory activated and T cells follicular helper (Figure 7B–H). As opposed to the low-risk patients, the high-risk population had a considerably higher Tumor Immune Dysfunction and Exclusion (TIDE)36 score, illustrating the immune escape within the GC tumor immune microenvironment (TIME) is mediated by the high-risk score and that less successful immunotherapy treatment was achieved for patients with high-risk scores (Figure 7I).
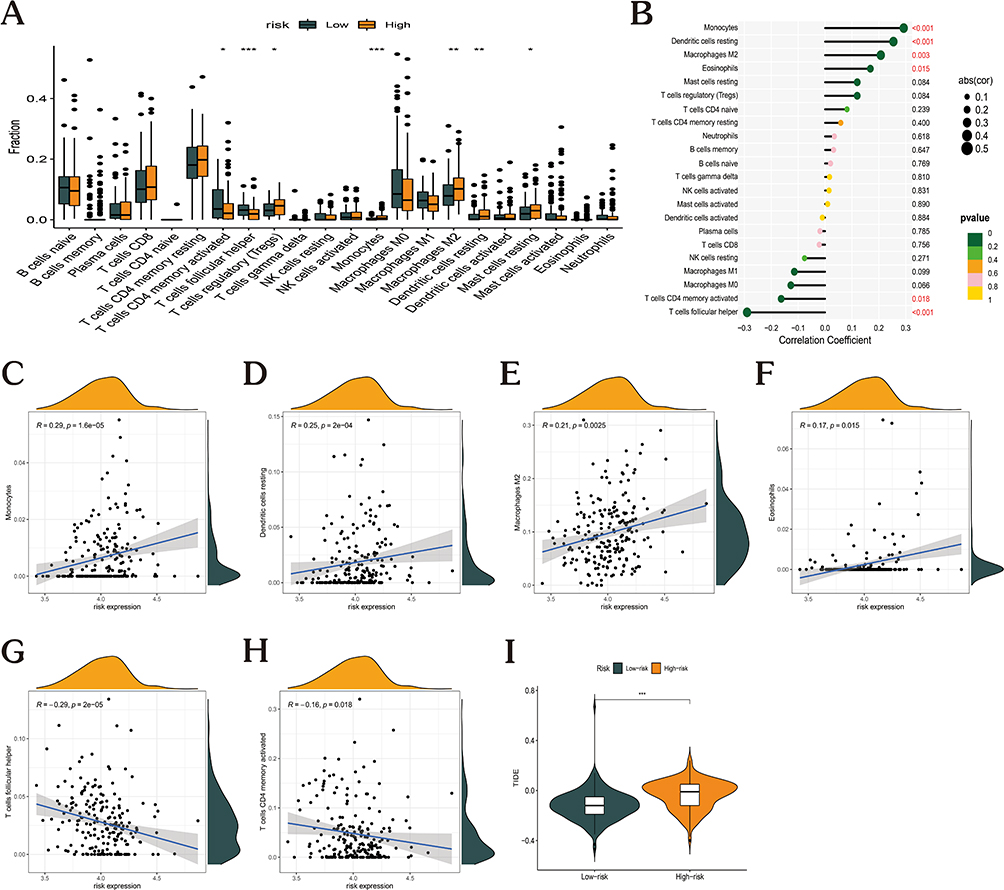 |
Figure 7 Link between risk score and immune cell infiltration. (A) Box plots showing the differences in the proportions of 22 different types of immune cells in GC tumor samples between high- and low-risk groups. (B) Correlation between risk score and 22 immune cell types in GC (p<0.05 in red). (C–H) Correlation of risk score with (C) monocytes, (D) dendritic cells resting, (E) macrophages M2, (F) eosinophils, (G) T cells CD4 memory activated, and (H) T cells follicular helper in GC. (I) Assessment of immune evasion efficacy in the high- and low-risk-expression groups. (*p < 0.05; **p <0.01; ***p < 0.001). |
Eight Key Genes’ Expression in GC Samples and Adjoining Normal Samples, Along with Their Link to the Prognosis of Patients with GC
Analysis of mRNA expression patterns from 32 matched pairs of GC and adjoining normal samples from the TCGA-GC cohort revealed that C5aR1, C9, CFHR4, and CD46 were all expressed at considerably greater levels in the tumor cells (p < 0.05, Figure 8A, C, D, and G), while C7, CD59, CFH, and VTN were not (Figure 8B, E, F, and H). The OS correlation with eight major prognostic genes was examined using the KM plotter. Patients with lower levels of C5aR1, CD59, and VTN expression had a favorable prognosis as opposed to those with higher levels (Figure 8I, M, and P; p < 0.05), which was not the case with C7, C9, CFHR4, CFH, and CD46 (Figure 8J, K, L, N, and O). The findings demonstrated that C5aR1 was overexpressed in GC samples in comparison to adjoining non-cancerous tissues and was linked to the unfavorable 10-year OS in GC patients. In summary, C5aR1 can be used as a biomarker of poor prognosis in GC.
 |
Figure 8 Expression of 8 core genes in GC and adjacent tissues and prognosis in GC. (A–H) C5AR1, C7, C9, CFHR4, CD59, CFH, CD46, and VTN were overexpressed in the tumor tissues as compared to the paraneoplastic tissues in TCGA-GC cohort. (I–P) Survival curve showing the impact of expressions of C5AR1, C7, C9, CFHR4, CD59, CFH, CD46, and VTN on the OS in TCGA-GC dataset. (*p < 0.05; ***p < 0.001; nsp > 0.05). |
Discussion
The complement system, which regulates tissue homeostasis and enhances immune surveillance, is an important component of the human immune system.1 The complement system primarily comprises effectors, receptors, and modulators, with each complement component playing a unique role. Other than activating complement, complement components, and inhibitors have other activities. According to recent studies, complement proteins interact with cells in the TME and metastatic target organs, helping to regulate tumor progression, anti-tumor immunity, and angiogenesis.37 We also found that activating the complement system improves tumor cell escape from the immune response, produces angiogenesis, and boosts the proliferation, migration, and invasiveness of cutaneous squamous cell carcinoma (cSCC). Components of the complement system found in cancerous cells might be employed as biological markers for diagnosing and classifying cancer as well as predicting its prognosis.34 Complementing innate and adaptive immunity can influence the quality and amount of T-cell activation.38 Immunotherapies that block CTLA-4 and PD-1/PD-L1 immune checkpoints have been quite successful in the past ten years. Patients with Hodgkin’s lymphoma and melanoma have benefited the most.39 Recent studies show that combined immunotherapy targeting CTLA-4 and PD-1 has been more effective in treating GC than targeting them individually.40 Future research should focus on enhancing immunotherapy’s efficacy.
In previous studies, the complement system has been explored in the prognosis and immune infiltration of colon and GC,33 but no relevant prediction model has been constructed to provide insights into the influence of complement genes in the prognosis of GC and in the mechanism of tumor microenvironment. In this work, expression data taken from the TCGA-GC cohort was used to thoroughly analyze the molecular patterns of these genes. Additionally, the expression, somatic mutations, CNVs, and prognostic significance of genes from the complement family in GC were examined. The entire TCGA dataset was used as the training group, whereas the GSE84437 dataset was used as the validation group. Eight complement genes (C5aR1, C7, C9, CFHR4, CD59, CFH, CD46, and VTN) were utilized to create a prediction model in a Lasso-Cox analysis. The model has significant advantages in analyzing gene expression data. In addition, the LASSO regression model reduces the complexity of the model and improves the accuracy of the model’s predictions, resulting in good predictive efficiency for other datasets.41,42 The participants from both groups were subsequently classified into high- and low-risk categories predicated on the median risk score. High-risk patients recorded a worse prognosis as opposed to the low-risk population. Our results show that the constructed model can distinguish GC patients well and predict prognosis, which can help to personalize the treatment plan according to the patient’s risk. The univariate and multivariate Cox regression analyses demonstrated that the risk score independently served as a prognostic indicator. A nomogram was used to verify the complement-based risk model’s clinical efficacy. The CIBERSORT tool was utilized to assess the TIICs distribution found in low- and high-risk patients. Monocytes, resting dendritic cells, macrophages M2, and eosinophils were inversely linked to the risk score, whereas activated memory CD4 T cells and T cells follicular helper were favorably correlated. Monocytes, which are innate immune cells, are crucial to the onset and spread of cancer.43 Dendritic cells are powerful antigen-presenting cells linked to immunity.44 Macrophages, an essential constituent of the human immunological system, are often differentiated into M1-like and M2-like activated macrophages, both of which are intimately related to inflammation. Pro-inflammatory and anti-inflammatory activities are primarily mediated by M1 and M2 macrophages, respectively.45,46 M1 phenotypic responses that are anti-tumor and pro-inflammatory may be neutralized by M2 macrophages.47 Eosinophils infiltrate a variety of malignancies and can control the growth of such tumors either directly by interfacing with the malignant cells or shaping the TME.48 In addition, CD4 T cells serve a crucial function in tumor prevention and immunotherapeutic response.49 In lymphoid tissues, a subset of T cells referred to as T follicular helper cells (T(FH) cells) serves as a helper for B cells and is among the most abundant and essential groups of effector T cells.50
Tumor immune infiltration and immune escape are correlated with cancer prognosis and treatment response.51–53 Most tumor cells express antigens that can mediate recognition by host CD8+ T cells. Depending on TME, immune evasion could be classified into two: cancers without a T-cell-inflamed phenotype that defend themselves against immunological assault by immune system ignorance or exclusion and those with a T-cell-inflamed phenotype that defend themselves via dominating inhibition activities of the immune system-suppressive pathways.54 The TIDE36 score results showed that the immune escape potential was higher in the high-risk category and that Immunotherapy was less effective for participants in the high-risk category. In addition, among the eight core prognostic genes, C5aR1 upregulated in GC tissues compared with adjacent normal tissues, and patients with GC with high expression of C5aR1 had a lower 10-year OS.
This study may have several limitations. First, the model shown here might be overfitted for the specific sample set population. In addition, more clinical studies should be conducted to validate the predictive model established using the eight complement-associated genes. Additionally, the study only used data from publicly available sources, which might have caused selection bias.
Conclusion
Complement family genes in GC were systematically examined for prognostic significance, mutation, and expression patterns. A risk model was constructed, and patients with GC were divided into the high- and low-risk groups. Patients in the low-risk category had a remarkably more favorable prognosis than those in the high-risk category. Furthermore, a nomogram was constructed, which anticipated the recurrence of GC in an accurate manner, thus facilitating the development of individualized treatment for GC. The construction of a prognostic model allows for a comprehensive assessment of the characteristics of the corresponding TME cell infiltration. Our study provides important information for the development of more targeted treatments for GC.
Abbreviations
GC, gastric cancer; TCGA, The Cancer Genome Atlas; GEO, Gene Expression Omnibus; OS, overall survival; GSEA, Gene set enrichment analysis; RT, room temperature; DCs, resting dendritic cells; KM, Kaplan-Meier; FDR, false discovery rate; TME, tumor microenvironment; ICI, Immune checkpoint inhibitor; ICB, immune checkpoint blockade; MSigDB, Molecular Signatures Database; FDRs, false discovery rates; TIDE, Tumour Immune Dysfunction and Exclusion.
Data Sharing Statement
The following online resources were screened based on this study’s analysis of used clinical data: TCGA (https://www.cancer.gov/), GEO (https://www.ncbi.nlm.nih.gov/geo/), TIDE (http://tide.dfci.harvard.edu/).
Acknowledgments
We thank Bullet Edits Limited for their invaluable assistance with language editing and manuscript proofreading. In addition, we also acknowledge the open databases, including TCGA, GEO, and TIDE, for providing the necessary platform and datasets for this research.
Author Contributions
All authors contributed significantly to the research that was published, whether it was in the conceptualization, research design, implementation, data gathering, analysis, and interpretation, or each of these areas separately; participated in the report’s drafting, revision, or detailed evaluation; approved the final version for publishing; decided upon the journal to which the manuscript has been submitted; and accept responsibility for all aspects of the project.
Funding
The present study was supported by the College Student Innovation Training Program of Bengbu Medical College (grant no. Byycx 22110), 512 Talent Cultivation Plan of Bengbu Medical College (grant numbers by51201319), Research and Innovation Team of Bengbu Medical College (grant no. BYKC201908). University Scientific research project of Education Department of Anhui Province (grant no. KJ2021A0714). Provincial education and Teaching research project (grant no. 2021jyxm0954).
Disclosure
The authors report no conflicts of interest in this work.
References
1. Dalakas MC, Alexopoulos H, Spaeth PJ. Complement in neurological disorders and emerging complement-targeted therapeutics. Nat Rev Neurol. 2020;16(11):601–617. doi:10.1038/s41582-020-0400-0
2. Mastellos DC, Ricklin D, Lambris JD. Clinical promise of next-generation complement therapeutics. Nat Rev Drug Discov. 2019;18(9):707–729. doi:10.1038/s41573-019-0031-6
3. Peng Q, Li K, Sacks SH, Zhou W. The role of anaphylatoxins C3a and C5a in regulating innate and adaptive immune responses. Inflamm Allergy Drug Targets. 2009;8(3):236–246. doi:10.2174/187152809788681038
4. Pio R, Ajona D, Lambris JD. Complement inhibition in cancer therapy. Semin Immunol. 2013;25(1):54–64. doi:10.1016/j.smim.2013.04.001
5. Ajona D, Ortiz-Espinosa S, Moreno H, et al. A combined PD-1/C5a blockade synergistically protects against lung cancer growth and metastasis. Cancer Discov. 2017;7(7):694–703. doi:10.1158/2159-8290.CD-16-1184
6. Zha H, Han X, Zhu Y, et al. Blocking C5aR signaling promotes the anti-tumor efficacy of PD-1/PD-L1 blockade. Oncoimmunology. 2017;6(10):e1349587. doi:10.1080/2162402X.2017.1349587
7. Macor P, Capolla S, Tedesco F. Complement as a biological tool to control tumor growth. Front Immunol. 2018;9:2203. doi:10.3389/fimmu.2018.02203
8. Chen J, Sun ZH, Chen LY, et al. C5aR deficiency attenuates the breast cancer development via the p38/p21 axis. Aging. 2020;12(14):14285–14299. doi:10.18632/aging.103468
9. Piao C, Zhang WM, Li TT, et al. Complement 5a stimulates macrophage polarization and contributes to tumor metastases of colon cancer. Exp Cell Res. 2018;366(2):127–138. doi:10.1016/j.yexcr.2018.03.009
10. Chen J, Wu W, Zhen C, et al. Expression and clinical significance of complement C3, complement C4b1 and apolipoprotein E in pancreatic cancer. Oncol Lett. 2013;6(1):43–48. doi:10.3892/ol.2013.1326
11. Jackson WD, Gulino A, Fossati-Jimack L, et al. C3 drives inflammatory skin carcinogenesis independently of C5. J Invest Dermatol. 2021;141(2):404–414 e406. doi:10.1016/j.jid.2020.06.025
12. Bareke H, Akbuga J. Complement system’s role in cancer and its therapeutic potential in ovarian cancer. Scand J Immunol. 2018;88(1):e12672. doi:10.1111/sji.12672
13. Kleczko EK, Kwak JW, Schenk EL, Nemenoff RA. Targeting the complement pathway as a therapeutic strategy in lung cancer. Front Immunol. 2019;10:954. doi:10.3389/fimmu.2019.00954
14. Sung H, Ferlay J, Siegel RL, et al. Global cancer statistics 2020: GLOBOCAN estimates of incidence and mortality worldwide for 36 cancers in 185 countries. CA Cancer J Clin. 2021;71(3):209–249. doi:10.3322/caac.21660
15. Xie J, Fu L, Jin L. Immunotherapy of gastric cancer: past, future perspective and challenges. Pathol Res Pract. 2021;218:153322. doi:10.1016/j.prp.2020.153322
16. Alkasalias T, Moyano-Galceran L, Arsenian-Henriksson M, Lehti K. Fibroblasts in the tumor microenvironment: shield or spear? Int J Mol Sci. 2018;19(5):1532. doi:10.3390/ijms19051532
17. Barrett T, Wilhite SE, Ledoux P, et al. NCBI GEO: archive for functional genomics data sets–update. Nucleic Acids Res. 2013;41(Database issue):D991–995. doi:10.1093/nar/gks1193
18. Blum A, Wang P, Zenklusen JC. SnapShot: TCGA-analyzed tumors. Cell. 2018;173(2):530. doi:10.1016/j.cell.2018.03.059
19. Zhao Y, Li MC, Konate MM, et al. TPM, FPKM, or normalized counts? A comparative study of quantification measures for the analysis of RNA-seq data from the NCI patient-derived models repository. J Transl Med. 2021;19(1):269. doi:10.1186/s12967-021-02936-w
20. Mounir M, Lucchetta M, Silva TC, et al. New functionalities in the TCGAbiolinks package for the study and integration of cancer data from GDC and GTEx. PLoS Comput Biol. 2019;15(3):e1006701. doi:10.1371/journal.pcbi.1006701
21. Zhang H, Meltzer P, Davis S. RCircos: an R package for Circos 2D track plots. BMC Bioinform. 2013;14:244. doi:10.1186/1471-2105-14-244
22. Angly FE, Fields CJ, Tyson GW. The bio-community Perl toolkit for microbial ecology. Bioinformatics. 2014;30(13):1926–1927. doi:10.1093/bioinformatics/btu130
23. Giorgi FM, Ceraolo C, Mercatelli D. The R Language: an engine for bioinformatics and data science. Life. 2022;12(5):648.
24. Steenwyk JL, Rokas A. ggpubfigs: colorblind-friendly color palettes and ggplot2 graphic system extensions for publication-quality scientific figures. Microbiol Resour Announc. 2021;10(44):e0087121. doi:10.1128/MRA.00871-21
25. Yang L, Qu Q, Hao Z, Sha K, Li Z, Li S. Powerful identification of large quantitative trait loci using genome-wide R/glmnet-based regression. J Hered. 2022;113(4):472–478. doi:10.1093/jhered/esac006
26. Liu TT, Li R, Huo C, et al. Identification of CDK2-related immune Forecast model and ceRNA in lung adenocarcinoma, a pan-cancer analysis. Front Cell Dev Biol. 2021;9:682002. doi:10.3389/fcell.2021.682002
27. Canzler S, Hackermuller J. multiGSEA: a GSEA-based pathway enrichment analysis for multi-omics data. BMC Bioinform. 2020;21(1):561. doi:10.1186/s12859-020-03910-x
28. Liberzon A, Birger C, Thorvaldsdottir H, Ghandi M, Mesirov JP, Tamayo P. The molecular signatures database (MSigDB) hallmark gene set collection. Cell Syst. 2015;1(6):417–425. doi:10.1016/j.cels.2015.12.004
29. Chen B, Khodadoust MS, Liu CL, Newman AM, Alizadeh AA. Profiling tumor infiltrating immune cells with CIBERSORT. Methods Mol Biol. 2018;1711:243–259.
30. Powers RK, Goodspeed A, Pielke-Lombardo H, Tan AC, Costello JC. GSEA-InContext: identifying novel and common patterns in expression experiments. Bioinformatics. 2018;34(13):i555–i564. doi:10.1093/bioinformatics/bty271
31. Suwazono S, Arao H. A newly developed free software tool set for averaging electroencephalogram implemented in the Perl programming language. Heliyon. 2020;6(11):e05580. doi:10.1016/j.heliyon.2020.e05580
32. Pio R, Corrales L, Lambris JD. The role of complement in tumor growth. Adv Exp Med Biol. 2014;772:229–262. doi:10.1007/978-1-4614-5915-6_11
33. Bao D, Zhang C, Li L, et al. Integrative analysis of complement system to prognosis and immune infiltrating in colon cancer and gastric cancer. Front Oncol. 2020;10:553297. doi:10.3389/fonc.2020.553297
34. Riihila P, Nissinen L, Knuutila J, Rahmati Nezhad P, Viiklepp K, Kahari VM. Complement system in cutaneous squamous cell carcinoma. Int J Mol Sci. 2019;20(14):3550. doi:10.3390/ijms20143550
35. Xu B, Wang L, Zhan H, et al. Investigation of the mechanism of complement system in diabetic nephropathy via bioinformatics analysis. J Diabetes Res. 2021;2021:5546199. doi:10.1155/2021/5546199
36. Fu J, Li K, Zhang W, et al. Large-scale public data reuse to model immunotherapy response and resistance. Genome Med. 2020;12(1):21. doi:10.1186/s13073-020-0721-z
37. Kolev M, Markiewski MM. Targeting complement-mediated immunoregulation for cancer immunotherapy. Semin Immunol. 2018;37:85–97. doi:10.1016/j.smim.2018.02.003
38. Reis ES, Mastellos DC, Hajishengallis G, Lambris JD. New insights into the immune functions of complement. Nat Rev Immunol. 2019;19(8):503–516. doi:10.1038/s41577-019-0168-x
39. Zappasodi R, Merghoub T, Wolchok JD. Emerging concepts for immune checkpoint blockade-based combination therapies. Cancer Cell. 2018;33(4):581–598. doi:10.1016/j.ccell.2018.03.005
40. Zhao Q, Cao L, Guan L, et al. Immunotherapy for gastric cancer: dilemmas and prospect. Brief Funct Genomics. 2019;18(2):107–112. doi:10.1093/bfgp/ely019
41. Hu JY, Wang Y, Tong XM, Yang T. When to consider logistic LASSO regression in multivariate analysis? Eur J Surg Oncol. 2021;47(8):2206. doi:10.1016/j.ejso.2021.04.011
42. Guler H, Guler EO. Mixed Lasso estimator for stochastic restricted regression models. J Appl Stat. 2021;48(13–15):2795–2808. doi:10.1080/02664763.2021.1922614
43. Olingy CE, Dinh HQ, Hedrick CC. Monocyte heterogeneity and functions in cancer. J Leukoc Biol. 2019;106(2):309–322. doi:10.1002/JLB.4RI0818-311R
44. Brossart P, Wirths S, Brugger W, Kanz L. Dendritic cells in cancer vaccines. Exp Hematol. 2001;29(11):1247–1255. doi:10.1016/S0301-472X(01)00730-5
45. Wang L, Lu Q, Gao W, Yu S. Recent advancement on development of drug-induced macrophage polarization in control of human diseases. Life Sci. 2021;284:119914. doi:10.1016/j.lfs.2021.119914
46. Yunna C, Mengru H, Lei W, Weidong C. Macrophage M1/M2 polarization. Eur J Pharmacol. 2020;877:173090. doi:10.1016/j.ejphar.2020.173090
47. Najafi M, Hashemi Goradel N, Farhood B, et al. Macrophage polarity in cancer: a review. J Cell Biochem. 2019;120(3):2756–2765. doi:10.1002/jcb.27646
48. Grisaru-Tal S, Itan M, Klion AD, Munitz A. A new Dawn for eosinophils in the tumour microenvironment. Nat Rev Cancer. 2020;20(10):594–607. doi:10.1038/s41568-020-0283-9
49. Borst J, Ahrends T, Babala N, Melief CJM, Kastenmuller W. CD4(+) T cell help in cancer immunology and immunotherapy. Nat Rev Immunol. 2018;18(10):635–647. doi:10.1038/s41577-018-0044-0
50. King C, Tangye SG, Mackay CR. T follicular helper (TFH) cells in normal and dysregulated immune responses. Annu Rev Immunol. 2008;26:741–766. doi:10.1146/annurev.immunol.26.021607.090344
51. Lawal B, Lin LC, Lee JC, et al. Multi-omics data analysis of gene expressions and alterations, cancer-associated fibroblast and immune infiltrations, reveals the onco-immune prognostic relevance of STAT3/CDK2/4/6 in human malignancies. Cancers. 2021;13(5):954. doi:10.3390/cancers13050954
52. Vinay DS, Ryan EP, Pawelec G, et al. Immune evasion in cancer: mechanistic basis and therapeutic strategies. Semin Cancer Biol. 2015;35(Suppl):S185–S198. doi:10.1016/j.semcancer.2015.03.004
53. Jhunjhunwala S, Hammer C, Delamarre L. Antigen presentation in cancer: insights into tumour immunogenicity and immune evasion. Nat Rev Cancer. 2021;21(5):298–312. doi:10.1038/s41568-021-00339-z
54. Kaderbhai C, Tharin Z, Ghiringhelli F. The role of molecular profiling to predict the response to immune checkpoint inhibitors in lung cancer. Cancers. 2019;11(2):201. doi:10.3390/cancers11020201
 © 2023 The Author(s). This work is published and licensed by Dove Medical Press Limited. The
full terms of this license are available at https://www.dovepress.com/terms
and incorporate the Creative Commons Attribution
- Non Commercial (unported, 3.0) License.
By accessing the work you hereby accept the Terms. Non-commercial uses of the work are permitted
without any further permission from Dove Medical Press Limited, provided the work is properly
attributed. For permission for commercial use of this work, please see paragraphs 4.2 and 5 of our Terms.
© 2023 The Author(s). This work is published and licensed by Dove Medical Press Limited. The
full terms of this license are available at https://www.dovepress.com/terms
and incorporate the Creative Commons Attribution
- Non Commercial (unported, 3.0) License.
By accessing the work you hereby accept the Terms. Non-commercial uses of the work are permitted
without any further permission from Dove Medical Press Limited, provided the work is properly
attributed. For permission for commercial use of this work, please see paragraphs 4.2 and 5 of our Terms.
Recommended articles
Nucleotide‐Binding Oligomerization Domain (NOD)-Like Receptor Subfamily C (NLRC) as a Prognostic Biomarker for Glioblastoma Multiforme Linked to Tumor Microenvironment: A Bioinformatics, Immunohistochemistry, and Machine Learning-Based Study
Han S, Zhang Z, Ma W, Gao J, Li Y
Journal of Inflammation Research 2023, 16:523-537
Published Date: 10 February 2023
Exploring Prognosis, Tumor Microenvironment and Tumor Immune Infiltration in Hepatocellular Carcinoma Based on ATF/CREB Transcription Factor Family Gene-Related Model
Shen H, Gu X, Li H, Tang M, Li X, Zhang Y, Su F, Wang Z
Journal of Hepatocellular Carcinoma 2023, 10:327-345
Published Date: 27 February 2023
Exploring the Correlation Between GPR176, a Potential Target Gene of Gastric Cancer, and Immune Cell Infiltration
Gu X, Shen H, Xiang Z, Li X, Zhang Y, Zhang R, Su F, Wang Z
Pharmacogenomics and Personalized Medicine 2023, 16:519-535
Published Date: 1 June 2023
A Novel Neutrophil Extracellular Traps Signature for Overall Survival Prediction and Tumor Microenvironment Identification in Gastric Cancer
Qu Z, Han Y, Zhu Q, Ding W, Wang Y, Zhang Y, Wei W, Lei Y, Li M, Jiao Y, Gu K, Zhang Y
Journal of Inflammation Research 2023, 16:3419-3436
Published Date: 14 August 2023
Identification the Tumor Mechanics-Related Biomarkers in Gastric Cancer Patients Based on Bioinformatics and Machine Learning
Sun M, Liu Q, Xu A
International Journal of General Medicine 2025, 18:7653-7673
Published Date: 18 December 2025