Back to Journals » OncoTargets and Therapy » Volume 13
Prognostic Correlation of Autophagy-Related Gene Expression-Based Risk Signature in Patients with Glioblastoma
Authors Wang QW, Liu HJ, Zhao Z, Zhang Y, Wang Z, Jiang T, Bao ZS ![]()
Received 12 November 2019
Accepted for publication 17 December 2019
Published 7 January 2020 Volume 2020:13 Pages 95—107
DOI https://doi.org/10.2147/OTT.S238332
Checked for plagiarism Yes
Review by Single anonymous peer review
Peer reviewer comments 2
Editor who approved publication: Prof. Dr. Takuya Aoki
Qiang-Wei Wang,1 Han-Jie Liu,1 Zheng Zhao,1 Ying Zhang,1 Zheng Wang,2 Tao Jiang,1,2 Zhao-Shi Bao2,3
1Beijing Neurosurgical Institute, Capital Medical University, Beijing 100070, People’s Republic of China; 2Department of Neurosurgery, Beijing Tiantan Hospital, Capital Medical University, Beijing 100070, People’s Republic of China; 3Division of Life Science, Hong Kong University of Science and Technology, Hong Kong, People’s Republic of China
Correspondence: Zhao-Shi Bao
Department of Neurosurgery, Beijing Tiantan Hospital, Capital Medical University, No. 119 South Fourth Ring West Road, Fengtai District, Beijing 100070, People’s Republic of China
Tel/Fax +86-10-59976785
Email [email protected]
Purpose: Autophagy plays a vital role in cancer initiation, malignant progression, and resistance to treatment; however, autophagy-related gene sets have rarely been analyzed in glioblastoma. The purpose of this study was to evaluate the prognostic significance of autophagy-related genes in patients with glioblastoma.
Patients and methods: Here, we collected whole transcriptome expression data from the Chinese Glioma Genome Atlas (CGGA) and The Cancer Genome Atlas (TCGA) datasets to explore the relationship between autophagy-related gene expression and glioblastoma prognosis. R language was the primary analysis and drawing tool.
Results: We screened 531 autophagy-related genes and identified 14 associated with overall survival in data from 986 patients with glioblastoma. Patients could be clustered into two groups (high and low risk) using expression data from the 14 associated genes, based on significant differences in clinicopathology and prognosis. Next, we constructed a signature based on the 14 genes and found that most patients designated high risk using our gene signature were IDH wild-type, MGMT promoter non-methylated, and likely to have more malignant tumor subtypes (including classical and mesenchymal subtypes). Survival analysis indicated that patients in the high-risk group had dramatically shorter overall survival compared with their low-risk counterparts. Cox regression analysis further confirmed the independent prognostic value of our 14 gene signature. Moreover, functional and ESTIMATE analyses revealed enrichment of immune and inflammatory responses in the high-risk group.
Conclusion: In this study, we identified a novel autophagy-related signature for the prediction of prognosis in patients with glioblastoma.
Keywords: Chinese Glioma Genome Atlas, transcriptome, survival analysis, autophagy, glioblastoma
Introduction
Autophagy is an important selective recycling mechanism by which cell components are degraded in lysosomes to provide basic materials and energy for cells.1 The autophagy process has a vital role in cancer initiation, malignant progression, and resistance to treatment.2 Further, regulation of cancer stem cell homeostasis by autophagy is an important mechanism of tumor resistance, recurrence, and metastasis.3,4 The discovery of numerous of autophagy-related genes has facilitated the discovery of the pathophysiological roles of autophagy.5 To illustrate the importance of autophagy, there is increasing evidence that abnormalities in autophagy-related genes play pathogenic roles in human disease, including cancer.1 For example, Takamura et al found that various liver tumors developed in a mouse model with deletion of autophagy-related gene 5 (Atg5), which exhibited accumulation of p62, due to deficiency in autophagy, promoting tumor progression.6
Various relationships between cancer and autophagy have been described. FIP200 interacts with its autophagy partner, ATG13, to regulate autophagy activity in cancer, which is essential for tumor cell growth.7,8 Further, deletion of the two autophagy regulators, PARKIN and BNIP3, leads to tumor formation and accelerated malignant progression.9,10 Hence, understanding the role of autophagy and related genes in cancer is of great significance for the development of new therapeutic strategies.
Glioblastoma multiforme (GBM) is the most common malignant primary tumor of the central nervous system.11 The current standard treatment for glioblastoma is surgical resection combined with chemoradiotherapy; however, this approach only extends median survival to 14.6 months.11,12 According to the 2016 WHO guidelines for classification of central nervous system tumors, glioblastoma classification combines molecular phenotype with traditional pathology.13 Glioblastomas are divided into two groups based on IDH mutation status: IDH-wildtype and IDH-mutant GBM, with significant differences in clinical features and prognosis between the two groups.
In this study, we comprehensively analyzed autophagy-related genes in GBM. First, we collected autophagy-related gene data and identified 14 genes related to patient prognosis. These 14 genes could stratify patients into two groups with significant molecular and prognostic differences, suggesting a correlation with glioblastoma malignancy. Hence, we constructed 14 gene autophagy-related signature with good prognostic value and which can serve as an independent prognostic indicator in GBM. Moreover, functional analysis revealed the elevation of immune and inflammatory responses in GBM samples classified as high-risk using our 14 gene signature, which was directly related to tumor malignancy and poor prognosis. In conclusion, our study confirms the correlation between autophagy status and glioblastoma malignancy and prognosis, providing new insights relevant to individualized treatment.
Methods
Samples and Data Collected for This Study
Glioblastoma samples (n = 138) with mRNA sequencing data and clinicopathological information were collected from the Chinese Glioma Genome Atlas (CGGA) dataset (http://www.cgga.org.cn). Sample pathology was diagnosed by two experienced neuropathologists, according to the 2016 WHO Classification of CNS tumors. Overall survival (OS) was defined as the interval from diagnosis to death or last follow-up. In addition, mRNA expression and survival data from 689 (152 sequencing and 537 microarray included) glioblastoma samples were downloaded from The Cancer Genome Atlas (TCGA) dataset (https://cancergenome.nih.gov/), along with data from 159 glioblastoma samples in the GSE16011 dataset.14 Thus, mRNA expression and survival data from a total of 986 glioblastoma samples were included in this study. Our CGGA dataset was approved by the Beijing Tiantan Hospital Capital Medical University Institutional Review Board (IRB) and was conducted according to the principles of the Helsinki Declaration. Written informed consent was obtained from all patients. The specimens were collected under IRB KY2013-017-01 and were frozen in liquid nitrogen within 5 min of resection.
Human Autophagy-Related Gene Set
Genes (n = 232) involved directly or indirectly in autophagy assembled in the Human Autophagy Database (HADb, http://autophagy.lu/clustering/index.html), as previously described,15 were combined with 394 autophagy-related genes acquired from the GO_AUTOPHAGY gene set in the Molecular Signatures Database v6.2 (MSigDB, http://software.broadinstitute.org/gsea/msigdb); by eliminating overlapping genes in the two databases, an autophagy-related gene set comprising 531 genes was finally constructed.
Gene Screening and Gene Signature Development
We performed univariate Cox regression with 531 autophagy-related genes in two datasets (138 RNA-seq data from CGGA and 152 RNA-seq data from TCGA). Fourteen genes were significantly associated with overall survival in two datasets (p value < 0.05). We checked collinearity between the genes by calculating the variance inflation factor (VIF) and tolerance statistic. All VIF values were below the commonly suggested cut-off of 10 and all tolerance values were greater than 0.1. And the regression coefficients for each gene calculated using the CGGA dataset were used to build a gene signature, as follows:
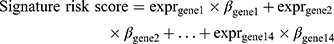
where “expr” indicates gene expression level and “β” indicates the regression coefficient for each gene.
A risk score was developed by a linear combination of the expression levels of the 14 genes, weighted by regression coefficients calculated, by univariate Cox regression analysis for CGGA data.
Patients were assigned into high- or low-risk groups using the median calculated risk score as a cut-off value.
Gene Ontology and Gene Set Enrichment Analysis (GSEA)
Genes significantly correlated with risk score (Pearson |R| > 0.4, p < 0.05) in the CGGA dataset were filtered by Pearson correlation analysis. Then, risk score positively or negatively associated genes were chosen to perform gene ontology (GO) analysis in DAVID (https://david.ncifcrf.gov/).16 Gene set enrichment analysis (GSEA) was conducted to identify gene sets that differed significantly between the high- and low-risk patient groups, using GSEA 3.0 software (http://www.broadinstitute.org/gsea/index.jsp).17 Max gene set size was 500 and min size was 15. Number of permutations was 1000. In the analysis results, it was generally believed that the pathways were significantly enriched when |NES| > 1, NOM p-value < 0.05, and FDR q-value < 0.25.
Estimate
“Estimation of STromal and Immune cells in MAlignant Tumours using Expression data” (ESTIMATE) is a method to predict the ratio of stromal and immune cells in the bulk tumor with gene expression signatures.18 Using the ESTIMATE R package (https://sourceforge.net/projects/estimateproject/), we calculated the immune score, stromal score, ESTIMATE score as well as tumor purity of all samples from CGGA and TCGA datasets.
Statistical Analysis
R language (version 3.5.1, https://www.r-project.org/) was the main data analysis and mapping tool. The 14 genes were clustered using the “cluster” function provided in the R package pheatmap. The “Coxph” function in the survival package was used for univariate and multivariate Cox regression analysis. Other figures were drawn using R packages, including ggpubr, pROC,19 gglpot2, Hmisc, estimate18 and circlize. Kaplan-Meier estimates were used for survival analysis, with a two-sided log-rank test. Differences in pathological features between the two patient groups were evaluated using the Chi-square test. Values of p < 0.05 were considered significant.
Results
Gene Screening in GBM
We analyzed 531 autophagy-related genes, including 232 genes from the Human Autophagy Database (HADb) and 394 genes from the GO_AUTOPHAGY gene set from MSigDB. To screen for genes associated with clinical prognosis, univariate Cox regression analysis was performed in two datasets (138 RNA-seq data from CGGA and 152 RNA-seq data from TCGA, respectively). Finally, 14 genes were identified as significantly associated with OS (p < 0.05). Clustering of the 138 patients with GBM from the CGGA dataset with expression profiles for the 14 genes identified two robust groups (Figure 1A). Survival analysis indicated a significant difference in OS between the two groups (Figure 1B, p = 0.0023). Validation analysis using data from 152 patients with GBM from TCGA dataset generated similar results (Figure S1). These findings suggest that the 14 genes associated with autophagy have strong prognostic value; therefore, these genes were chosen for inclusion in a prognostic gene signature. Next, we generated a heatmap demonstrating the relationship between gene signature risk score and the 14 genes (Figure 1C and Figure S2). The trend was striking: the expression of the top nine genes (MTMR14, LENG9, P4HB, TCIRG1, HSPA5, DRAM1, CTSD, S100A8 and CCL2) increased with signature risk score and the bottom five genes (MSTN, UBQLN4, PHYHIP, RRAGB and ZKSCAN3) was opposite. Hazard ratio (HR) values for the 14 genes were calculated by univariate Cox regression from the CGGA dataset (Table 1). HR values for the top nine genes were >1, while those for the other five genes were <1. These suggested that the potential prognostic value of these 14 genes in GBM remained to be further investigated.
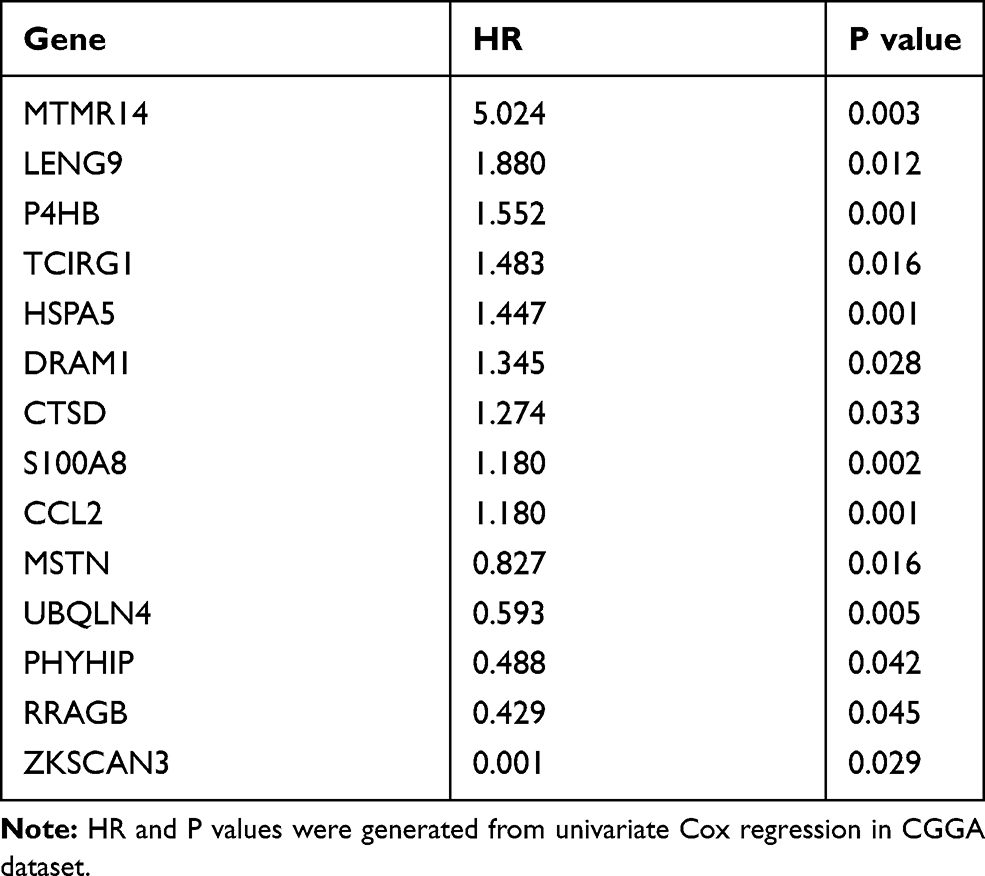 |
Table 1 The HR and p values of 14 Genes |
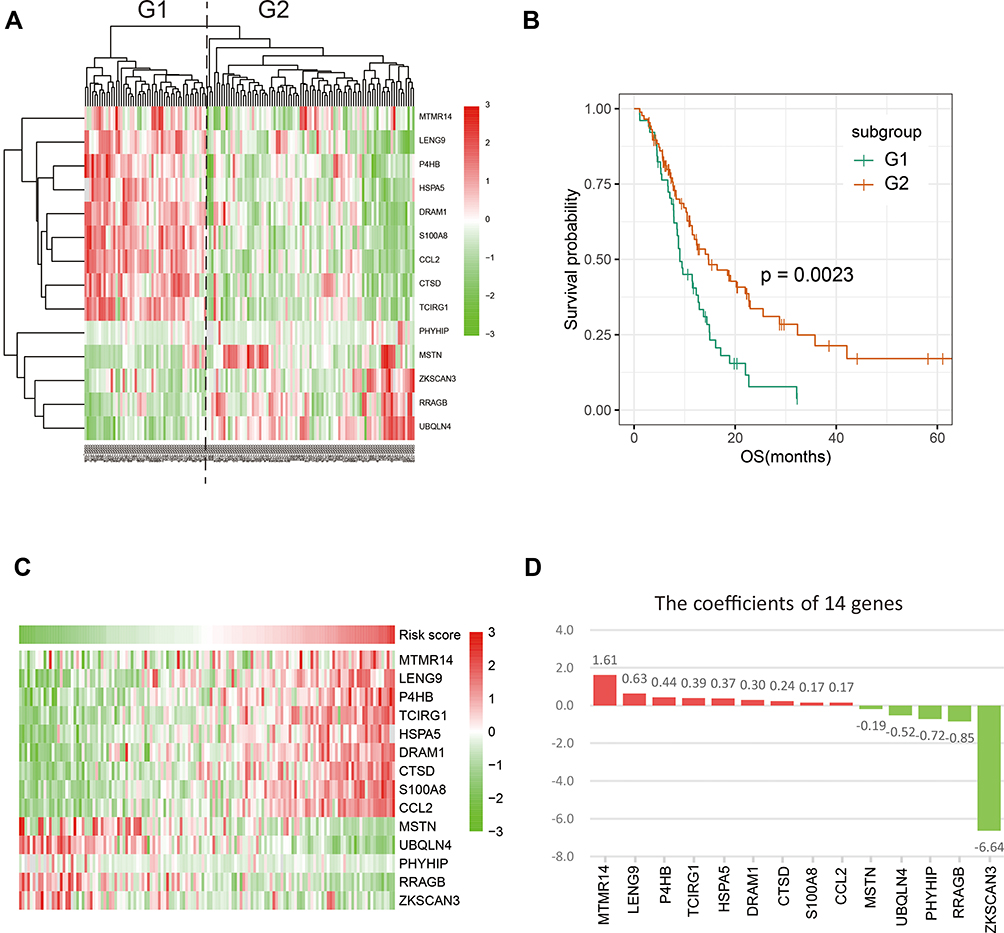 |
Figure 1 Fourteen autophagy-related genes were identified. (A) COX univariate analysis screened out 14 genes and grouped CGGA glioblastoma patients into two groups. (B) The prognosis of the two groups was significantly different (p = 0.0023). (C) The expression pattern of 14 genes in CGGA database. The top nine genes increased with risk score, while next five genes were reversed. (D) The coefficients of 14 genes calculated in CGGA dataset. |
Construction of a Signature Predicting Prognosis in GBM Using the 14 Autophagy-Related Genes
Next, the 14 selected genes were used to construct a signature. We calculated the coefficients of the 14 genes using univariate Cox regression analysis of the CGGA dataset (Figure 1D). The algorithm was as follows: signature risk score = (MTMR14*1.61) + (LENG9*0.63) + (P4HB*0.44) + (TCIRG1*0.39) + (HSPA5*0.37) + (DRAM1*0.30) + (CTSD*0.24) + (S100A8*0.17) + (CCL2*0.17) + (MSTN*–0.19) + (UBQLN4*–0.52) + (PHYHIP*–0.72) + (RRAGB*–0.85) + (ZKSCAN3*–6.64). To evaluate the classification efficacy of the signature, we divided CGGA patients into high- and low-risk groups, based on the median risk scores, and observed significant clinical and molecular differences between the two groups (Figure 2A and Table 2). In the high-risk group, patients tended to be older than those in the low-risk group (p < 0.001). Further, more classical and mesenchymal tumor subtypes were found in the high-risk (94%) than in the low-risk (46%) group (p < 0.001). In addition, we found that IDH wild-type patients accounted for a large proportion in the high-risk group (97%), while IDH wild-type patients comprised only 55% in the low-risk group (p < 0.001). Moreover, 58% and 29% of samples carried MGMT promoter methylation in the low- and high-risk groups, respectively (p < 0.01), while 74% and 46% of low-risk and high-risk patients, respectively, had received chemotherapy (p < 0.01).
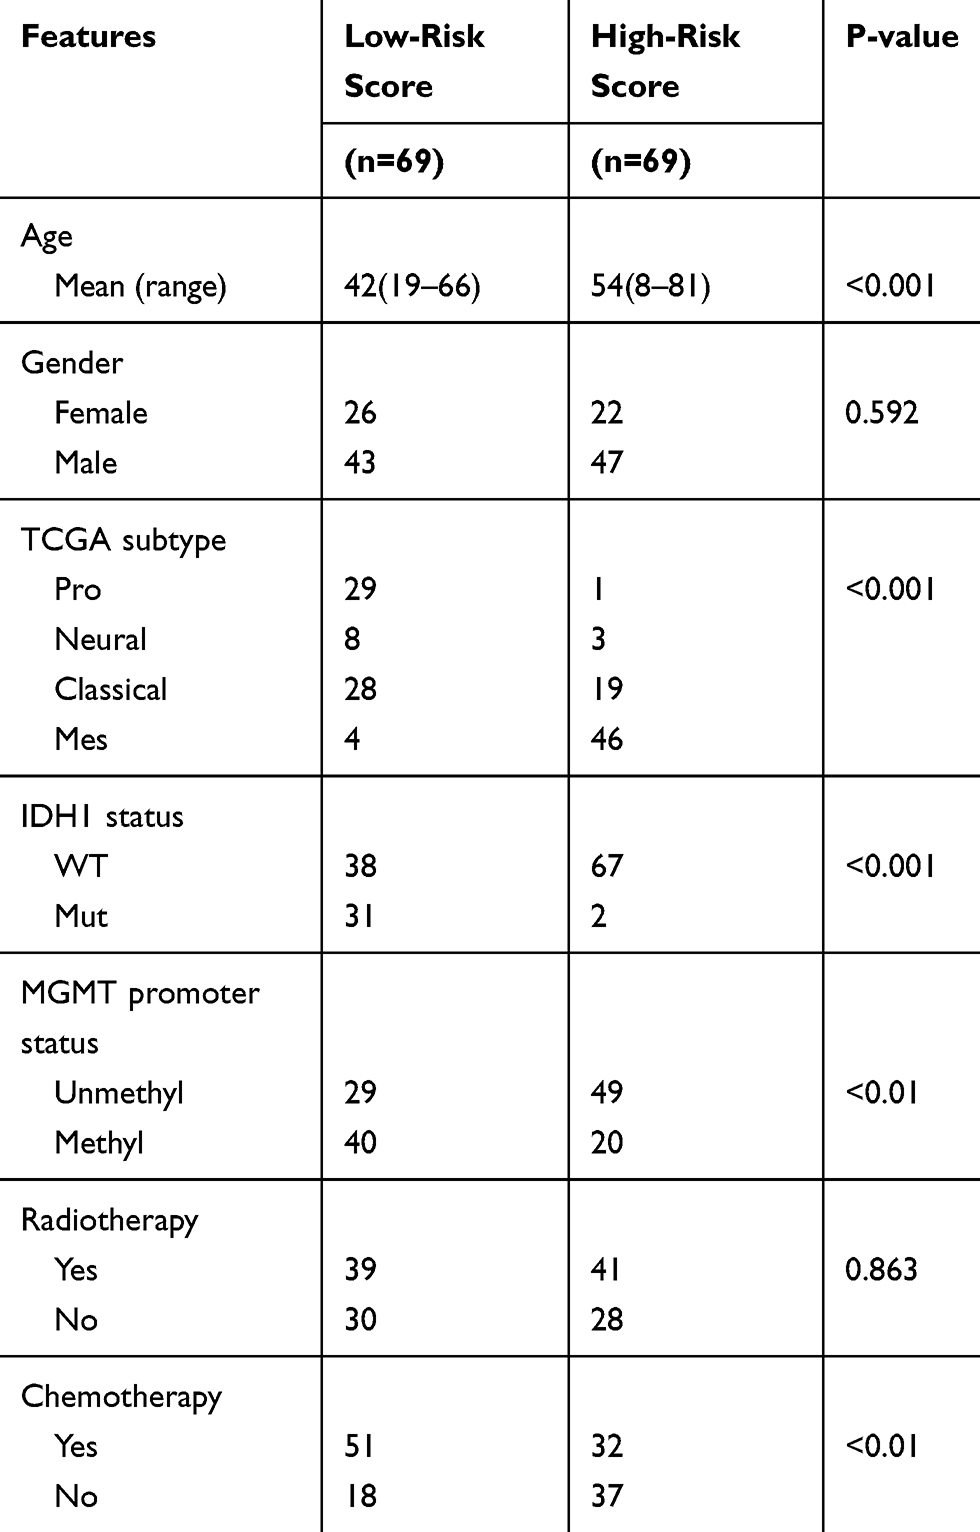 |
Table 2 Clinicopathological Factors of Glioblastoma Patients in CGGA Cohorts |
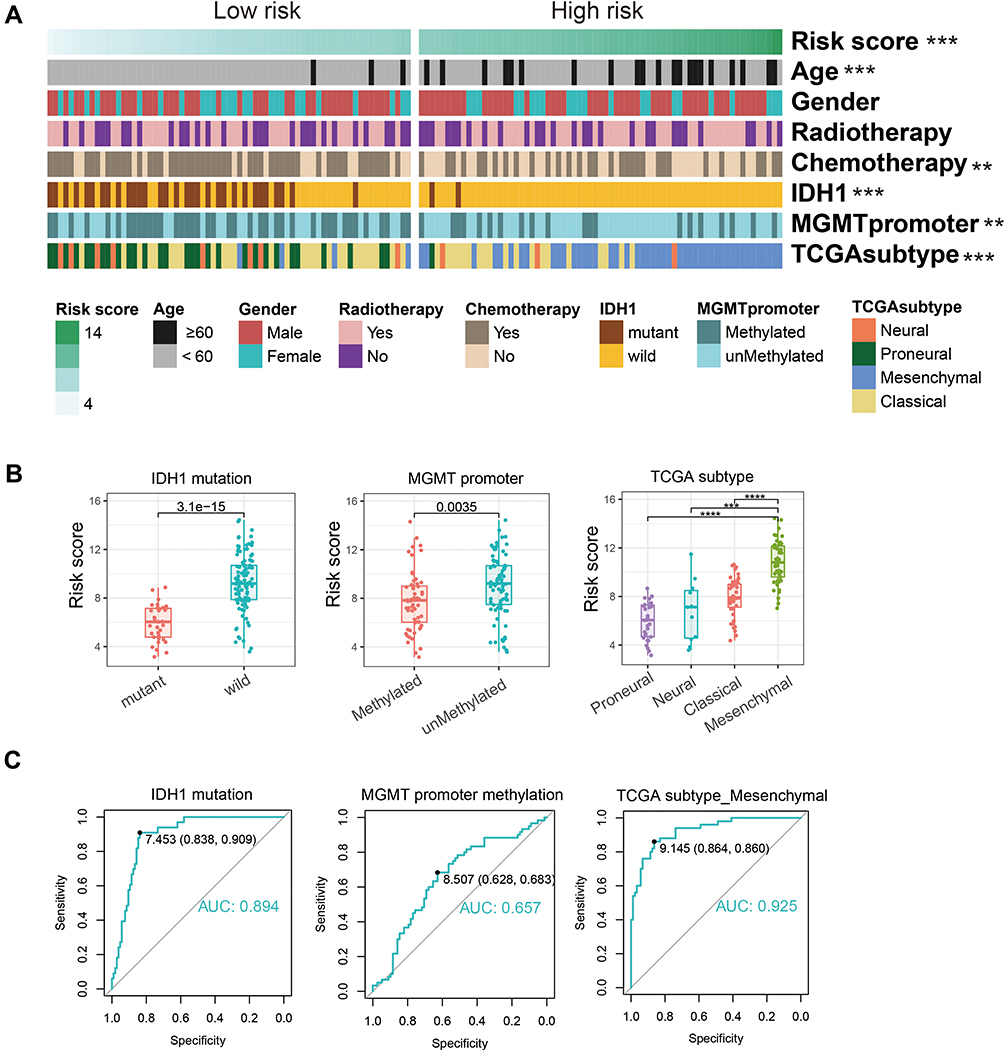 |
Figure 2 Correlation between signature risk score and clinicopathology in CGGA dataset. (A) The clinicopathologic information of 138 glioblastoma patients in CGGA. Patients were arranged by the increasing risk score and divided into two groups based on median risk score. (B) Distribution of the risk score in patients stratified by IDH1 status, MGMT promoter methylation, and TCGA subtypes. (C) ROC curve was utilized to evaluate the predictive efficacy of risk score for IDH1 mutation, MGMT promoter methylation, and TCGA mesenchymal subtypes. **P < 0.01, ***P < 0.001, ****P < 0.0001. Abbreviations: CGGA, Chinese Glioma Genome Atlas; IDH1, isocitrate dehydrogenase 1; MGMT, methylguanine methyltransferase; TCGA, The Cancer Genome Atlas. |
Next, we divided patients into groups according to their molecular characteristics and compared the risk scores between the groups (Figure 2B). We observed significantly higher risk scores in IDH wild-type patients and our signature could accurately predict the IDH mutation status (AUC = 0.894, specificity = 0.838, sensitivity = 0.909, Figure 2C). In MGMT promoter unmethylated patients and mesenchymal subtype patients, we observed the same situation.
Using coefficients derived from the CGGA dataset, we formulated a risk signature score for each patient in TCGA dataset as a validation cohort. Consistent with the above results, there were significant differences between high- and low-risk groups (Figure S3 and Table S1). In summary, patients classified as high risk using our 14-gene signature had more malignant characteristics than those classified as low risk.
Prognostic Value of Autophagy-Related Signature in GBM
Given the close relationship between the 14 autophagy-related gene signature and patient clinical characteristics, we sought to assess the clinical prognostic efficacy of the signature. We calculated risk scores for each patient using the 14 gene expression signature and divided them into high-risk and low-risk groups, based on the median risk score cut-off value. OS was shorter in the high-risk than the low-risk group (p = 0.00037, Figure 3A). According to the WHO CNS tumor classification (2016), glioblastoma (GBM, WHO IV) can be further divided into IDH-mutant and IDH-wild-type. Due to clinical and prognostic differences between the two subgroups, we next verified the prognostic value of our signature in the two subgroups. We found patients in high-risk group lived shorter than low-risk group both in IDH-wildtype GBM (p = 0.01) and IDH-mutant GBM (p = 0.037).
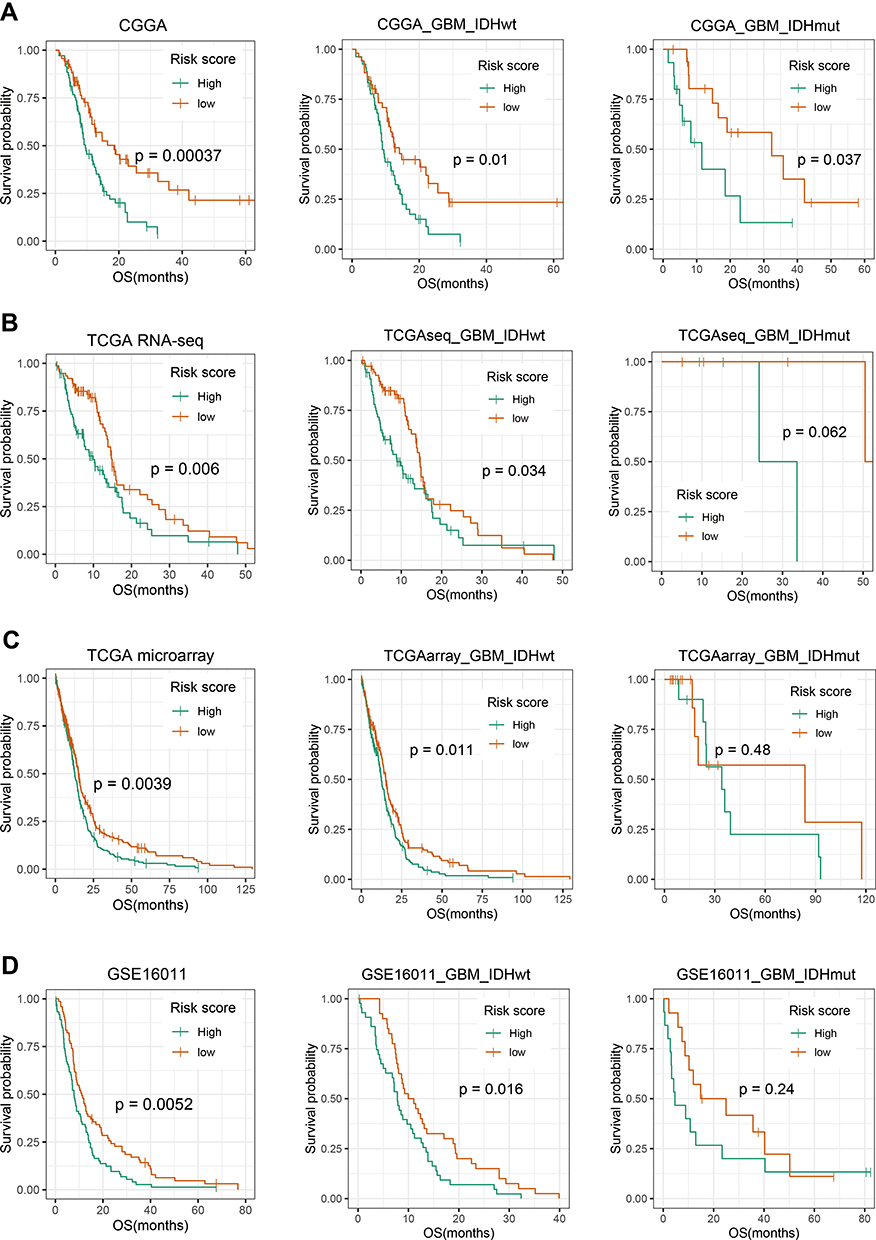 |
Figure 3 Prognostic significance of the autophagy-related gene signature in GBM. Patients were from CGGA (A), TCGA with RNA-seq data (B), TCGA with microarray data (C) and GSE16011 (D). Kaplan–Meier survival analysis showed that high-risk group conferred a significantly worse prognosis in GBM, especially in GBM with IDH wild-type. P-value shown in survival was determined by a log-rank test between the two groups. |
In addition to CGGA as training cohort, TCGA sequencing data, microarray data and GSE16011 microarray data were included as the verification cohort (Figure 3B–D). Among IDH-wildtype patients, the prognosis remained significantly different (p < 0.05). And among IDH-mutant patients, the high-risk group had a worse survival trend. Similar survival curves in three verification cohorts further demonstrated the excellent prognostic value of our signature, especially in IDH-wildtype GBM.
The Autophagy-Related Signature Is an Independent Prognostic Indicator in Patients with GBM
To verify the independence of signature, we carried out univariate and multivariate COX regression analysis. Our result indicated that autophagy-related signature was significantly associated with overall survival (HR=1.921, 95% CI=1.013–3.644, p value=0.045), independent of clinical and pathological indicators, including age, gender, KPS, IDH1 status, MGMT promoter methylation, chemotherapy and radiotherapy (Table 3). Consistently, autophagy-related signature was verified as independent indicator in TCGA verification cohort (HR=1.718, 95% CI=1.122–2.629, p value=0.013).
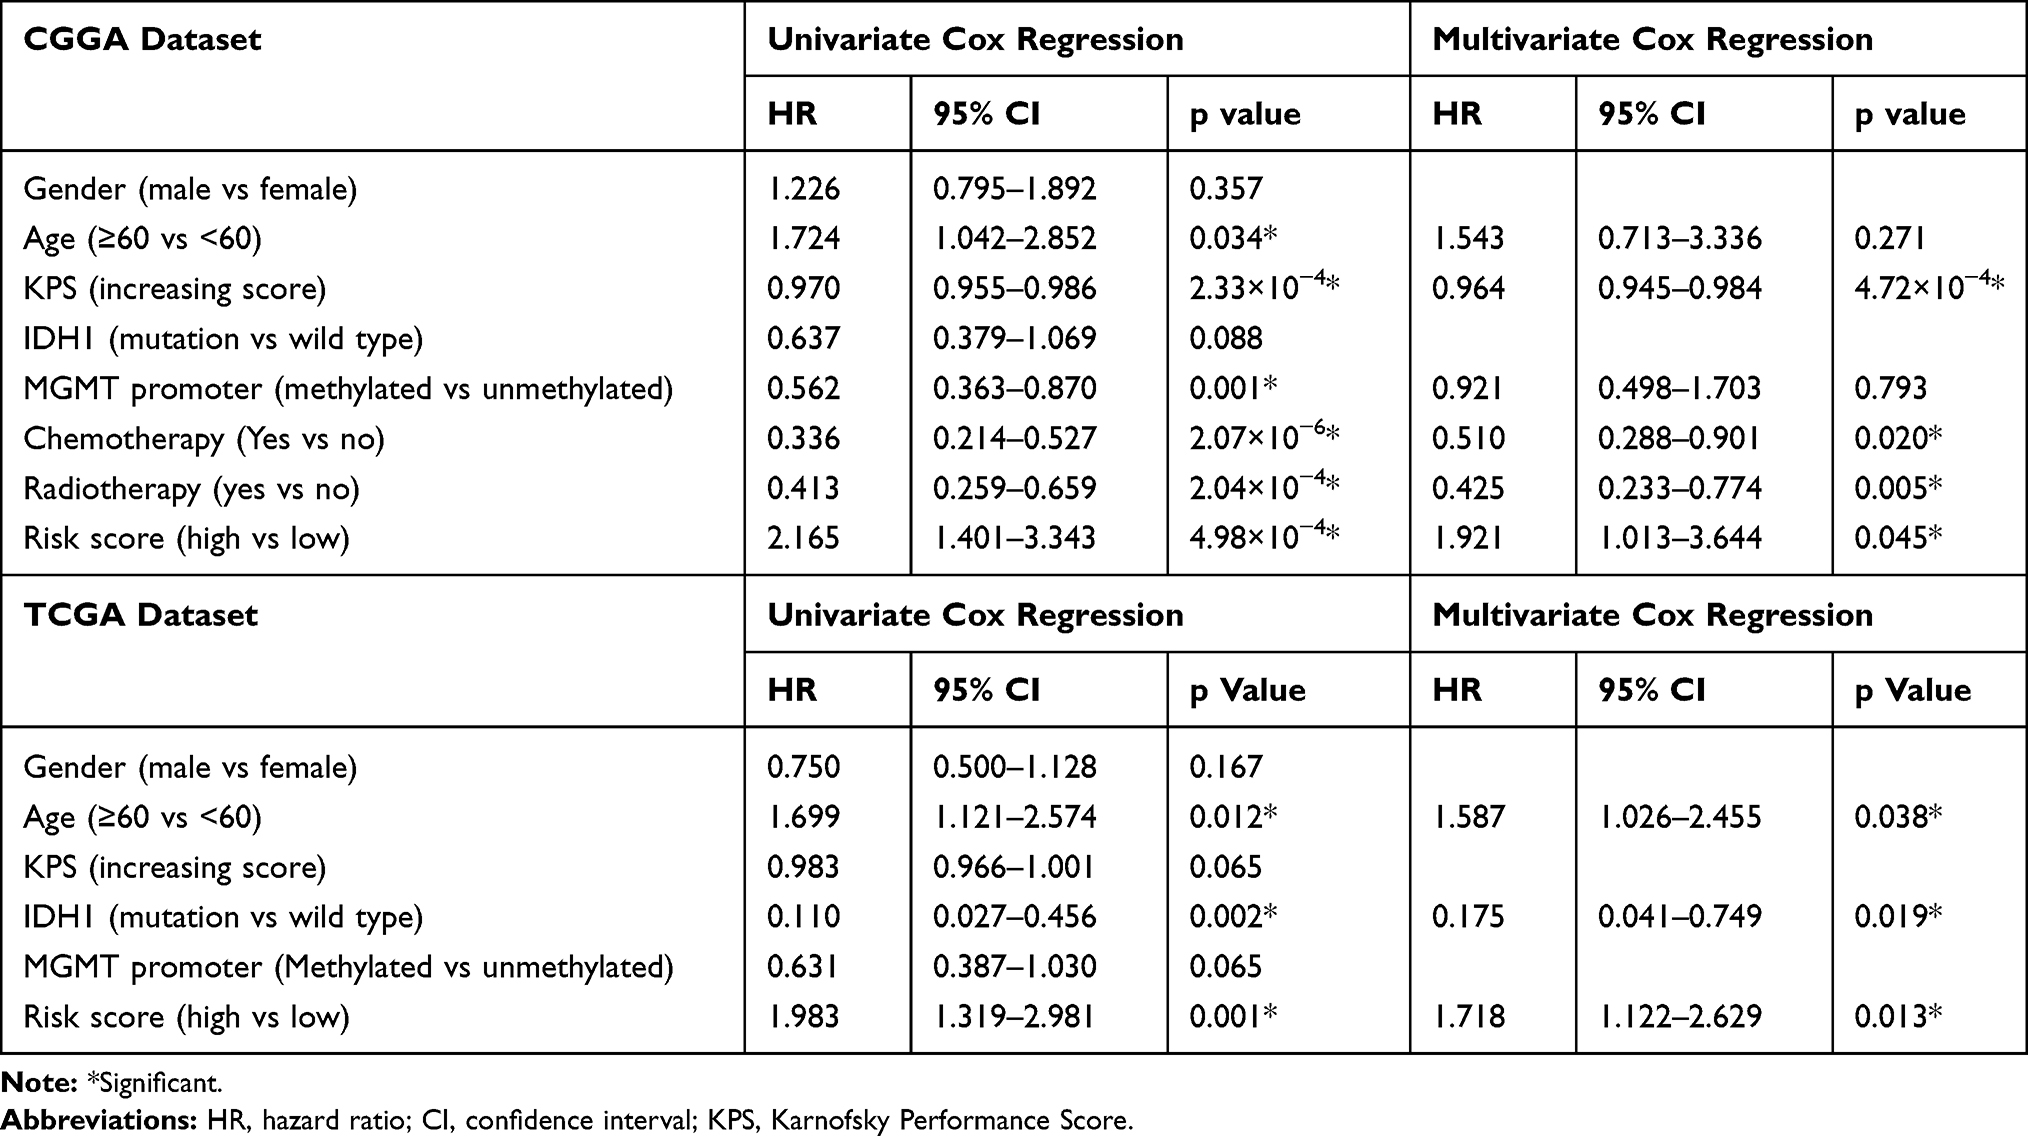 |
Table 3 Variables Related to OS in Glioblastomas: Univariate and Multivariate Analysis |
Functional Characteristics of the GBM Autophagy-Related Signature
To study alterations in signature-related functions, gene ontology (GO) analysis of signature-related genes was conducted using the CGGA dataset. Pearson correlation analysis was conducted to filter 3504 signature-related genes, including 1669 positively (Pearson R > 0.4, p < 0.05) and 1835 negatively (Pearson R < −0.4, p < 0.05) correlated genes. Positively correlated genes were mainly involved in the tumor immune environment, including “inflammatory response”, “immune response”, “extracellular matrix organization”, “chemotaxis”, and “leukocyte migration”, among others (Figure 4A, Table S2); however, negatively correlated genes were involved in normal physiological processes, such as “transcription, DNA-templated”, “nervous system development”, “neurotransmitter secretion”, and “regulation of exocytosis” (Figure 4B, Table S3).
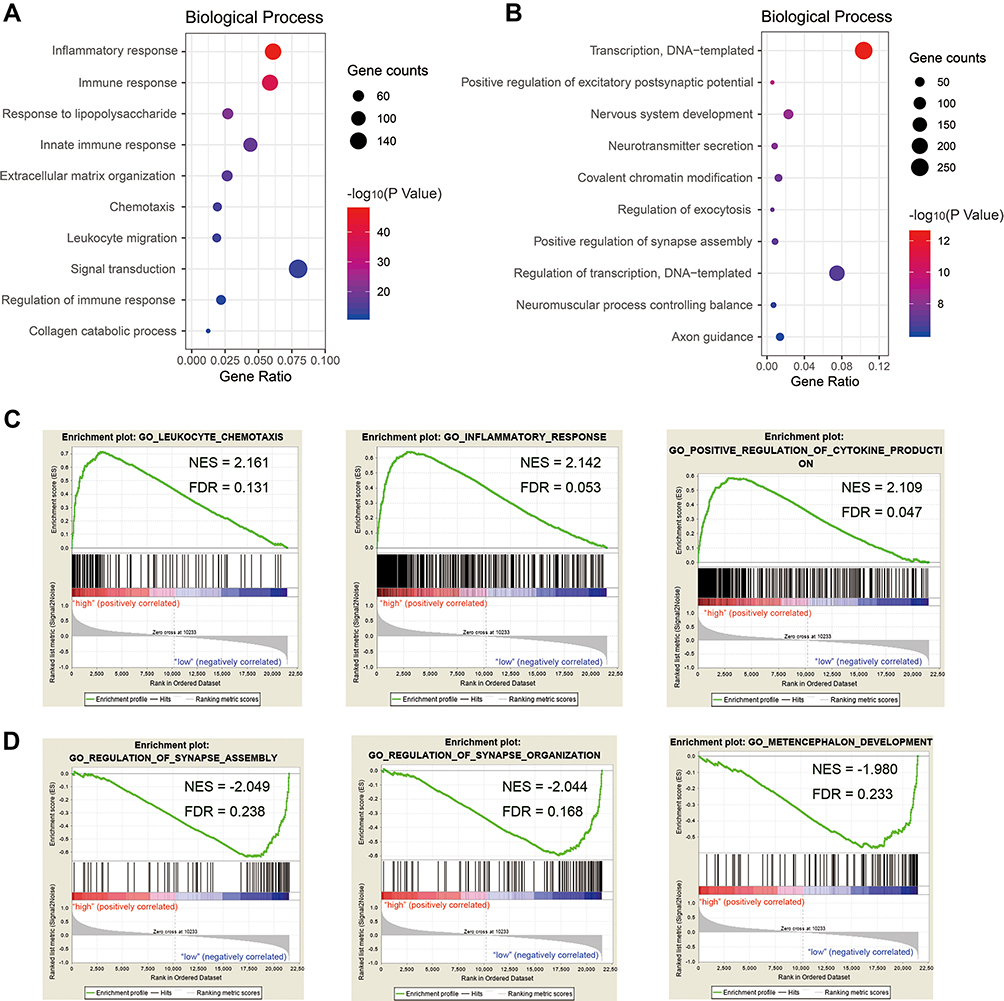 |
Figure 4 Functional characteristics of autophagy-related signature in GBM. Gene Ontology (GO) analysis of biological processes was performed to analyze signature positively related genes (A) and negatively related genes (B). Gene set enrichment analysis (GSEA) revealed Go terms enriched in high-risk group (C) and low-risk group (D). |
Further, we performed GSEA in high-risk and low-risk patients (Table S4, enrichment in high-risk group; Table S5, enrichment in low-risk group). Consistently, we found GO terms related to immunity were enriched in high-risk group, covering “leukocyte chemotaxis” (NES=2.161, FDR q-value=0.131), “inflammatory response” (NES=2.142, FDR q-value=0.053) and “positive regulation of cytokine production” (NES=2.109, FDR q-value=0.047, Figure 4C). Whereas Go terms including “regulation of synapse assembly” (NES= −2.049, FDR q-value=0.238), “regulation of synapse organization” (NES= −2.044, FDR q-value=0.168) and “metencephalon development” (NES= −1.980, FDR q-value=0.233) were enriched in low-risk group, implying normal neurodevelopment (Figure 4D).
To investigate the immune status in high-risk tumors, we carried out ESTIMATE analysis (Table S6, CGGA; Table S7, TCGA). In both datasets, we found that immune, stromal, and ESTIMATE scores were significantly elevated in the high-risk groups, while tumor purity clearly decreased (Figure 5A and B, p value < 0.001). Next, we selected immune checkpoints (PD1, PD-L1, TIM-3, B7-H3, B7-H4, LAG3)20 and inflammatory genes (INF-α, INF-β, TNF-α, IL-6, IL-17, CCL2, CXCL2 and HLA-A)21 for Pearson correlation analysis with risk score (RS, Figure 5C and D). We found immune checkpoints were positively related to risk score (RS), indicating immune suppression in high-risk tumors. Among inflammatory genes, the expression of IL-6, CCL2, CCXCL2 and HLA-A were obviously correlated with risk score, implying enrichment of T cells and macrophage-associated immunity in the high-risk group.
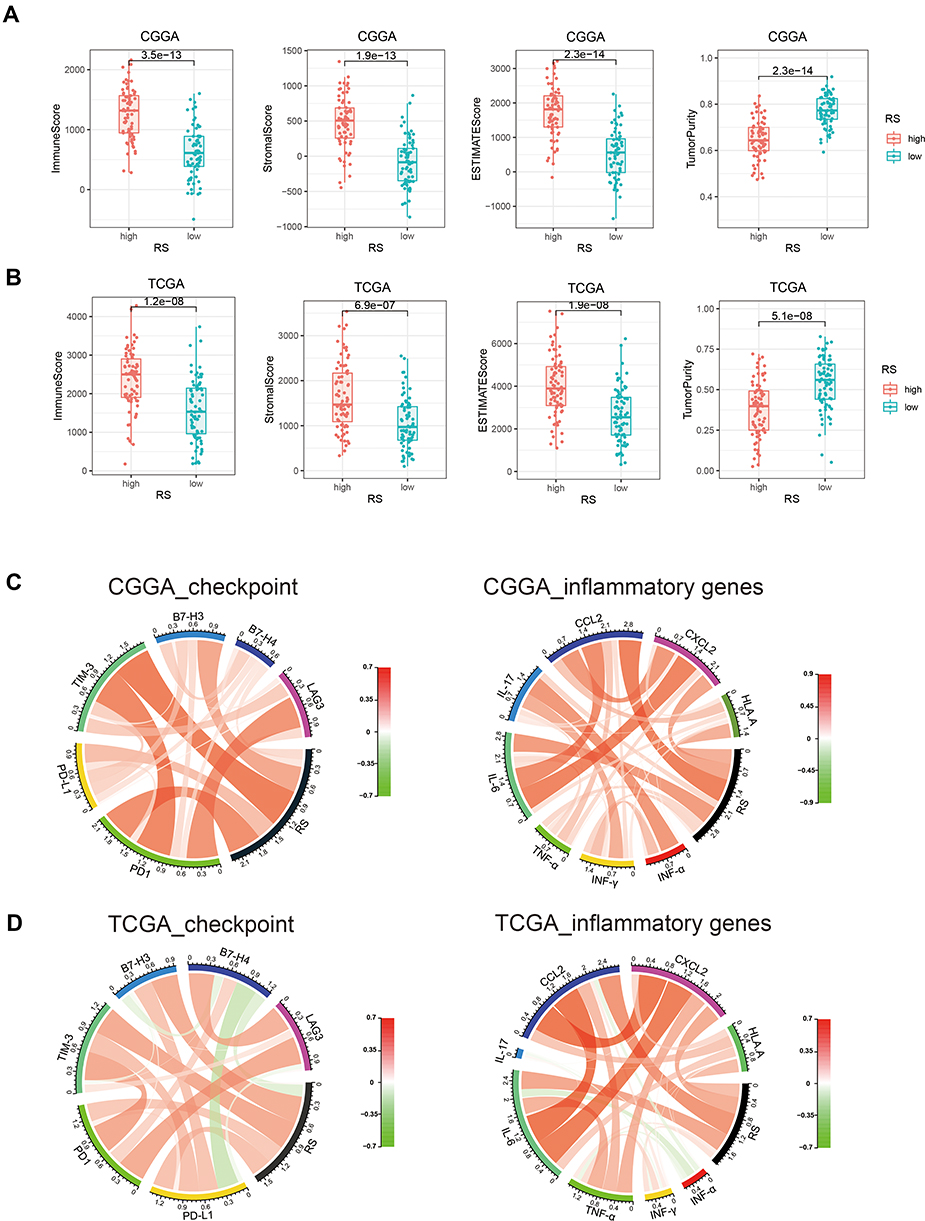 |
Figure 5 Comparison of difference in immune status between high-risk and low-risk groups. With ESTIMATE tumor purity algorithm, we calculated immune score, stromal score and ESTIMATE score of two group patients in CGGA (A) and TCGA (B) dataset. Circos plots showed correlation analysis between risk score (RS) and immune checkpoints/inflammatory genes in CGGA (C) and TCGA (D) dataset. In circos plots, red/green scale bar represented Pearson’s correlation coefficient, which had a value between +1 and −1, where 1 is total positive linear correlation, 0 is no linear correlation, and −1 is total negative linear correlation. |
Discussion
Numerous studies demonstrate that disorders of autophagy are closely related to the occurrence of various cancers. Autophagy deficiency induced by allele deletion of Beclin1 increases tumor cell apoptosis and delays the progression of breast cancer in the presence of P53.22 Common human cancer cell lines with RAS activating mutations generally exhibit higher autophagy activity, and the downregulation of important autophagy-related proteins significantly inhibits the growth of these cells.23 In lung cancer, knockout of the autophagy gene, Atg7, led to tumor progression to oncocytomas, rather than adenomas and carcinomas, and tumor proliferation was markedly inhibited.24 Numerous malignancies are associated with autophagy activation, with proteins related to autophagosome formation and maturation detected;25,26 however, due to its clear heterogeneity, autophagy-related gene expression in glioblastoma remains controversial. Previous studies demonstrated that downregulation of LC3B-II and Beclin leads to decreased autophagy, inducing glioblastoma progression.27 In contrast, more recent studies show that high levels of LC3/beclin expression are associated with poor prognosis in patients with GBM.28 In some cell stress situations, such as during activation of malignant phenotypes, changes in the expression of a subset of genes may regulate autophagy. Therefore, study of the expression of autophagy-related gene sets has clinical implications.
In the present study, we screened 14 autophagy-related genes that could be used to cluster patients with glioblastoma into two groups, with significant differences in clinicopathology and prognosis. Next, we constructed a signature based on 14 genes, reflecting autophagy status in glioblastoma. We found that most high-risk patients were IDH wild-type, MGMT promoter non-methylated, and had more malignant tumor subtypes (including classical and mesenchymal), predicting poor prognosis. Cox regression analysis further confirmed the independent prognostic value of our signature.
Both functional analysis using DAVID and GSEA revealed an increase in immune and inflammatory responses in the high-risk group, indicating an interaction between autophagy and the immune microenvironment. A remarkable recent study suggested that autophagy regulates tumor immunity and thereby modulates malignancy.29 In breast cancer with up-regulated autophagy, CD8+ cytotoxic T lymphocytes were enriched and immunosuppressive FOXP3+ regulatory T cells were reduced.30 By targeting BECN1 to inhibit autophagy, Baginska et al restored granzyme B levels in hypoxic cells in vitro, and induced NK-mediated tumor cell killing in vivo.31 The expression of the immune checkpoint regulator, PD-L1, in lung cancer cells was down-regulated by activation of autophagy using an mTOR inhibitor.32 To further investigate the relationship between our autophagy-related signature and immunity in glioblastoma, we conducted ESTIMATE analysis, and found an increase in immune/stromal components, and a decrease in tumor purity, in high-risk patients. We also conducted further analysis of immune checkpoint and inflammatory genes and found that an immunosuppressive state and T cell- and macrophage-related immune factors were enriched in the high-risk group.
Much preclinical evidence suggests that inhibition of autophagy improves clinical outcomes in patients with cancer.33,34 Meanwhile, it has been widely reported that inhibition of autophagy increases the sensitivity of cancer to anti-cancer drugs.35,36 Further, concurrent regulation of autophagy can significantly improve the therapeutic effects of cancer immunotherapy37 For example, alpha-TEA can stimulate autophagy to enhance antigen presentation to CD8 T cells as a strategy for improving tumor immunotherapy.38 Spleen tyrosine kinase (Syk)-mediated autophagy stimulates cell surface major histocompatibility protein expression and CD4 T cell activation to enhance anti-tumor immunotherapy.39 In the future, the relationship between autophagy and immunity needs to be further studied, and alterations in glioma cells autophagy may play an important role in immune regulation.
Conclusions
In summary, here we identify 14 autophagy-related genes that can be used to stratify patients with glioblastoma by clinical and pathological features. Further, we built a 14-autophagy-related gene expression-based signature, which could accurately predict important molecular markers and survival in patients with glioblastoma. Our study provided a new understanding of autophagy status in glioblastoma.
Acknowledgments
This study was funded by Beijing Talents Foundation from Organization department of Municipal committee of the CPC (2017000021223ZK32); Beijing Nova Program (Z171100001117022); The National Key Research and Development Plan (No. 2016YFC0902500); Beijing Science and Technology Plan (Z141100000214009); Capital Medical Development Research Fund (2016-1-1072); Beijing Municipal Administration of Hospitals Clinical Medicine Development of Special Funding Support (ZYLX201708); National Natural Science Foundation of China (NSFC)/Research Grants Council (RGC) Joint Research Scheme (81761168038); Beijing Municipal Administration of Hospitals’ Mission Plan (SML20180501); National Natural Science Foundation of China (81903078); National Natural Science Foundation of China (81972337); and National Natural Science Foundation of China (81902528).
Disclosure
The authors report no conflicts of interest in this work.
References
1. Mizushima N. A brief history of autophagy from cell biology to physiology and disease. Nat Cell Biol. 2018;20(5):521–527. doi:10.1038/s41556-018-0092-5
2. Folkerts H, Hilgendorf S, Vellenga E, Bremer E, Wiersma VR. The multifaceted role of autophagy in cancer and the microenvironment. Med Res Rev. 2019;39(2):517–560. doi:10.1002/med.21531
3. Pan H, Cai N, Li M, Liu GH, Izpisua Belmonte JC. Autophagic control of cell ‘stemness’. EMBO Mol Med. 2013;5(3):327–331. doi:10.1002/emmm.201201999
4. Hou J, Han ZP, Jing YY, et al. Autophagy prevents irradiation injury and maintains stemness through decreasing ROS generation in mesenchymal stem cells. Cell Death Dis. 2013;4:e844.
5. Tsukada M, Ohsumi Y. Isolation and characterization of autophagy-defective mutants of Saccharomyces cerevisiae. FEBS Lett. 1993;333(1–2):169–174. doi:10.1016/0014-5793(93)80398-e
6. Takamura A, Komatsu M, Hara T, et al. Autophagy-deficient mice develop multiple liver tumors. Genes Dev. 2011;25(8):795–800. doi:10.1101/gad.2016211
7. Gan B, Guan JL. FIP200, a key signaling node to coordinately regulate various cellular processes. Cell Signal. 2008;20(5):787–794. doi:10.1016/j.cellsig.2007.10.021
8. Chen S, Wang C, Yeo S, et al. Distinct roles of autophagy-dependent and -independent functions of FIP200 revealed by generation and analysis of a mutant knock-in mouse model. Genes Dev. 2016;30(7):856–869. doi:10.1101/gad.276428.115
9. Zhang C, Lin M, Wu R, et al. Parkin, a p53 target gene, mediates the role of p53 in glucose metabolism and the Warburg effect. Proc Natl Acad Sci U S A. 2011;108(39):16259–16264. doi:10.1073/pnas.1113884108
10. Chourasia AH, Tracy K, Frankenberger C, et al. Mitophagy defects arising from BNip3 loss promote mammary tumor progression to metastasis. EMBO Rep. 2015;16(9):1145–1163. doi:10.15252/embr.201540759
11. Jiang T, Mao Y, Ma W, et al. CGCG clinical practice guidelines for the management of adult diffuse gliomas. Cancer Lett. 2016;375(2):263–273. doi:10.1016/j.canlet.2016.01.024
12. Ostrom QT, Bauchet L, Davis FG, et al. The epidemiology of glioma in adults: a “state of the science” review. Neuro-Oncology. 2014;16(7):896–913. doi:10.1093/neuonc/nou087
13. Louis DN, Perry A, Reifenberger G, et al. The 2016 World Health Organization classification of tumors of the central nervous system: a summary. Acta Neuropathol. 2016;131(6):803–820. doi:10.1007/s00401-016-1545-1
14. Gravendeel LA, Kouwenhoven MC, Gevaert O, et al. Intrinsic gene expression profiles of gliomas are a better predictor of survival than histology. Cancer Res. 2009;69(23):9065–9072. doi:10.1158/0008-5472.CAN-09-2307
15. Moussay E, Kaoma T, Baginska J, et al. The acquisition of resistance to TNFalpha in breast cancer cells is associated with constitutive activation of autophagy as revealed by a transcriptome analysis using a custom microarray. Autophagy. 2011;7(7):760–770. doi:10.4161/auto.7.7.15454
16. Huang da W, Sherman BT, Lempicki RA. Systematic and integrative analysis of large gene lists using DAVID bioinformatics resources. Nat Protoc. 2009;4(1):44–57. doi:10.1038/nprot.2008.211
17. Subramanian A, Tamayo P, Mootha VK, et al. Gene set enrichment analysis: a knowledge-based approach for interpreting genome-wide expression profiles. Proc Natl Acad Sci U S A. 2005;102(43):15545–15550. doi:10.1073/pnas.0506580102
18. Yoshihara K, Shahmoradgoli M, Martinez E, et al. Inferring tumour purity and stromal and immune cell admixture from expression data. Nat Commun. 2013;4:2612. doi:10.1038/ncomms3612
19. Robin X, Turck N, Hainard A, et al. pROC: an open-source package for R and S+ to analyze and compare ROC curves. BMC Bioinformatics. 2011;12:77. doi:10.1186/1471-2105-12-77
20. Preusser M, Lim M, Hafler DA, Reardon DA, Sampson JH. Prospects of immune checkpoint modulators in the treatment of glioblastoma. Nat Rev Neurol. 2015;11(9):504–514. doi:10.1038/nrneurol.2015.139
21. Germano G, Allavena P, Mantovani A. Cytokines as a key component of cancer-related inflammation. Cytokine. 2008;43(3):374–379. doi:10.1016/j.cyto.2008.07.014
22. Huo Y, Cai H, Teplova I, et al. Autophagy opposes p53-mediated tumor barrier to facilitate tumorigenesis in a model of PALB2-associated hereditary breast cancer. Cancer Discov. 2013;3(8):894–907. doi:10.1158/2159-8290.CD-13-0011
23. Guo JY, Chen HY, Mathew R, et al. Activated Ras requires autophagy to maintain oxidative metabolism and tumorigenesis. Genes Dev. 2011;25(5):460–470.
24. Guo JY, Karsli-Uzunbas G, Mathew R, et al. Autophagy suppresses progression of K-ras-induced lung tumors to oncocytomas and maintains lipid homeostasis. Genes Dev. 2013;27(13):1447–1461.
25. Sun T, Li X, Zhang P, et al. Acetylation of Beclin 1 inhibits autophagosome maturation and promotes tumour growth. Nat Commun. 2015;6:7215. doi:10.1038/ncomms8215
26. Zou Q, Tan S, Yang Z, et al. NPM1 mutant mediated PML delocalization and stabilization enhances autophagy and cell survival in leukemic cells. Theranostics. 2017;7(8):2289–2304. doi:10.7150/thno.19439
27. Huang X, Bai HM, Chen L, Li B, Lu YC. Reduced expression of LC3B-II and Beclin 1 in glioblastoma multiforme indicates a down-regulated autophagic capacity that relates to the progression of astrocytic tumors. J Clin Neurosci. 2010;17(12):1515–1519. doi:10.1016/j.jocn.2010.03.051
28. CJ P, HV E, Vijayakurup V, R Menon G, Nair S, Gopala S. High LC3/Beclin expression correlates with poor survival in glioma: a definitive role for autophagy as evidenced by in vitro autophagic flux. Pathol Oncol Res. 2019;25(1):137–148. doi:10.1007/s12253-017-0310-7
29. Zhong Z, Sanchez-Lopez E, Karin M. Autophagy, inflammation, and immunity: a troika governing cancer and its treatment. Cell. 2016;166(2):288–298. doi:10.1016/j.cell.2016.05.051
30. Ladoire S, Enot D, Senovilla L, et al. The presence of LC3B puncta and HMGB1 expression in malignant cells correlate with the immune infiltrate in breast cancer. Autophagy. 2016;12(5):864–875. doi:10.1080/15548627.2016.1154244
31. Baginska J, Viry E, Berchem G, et al. Granzyme B degradation by autophagy decreases tumor cell susceptibility to natural killer-mediated lysis under hypoxia. Proc Natl Acad Sci U S A. 2013;110(43):17450–17455. doi:10.1073/pnas.1304790110
32. Lastwika KJ, Wilson W
33. Levy JMM, Towers CG, Thorburn A. Targeting autophagy in cancer. Nat Rev Cancer. 2017;17(9):528–542. doi:10.1038/nrc.2017.53
34. Levy JM, Thorburn A. Targeting autophagy during cancer therapy to improve clinical outcomes. Pharmacol Ther. 2011;131(1):130–141. doi:10.1016/j.pharmthera.2011.03.009
35. Pietrocola F, Pol J, Vacchelli E, et al. Autophagy induction for the treatment of cancer. Autophagy. 2016;12(10):1962–1964. doi:10.1080/15548627.2016.1214778
36. Thorburn A, Thamm DH, Gustafson DL. Autophagy and cancer therapy. Mol Pharmacol. 2014;85(6):830–838. doi:10.1124/mol.114.091850
37. Jiang GM, Tan Y, Wang H, et al. The relationship between autophagy and the immune system and its applications for tumor immunotherapy. Mol Cancer. 2019;18(1):17. doi:10.1186/s12943-019-0944-z
38. Li Y, Hahn T, Garrison K, et al. The vitamin E analogue alpha-TEA stimulates tumor autophagy and enhances antigen cross-presentation. Cancer Res. 2012;72(14):3535–3545. doi:10.1158/0008-5472.CAN-11-3103
39. Choi SH, Gonen A, Diehl CJ, et al. SYK regulates macrophage MHC-II expression via activation of autophagy in response to oxidized LDL. Autophagy. 2015;11(5):785–795. doi:10.1080/15548627.2015.1037061
 © 2020 The Author(s). This work is published and licensed by Dove Medical Press Limited. The
full terms of this license are available at https://www.dovepress.com/terms
and incorporate the Creative Commons Attribution
- Non Commercial (unported, 3.0) License.
By accessing the work you hereby accept the Terms. Non-commercial uses of the work are permitted
without any further permission from Dove Medical Press Limited, provided the work is properly
attributed. For permission for commercial use of this work, please see paragraphs 4.2 and 5 of our Terms.
© 2020 The Author(s). This work is published and licensed by Dove Medical Press Limited. The
full terms of this license are available at https://www.dovepress.com/terms
and incorporate the Creative Commons Attribution
- Non Commercial (unported, 3.0) License.
By accessing the work you hereby accept the Terms. Non-commercial uses of the work are permitted
without any further permission from Dove Medical Press Limited, provided the work is properly
attributed. For permission for commercial use of this work, please see paragraphs 4.2 and 5 of our Terms.