")
Back to Journals » International Journal of General Medicine » Volume 15
Prognostic and Immunological Roles of Cell Cycle Regulator CDCA5 in Human Solid Tumors
Authors He J, Zhou X, Wang X, Zhang Q, Zhang L, Wang T, Zhu W, Liu P, Zhu M
Received 9 September 2022
Accepted for publication 2 November 2022
Published 21 November 2022 Volume 2022:15 Pages 8257—8274
DOI https://doi.org/10.2147/IJGM.S389275
Checked for plagiarism Yes
Review by Single anonymous peer review
Peer reviewer comments 2
Editor who approved publication: Dr Scott Fraser
Jing He,1,* Xin Zhou,1,* Xiaping Wang,2,* Qing Zhang,3 Lan Zhang,4,5 Tongshan Wang,1 Wei Zhu,1 Ping Liu,1 Mingxia Zhu6
1Department of Oncology, First Affiliated Hospital of Nanjing Medical University, Nanjing, 210029, People’s Republic of China; 2Department of Pathology, The Second Affiliated Hospital of Nanjing Medical University, Nanjing, 210000, People’s Republic of China; 3Department of Neurosurgery, Xinghua People’s Hospital, Xinghua, Jiangsu, 225700, People’s Republic of China; 4Department of Radiotherapy & Oncology, The Affiliated Suzhou Hospital of Nanjing Medical University, Suzhou, People’s Republic of China; 5Department of Radiation Oncology, Shanghai Tenth People’s Hospital of Tongji University, Shanghai, People’s Republic of China; 6Department of Radiation Oncology, The First Affiliated Hospital of Soochow University, Suzhou, 215006, People’s Republic of China
*These authors contributed equally to this work
Correspondence: Mingxia Zhu; Ping Liu, Email [email protected]; [email protected]
Background: There have been several studies evaluating the prognostic significance of cell division cycle associated 5 (CDCA5). However, few reports analyzed the correlation between CDCA5 and prognosis of diverse cancers based on large clinical data. We thus comprehensively analyzed CDCA5 expression and clinical significance using The Cancer Genome Atlas (TCGA) data from 31 types of solid tumors.
Methods: The expression profiles of CDCA5 were investigated across pan-cancer samples from the TCGA. Cox regression and Kaplan–Meier analysis was performed to determine CDCA5’s prognostic value. CDCA5 expression was further validated by quantitative real-time PCR (qRT-PCR) and immunohistochemistry (IHC) in lung adenocarcinoma (LUAD).
Results: We found that CDCA5 was significantly overexpressed in 22 types of tumors. Up-regulated CDCA5 was significantly related to poor survival in 13 types of tumors. Furthermore, CDCA5 expression was significantly associated with immune cell infiltration. Tumor mutation burden (TMB), microsatellite instability (MSI), and immune checkpoint expression were significantly correlated with CDCA5 expression. Additional analysis of IMvigor 210 cohort validated that patients with high level of CDCA5 had superior response to anti-PD-L1 therapy.
Conclusion: Our findings suggested that CDCA5 could provide prognostic information in most types of cancers and contributed to tumor immune microenvironment.
Keywords: cell division cycle associated 5, pan-cancer, prognosis, immune infiltration, tumor mutation burden, microsatellite instability
Introduction
CDCA5, also known as sororin, is a substrate of the anaphase-promoting complex that regulates sister chromatid cohesion.1,2 CDCA5 is also essential for ensuring that cohesin binds to chromatids during the S and G2/M phases, and for DNA repair during G2 phases.3,4 Recently, CDCA5 overexpression has been found to be related to poor prognosis, such as lung cancer,5,6 urothelial cancer,7 colorectal cancer,8 hepatocellular carcinoma,9–11 and esophageal squamous cell carcinoma.12 A recent study demonstrated the positive relationship between CDCA5 and PD-1/PD-L1 in non-small-cell lung cancer (NSCLC).13 However, there is still no systematic analysis on the relationship of CDCA5 in different human cancers based on large clinical data.
In tumorigenesis, many factors are involved, including enhanced proliferation, resistance to apoptosis, enhanced angiogenesis, evading immunity. In particular, the tumor microenvironment (TME), which mainly consists of stromal fibroblasts, together with infiltrating immune cells and the extracellular matrix, indeed plays an essential role.14,15 Moreover, in many different types of tumors, tumor-infiltrating lymphocytes could provide prognostic and predictive information.16–18 In recent years, the development of immunotherapy has revolutionized the treatment of cancer. Treatments targeting immune checkpoint inhibitors have shown significant survival benefits in patients with multiple types of advanced cancer. Unfortunately, immunotherapy is not effective for many patients.19 Therefore, it is necessary to identify targets for cancer immunotherapy by exploring the interaction between tumors and immunity.
Here, a bioinformatics approach was performed to explore CDCA5 expression profiles and the prognostic significance based on TCGA pan-cancer data. CDCA5 expression was validated by qRT-PCR and IHC in lung adenocarcinoma (LUAD) tissue. Furthermore, the correlation between CDCA5 expression and clinical features, tumor-infiltrating immune cells, tumor mutation burden (TMB), and microsatellite instability (MSI) was explored.
Methods
Data Acquisition
Gene expression profiles including raw counts and Fragments Per Kilobase of transcript per Million (FPKM)-normalized RNA-seq data, clinical data and survival data for 31 solid cancer types were obtained (https://portal.gdc.cancer.gov/) on March 20 2021 (ACC: adrenocortical carcinoma, BLCA: bladder urothelial carcinoma, BRCA: breast invasive carcinoma, CESC: cervical squamous cell carcinoma, CHOL: cholangiocarcinoma, COAD: colon adenocarcinoma, DLBC: lymphoid neoplasm diffuse large B-cell lymphoma, ESCA: esophageal carcinoma, GBM: glioblastoma multiforme, LGG: brain lower grade glioma, HNSC: head and neck squamous cell carcinoma, KICH: kidney chromophobe, KIRC: kidney renal clear cell carcinoma, KIRP: kidney renal papillary cell carcinoma, LIHC: liver hepatocellular carcinoma, LUAD: lung adenocarcinoma, LUSC: lung squamous cell carcinoma, MESO: mesothelioma, OV: ovarian serous cystadenocarcinoma, PAAD: pancreatic adenocarcinoma, PCPG: pheochromocytoma and paraganglioma, PRAD: prostate adenocarcinoma, READ: rectum adenocarcinoma, SARC: sarcoma, SKCM: skin cutaneous melanoma, STAD: stomach adenocarcinoma, TGCT: testicular germ cell tumors, THCA: thyroid carcinoma, THYM: thymoma, UCEC: uterine corpus endometrial carcinoma, UCS: uterine carcinosarcoma, UVM: uveal melanoma). Table 1 provided detailed information about pan-cancer. Patient transcriptomic and clinical data for BLCA treated with anti-PD-L1 antibody (atezolizumab) were collected from the IMvigor 210 trial data,20 where patients were cisplatin ineligible or developed tumor progression despite cisplatin-based chemotherapy before immunotherapy.
 |
Table 1 Pan-Cancer Data Acquired from TCGA |
Differential Expression Analysis of CDCA5 in Pan-Cancer
The CDCA5 expression levels were analyzed in tumor tissues and in normal tissues using the Wilcoxon test. The “ggpubr” R package was used to design a box plot. CDCA5 protein expression data was obtained from the Human Protein Atlas (HPA) database (https://www.proteinatlas.org/).
RNA Isolation and qRT-PCR Analysis
LUAD tissues were acquired from the Affiliated Suzhou Hospital of Nanjing Medical University. Total RNA was extracted from LUAD tissues by TRIzol reagent (Invitrogen, USA) following the manufacturer’s protocol. cDNA was synthesized from 2 μg total RNA using PrimeScript RT kit (Takara). Then, qRT-PCR was applied to detect CDCA5 mRNA levels (forward: 5’-CCAGCGGAAATCAGGCTCTGAA−3’ and reverse: 5’-CGATCCTCTTTAAGACGATGGGC−3’) based on an ABI StepOnePlus system (Applied Biosystems) and Sybrgreen-based qRT-PCR assays. GAPDH mRNA (forward: 5’-GTCTCCTCTGACTTCAACAGCG−3’ and reverse: 5’-ACCACCCTGTTGCTGTAGCCAA−3’) was used for normalizing samples. The PCR conditions were as follows: 95°C for 10 min, 1 cycle; 92°C for 15 seconds, 60°C for 1 min, 40 cycles. The relative expression levels of mRNA were calculated using 2−ΔΔCt method with each test performed in triplicate.
Immunohistochemistry
For CDCA5 protein expression analysis in tumor and para-tumor tissues, archival formalin fixed paraffin-embedded (FFPE) specimens of 3 matched LUAD tissues and normal tissues were obtained from the Affiliated Suzhou Hospital of Nanjing Medical University. Two independent pathologists confirmed each tumor sample. From FFPE biopsy specimens, thin sections (5 mm) of tumor and para-tumor tissues were cut. Sections were dewaxed with fresh xylene, followed by rehydration with gradient ethanol. Citrate buffer (pH 6.0) was used for antigen retrieval in a microwave oven. We used hydrogen peroxide (3%) to block endogenous peroxidase. Then, we incubated the sections overnight with primary antibody for CDCA5 (catalog no., BS-7717R; dilution, 1:200; Bioss Inc., Woburn, MA, USA). The secondary antibody was incubated at 32°C for 30 min. Liquid DAB Substrate was used to stain. After counterstaining with hematoxylin, the sections were dehydrated, and permanent media were applied.
Survival Analysis
The Kaplan–Meier method and Cox regression were used to evaluate the correlation of CDCA5 mRNA expression with survival outcomes from TCGA by the “survival” and “survminer” R packages. The CDCA5 expression levels were classified as high or low based on their median levels.
Immune Correlation Analysis
Estimating Relative Subsets of RNA Transcripts (CIBERSORT) is a metagenomic tool for identifying 22 kinds of tumor infiltrating immune cells. The CIBERSORT algorithm was used to evaluate the association between CDCA5 levels and 22 immune cells subtypes across 31 cancer types with a two tailed p< 0.0001 as criteria. The ESTIMATE method was applied to assess tumor purity.21 Stromal and immune cell scores were calculated by R packages “estimate” and “limma”. And a two tailed p< 0.001 was set as criteria for evaluation of relationships of stromal and immune cell scores with CDCA5. TMB, as well as MSI, is emerging as new biomarkers for predicting response to immunotherapy.22,23 The somatic mutation data in pan-cancer were obtained from UCSC Xena (https://tcga.xenahubs.net). TMB was defined as mutations (Mut) per one million coding bases (Mb) and was calculated for each sample by Perl language.24–26 We used MANTIS to estimate MSI across 31 cancer types.23 The correlation between TMB/MSI and CDCA5 levels was evaluated by Spearman correlation analysis. Here, we also evaluated the relationship of CDCA5 expression with common checkpoint genes by pearson’s correlation analysis. “Reshape2” and “RColorBrewer” packages were used to provide the visualization results. “RColorBrewer” was used to configure colors and “Reshape2” was used to interact with wide-format and long-format data.
Gene Set Enrichment Analysis
Gene set enrichment analysis (GSEA) was performed by cluster Profiler R package to investigate the biological significance between CDCA5 high expression and low expression groups in Gene Ontology (GO) and Kyoto Encyclopedia of Genes and Genomes (KEGG). Enrichment significance was determined by |NES|>1, NOM p<0.05, and FDR q<0.25.
Results
Expression Levels of CDCA5 in Pan-Cancer
CDCA5 mRNA expression was evaluated in 31 types of solid tumors from the TCGA database. The findings revealed that CDCA5 was significantly overexpressed in 22 tumors, including BLCA, BRCA, CESC, CHOL, COAD, ESCA, GBM, HNSC, KICH, KIRC, KIRP, LIHC, LUAD, LUSC, PAAD, PCPG, PRAD, READ, SARC, STAD, THCA and UCEC (Figure 1A). Subsequently, we explored CDCA5 protein expression from the HPA cohort. The protein expression of CDCA5 was detected in human normal tissues and most types of cancers (Figure 1B and C). Representative IHC staining of CDCA5 in BRCA, CECS, COAD, LUAD and THCA normal and tumor tissues was shown in Supplementary Figure 1.
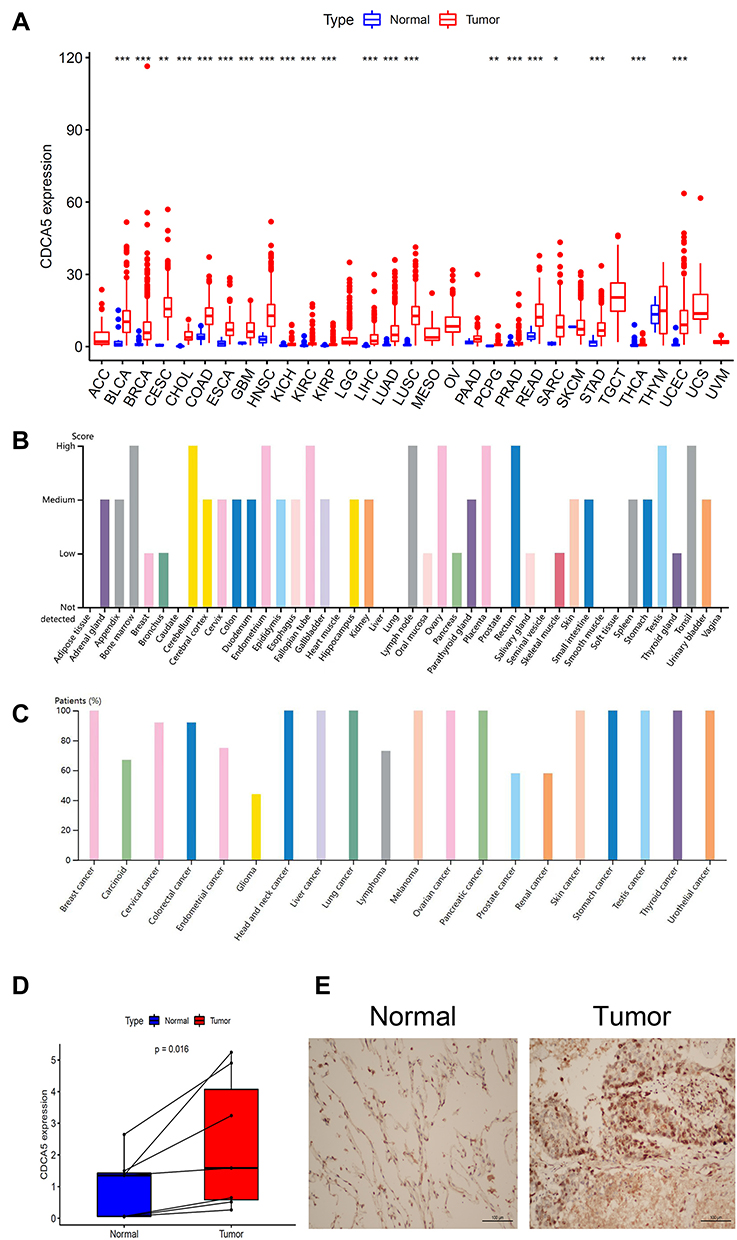 |
Figure 1 Expression levels of CDCA5 in pan-cancer. (A), Boxplot of the mRNA expression of CDCA5 in 31 solid cancer types from TCGA database. mRNA expression level of CDCA5 was presented as FPKM. Wilcoxon test was used for statistical analysis. (B), CDCA5 protein intensity in different human normal tissues from the HPA database. (C), The ratio of CDCA5 protein detection in different cancer types from the HPA database. (D), Expression levels of CDCA5 mRNA in LUAD group were higher than those in normal group. Y‑axis data was presented as relative expression normalized to GAPDH; calculated using the 2−ΔΔCt method. (E), Representative IHC staining of CDCA5 in LUAD tissues. *p< 0.05; **p< 0.01; ***p< 0.001. |
However, 730 normal tissues and 10,006 solid tumor tissues were evaluated for CDCA5 expression. Solid tumors overall displayed significantly higher CDCA5 expression than normal tissues (Supplementary Figure 2).
Using qRT-PCR, we confirmed the results from TCGA by detecting CDCA5 mRNA expression in 7 matched LUAD tissues and normal tissues. There was a significant increase in CDCA5 expression in LUAD tissues compared to normal tissues (Figure 1D). We further assessed CDCA5 protein expression in LUAD tissues by IHC. Consistently, the level of CDCA5 protein was relatively higher in LUAD tumor tissue (Figure 1E).
Then, we analyzed CDCA5 expression according to tumor stage, gender and age using TCGA datasets. CDCA5 expression was significantly varied among different tumor stages in ACC, BACA, ESCA, HNSC, KICH, KIRC, KIRP, LIHC, LUAD, LUSC, SKCM, and THCA (Figure 2). Young patients had a high expression of CDCA5 than elder patients in BRCA, ESCA, HNSC, KIRP, LIHC, LUAD, LUSC, and THYM, while inconsistent results were found in BLCA, PRAD and UCEC. Additionally, CDCA5 expression was closely related to gender. Females had a reduced expression of CDCA5 compared to males in HNSC, LUAD and SKCM. However, females had higher CDCA5 levels than males in KIRP, SARC and STAD (Supplementary Figure 3).
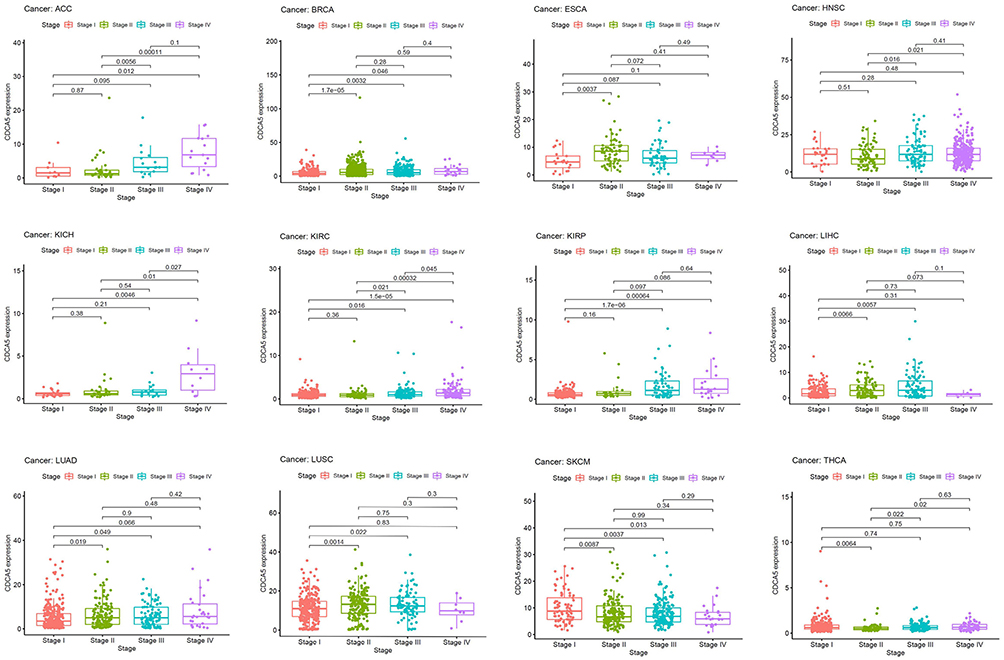 |
Figure 2 The association between CDCA5 mRNA expression and the pathological stages of cancers from TCGA database. mRNA expression level of CDCA5 was presented as FPKM. |
Prognostic Value of CDCA5 in Pan-Cancer
We investigate the correlation of CDCA5 expression with OS, DSS, DFI, and PFI in the TCGA cohort to determine if it can predict prognosis. Higher CDCA5 expression was related to worse OS in ACC, KIRC, KIRP, LGG, LIHC, LUAD, MESO, PCPG and UCEC. In order to eliminate the bias caused by non-cancer deaths, the relationship of CDCA5 expression with DSS was further analyzed. As with the OS analysis, higher CDCA5 expression was significantly associated with poor DSS. Contrarily, higher CDCA5 expression was significantly related to longer DSS in STAD and UCS. There was a negative correlation between increased CDCA5 expression and poor DFI in BRCA, KIRP, LIHC, LUSC, MESO, PAAD, and THCA, but a positive correlation in STAD. For PFI, an increased CDCA5 expression was associated with poor PFI in ACC, KIRC, KIRP, LGG, LIHC, MESO, PAAD, PCPG, PRAD, THCA and UCEC, but reversely in STAD (Figure 3, Table 2, Supplementary Table 1).
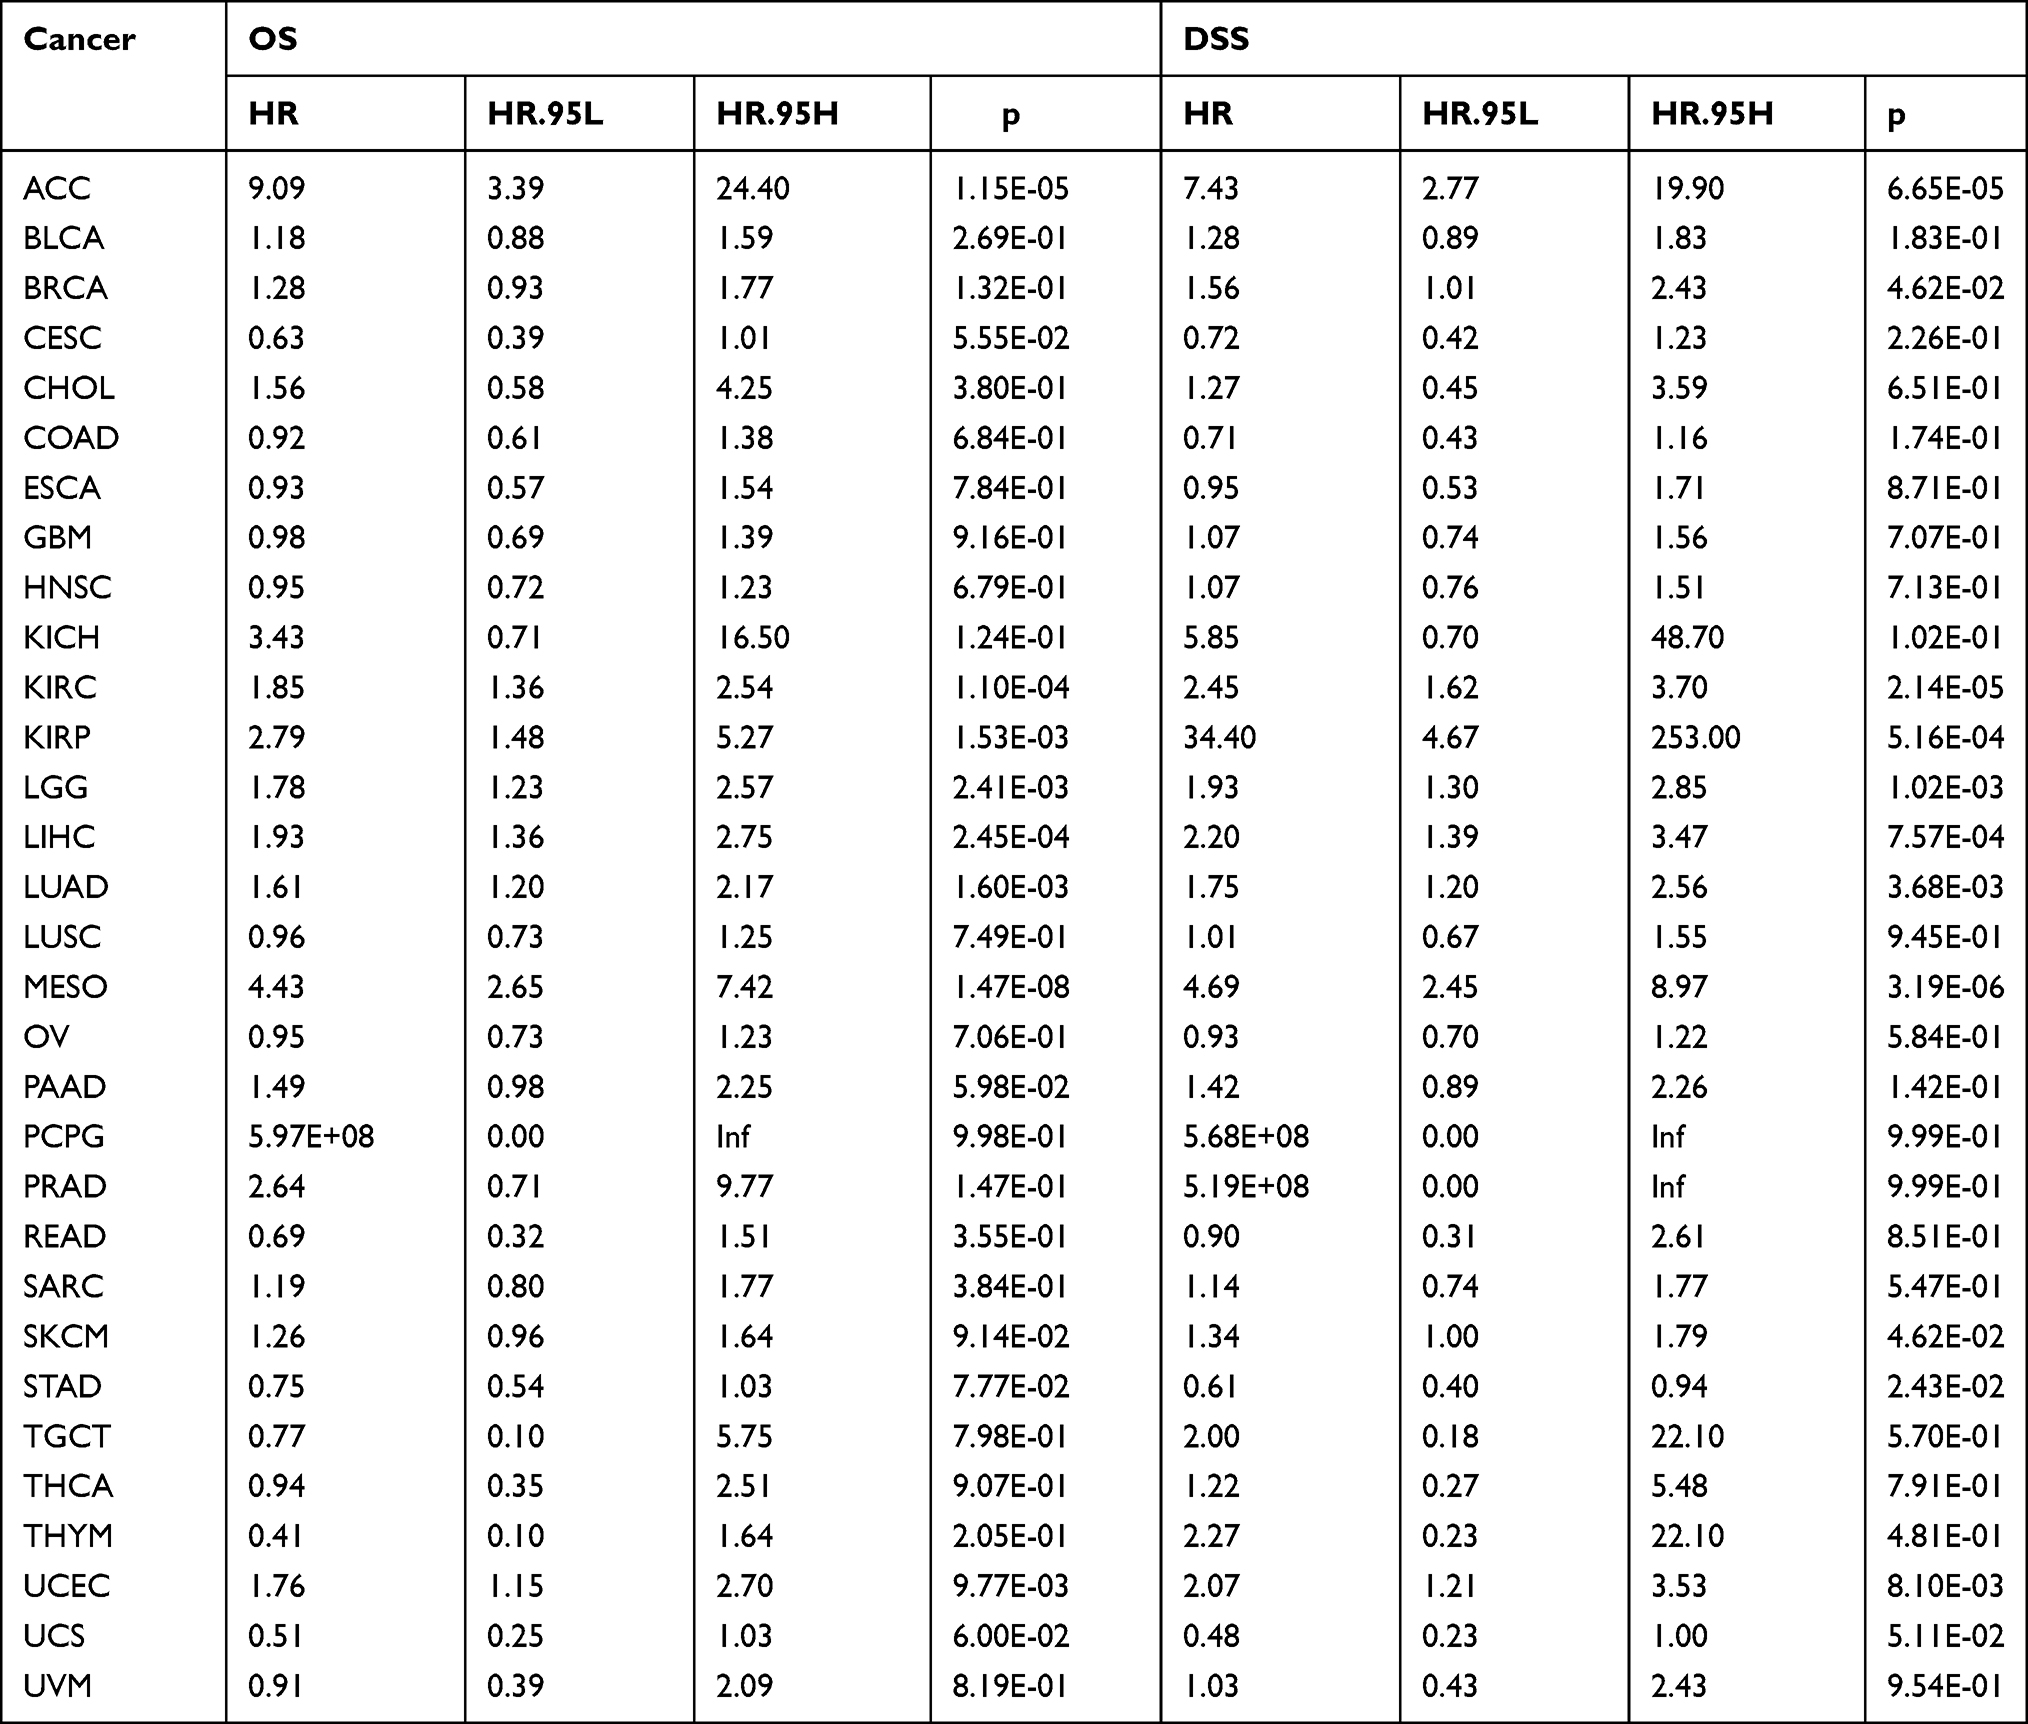 |
Table 2 Univariate Cox Regression Results of CDCA5 According to Median Value in Each Type of Cancer |
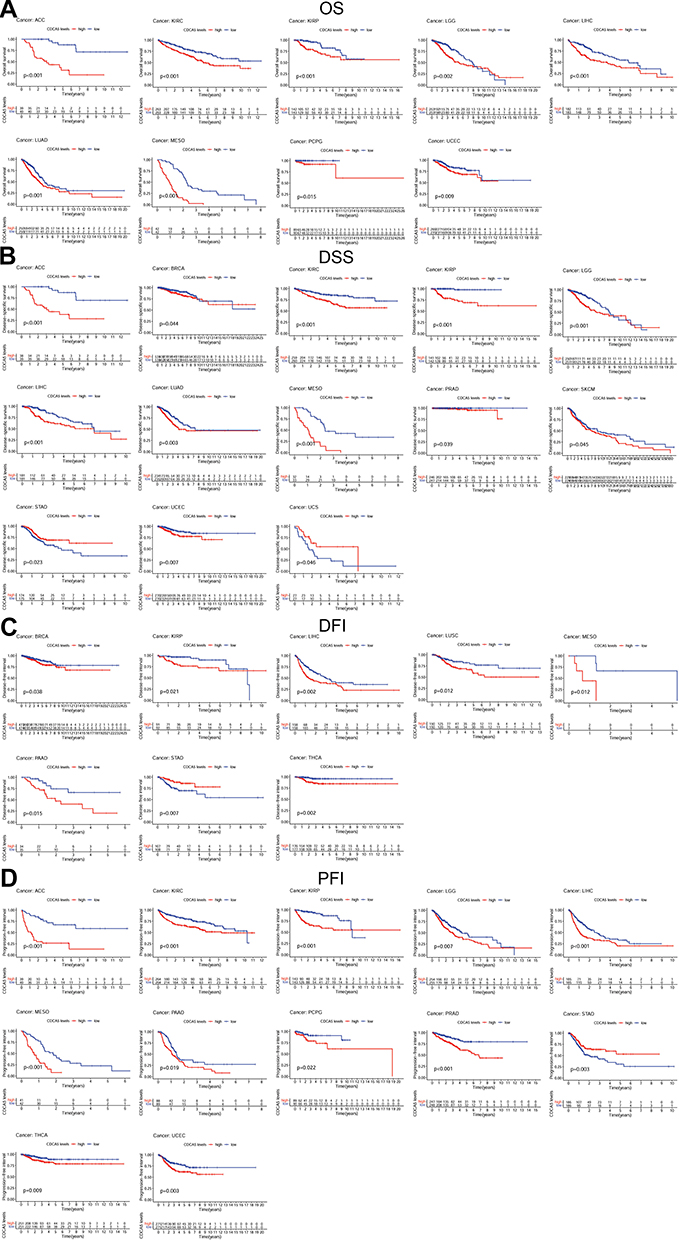 |
Figure 3 Kaplan-Meier survival curves comparing the expression of CDCA5 in pan-cancer from TCGA database. (A), Kaplan–Meier OS curves for CDCA5 in 9 cancer types; (B), Kaplan–Meier DSS curves for CDCA5 in 13 cancer types; (C), Kaplan–Meier DFI curves for CDCA5 in 8 cancer types; (D), Kaplan–Meier PFI curves for CDCA5 in 12 cancer types. |
Further, according to the forest plot, CDCA5 could significantly impact the OS of ACC, KICH, KIRC, KIRP, LGG, LIHC, LUAD, MESO, PAAD, PCPG, PRAD, THYM, UCEC. Regarding CDCA5 and DSS, similar results were found. In terms of DFI, CDCA5 expression affected patients’ DFI in KIRP, LIHC, PRAD, SARC and THCA. Moreover, there were significant hazard ratios for CDCA5 in 13 cancer types according to the PFI forest plot, including ACC, KICH, KIRC, KIRP, LGG, LIHC, MESO, PAAD, PCPG, PRAD, THCA, UCEC and UVM (Figure 4).
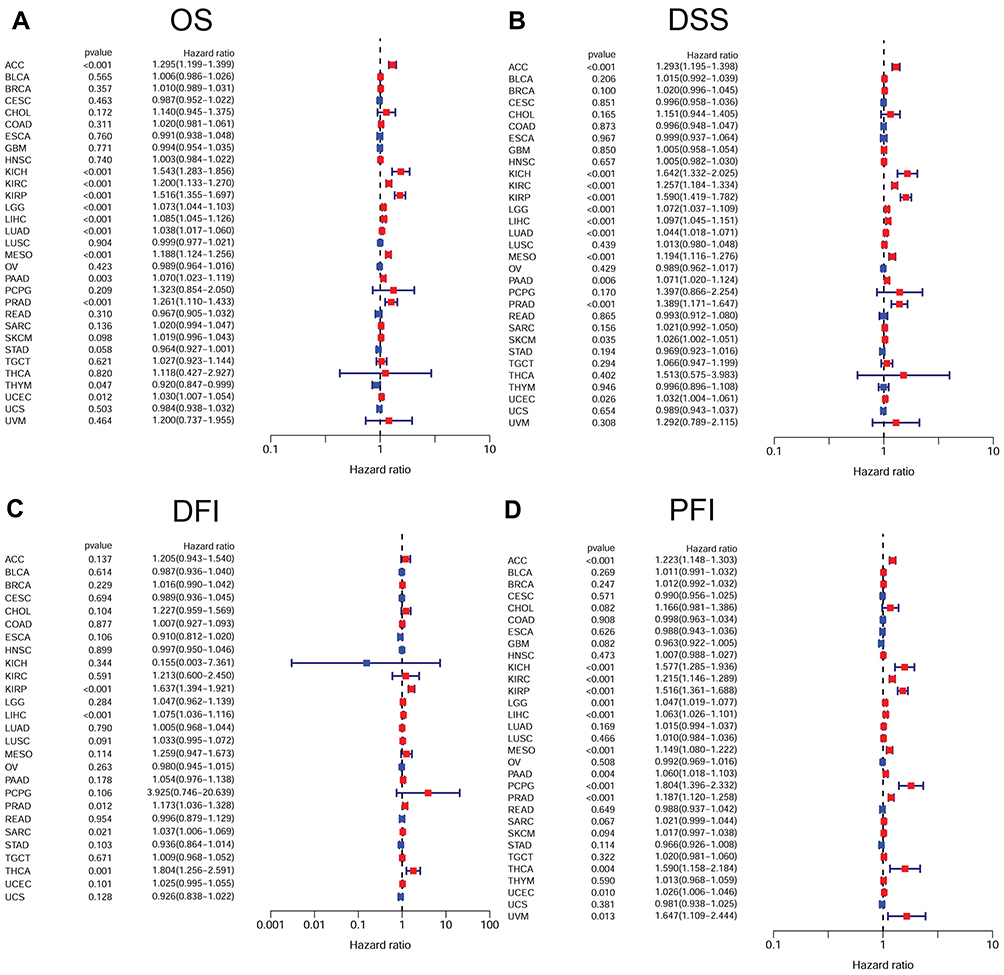 |
Figure 4 Forest plots of Cox regression analyses in pan-cancer from TCGA database. (A), Association between CDCA5 expression and OS; (B), Association between CDCA5 expression and DSS; (C), Association between CDCA5 expression and DFI; (D), Association between CDCA5 expression and PFI. |
Relationship of CDCA5 Expression with Tumor Immune Microenvironment
A CIBERSORT algorithm was used to evaluate the correlation between CDCA5 expression and immune cell infiltration. By applying p< 0.0001 as criteria, we observed that CDCA5 expression was positively related to the infiltration levels of T cells CD4 memory activated in BRCA, COAD, KIRC, KIRP, LIHC, LUAD, STAD and THCA, while negatively related to T cells CD4 memory resting in BRCA, COAD, KIRC, LUAD and UCEC (Figure 5 and Table 3), B cells in 3 cancer types, CD8+T cells in 3 cancer types, macrophages M1 in 9 cancer types, macrophages M2 in 5 cancer types, mast cells in 6 cancer types, dendritic cells in 6 cancer types, T cells follicular helper in 6 cancer types, NK cells in 5 cancer types, and Tregs in 3 cancer types (Supplementary Figure 4 and Supplementary Table 2).
 |
Table 3 Association of CDCA5 mRNA with T Cells CD4 Memory Resting and Activated in Pan-Cancers |
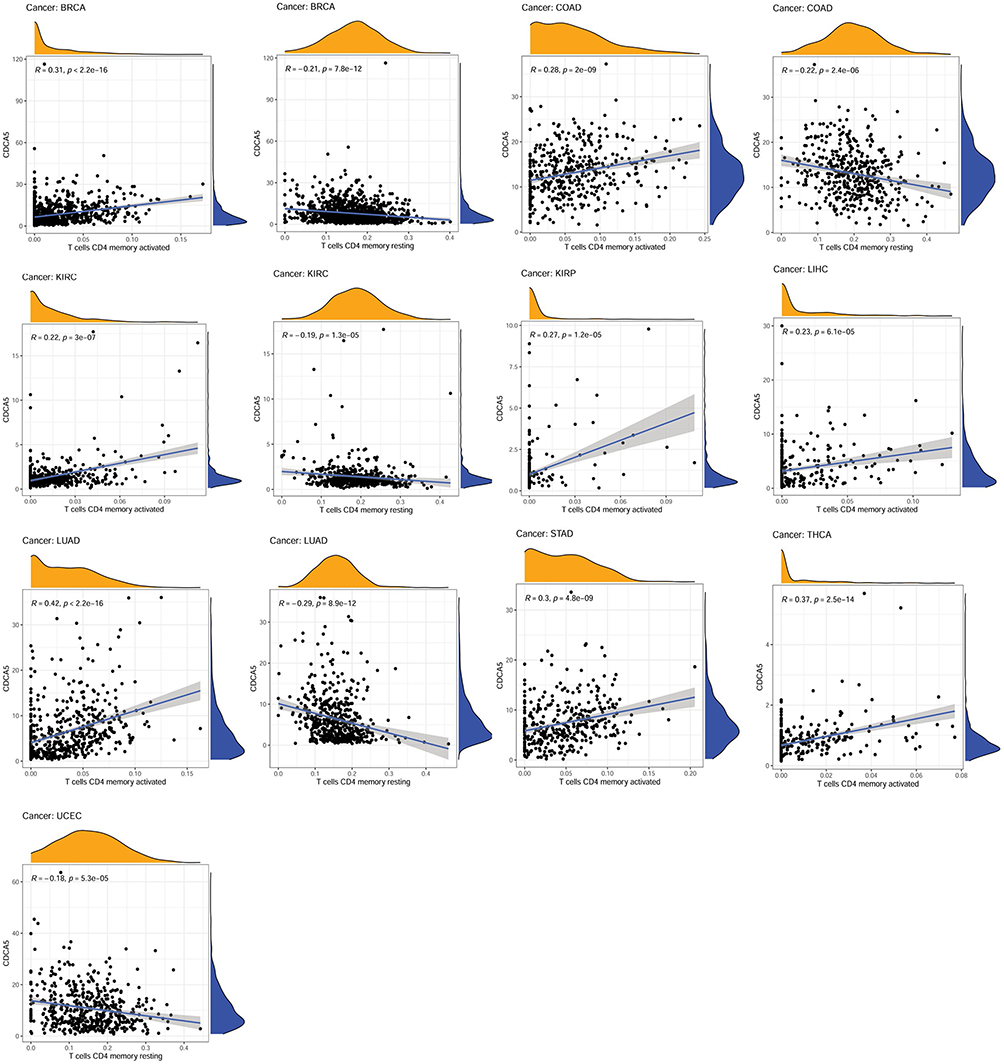 |
Figure 5 Association of CDCA5 mRNA expression with T cells CD4 memory activated and resting from TCGA database. mRNA expression level of CDCA5 was presented as FPKM. |
The ESTIMATE algorithm was then applied to explore if CDCA5 expression and immune score might be correlated. By applying p< 0.001 as criteria, it was found that CDCA5 positively related to immune score and stromal score in KIRC and THCA, but negatively related to GBM, LUSC, STAD, and UCEC. Besides, there was a significant positive correlation between CDCA5 expression and immune score in THYM. Significantly negative correlations were found between CDCA5 expression and stromal score in BRCA, CECS, COAD, HNSC, LIHC, LUAD, SARC, SKCM, TGCT, and THYM (Figure 6 and Table 4).
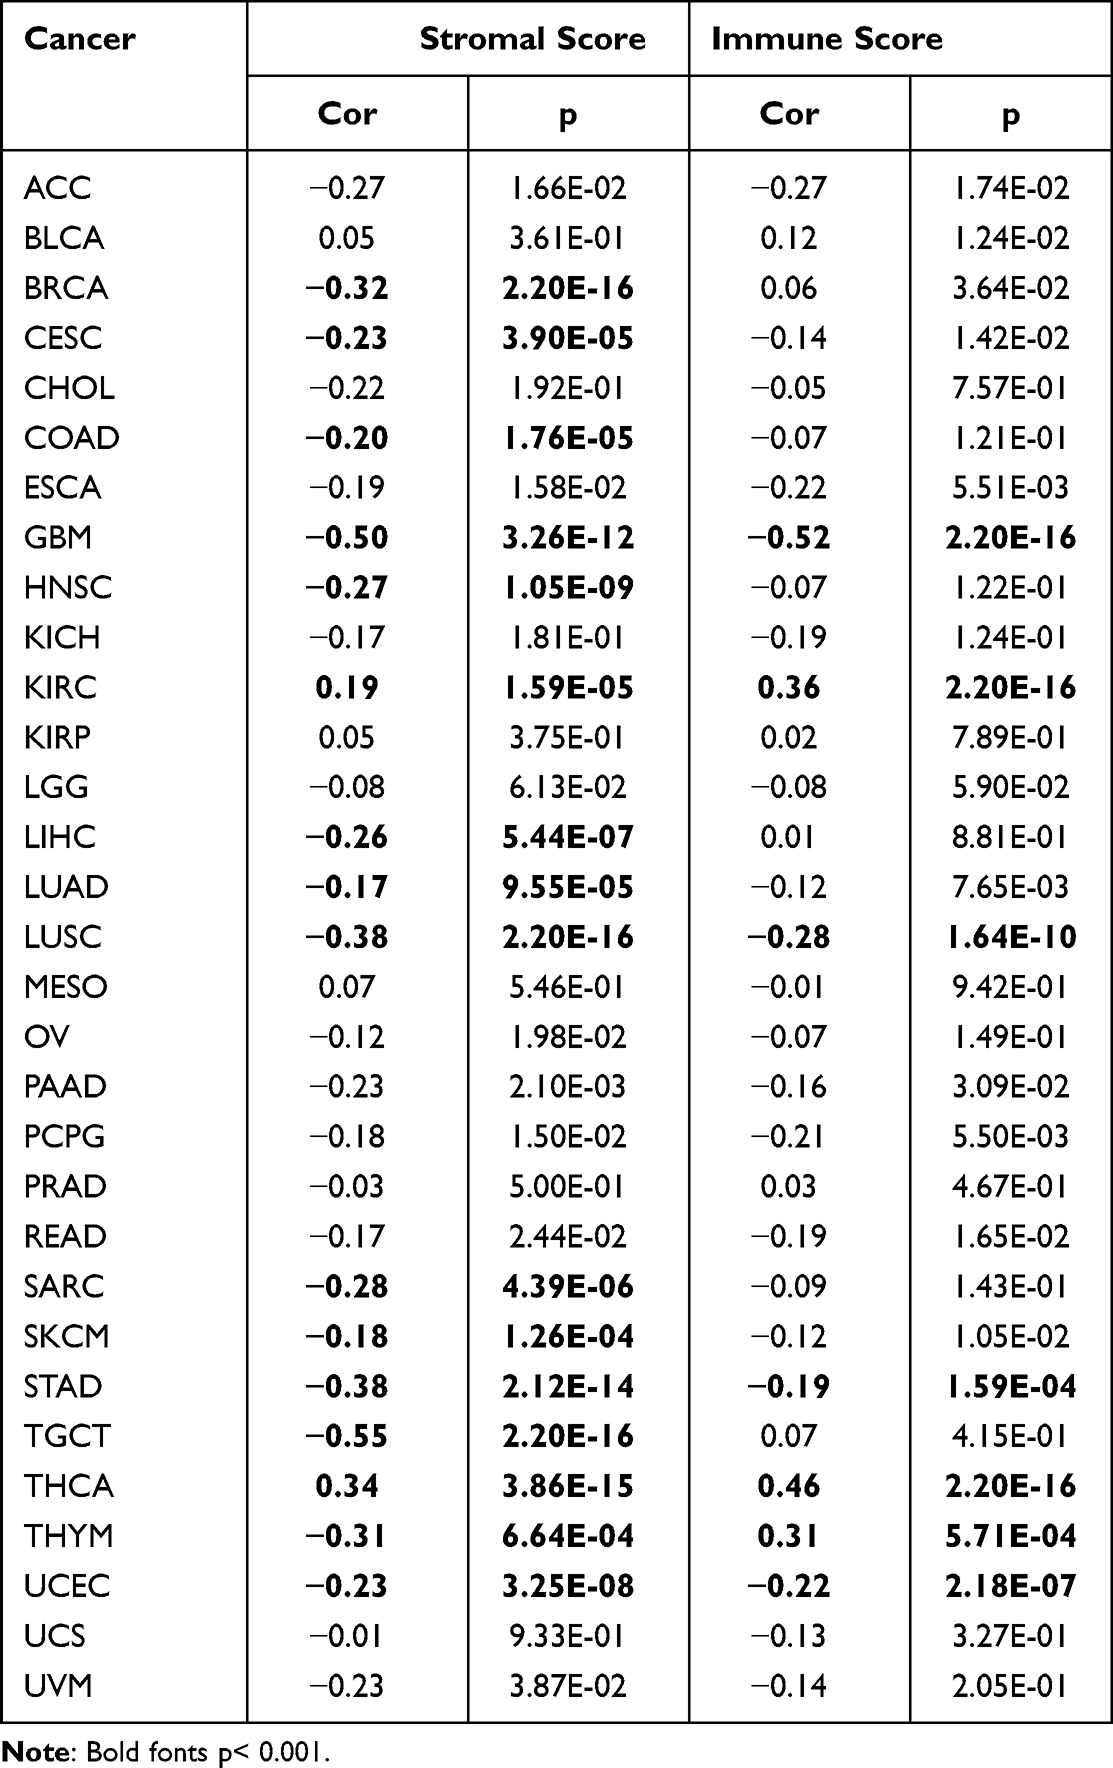 |
Table 4 Correlation of CDCA5 with Stromal Score and Immune Score in 31 Solid Tumors |
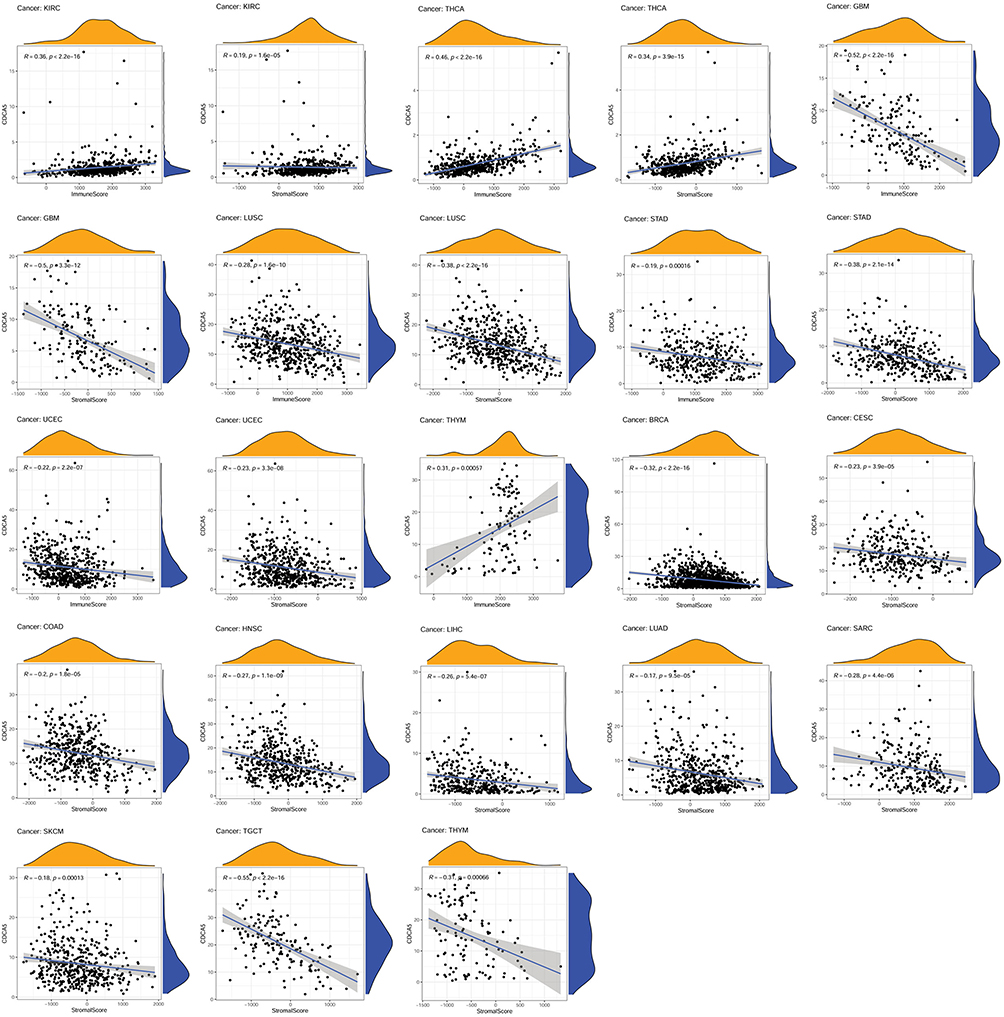 |
Figure 6 Association of CDCA5 mRNA expression with the immune score and stromal score from TCGA database. mRNA expression level of CDCA5 was presented as FPKM. |
Correlation of CDCA5 Expression with TMB and MSI
Next, we examined the relationship between CDCA5 expression and TMB and MSI. The results indicated that CDCA5 was positively related to TMB in ACC, BLCA, BACA, CESC, COAD, HNSC, KICH, KIRC, LGG, LIHC, LUAD, LUSC, MESO, OV, PAAD, PRAD, READ, SARC, SKCM, STAD, THCA, UCEC and UCS, while THYM showed a negative relationship (Figure 7A). In addition, CDCA5 was positively related to MSI in BLCA, BRCA, COAD, HNSC, LIHC, LUSC, SARC, SKCM, STAD and UCEC (Figure 7B).
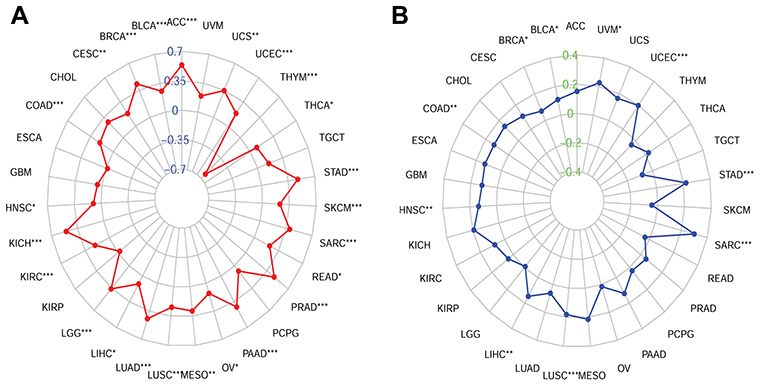 |
Figure 7 Associations between CDCA5 mRNA expression and TMB and MSI in cancers from TCGA database. (A), Radar map of association between CDCA5 expression and TMB; (B), Radar map of association between CDCA5 expression and MSI. *p<0.05; **p<0.01; ***p<0.001. |
Correlation of CDCA5 Expression with Immune Checkpoint Genes
The relationship between CDCA5 and immune checkpoint genes was explored. Forty-seven immune checkpoint genes were evaluated. Significant correlations were found between CDCA5 and most of the checkpoint genes in specific cancer types, including BRCA, KIRC, LIHC, PRAD and THYM. Positive relationship of CD274 (PD-L1) and CDCA5 was found in ACC, BLCA, BRCA, CHOL, KIRC, LUAD, LUSC, MESO, OV, PAAD, SARC, STAD and THCA, while negative association was shown in GBM and THYM. Interestingly, in THCA, CDCA5 expression was significantly related to 41 immune checkpoint markers. Furthermore, CDCA5 was not related to most immune checkpoint genes in USC and UVM (Figure 8).
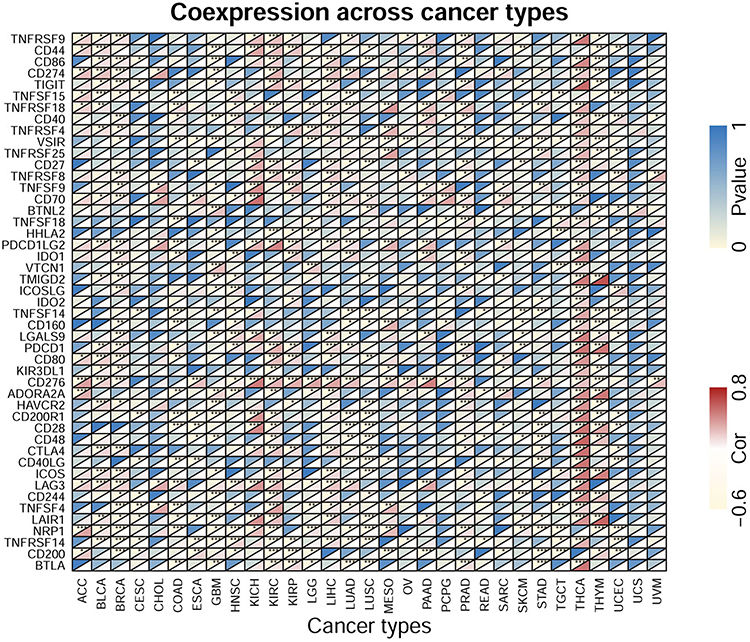 |
Figure 8 Heatmap of the association between CDCA5 expression and 47 common immune checkpoints gene levels in 31 cancer types from TCGA database. P-values and correlation coefficients are represented by top left and bottom right triangles; respectively; for each pair. *p< 0.05; **p< 0.01; ***p< 0.001. |
Immunotherapeutic Response Prediction Value of CDCA5
As CDCA5 played a vital role in tumor immune, we sought to validate whether it could predict response to immunotherapy based on IMvigor 210 cohort. Patients with high levels of CDCA5 had longer OS (Figure 9A). Besides, responders expressed more CDCA5 than non-responders (Figure 9B). Patients with high CDCA5 expression responded better to anti-PD-L1 treatment (Figure 9C).
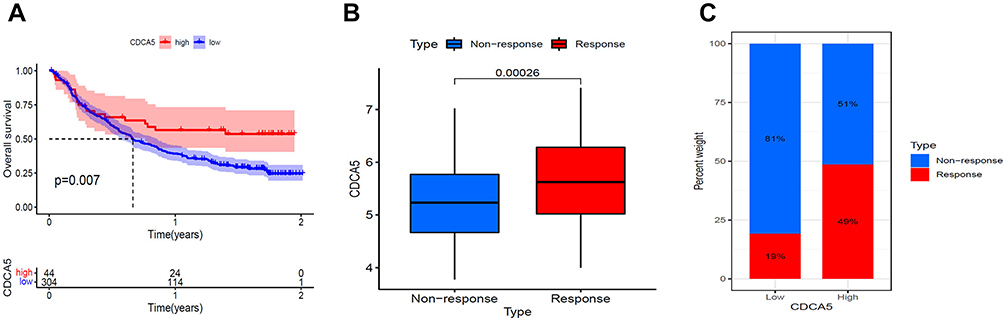 |
Figure 9 Validation of the immunotherapeutic predictive value of CDCA5. (A), Kaplan–Meier OS curves for CDCA5 mRNA in IMvigor 210 cohort. (B), CDCA5 mRNA expression was higher in responders than that in non-responders. mRNA expression level of CDCA5 was presented as FPKM. (C), The proportion of patients with response to anti- PD-L1 therapy in CDCA5 mRNA high and low expression groups. |
We then explored the correlation between CDCA5 mRNA expression and the response to standard treatment for each tumor type using TCGA datasets. CDCA5 expression levels were significantly high in the SD+PD group compared with the CR+PR group in ACC, BLCA, KICH, KIRP, LGG, LUAD, PAAD, PCPG and PRAD (Supplementary Figure 5).
GSEA Analysis
GSEA was performed to analyze the enrichment of KEGG and GO pathways in CDCA5 expression in different cancers. Here were the first six most significant pathways (Supplementary Figures 6 and 7). Supplementary Table 3 presented KEGG pathways enriched in more than 5 types of cancers and GO pathways in more than 15 types of cancers. In KEGG analysis, “cell cycle”, and “DNA replication” were found in multiple tumors. In GO analysis, “immune response regulation cell surface receptor signaling” was found in CHOL, THCA, and UVM. These results indicated that CDCA5 widely participated in the signaling pathways involved in cell proliferation and immunity.
Discussion
In addition to its role in cell cycle regulation, CDCA5 is also involved in the development of cancers. CDCA5 is also over-expressed and affects prognosis in various cancer, acting as an oncogene.8,27–30 In GC, upregulation of CDCA5 could promote tumor progression by influencing cyclin E1.27 HCC cells could be suppressed by silencing CDCA5 and induced to enter G2/M cell cycle arrest if CDCA5 was silenced.28 In bladder cancer, CDCA5 might promote tumor growth through dysregulation of mitochondria-mediated apoptosis and cell cycle regulation.29 It was found that in colorectal and prostate cancer, CDCA5 might activate ERK signaling to promote cancer progression.8,30 Recently, there have been many studies that focus on an analysis of pan-cancer to reveal similarities and differences and develop therapeutic targets that can help prevent and treat cancer.31 The role of CDCA5 in pan-cancer was rarely studied. Here, a pan-cancer analysis was performed on CDCA5 expression profiles and its prognostic value. Then, using bioinformatics analysis, CDCA5’s role in tumor immunity was further demonstrated.
Here, we observed that CDCA5 was abnormally upregulated in most tumor tissues. Besides, CDCA5 expression was associated with clinical stage, age and gender. It may be important to consider the age and gender of patients when selecting treatment options. CDCA5 expression was different in patients with stage I and IV. These discoveries clearly demonstrated that CDCA5 could be used as a biomarker for prediction of cancer progression. Subsequently, to confirm the expression of CDCA5 in LUAD, RT-PCR and IHC were performed. Consistent with bioinformatic analysis, tumor tissues expressed significantly higher levels of CDCA5 mRNA and protein than normal tissues.
Our study showed that increased CDCA5 expression was related to poor prognosis in most tumor types. Particularly, we indicated that CDCA5 was up-regulated and associated with poor prognosis in KIRP, PCPG, THCA and UCEC for the first time. Consistent with previous reports, CDCA5 was a negative prognostic biomarker in lung carcinoma,5,6 colorectal cancer,8 and esophageal squamous cell carcinoma.12 However, we also observed that CDCA5 overexpression was related to better DSS of UCS. STAD was another exception that high CDCA5 expression indicated a longer DSS, DFI and PFI. The study of Zhang et al demonstrated that gastric cancer patients with CDCA5 overexpression exhibited a worse OS. Previous studies conducted mechanism researches on the role of CDCA5 in cancer almost demonstrated that CDCA5 could act as an oncogene in almost all types of cancers such as prostate cancer, ovarian cancer, nasopharyngeal carcinoma and gastric cancer.27,32–34 However, one single gene might not act as a driver factor to result in the prognosis. Diversity in populations, treatment methods and some other factors were also responsible for prognosis of patients with cancers. Our study found that patients with STAD and UCS with high CDCA5 expression had better prognoses. However, there were only a limited number of samples, so further research with larger sample size is needed. Whether there existed some other interactions between CDCA5 and other factors in prognosis of some specific types of cancers should also be paid attention and investigated in the future.
Therapy targeting immune checkpoint genes has proved to be an effective treatment option for most advanced cancer. However, the majority of patients do not show durable responses to therapy.35 Therefore, reliable biomarkers are crucial for predicting response to immune checkpoint inhibitors.
TMB has been used as a biomarker predicting response to immunotherapy.22,36,37 Furthermore, checkpoint inhibitors are more likely to be beneficial in patients with high TMB.38,39 Increasing evidence has shown that MSI-H is caused by mismatch-repair deficiencies (dMMR), which are closely associated with tumorigenesis.23 Both MSI-H and dMMR suggested high mutation load, which was related to better efficacy of immunotherapy.40 MSI or dMMR is positively correlated with the efficacy of immunotherapy for multiple solid tumors.41–44 Tumor infiltrating lymphocytes play a critical role in inhibiting or promoting tumor progression in the immune microenvironment.45,46 The response to immune checkpoint inhibitors could be affected by tumor-infiltrating lymphocytes.47,48 Anti-PD-1/PD-L1 was found to be more effective when CD8+ T cells were more abundant in the tumor core and invasive margin.16,17 There were several subsets of CD4+ Th1 cells that were more abundant in melanoma tumors that responded to anti-CTLA-4.49 Numerous studies have demonstrated that B cells have a positive impact on ICB response.50,51 In GBM, CDCA5 amplification was related to CD8+ T cell infiltration.52
Based on the analysis of immunotherapy cohort (IMvigor 210), patients with higher CDCA5 level might benefit from anti- PD-L1 therapy and had longer OS. However, up-regulated CDCA5 was significantly associated with worse clinical outcomes in most tumors from TCGA. The results from TCGA cohort and IMvigor 210 were not contradictory. On the contrary, we could assume that the patients who were not benefited from classic anticancer therapies might be response for the immunotherapy.
At present, CDCA5 has been rarely studied in the context of cancer immunotherapy. This study indicated that CDCA5 expression could impact TMB, MSI and immune cell infiltration and thus impacting response to immunotherapy for the first time. Besides, positive relationship of CD274 (PD-L1) and CDCA5 was found in most tumors, which was in line with the finding of Shen et al.13 Therefore, there is potential for CDCA5 to serve as a new immunotherapeutic target. However, the potential mechanisms should be identified through in vitro and in vivo experiments.
Our study suggested that CDCA5 played a crucial role in tumors. However, further mechanistic studies at the cellular and molecular levels are needed. The study as a pan-cancer analysis with bioinformatics approaches, might not show all interactions and involvement of CDCA5 in each type of cancers. However, our study accurately revealed the importance of CDCA5 in various tumors and its correlation with numerous clinical parameters. All these findings might provide important clues for mechanistic studies on CDCA5 in tumors in the future.
Conclusions
Overall, our study demonstrated that CDCA5 overexpression correlated with poor prognosis. Immune cells infiltration, immune checkpoint genes, TMB, and MSI were associated with aberrant CDCA5 expression. However, a majority of the data for the current study was obtained from bioinformatics and public databases. Molecular and cellular studies of CDCA5 are necessary to understand its role in tumorigenesis and progression. Therefore, there is potential for CDCA5 to be a prognostic biomarker and a therapeutic target for immunotherapy.
Abbreviations
ACC, adrenocortical carcinoma; BLCA, bladder urothelial carcinoma; BRCA, breast invasive carcinoma; CESC, cervical squamous cell carcinoma; CHOL, cholangiocarcinoma; COAD, colon adenocarcinoma; DLBC, lymphoid neoplasm diffuse large B-cell lymphoma; ESCA, esophageal carcinoma; GBM, glioblastoma multiforme; LGG, brain lower grade glioma; HNSC, head and neck squamous cell carcinoma; KICH, kidney chromophobe; KIRC, kidney renal clear cell carcinoma; KIRP, kidney renal papillary cell carcinoma; LIHC, liver hepatocellular carcinoma; LUAD, lung adenocarcinoma; LUSC, lung squamous cell carcinoma; MESO, mesothelioma; OV, ovarian serous cystadenocarcinoma; PAAD, pancreatic adenocarcinoma; PCPG, pheochromocytoma and paraganglioma; PRAD, prostate adenocarcinoma; READ, rectum adenocarcinoma; SARC, sarcoma; SKCM, skin cutaneous melanoma; STAD, stomach adenocarcinoma; TGCT, testicular germ cell tumors; THCA, thyroid carcinoma; THYM, thymoma; UCEC, uterine corpus endometrial carcinoma; UCS, uterine carcinosarcoma; UVM, uveal melanoma.
Data Sharing Statement
All data included in this study are available by contacting the corresponding authors.
Ethical Statement
The authors are accountable for all aspects of the work in ensuring that questions related to the accuracy or integrity of any part of the work are appropriately investigated and resolved. The study was conducted in accordance with the Declaration of Helsinki (as revised in 2013). This study was approved by the Ethics Committee of the Affiliated Suzhou Hospital of Nanjing Medical University and each participant had signed informed consent prior to participation (Ethics Approval No. KL901198).
Consent for Publication
All authors in this research agree to publish the article.
Author Contributions
(I) Conception and design, XPW; PL and MXZ; (II) Administrative support, MXZ; JH and XZ; (III) Provision of study materials or patients, LZ; TSW and WZ; (IV) Collection and assembly of data, MXZ; (V) Data analysis and interpretation, MXZ; JH and QZ. All authors made a significant contribution to the work reported; whether that is in the conception; study design; execution; acquisition of data; analysis and interpretation; or in all these areas; took part in drafting; revising or critically reviewing the article; gave final approval of the version to be published; have agreed on the journal to which the article has been submitted; and agree to be accountable for all aspects of the work.
Funding
This work was supported by the National Natural Science Foundation of China [Grant number, 82203148; 81702364; 81672400; 81672788] and the Natural Science Foundation of Jiangsu Province [Grant number, BK20171085; BK20210974].
Disclosure
The authors have no conflicts of interest to declare.
References
1. Rankin S, Ayad NG, Kirschner MW. Sororin; a substrate of the anaphase-promoting complex; is required for sister chromatid cohesion in vertebrates. Mol Cell. 2005;18(2):185–200. doi:10.1016/j.molcel.2005.03.017
2. Schmitz J, Watrin E, Lenart P, Mechtler K, Peters JM. Sororin is required for stable binding of cohesin to chromatin and for sister chromatid cohesion in interphase. Curr Biol. 2007;17(7):630–636. doi:10.1016/j.cub.2007.02.029
3. Nishiyama T, Ladurner R, Schmitz J, et al. Sororin mediates sister chromatid cohesion by antagonizing Wapl. Cell. 2010;143(5):737–749. doi:10.1016/j.cell.2010.10.031
4. Ladurner R, Kreidl E, Ivanov MP, et al. Sororin actively maintains sister chromatid cohesion. EMBO J. 2016;35(6):635–653. doi:10.15252/embj.201592532
5. Showe MK, Kossenkov AV, Showe LC. The peripheral immune response and lung cancer prognosis. Oncoimmunology. 2012;1(8):1414–1416. doi:10.4161/onci.21096
6. Nguyen MH, Koinuma J, Ueda K, et al. Phosphorylation and activation of cell division cycle associated 5 by mitogen-activated protein kinase play a crucial role in human lung carcinogenesis. Cancer Res. 2010;70(13):5337–5347. doi:10.1158/0008-5472.CAN-09-4372
7. Chang IW, Lin VC, He HL, et al. CDCA5 overexpression is an indicator of poor prognosis in patients with urothelial carcinomas of the upper urinary tract and urinary bladder. Am J Transl Res. 2015;7(4):710–722.
8. Shen A, Liu L, Chen H, et al. Cell division cycle associated 5 promotes colorectal cancer progression by activating the ERK signaling pathway. Oncogenesis. 2019;8(3):19. doi:10.1038/s41389-019-0123-5
9. Hou S, Chen X, Li M, Huang X, Liao H, Tian B. Higher expression of cell division cycle-associated protein 5 predicts poorer survival outcomes in hepatocellular carcinoma. Aging. 2020;12(14):14542–14555. doi:10.18632/aging.103501
10. Wu B, Huang Y, Luo Y, et al. The diagnostic and prognostic value of cell division cycle associated gene family in Hepatocellular Carcinoma. J Cancer. 2020;11(19):5727–5737. doi:10.7150/jca.46554
11. Chen H, Chen J, Zhao L, et al. CDCA5; transcribed by E2F1; promotes oncogenesis by enhancing cell proliferation and inhibiting apoptosis via the AKT pathway in hepatocellular carcinoma. J Cancer. 2019;10(8):1846–1854. doi:10.7150/jca.28809
12. Xu J, Zhu C, Yu Y, et al. Systematic cancer-testis gene expression analysis identified CDCA5 as a potential therapeutic target in esophageal squamous cell carcinoma. EBioMedicine. 2019;46:54–65. doi:10.1016/j.ebiom.2019.07.030
13. Shen W, Tong D, Chen J, et al. Silencing oncogene cell division cycle associated 5 induces apoptosis and G1 phase arrest of non-small cell lung cancer cells via p53-p21 signaling pathway. J Clin Lab Anal. 2022;36(5):e24396. doi:10.1002/jcla.24396
14. Hanahan D, Weinberg RA. Hallmarks of cancer, the next generation. Cell. 2011;144(5):646–674. doi:10.1016/j.cell.2011.02.013
15. Chen F, Zhuang X, Lin L, et al. New horizons in tumor microenvironment biology, challenges and opportunities. BMC Med. 2015;13:45. doi:10.1186/s12916-015-0278-7
16. Tumeh PC, Harview CL, Yearley JH, et al. PD-1 blockade induces responses by inhibiting adaptive immune resistance. Nature. 2014;515(7528):568–571. doi:10.1038/nature13954
17. Herbst RS, Soria JC, Kowanetz M, et al. Predictive correlates of response to the anti-PD-L1 antibody MPDL3280A in cancer patients. Nature. 2014;515(7528):563–567. doi:10.1038/nature14011
18. Wang SS, Liu W, Ly D, Xu H, Qu L, Zhang L. Tumor-infiltrating B cells, their role and application in anti-tumor immunity in lung cancer. Cell Mol Immunol. 2019;16(1):6–18. doi:10.1038/s41423-018-0027-x
19. Jiang Y, Zhao X, Fu J, Wang H. Progress and challenges in precise treatment of tumors with PD-1/PD-L1 blockade. Front Immunol. 2020;11:339. doi:10.3389/fimmu.2020.00339
20. Mariathasan S, Turley SJ, Nickles D, et al. TGFbeta attenuates tumour response to PD-L1 blockade by contributing to exclusion of T cells. Nature. 2018;554(7693):544–548. doi:10.1038/nature25501
21. Yoshihara K, Shahmoradgoli M, Martinez E, et al. Inferring tumour purity and stromal and immune cell admixture from expression data. Nat Commun. 2013;4:2612. doi:10.1038/ncomms3612
22. Schumacher TN, Schreiber RD. Neoantigens in cancer immunotherapy. Science. 2015;348(6230):69–74. doi:10.1126/science.aaa4971
23. Bonneville R, Krook MA, Kautto EA, et al. Landscape of microsatellite instability across 39 cancer types. JCO Precis Oncol. 2017;2017. doi:10.1200/PO.17.00073
24. Forschner A, Battke F, Hadaschik D, et al. Tumor mutation burden and circulating tumor DNA in combined CTLA-4 and PD-1 antibody therapy in metastatic melanoma - results of a prospective biomarker study. J Immunother Cancer. 2019;7(1):180. doi:10.1186/s40425-019-0659-0
25. Lv J, Zhu Y, Ji A, Zhang Q, Liao G. Mining TCGA database for tumor mutation burden and their clinical significance in bladder cancer. Biosci Rep. 2020;40(4). doi:10.1042/BSR20194337
26. Schumacher TN, Kesmir C, van Buuren MM. Biomarkers in cancer immunotherapy. Cancer Cell. 2015;27(1):12–14. doi:10.1016/j.ccell.2014.12.004
27. Zhang Z, Shen M, Zhou G. Upregulation of CDCA5 promotes gastric cancer malignant progression via influencing cyclin E1. Biochem Biophys Res Commun. 2018;496(2):482–489. doi:10.1016/j.bbrc.2018.01.046
28. Wang J, Xia C, Pu M, et al. Silencing of CDCA5 inhibits cancer progression and serves as a prognostic biomarker for hepatocellular carcinoma. Oncol Rep. 2018;40(4):1875–1884. doi:10.3892/or.2018.6579
29. Fu G, Xu Z, Chen X, Pan H, Wang Y, Jin B. CDCA5 functions as a tumor promoter in bladder cancer by dysregulating mitochondria-mediated apoptosis; cell cycle regulation and PI3k/AKT/mTOR pathway activation. J Cancer. 2020;11(9):2408–2420. doi:10.7150/jca.35372
30. Ji J, Shen T, Li Y, Liu Y, Shang Z, Niu Y. CDCA5 promotes the progression of prostate cancer by affecting the ERK signalling pathway. Oncol Rep. 2021;45(3):921–932. doi:10.3892/or.2021.7920
31. Schaub FX, Dhankani V, Berger AC, et al. Pan-cancer alterations of the MYC oncogene and its proximal network across the cancer genome atlas. Cell Syst. 2018;6(3):282–300 e282. doi:10.1016/j.cels.2018.03.003
32. Luo Z, Wang J, Zhu Y, et al. SPOP promotes CDCA5 degradation to regulate prostate cancer progression via the AKT pathway. Neoplasia. 2021;23(10):1037–1047. doi:10.1016/j.neo.2021.08.002
33. Gao A, Hu Y, Zhu W. CDCA5 is negatively regulated by miR-326 and boosts ovarian cancer progression. J BUON. 2021;26(2):544–552.
34. Liu D, Gong H, Tao Z, Chen S, Kong Y, Xiao B. LINC01515 promotes nasopharyngeal carcinoma progression by serving as a sponge for miR-325 to up-regulate CDCA5. J Mol Histol. 2021;52(3):577–587. doi:10.1007/s10735-021-09969-x
35. de Miguel M, Calvo E. Clinical challenges of immune checkpoint inhibitors. Cancer Cell. 2020;38(3):326–333. doi:10.1016/j.ccell.2020.07.004
36. Liontos M, Anastasiou I, Bamias A, Dimopoulos MA. DNA damage; tumor mutational load and their impact on immune responses against cancer. Ann Transl Med. 2016;4(14):264. doi:10.21037/atm.2016.07.11
37. Giannakis M, Mu XJ, Shukla SA, et al. Genomic correlates of immune-cell infiltrates in colorectal carcinoma. Cell Rep. 2016;15(4):857–865. doi:10.1016/j.celrep.2016.03.075
38. Samstein RM, Lee CH, Shoushtari AN, et al. Tumor mutational load predicts survival after immunotherapy across multiple cancer types. Nat Genet. 2019;51(2):202–206. doi:10.1038/s41588-018-0312-8
39. Singal G, Miller PG, Agarwala V, et al. Association of patient characteristics and tumor genomics with clinical outcomes among patients with non-small cell lung cancer using a clinicogenomic database. JAMA. 2019;321(14):1391–1399. doi:10.1001/jama.2019.3241
40. Le DT, Durham JN, Smith KN, et al. Mismatch repair deficiency predicts response of solid tumors to PD-1 blockade. Science. 2017;357(6349):409–413. doi:10.1126/science.aan6733
41. Yu Y. Molecular classification and precision therapy of cancer, immune checkpoint inhibitors. Front Med. 2018;12(2):229–235. doi:10.1007/s11684-017-0581-0
42. Ganesh K, Stadler ZK, Cercek A, et al. Immunotherapy in colorectal cancer, rationale; challenges and potential. Nat Rev Gastroenterol Hepatol. 2019;16(6):361–375. doi:10.1038/s41575-019-0126-x
43. Duffy MJ, Crown J. Biomarkers for predicting response to immunotherapy with immune checkpoint inhibitors in cancer patients. Clin Chem. 2019;65(10):1228–1238. doi:10.1373/clinchem.2019.303644
44. Killock D. Immunotherapy, dMMR presents opportunities to enhance immunotherapy. Nat Rev Clin Oncol. 2018;15(2):66–67. doi:10.1038/nrclinonc.2017.203
45. Junttila MR, de Sauvage FJ. Influence of tumour micro-environment heterogeneity on therapeutic response. Nature. 2013;501(7467):346–354. doi:10.1038/nature12626
46. Azimi F, Scolyer RA, Rumcheva P, et al. Tumor-infiltrating lymphocyte grade is an independent predictor of sentinel lymph node status and survival in patients with cutaneous melanoma. J Clin Oncol. 2012;30(21):2678–2683. doi:10.1200/JCO.2011.37.8539
47. Sade-Feldman M, Yizhak K, Bjorgaard SL, et al. Defining T cell states associated with response to checkpoint immunotherapy in melanoma. Cell. 2019;176(1–2):404. doi:10.1016/j.cell.2018.12.034
48. Ascierto PA, Lewis KD, Di Giacomo AM, et al. Prognostic impact of baseline tumour immune infiltrate on disease-free survival in patients with completely resected; BRAF (v600) mutation-positive melanoma receiving adjuvant vemurafenib. Ann Oncol. 2020;31(1):153–159. doi:10.1016/j.annonc.2019.10.002
49. Wei SC, Levine JH, Cogdill AP, et al. Distinct cellular mechanisms underlie anti-CTLA-4 and anti-PD-1 checkpoint blockade. Cell. 2017;170(6):1120–1133 e1117. doi:10.1016/j.cell.2017.07.024
50. Griss J, Bauer W, Wagner C, et al. B cells sustain inflammation and predict response to immune checkpoint blockade in human melanoma. Nat Commun. 2019;10(1):4186. doi:10.1038/s41467-019-12160-2
51. Helmink BA, Reddy SM, Gao J, et al. B cells and tertiary lymphoid structures promote immunotherapy response. Nature. 2020;577(7791):549–555. doi:10.1038/s41586-019-1922-8
52. Zhou J, Guo H, Liu L, et al. Construction of co-expression modules related to survival by WGCNA and identification of potential prognostic biomarkers in glioblastoma. J Cell Mol Med. 2021;25(3):1633–1644. doi:10.1111/jcmm.16264
 © 2022 The Author(s). This work is published and licensed by Dove Medical Press Limited. The full terms of this license are available at https://www.dovepress.com/terms.php and incorporate the Creative Commons Attribution - Non Commercial (unported, v3.0) License.
By accessing the work you hereby accept the Terms. Non-commercial uses of the work are permitted without any further permission from Dove Medical Press Limited, provided the work is properly attributed. For permission for commercial use of this work, please see paragraphs 4.2 and 5 of our Terms.
© 2022 The Author(s). This work is published and licensed by Dove Medical Press Limited. The full terms of this license are available at https://www.dovepress.com/terms.php and incorporate the Creative Commons Attribution - Non Commercial (unported, v3.0) License.
By accessing the work you hereby accept the Terms. Non-commercial uses of the work are permitted without any further permission from Dove Medical Press Limited, provided the work is properly attributed. For permission for commercial use of this work, please see paragraphs 4.2 and 5 of our Terms.