Back to Journals » Journal of Asthma and Allergy » Volume 15
Profiling Disease and Economic Burden in CRSwNP Using Machine Learning
Authors Bhattacharyya N ![]() , Silver J
, Silver J ![]() , Bogart M, Kponee-Shovein K, Cheng WY, Cheng M, Cheung HC
, Bogart M, Kponee-Shovein K, Cheng WY, Cheng M, Cheung HC ![]() , Duh MS
, Duh MS ![]() , Hahn B
, Hahn B ![]()
Received 15 June 2022
Accepted for publication 9 September 2022
Published 30 September 2022 Volume 2022:15 Pages 1401—1412
DOI https://doi.org/10.2147/JAA.S378469
Checked for plagiarism Yes
Review by Single anonymous peer review
Peer reviewer comments 2
Editor who approved publication: Dr Luis Garcia-Marcos
Neil Bhattacharyya,1 Jared Silver,2 Michael Bogart,2 Kalé Kponee-Shovein,3 Wendy Y Cheng,3 Mu Cheng,3 Hoi Ching Cheung,3 Mei Sheng Duh,3 Beth Hahn2
1Mass Eye & Ear and Harvard Medical School, Boston, MA, USA; 2GSK, Durham, NC, USA; 3Analysis Group, Boston, MA, USA
Correspondence: Neil Bhattacharyya, Mass Eye & Ear and Harvard Medical School, 243 Charles St, Boston, MA, 02114, USA, Tel +1 617-936-6118, Fax +1 617-936-6170, Email [email protected]
Purpose: Chronic rhinosinusitis with nasal polyps (CRSwNP) is associated with high healthcare resource utilization (HRU) and economic cost; however, heterogeneity of clinical burden among patients with differing clinical characteristics has not been fully elucidated. Here, an unsupervised machine learning approach supported by clinical validation identified distinct clusters of patients with CRSwNP and compared healthcare burden.
Patients and Methods: This retrospective analysis identified adult patients with ≥ 2 claims for CRSwNP and date of first diagnosis (index date) between January 2015 and June 2019 from a healthcare database. Patients were required to have enrollment in the database 6-months pre- and 12-months post-index. Patients were assigned to clusters using latent class analysis. All-cause and nasal polyp (NP)-related HRU and costs were compared between clusters.
Results: Among 12,807 patients, 5 clusters were identified: cluster 1: no surgery/low comorbidity/low medication use (n = 4076); cluster 2: no surgery/low comorbidity/high medication use (n = 2201); cluster 3: no surgery/high comorbidity/high medication use (n = 2093); cluster 4: surgery/low comorbidity/moderate medication use (n = 3168); cluster 5: surgery/high comorbidity/high medication use (n = 1269). All-cause HRU was similar across clusters. NP-related HRU was highest in the surgical clusters (clusters 4 and 5). All-cause costs were similar in clusters 1– 3 ($15,833–$17,461) and highest in clusters 4 ($31,083) and 5 ($31,103), driven by outpatient costs. Total NP-related costs were also highest for clusters 4 and 5 ($14,193 and $16,100, respectively).
Conclusion: Substantial heterogeneity exists in clinical and economic burden among patients with CRSwNP. Machine learning offers a novel approach to better understand the diverse, complex burden of illness in CRSwNP.
Keywords: healthcare utilization, cost burden, nasal polyps, machine learning, chronic rhinosinusitis, asthma
Introduction
The standard of care for the management of chronic rhinosinusitis with nasal polyps (CRSwNP) includes nasal saline irrigation or intranasal corticosteroids (INCS), oral antibiotics and antihistamines with short-course oral corticosteroids (OCS), prescribed in the case of exacerbations or insufficient symptom control.1–3 Surgery is usually reserved for recalcitrant cases; however, repeated surgeries are often required, with nasal polyp (NP) recurrence rates estimated at 48–79%, depending on length of follow-up.4,5 Given the commonality of symptom recurrence and the need for ongoing management, CRSwNP is associated with a significant clinical and economic burden compared with the general population.6,7 Moreover, the economic and clinical burden of CRSwNP is significantly higher than that for chronic rhinosinusitis without NP, as highest direct costs are associated with patients who have undergone NP surgery.2 Additionally, it has been recently reported that patients with CRSwNP with a high clinical burden (history of functional endoscopy sinus surgery, comorbid asthma, or receiving OCS) incurred higher healthcare costs than those with a low clinical burden.8 Despite this recent research, there is a lack of further literature regarding direct economic and clinical burden of patients with CRSwNP in the United States. Additionally, a systematic literature review of the economic burden of CRSwNP noted that there is no data on the economic burden associated with the various severities (mild, moderate, severe) of CRSwNP or associated symptoms.9 Given the evolving treatment landscape for patients with CRSwNP,3 an understanding of differential clinical and economic burden experienced by patient subgroups is critical to identify unmet needs that will help to guide long-term disease management.
Machine learning is increasingly utilized in medical research due to the continuous generation of vast amounts of healthcare data.10 Using machine learning, computers can learn tasks and learn from experience. There are two main types of machine learning, supervised and unsupervised. In supervised learning, the computer learns using labelled data and human guidance to infer a function. With unsupervised learning, the computer is given data from which to infer a pattern without any human guidance.10 Unsupervised machine learning techniques are a valuable addition to healthcare research as they can identify important relationships between disparate variables through analysis of the data and do not require human supervision to provide explicit instructions.10 Furthermore, these techniques are of benefit with vast amounts of data where traditional statistical methods such as regression modelling may struggle. Therefore, this type of unsupervised analysis has an important and evolving role in the identification of patient characteristics and their relationships in population-based studies and can provide contrast to the traditional view that only one average phenotype exists in conditions such as CRSwNP.
The primary aim of this study was to evaluate differences in economic burden of disease based on healthcare resource utilization (HRU) and healthcare costs in patients with CRSwNP, according to patients’ key features of clinical disease burden. Using an unsupervised machine learning approach, clusters of patients with varying burdens of disease were identified based on age, frequency of NP surgery, medication use, and comorbidities. HRU and healthcare costs were compared between these clusters of patients and drivers of HRU and healthcare costs were determined. This real-world study presents a novel method of phenotyping CRSwNP in a manner that could inform clinical decision-making in practice.
Materials and Methods
Study Design
This study was a retrospective, longitudinal, observational cohort study that utilized health insurance claims data from the Optum® Clinformatics® Data Mart (CDM) database. The CDM database is a de-identified administrative claims database that holds information from 15 to 19 million patients annually across all US census regions, including patients with commercial health plans and Medicare Advantage health plans. All patient data in the Optum CDM database were de-identified, therefore, informed consent, ethics committee, or institutional review board approval was not required. The study period ran from October 1, 2015 to June 30, 2019 (Figure 1). Patients were required to have their first diagnosis for CRSwNP (defined as index date) between April 1, 2016 and June 30, 2018, to allow for an 18-month evaluation period (6 months pre- and 12 months post-index date) during which patient clusters were identified based on input variables determined by a targeted literature search and clinical input. Input variables consisted of seven categories: demographic characteristics; allergic, eosinophilic, or inflammatory comorbidities; OCS use; INCS use; oral antibiotics use, montelukast; and sinus surgery characteristics (Supplementary Table 1). The 6-month period prior to the index date was defined as the baseline period. The observation period was defined as the period post-index date to the end of continuous eligibility or data availability (ie, June 30, 2019).
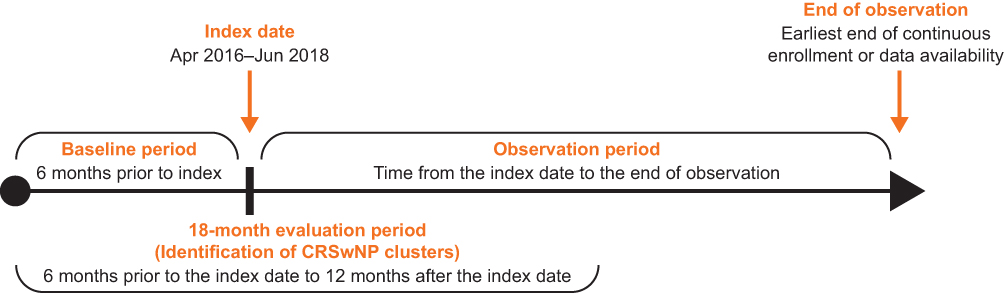 |
Figure 1 Study design. Abbreviation: CRSwNP, chronic rhinosinusitis with nasal polyps. |
Study Population
Patients were ≥18 years on their index date and had ≥18 months of continuous database enrollment (6 months pre- and 12 months post-index) with complete information on input variables (Supplementary Table 1). Eligible patients also had ≥2 medical claims with a primary or secondary diagnosis code for NP (International Classification of Diseases, Tenth Revision, Clinical Modification [ICD-10-CM]: J33.0, J33.1, J33.8, or J33.9) on different days, the first of which was defined as the index date and had to occur between April 1, 2016 and June 30, 2018. This ensured a minimum of 18 months of data available in the evaluation period.
Outcomes and Assessments
Baseline demographics, clinical characteristics and medication use were assessed during the 6-month baseline period. HRU and healthcare costs were assessed during the observation period. HRU endpoints were the annualized number of all-cause, nasal polyp (NP)-related and NP surgery-related hospitalizations, emergency department (ED) visits, outpatient visits (including office or clinic visits, ambulatory surgical center, urgent care facility visits, or outpatient hospital visits) and other visits (home/hospice care visits, visits at nursing facilities). Healthcare cost endpoints were annual all-cause, those related to nasal polyps (NP-related) and related to nasal polyp surgery (NP surgery-related) direct medical costs from the payer perspective, overall and by setting (hospitalizations, ED visits, outpatient visits, other visits, and pharmacy costs) in 2019 US dollars (USD). NP-related claims were defined as any claim on a day with any NP coded diagnosis. NP surgery-related claims were identified using Current Procedural Terminology codes based on clinical input. Claims made on the same day as a claim with NP surgery procedure codes were considered NP surgery related. NP surgery-related claims were also considered NP-related claims.
Statistical Analysis
NP patient clusters were identified using an unsupervised machine learning approach, latent class analysis (LCA). LCA uses observed patient characteristics (input variables, Supplementary Table 1) to identify distinct patient clusters (latent classes) in the study population. Each identified cluster is distinct from other clusters and relatively homogenous within the cluster in regard to patients’ clinical profiles, early treatment patterns, and disease characteristics.11 In this study, statistical justification for the number of patient clusters was provided using the Bayesian Information Criterion (BIC).12 Preliminary clusters were identified using 2-cluster to 8-cluster models. Preliminary clusters were determined according to the best fit model, based on lowest BIC value. Each patient was assigned to only one cluster for which they had the highest posterior probability estimated from the LCA model (modal assignment). Meaningfulness and interpretability of the best fit model was then evaluated. Final LCA-defined CRSwNP clusters were determined based on a combination of statistics and clinical feedback, to maximize validity of the model.
Given the noninterventional nature of this study, imbalances in distribution of baseline characteristics between CRSwNP clusters may have distorted effect estimates for the endpoints of interest. Additionally, as a patient’s presence in a particular cluster is a latent variable, there is uncertainty regarding the true cluster membership of each patient. Baseline confounding variables were controlled for using a three-step modal assignment approach incorporating inverse-probability-of-treatment weighting (IPTW) to reduce noncomparability between clusters (Supplementary Materials).13 Baseline characteristics were described for the original unweighted and the IPTW samples. In addition, characteristics that remained imbalanced across patient clusters in the IPTW sample were included in each weighted regression model for comparative analyses of HRU and healthcare costs. HRU and healthcare costs during the observation period were first described in annual terms, and then compared between clusters versus a common reference cluster (cluster 1) using multivariable regression models incorporating IPTW (Supplementary Materials). Incidence rate ratios (IRR) and associated 95% confidence intervals (CIs) were estimated for HRU, and mean differences and associated 95% CIs were estimated for healthcare costs.
Three additional, exploratory clusters were defined from the five identified clusters. These clusters were constructed to further understand the heterogeneity in economic and clinical burden across CRSwNP clusters: (1) The NP surgery cluster combined clusters of patients with a NP surgery within 12 months of the index date; (2) high-cost NP surgery cluster included patients in the surgery cluster who had total NP-related costs in the ≥80th percentile; (3) nonsurgery cluster included patients who did not have a NP surgery within 12 months of the index date. HRU and direct costs were described between the surgery cluster and the nonsurgery cluster and between the high-cost surgery cluster and the nonsurgery cluster and compared using Wilcoxon rank sum tests. Patient demographic and clinical characteristics were also described and compared using standardized differences.
Results
Identification of NP Patient Clusters via LCA
A total of 12,807 patients from the Optum CDM database met all eligibility criteria for inclusion in the study (Supplementary Figure 1). Mean (standard deviation [SD]) length of the observation period was 24.1 (7.7) months in the original unweighted sample and 24.0 (7.7) months in the weighted sample. Of the 2- to 8-cluster LCA models, the 5-cluster model had a good fit of the data and was the most clinically interpretable and clinically meaningful, while allowing for continued distinction between clusters. BIC and Akaike information criterion (AIC) for each model are available in Supplementary Table 2. The five distinct CRSwNP clusters identified are described in Figure 2.
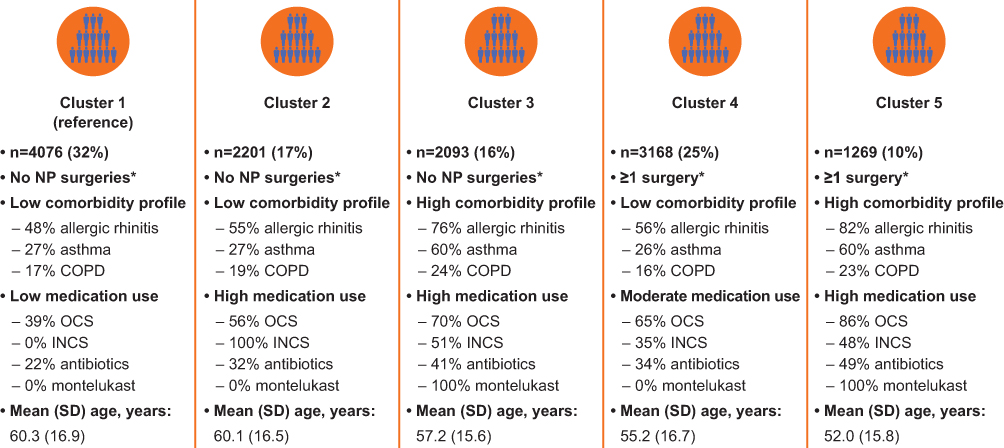 |
Figure 2 Characterization of LCA clusters. *In the 12 months following the index date. Abbreviations: COPD, chronic obstructive pulmonary disease; INCS, intranasal corticosteroids; LCA, latent class analysis; NP, nasal polyps; OCS, oral corticosteroids; SD, standard deviation. |
Baseline Demographics and Clinical Characteristics by NP Patient Cluster
In the unweighted study population, mean (SD) age at the index date was 57.7 (16.7) years and 40.4% of patients were female (Supplementary Table 3). Cluster 1 was identified and defined as the common reference cluster for comparative analysis based on the characteristics of the overall cohort. This reference cluster was characterized by no sinus surgeries within 12-months of the first CRSwNP diagnosis, low comorbidities, low medication use, and older age. While prevalence of most allergic, eosinophilic, or inflammatory comorbidities was similar across clusters, key differences between clusters in prevalence of allergic rhinitis, asthma, and chronic obstructive pulmonary disease (COPD) were observed. Patients in clusters 3 and 5 had a higher prevalence of allergic rhinitis, asthma, and COPD compared with the reference cluster. Prevalence of allergic rhinitis was also higher among patients in cluster 4 compared with the reference cluster. Baseline all-cause HRU and healthcare costs were similar across clusters except in all-cause ED visits and all-cause pharmacy costs. Cluster 5 all-cause ED visits were slightly higher than in cluster 1; all-cause pharmacy costs were higher in cluster 3 than in cluster 1. Following IPTW, the distribution of nearly all baseline characteristics was balanced across all clusters (Table 1).
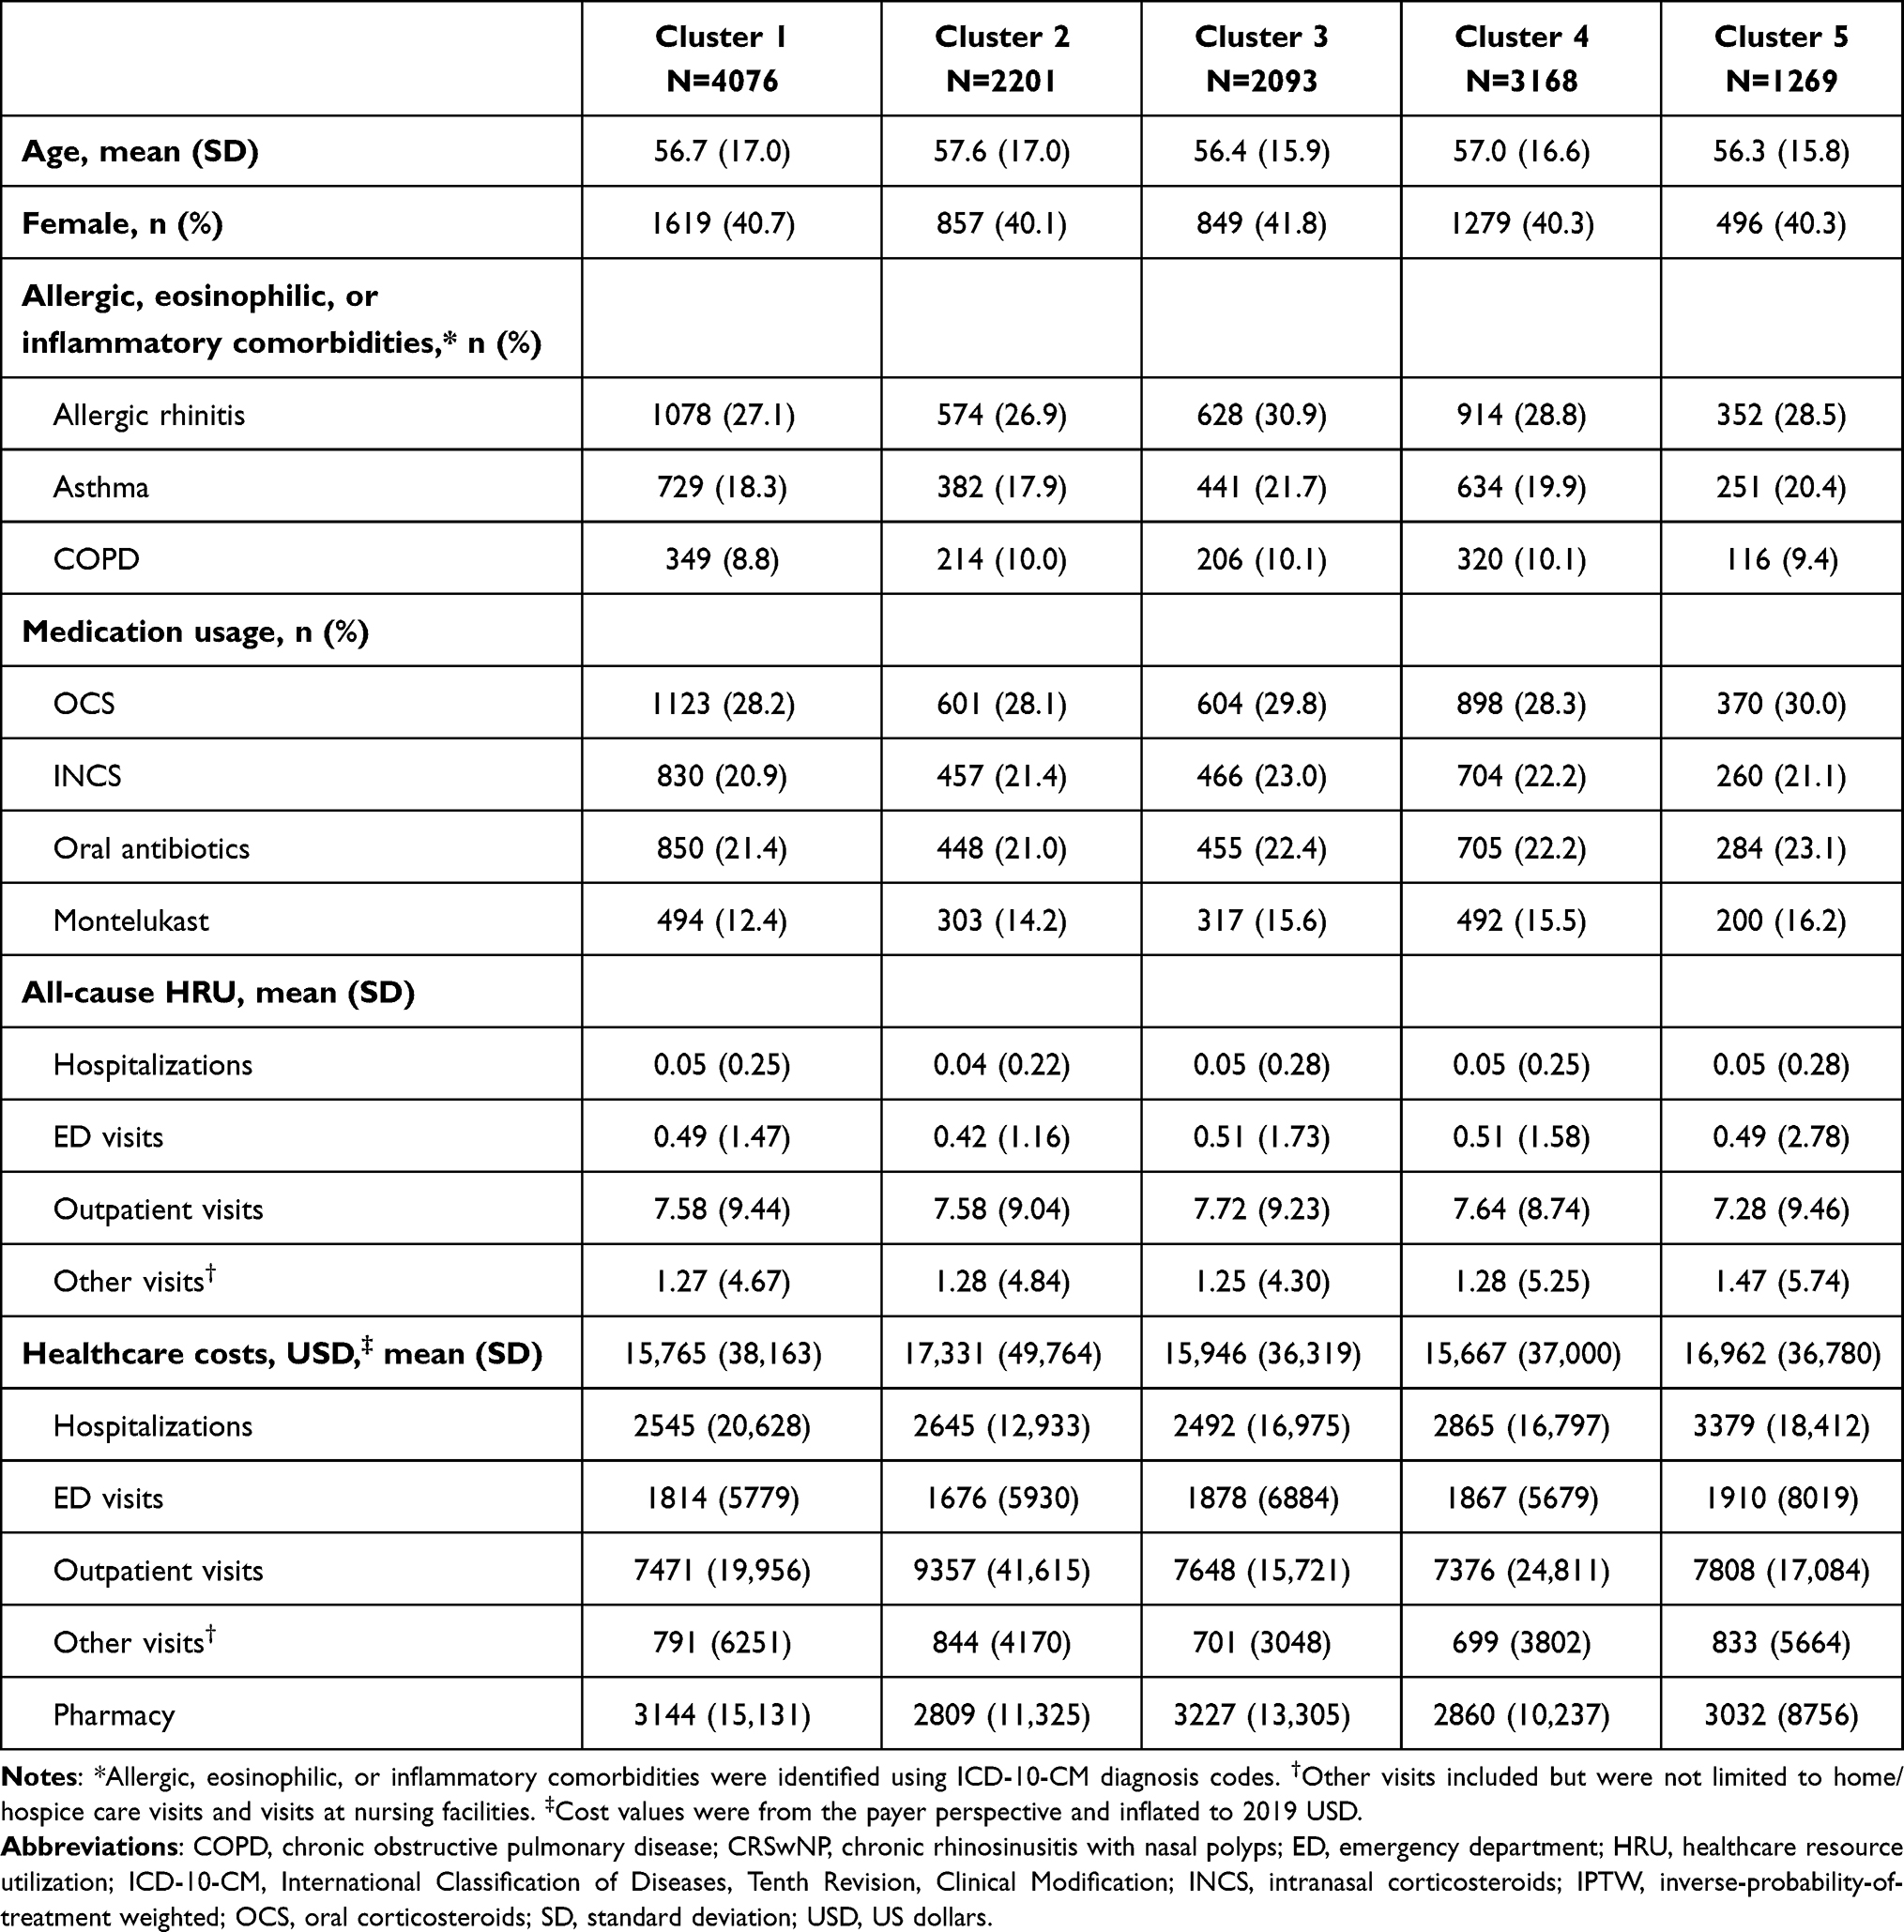 |
Table 1 Baseline Patient Characteristics for CRSwNP Patient Clusters (IPTW Sample) |
All-Cause and NP-Related HRU
After application of IPTW, mean annual rates of all-cause hospitalizations and other (home/hospice care visits, visits at nursing facilities) visits were similar across all clusters, while mean (SD) all-cause outpatient visits were highest in cluster 5 (21.05 [15.41]), and lowest in cluster 1 (17.43 [18.14]) (Table 2). NP-related outpatient visits were highest among patients from cluster 5 (3.66 [2.78]) and lowest in patients from cluster 1 (1.73 [1.73]). For NP surgery-related visits, mean (SD) annualized outpatient visits were highest among patients from cluster 5 (0.82 [1.53]), and lowest in clusters 1 (0.03 [0.19]) and 2 (0.03 [0.15]).
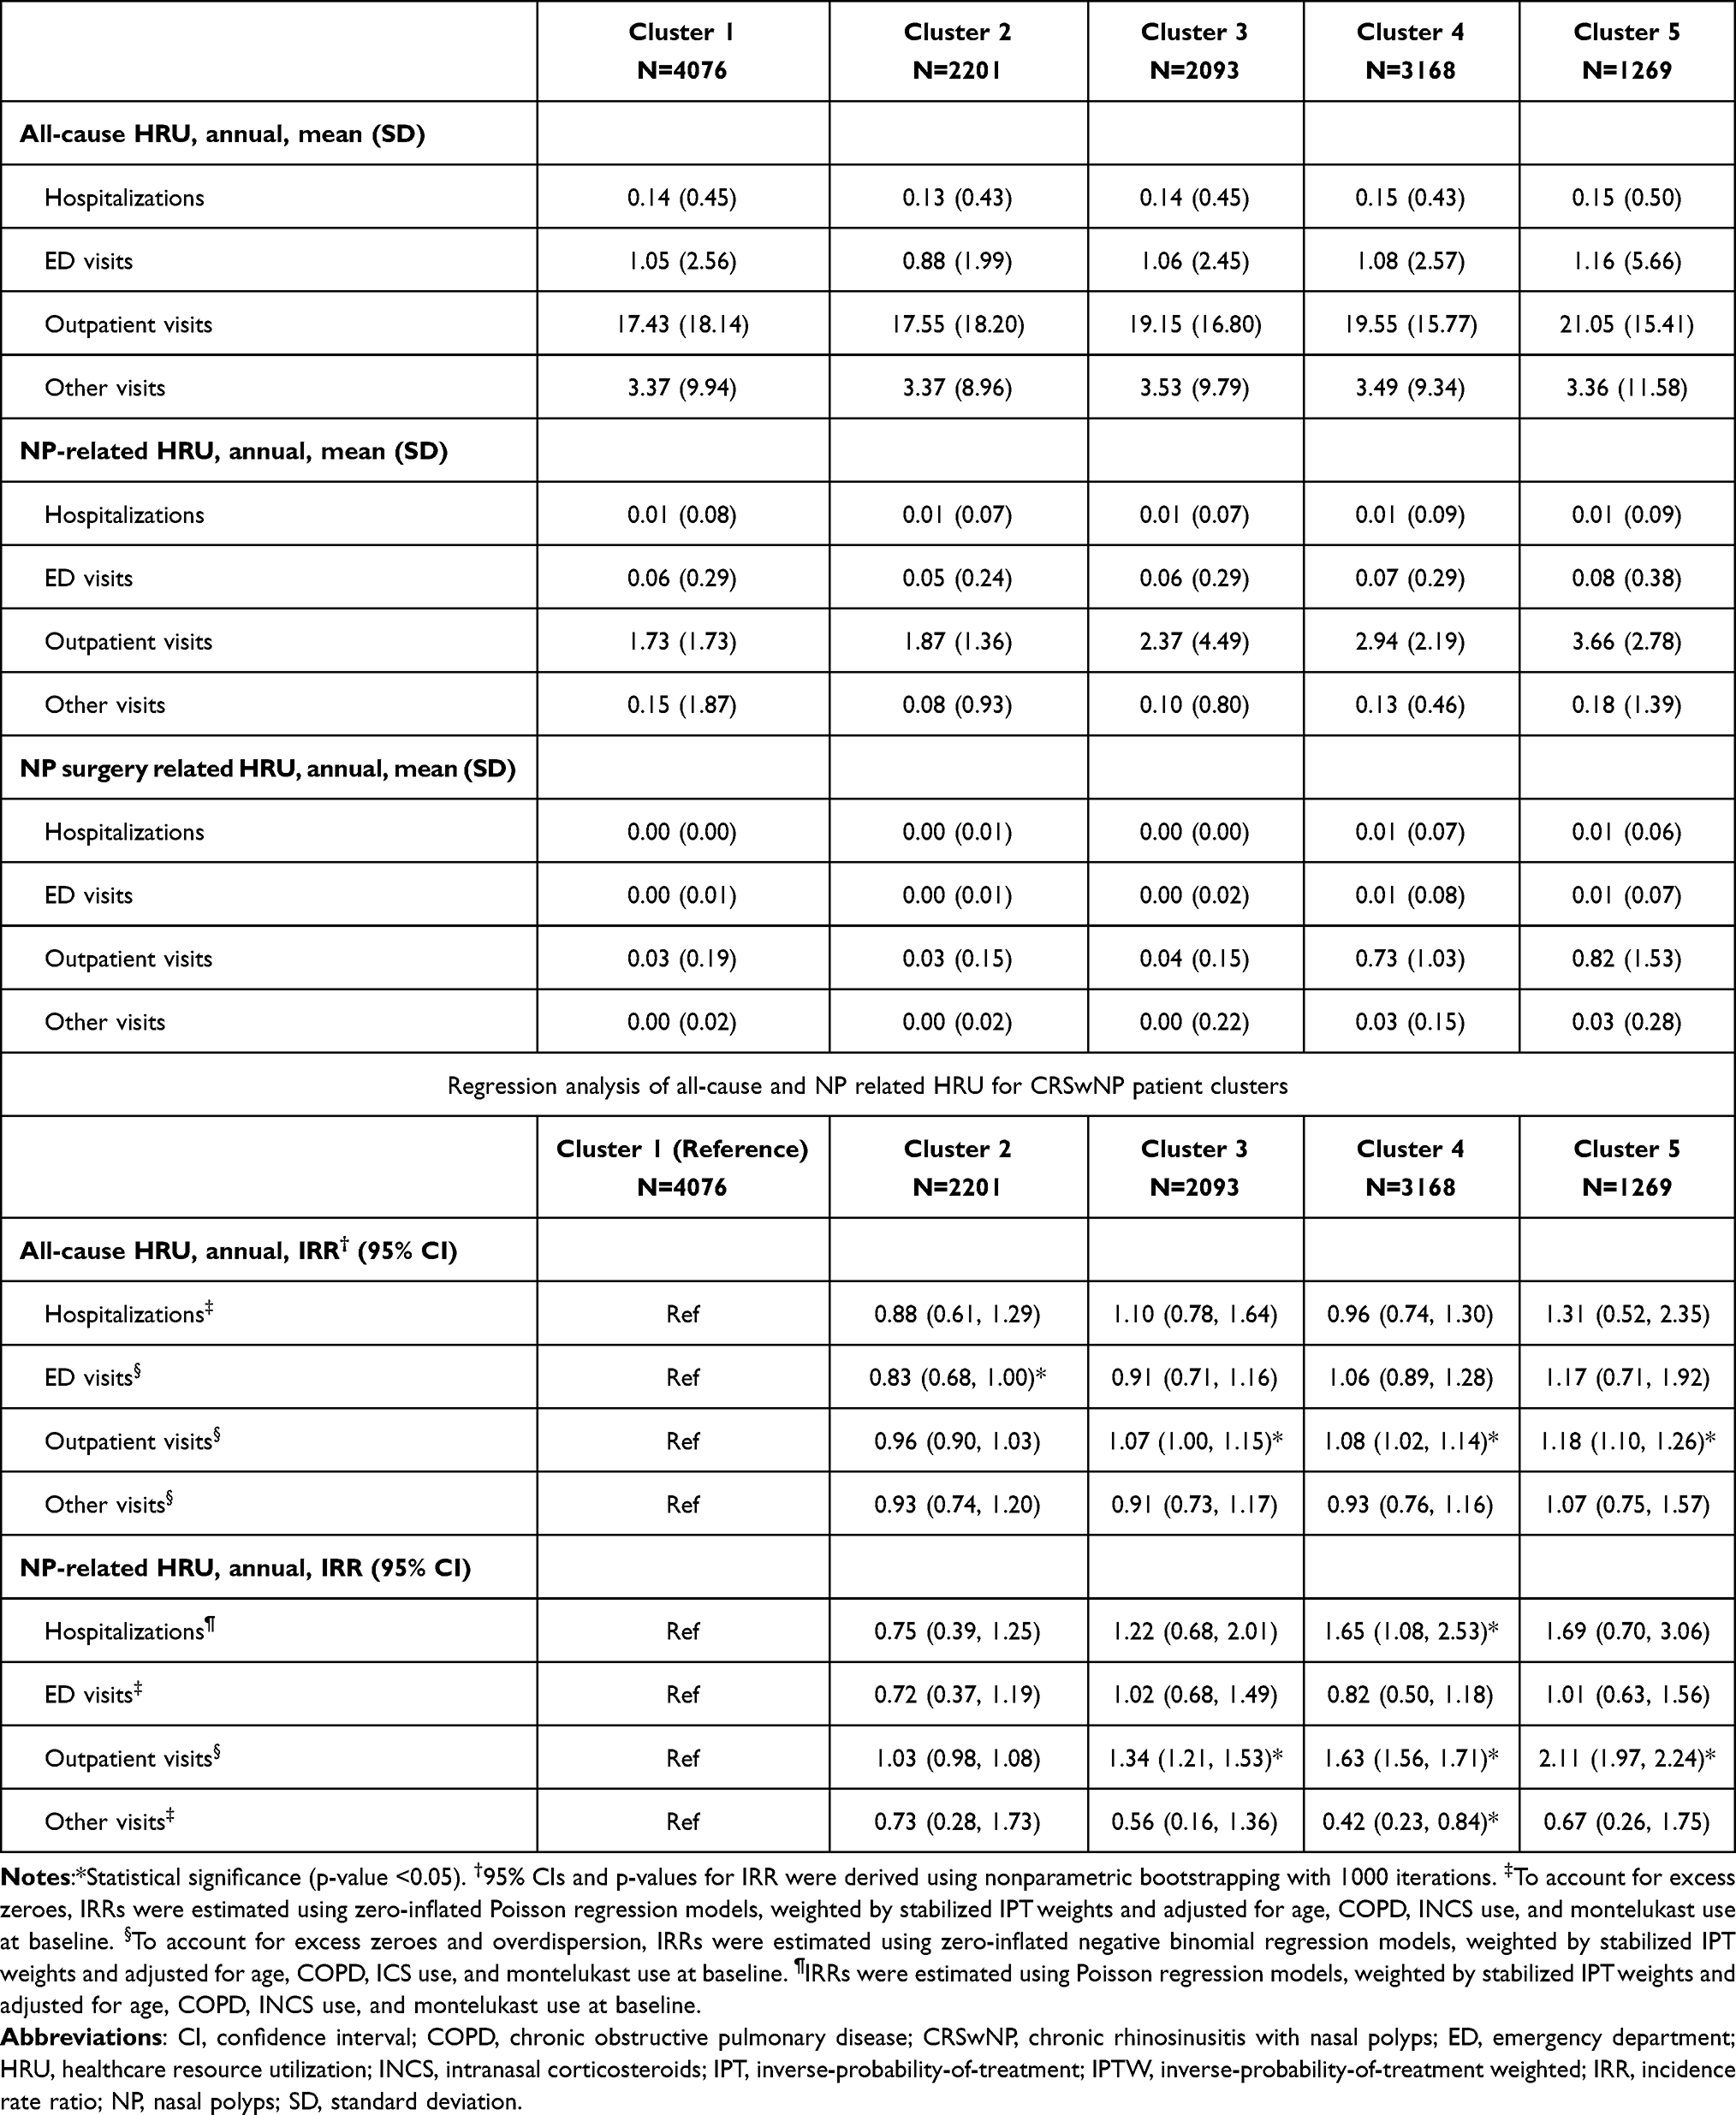 |
Table 2 Annual All-Cause, NP-Related and NP Surgery-Related HRU for CRSwNP Patient Clusters (IPTW Sample) |
In multivariable regression analyses, there were no significant differences in rates of annual all-cause hospitalizations, all-cause other visits, or NP-related ED visits between cluster 1 and each of the other clusters (Table 2). There were significantly higher rates of all-cause outpatient visits in clusters 3 (IRR [95% CI]: 1.07 [1.00, 1.15], p = 0.048), 4 (1.08 [1.02, 1.14], p = 0.008) and 5 (1.18 [1.10, 1.26], p < 0.001) compared with cluster 1. Similarly, NP-related outpatient visits were significantly higher in clusters 3 (IRR [95% CI]: 1.34 [1.21, 1.53], p < 0.001), 4 (1.63 [1.56, 1.71], p < 0.001), and 5 (2.11 [1.97, 2.24], p < 0.001) compared with cluster 1. Cluster 4 also had significantly higher rates of NP-related hospitalizations (IRR [95% CI]: 1.65 [1.08, 2.53], p = 0.0012) and NP-related other visits (0.42 [0.23, 0.84], p = 0.014) than cluster 1 (Table 2).
All-Cause and NP-Related Healthcare Costs
After implementation of IPTW, mean (SD) annual total all-cause healthcare costs in the overall study population were $21,869 ($40,519). Mean annual total all-cause costs ranged from $15,833 in cluster 2 to $31,103 in cluster 5 (Figure 3A). Highest all-causes costs were found in clusters 4 and 5 ($31,083 and $31,103, respectively). The primary driver of all-cause costs was outpatient visits, for which costs were highest among patients from clusters 4 and 5. NP-related costs were also highest for clusters 4 and 5 ($14,193 and $16,100, respectively, Figure 3B). As with all-cause costs, the primary driver of NP-related costs was outpatient visits. Clusters 4 and 5 had the highest NP-related outpatient visit, hospitalization, and ED visit costs. Similarly, mean annual total NP surgery-related costs were highest for clusters 4 and 5 ($13,023 and $14,741, respectively, Figure 3C). Again, outpatient visits were the primary driver of NP surgery-related costs. Clusters 4 and 5 had higher NP surgery-related outpatient visit, hospitalization, and ED visit costs than clusters 1, 2, and 3.
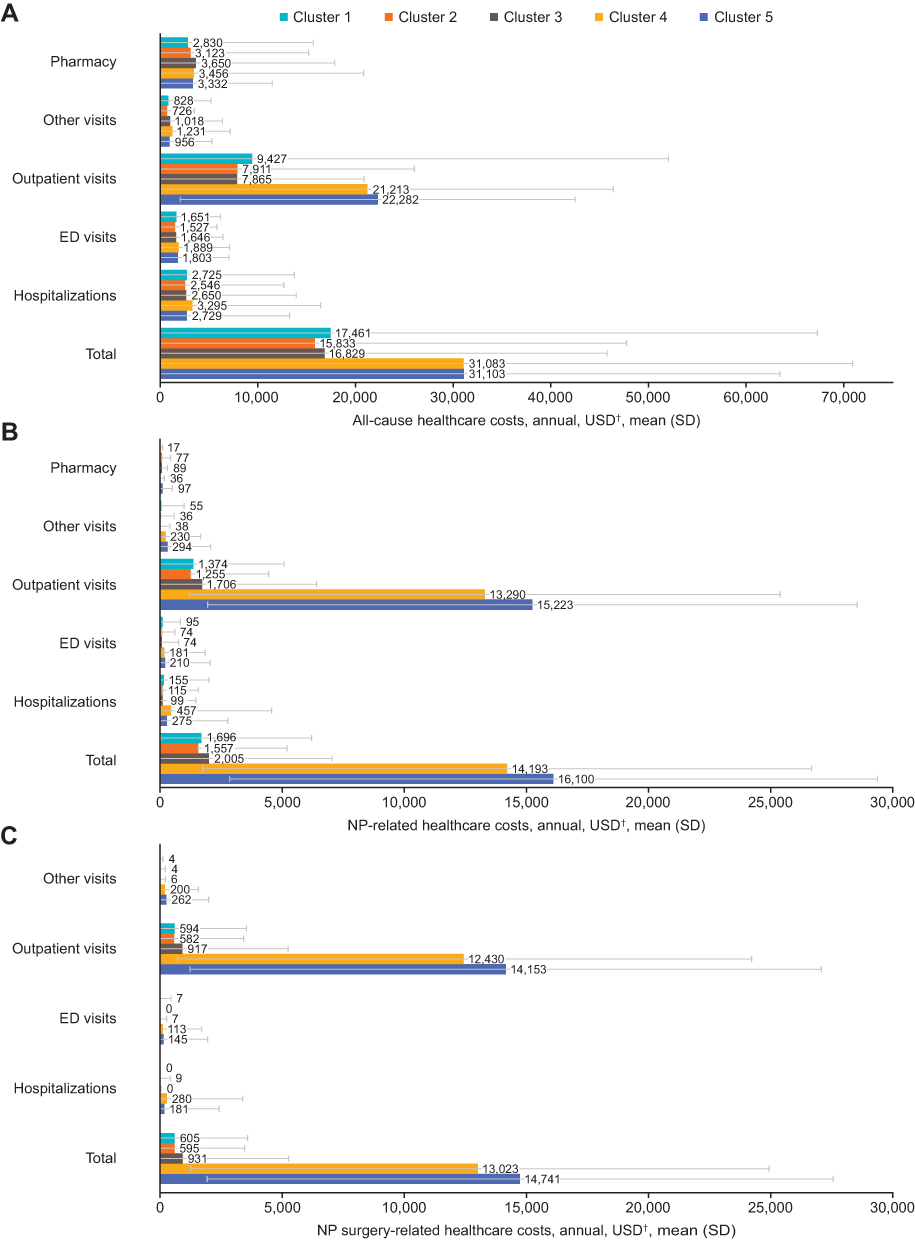 |
Figure 3 All-cause costs (A), NP-related costs (B) and NP surgery-related costs (C) for CRSwNP patient clusters in the IPTW samples. †2019 USD. Abbreviations: CRSwNP, chronic rhinosinusitis with nasal polyps; ED, emergency department; IPTW, inverse-probability-of-treatment weighting; NP, nasal polyps; SD, standard deviation; USD, US dollars. |
In multivariable regression analyses, annual total all-cause costs for clusters 4 and 5 were $14,238 (p < 0.001) and $14,399 (p < 0.001) higher than costs for cluster 1, respectively (Figure 4A). Much of this difference was incurred by significantly higher all-cause outpatient costs than cluster 1 (cost difference: $12,592, p < 0.001 and $13,874, p < 0.001, respectively). Similarly, total NP-related annual costs in clusters 4 and 5 were $11,982 (p < 0.001) and $13,680 (p < 0.001) higher than costs in cluster 1, respectively (Figure 4B). These costs were incurred primarily for outpatient visits, ED costs, other costs, and pharmacy costs.
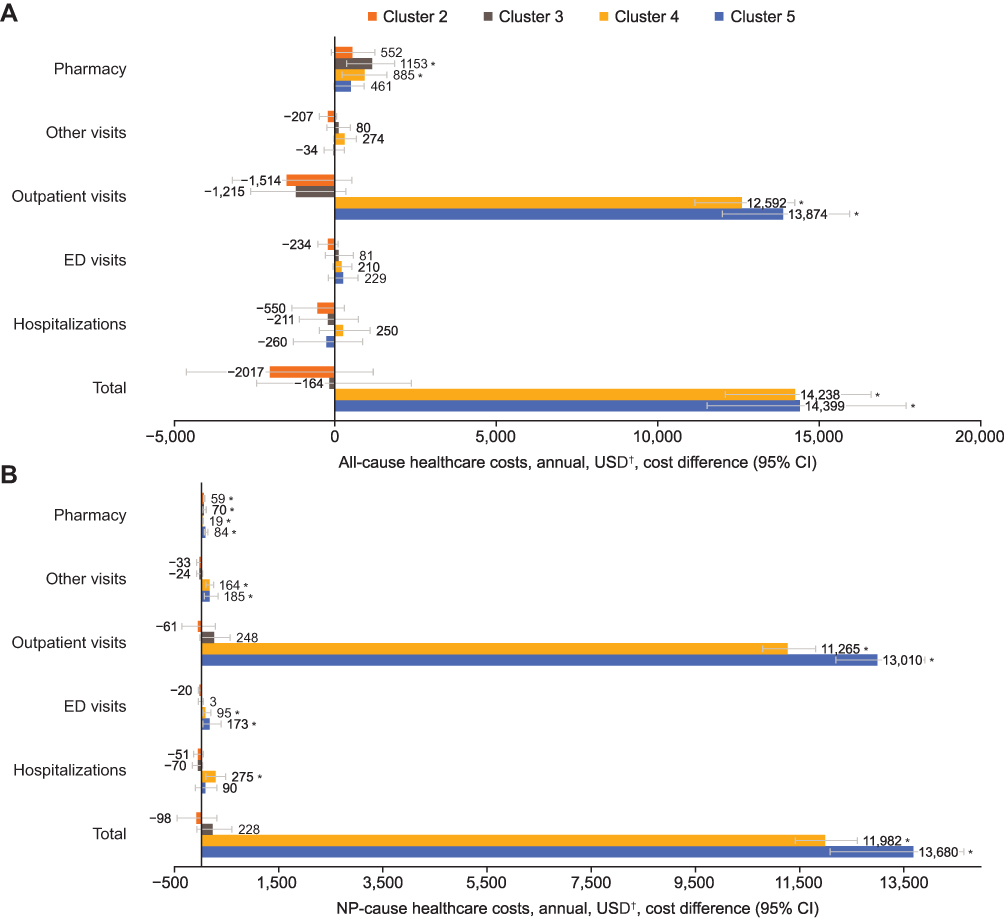 |
Figure 4 Differences in all-cause (A) and NP-related (B) healthcare costs for NP patient clusters identified through LCA in the IPTW samples. *p ≤ 0.05. †2019 USD. 95% CIs and p-values for cost difference estimates were derived using nonparametric bootstrapping with 1000 iterations. Cost differences were estimated using generalized linear models with a gamma distribution and a log-link function, weighted by stabilized IPTW and adjusted for age, COPD, INCS use, and montelukast use at baseline. Pharmacy and other visit cost differences were estimated using two-part models with a logistic regression model (for estimating the probability of observing a nonzero cost outcome) and a generalized linear model with a gamma distribution and a log-link function, weighted by stabilized IPTW and adjusted for age, COPD, INCS use, and montelukast use at baseline. Abbreviations: CI, confidence interval; COPD, chronic obstructive pulmonary disease; ED, emergency department; INCS, intranasal corticosteroids; IPTW, inverse-probability-of-treatment weighting; LCA, latent class analysis; NP, nasal polyps; SD, standard deviation; USD, US dollars. |
Characteristics of the High-Cost NP Surgery Cluster
As detailed in the methods, three exploratory clusters were derived from the original five identified clusters: NP surgery cluster, high-cost NP surgery cluster, and nonsurgery cluster (Supplementary Tables 4 and 5). Clusters 4 and 5 comprised the NP surgery cluster which included 4437 (34.6%) patients who had undergone ≥1 NP surgery within 12 months of CRSwNP diagnosis. The high-cost NP surgery cluster included 888 (6.9%) patients who underwent an NP surgery within 12 months of their CRSwNP diagnosis and had incurred total NP-related healthcare costs of ≥$23,260 (≥80th percentile) during the observation period. The nonsurgery cluster was drawn from clusters 1, 2, and 3 and included 8370 (65.4%) patients who did not undergo a NP surgery within 12 months of their CRSwNP diagnosis. All patients in the high-cost NP surgery cluster received 1 (77.8%) or ≥2 (22.2%) NP surgeries during the observation period (Supplementary Table 4). Patients in the high-cost NP surgery cluster had a higher prevalence of allergic rhinitis, severe asthma, allergic fungal rhinosinusitis, and cystic fibrosis than patients in the nonsurgery cluster during the study period. Patients in the high-cost NP surgery cluster had higher OCS use (82.0% vs 61.0%), oral antibiotic use (52.8% vs 41.9%) and montelukast use (42.1% vs 29.2%) than patients in the nonsurgery cluster during the observation period.
HRU and Healthcare Costs in the High-Cost NP Surgery Cluster
The high-cost NP surgery cluster had higher all-cause, NP-related, and NP surgery-related HRU than the nonsurgery cluster, except in the case of all-cause other visits (Supplementary Table 5). The high-cost NP surgery cluster also had substantially higher all-cause, NP-related, and NP surgery-related costs compared with the nonsurgery cluster. Again, costs were primarily driven by outpatient visit costs. Patients in the high-cost NP surgery cluster incurred surgery-related costs of $33,845 compared with $14,397 in the NP surgery cluster and $622 in the nonsurgery cluster.
Discussion
This analysis used health insurance claims data from the Optum CDM database and an unsupervised machine learning approach informed by clinical validation to identify five distinct clusters of patients with CRSwNP, differentiated by surgical history, medication usage, and comorbidity burden. Prior to IPTW, the clusters had similar baseline all-cause HRU and healthcare costs. The only exceptions were cluster 3, which had higher all-cause pharmacy costs and cluster 5 with higher all-cause ED visits compared with cluster 1. IPTW allowed for confounding variables to be controlled and, after this statistical technique was applied, baseline HRU during the period of observation was generally similar across clusters. However, it was noted that, following IPTW, patients who had undergone sinus surgery for NP (represented by clusters 4 and 5) had significantly higher rates of HRU and healthcare costs during the period of observation, both of which were primarily driven by outpatient visits. While this analysis represents a novel approach and provides new insights into the heterogeneity in the clinical profile and economic burden among patients with CRSwNP, these findings are also consistent with previous studies, which have shown that direct costs in CRSwNP are primarily driven by outpatient visits, prescription costs, and NP surgeries.8,14 Although this study did not differentiate between pre- and postoperative HRU or costs, these higher NP-related HRU and costs may in part be due to worsening disease severity between the cohorts. The total NP-related costs in these patients (cluster 4: $11,982, cluster 5: $13,680) are slightly higher than the total average costs of NP surgery ($8500–$11,000 [2016 USD], approximately $9054–$11,717 in 2019 USD) previously reported for the general US CRS population.14 Patients assigned to clusters 4 and 5 were identified as having an NP surgery within 12-months of their index date, these findings indicate that NP surgeries were a primary driver of excess costs, and as such these patients should be considered high-burden patients.
Substantial heterogeneity in the clinical profile and economic burden remained prevalent across all five of the CRSwNP clusters. The exploratory clusters allowed for an examination of the characteristics driving costs for the overall CRSwNP population. The high-cost NP surgery cluster (ie, surgical patients from clusters 4 and 5 whose NP-related costs were among the top 20% of the NP surgery cluster) were a substantial driver of total costs in the overall population, with mean annual all-cause costs of $57,807, more than double that in the overall NP population. Mean annual NP surgery-related costs of $33,845 were six times higher than that in the overall NP population. These patients were also more likely to have allergic, eosinophilic, or inflammatory comorbidities than patients in the nonsurgery cluster. As seen in clusters 4 and 5, data on this high-cost NP surgery cluster indicate that NP surgeries are a primary driver of excess costs in patients with CRSwNP. High economic burden among this subset of patients represents an unmet treatment need, which should be addressed by improved disease control strategies to avoid repeated revision surgeries and high costs to the healthcare system, payers, and patients. Notably, all three characteristics identified by machine learning (repeat surgery, high medication use, and inflammatory comorbidities) are characteristic of type 2 inflammation. In particular, the prevalence of allergic, eosinophilic, and inflammatory comorbidities is consistent with the pathophysiology of CRSwNP, which includes higher levels of type 2 inflammation, eosinophilic inflammation, and elevated blood eosinophils.2,3
The methodology outlined in this study provides a model for not only real-world analysis, but also a novel approach to economic and HRU-based phenotyping of CRSwNP in a manner that could inform and shape clinical decision-making in practice. CRSwNP phenotyping by cluster analysis can offer practitioners insights not easily attained or verified by other methods and provide practical guidance to specialists who aim to tailor their plan of care to individual patient needs whether that be closer monitoring, heightened communication, more frequent visitation, or more aggressive therapeutic medicinal and surgical intervention. To better tailor patient management plans for CRSwNP, our findings suggest that healthcare practitioners could consider their patients based on three factors: surgery status (number of previous NP surgeries), medication burden (number of prescribed medications), and comorbidities (inflammatory conditions co-occurring with CRSwNP). Overall, the results of this study highlight the utility of novel machine learning-based phenotyping approaches, which may improve clinical management and enhance individualized care. LCA allows for the identification of clusters of patients and quantifies the prevalence of the cluster, which is in contrast to traditional regressions, which treat the population as an average. Furthermore, LCA is an unsupervised machine learning method that allows the computer to comb through large amounts of data to discover notable patterns (ie, the 5 clusters identified in this study) that naturally exist among the patient population. It is important to note that this is different from subgroup analyses conducted in previously published studies. Subgroup analysis is a supervised method that requires a preconceived hypothesis to differentiate patients based on specific characteristics (eg, patients who have had NP surgery vs those who have not). This older method of pre-specifying subgroups may result in important characteristics being overlooked (particularly those not already identified in the literature), whether by themselves or in combination with other characteristics, and may also result in the identification of less relevant characteristics.
There are several limitations to the approach taken in this study. First, this analysis did not evaluate indirect costs such as absence from work or lost productivity, which are common occurrences in patients with CRSwNP.15,16 As such, the true overall cost burden associated with CRSwNP may have been underestimated. Second, as the average follow-up time in this study was approximately 24-months, a long-term economic burden cannot be estimated. Additionally, as CRSwNP is a chronic disease, some of the baseline HRU, healthcare costs, and surgeries may not have been captured during the 6-month baseline period. Furthermore, the study did not consider patient flux between clusters over time, where for example a patient in cluster 3 may have progressed to cluster 4. Long-term durability of cluster membership is of interest in further studies. Third, use of administrative claims data also has inherent limitations because data can be incomplete, inaccurate, or missing and incorrect diagnostic codes can be used.17 However, the need for two separate claims with a code for NP enhanced the specificity in identification of patients with CRSwNP. Additionally, in some cases, patients may have been seen for other illnesses such as asthma or diabetes at the same time as a NP-related treatment, thus some overestimation of NP-related HRU or costs may have occurred. Fourth, this study did not evaluate whether patients with repeated surgical intervention, who likely have a more severe disease burden, would have incurred even higher costs in the absence of surgical treatment if they received alternative therapeutic interventions. While the discussion of biologics is out of scope for this paper, the long-term, common standard of care measured in this analysis did include surgery. This study provides insight into the patients who might have the highest burden of disease and who may require more frequent care, closer monitoring, more aggressive intervention, and/or alternative therapeutic approaches. Finally, use of a commercial insurance database may not be representative of the overall CRSwNP population in the United States.
Conclusions
Machine learning alongside clinician validation, offers a structured approach to better understand the burden of illness in CRSwNP by distilling vast quantities of data into clearer patterns, characteristics, and, in turn, patient subgroups or phenotypes. Overall, the results of this study highlight that patients with CRSwNP who had multiple NP surgeries were more likely to have a higher disease burden and CRSwNP-related comorbidities resulting from type 2 inflammation. Above all, this subgroup of patients have overall higher healthcare utilization, medication burden and increased costs. Taken together, this study provides valuable insight into the distinct characteristics of patient subpopulations that may help to inform treatment decisions and in return reduce costs to payers and patients. Future studies to assess the movement of patients across clusters over a longer follow-up period and to evaluate both direct and indirect costs associated with CRSwNP are warranted.
Acknowledgments
Editorial support (in the form of writing assistance, including preparation of the draft manuscript under the direction and guidance of the authors, collating and incorporating authors’ comments for each draft, assembling tables and figures, grammatical editing and referencing) was provided by Ciara Keogh, PhD, at Fishawack Indicia Ltd, UK, part of Fishawack Health, and was funded by GSK.
Author Contributions
All authors made a significant contribution to the work reported, whether that is in the conception, study design, execution, acquisition of data, analysis and interpretation, or in all these areas; took part in drafting, revising or critically reviewing the article; gave final approval of the version to be published; have agreed on the journal to which the article has been submitted; and agree to be accountable for all aspects of the work.
Funding
This study was funded by GSK (GSK ID: 213333).
Disclosure
NB is a consultant for Analysis Group, which provided funding to NB based on the funding received from GSK. JS is a permanent GSK employee and holds GSK shares. MB and BH were permanent employees of GSK at the time of this study and hold GSK shares. KKS, WYC, MC, HCC, and MSD are employees of Analysis Group, which received funding from GSK to conduct this study. The authors report no other conflicts of interest in this work.
References
1. Stevens WW, Schleimer RP, Kern RC. Chronic rhinosinusitis with nasal polyps. J Allergy Clin Immunol Pract. 2016;4(4):565–572. doi:10.1016/j.jaip.2016.04.012
2. Fokkens WJ, Lund VJ, Hopkins C, et al. European position paper on rhinosinusitis and nasal polyps 2020. Rhinology. 2020;58(Suppl S29):1–464. doi:10.4193/Rhin20.401
3. Bachert C, Han JK, Wagenmann M, et al. EUFOREA expert board meeting on uncontrolled severe chronic rhinosinusitis with nasal polyps (CRSwNP) and biologics: definitions and management. J Allergy Clin Immunol. 2021;147(1):29–36. doi:10.1016/j.jaci.2020.11.013
4. Calus L, Van Bruaene N, Bosteels C, et al. Twelve-year follow-up study after endoscopic sinus surgery in patients with chronic rhinosinusitis with nasal polyposis. Clin Transl Allergy. 2019;9:30. doi:10.1186/s13601-019-0269-4
5. DeConde AS, Mace JC, Levy JM, Rudmik L, Alt JA, Smith TL. Prevalence of polyp recurrence after endoscopic sinus surgery for chronic rhinosinusitis with nasal polyposis. Laryngoscope. 2017;127(3):550–555. doi:10.1002/lary.26391
6. Alobid I, Benítez P, Bernal-Sprekelsen M, et al. Nasal polyposis and its impact on quality of life: comparison between the effects of medical and surgical treatments. Allergy. 2005;60(4):452–458. doi:10.1111/j.1398-9995.2005.00725.x
7. Sahlstrand-Johnson P, Ohlsson B, Von Buchwald C, Jannert M, Ahlner-Elmqvist M. A multi-centre study on quality of life and absenteeism in patients with CRS referred for endoscopic surgery. Rhinology. 2011;49(4):420–428. doi:10.4193/Rhino11.101
8. Bhattacharyya N, Villeneuve S, Joish VN, et al. Cost burden and resource utilization in patients with chronic rhinosinusitis and nasal polyps. Laryngoscope. 2019;129(9):1969–1975. doi:10.1002/lary.27852
9. Chen S, Zhou A, Emmanuel B, Garcia D, Rosta E. Systematic literature review of humanistic and economic burdens of chronic rhinosinusitis with nasal polyposis. Curr Med Res Opin. 2020;36(11):1913–1926. doi:10.1080/03007995.2020.1815683
10. Kaplan A, Cao H, FitzGerald JM, et al. Artificial intelligence/machine learning in respiratory medicine and potential role in asthma and COPD diagnosis. J Allergy Clin Immunol Pract. 2021;9(6):2255–2261. doi:10.1016/j.jaip.2021.02.014
11. Lanza ST, Collins LM, Lemmon DR, Schafer JL. PROC LCA: a SAS procedure for latent class analysis. Struct Equ Modeling. 2007;14(4):671–694. doi:10.1080/10705510701575602
12. Austin PC. Balance diagnostics for comparing the distribution of baseline covariates between treatment groups in propensity-score matched samples. Stat Med. 2009;28(25):3083–3107. doi:10.1002/sim.3697
13. Schuler MS, Leoutsakos JS, Stuart EA. Addressing confounding when estimating the effects of latent classes on distal outcome. Health Serv Outcomes Res Methodol. 2014;14(4):232–254. doi:10.1007/s10742-014-0122-0
14. Rudmik L. Economics of chronic rhinosinusitis. Curr Allergy Asthma Rep. 2017;17(4):20. doi:10.1007/s11882-017-0690-5
15. Chowdhury NI, Mace JC, Smith TL, Rudmik L. What drives productivity loss in chronic rhinosinusitis? A SNOT-22 subdomain analysis. Laryngoscope. 2018;128(1):23–30. doi:10.1002/lary.26723
16. Rudmik L, Smith TL, Schlosser RJ, Hwang PH, Mace JC, Soler ZM. Productivity costs in patients with refractory chronic rhinosinusitis. Laryngoscope. 2014;124(9):2007–2012. doi:10.1002/lary.24630
17. Birkhead GS, Klompas M, Shah NR. Uses of electronic health records for public health surveillance to advance public health. Annu Rev Public Health. 2015;36(1):345–359. doi:10.1146/annurev-publhealth-031914-122747
 © 2022 The Author(s). This work is published and licensed by Dove Medical Press Limited. The
full terms of this license are available at https://www.dovepress.com/terms
and incorporate the Creative Commons Attribution
- Non Commercial (unported, 3.0) License.
By accessing the work you hereby accept the Terms. Non-commercial uses of the work are permitted
without any further permission from Dove Medical Press Limited, provided the work is properly
attributed. For permission for commercial use of this work, please see paragraphs 4.2 and 5 of our Terms.
© 2022 The Author(s). This work is published and licensed by Dove Medical Press Limited. The
full terms of this license are available at https://www.dovepress.com/terms
and incorporate the Creative Commons Attribution
- Non Commercial (unported, 3.0) License.
By accessing the work you hereby accept the Terms. Non-commercial uses of the work are permitted
without any further permission from Dove Medical Press Limited, provided the work is properly
attributed. For permission for commercial use of this work, please see paragraphs 4.2 and 5 of our Terms.
Recommended articles
Improvement in Health-Related Quality of Life with Dupilumab in Patients with Moderate-to-Severe Asthma with Comorbid Chronic Rhinosinusitis with/without Nasal Polyps: An Analysis of the QUEST Study
Hopkins C, Buchheit KM, Heffler E, Cohen NA, Olze H, Khan AH, Msihid J, Siddiqui S, Nash S, Jacob-Nara JA, Rowe PJ, Deniz Y
Journal of Asthma and Allergy 2022, 15:767-773
Published Date: 7 June 2022
Tezepelumab Efficacy in Patients with Severe, Uncontrolled Asthma with Comorbid Nasal Polyps in NAVIGATOR

Laidlaw TM, Menzies-Gow A, Caveney S, Han JK, Martin N, Israel E, Lee JK, Llanos JP, Martin N, Megally A, Parikh B, Vong S, Welte T, Corren J
Journal of Asthma and Allergy 2023, 16:915-932
Published Date: 4 September 2023
Remodeling of Paranasal Sinuses Mucosa Functions in Response to Biofilm-Induced Inflammation
Kaliniak S, Fiedoruk K, Spałek J, Piktel E, Durnaś B, Góźdź S, Bucki R, Okła S
Journal of Inflammation Research 2024, 17:1295-1323
Published Date: 26 February 2024
An Integrated Machine Learning Framework for Developing and Validating a Diagnostic Model of Hub Genes Related to Lipid Metabolism in Chronic Rhinosinusitis
Xiong P, Liu L, Pi J, Wang J, Lu T, Ke X, Jiang Y, Shen Y, Yang Y
Journal of Inflammation Research 2025, 18:10081-10098
Published Date: 30 July 2025
Artificial Intelligence in the Management of Asthma: A Review of a New Frontier in Patient Care
Tan LD, Nguyen N, Lopez E, Peverini D, Shedd M, Alismail A, Nguyen HB
Journal of Asthma and Allergy 2025, 18:1179-1191
Published Date: 16 August 2025