")
Back to Journals » Diabetes, Metabolic Syndrome and Obesity » Volume 16
Profilin1 Promotes Renal Tubular Epithelial Cell Apoptosis in Diabetic Nephropathy Through the Hedgehog Signaling Pathway
Authors Mai L, He G, Chen J, Zhu J, Chen S, Yang H, Zhang M, Hou X, Ke M, Li X
Received 22 March 2023
Accepted for publication 30 May 2023
Published 9 June 2023 Volume 2023:16 Pages 1731—1743
DOI https://doi.org/10.2147/DMSO.S411781
Checked for plagiarism Yes
Review by Single anonymous peer review
Peer reviewer comments 2
Editor who approved publication: Professor Gian Paolo Fadini
Liping Mai,1,* Guodong He,1,* Jing Chen,1 Jiening Zhu,1 Shaoxian Chen,1 Hui Yang,1 Mengzhen Zhang,1 Xinghua Hou,1 Miaola Ke,2 Xiaohong Li1,3
1Medical Research Institute, Guangdong Provincial People’s Hospital (Guangdong Academy of Medical Sciences), Southern Medical University, Guangzhou, 510080, People’s Republic of China; 2Department of Blood Transfusion, State Key Laboratory of Oncology in South China, Sun Yat-Sen University Cancer Center, Guangzhou, 510060, People’s Republic of China; 3Guangdong Provincial Key Laboratory of South China Structural Heart Disease, Guangdong Provincial People’s Hospital (Guangdong Academy of Medical Sciences), Southern Medical University, Guangzhou, 510080, People’s Republic of China
*These authors contributed equally to this work
Correspondence: Xiaohong Li, Medical Research Institute, Guangdong Provincial People’s Hospital (Guangdong Academy of Medical Sciences), Southern Medical University, Guangzhou, 510080, People’s Republic of China, Email [email protected] Miaola Ke, Department of Blood Transfusion, State Key Laboratory of Oncology in South China, Sun Yat-Sen University Cancer Center, Guangzhou, 510060, People’s Republic of China, Email [email protected]
Background: Profilin-1 (PFN1) regulates the dynamic balance of actin and plays an important role in cell functions as a hub protein in signaling molecule interaction networks. Dysregulation of PFN1 is related to pathologic kidney diseases. Diabetic nephropathy (DN) was recently reported as an inflammatory disorder, however, the molecular mechanisms of PFN1 in DN remain unclear. Therefore, the present study was conducted to explore the molecular and bioinformatic characteristics of PFN1 in DN.
Methods: Bioinformatics analyses were performed on the chip of database in DN kidney tissues. A cellular model of DN was established in human renal tubular epithelial cells (HK-2) induced by high glucose. The PFN1 gene was overexpressed or knocked-down to investigate its function in DN. Flow cytometry was used to detect cell proliferation and apoptosis. PFN1 and proteins in the related signaling pathways were evaluated by Western blotting.
Results: The expression of PFN1 was significantly increased in DN kidney tissues (P < 0.001) and was correlated with a high apoptosis-associated score (Pearson’s correlation = 0.664) and cellular senescence-associated score (Pearson’s correlation = 0.703). PFN1 protein was mainly located in cytoplasm. Overexpression of PFN1 promoted apoptosis and blocked the proliferation of HK-2 cells treated with high levels of glucose. Knockdown of PFN1 led to the opposite effects. Additionally, we found that PFN1 was correlated with the inactivation of the Hedgehog signaling pathway in HK-2 cells treated with high levels of glucose.
Conclusion: PFN1 might play an integral role in the regulation of cell proliferation and apoptosis during DN development by activating the Hedgehog signaling pathway. This study provided molecular and bioinformatic characterizations of PFN1, and contributed to the understanding of the molecular mechanisms leading to DN.
Keywords: PFN1, diabetic nephropathy, bioinformatic characterization, Hedgehog signaling pathway, apoptosis
Introduction
Diabetic nephropathy (DN), a significant microvascular complication of diabetes, has become the leading cause of renal failure worldwide. Recently, accumulating evidence from experimental and clinical studies has indicated that DN is caused by oxidative stress, inflammatory disorders, and metabolic disorders at onset and following progression of the disease.1,2 High glucose (HG)-induced mitochondrial dysfunction and the production of a large amount of reactive oxygen species (ROS) increase nuclear factor kappa-B (NF- κ B) levels and cause kidney injury, especially tubular injury, which is an important pathological feature of DN.3 Thus, to explore the underlying mechanisms of HG-induced tubular injury is for seeking a novel therapeutic strategy for DN.
Apoptosis is an important biological process, mediating the pathogenesis and development of DN. Renal cells are progressively lost during apoptosis induced by glomerular sclerosis, tubular atrophy, and fibrosis interstitial. Recent research indicated that Ck2alpha can induce renal fibrosis through Profilin1. Ck2alpha knockout can inhibit mitochondrial dysfunction and restore cellular senescence and the cell cycle.4
Profilin1 (PFN1) is one of the subtypes of PFN, which is an actin binding protein that is highly evolutionarily conserved and exists widely in all eukaryotes. As a key small actin regulatory protein, PFN1 regulates the polymerization and depolymerization of actin through its domain, and mediates the contraction of cells and the change of cytoskeleton.5 PFN1 is low expressed in glomerular tissue, however, moderately expressed in renal tubules.
Recent evidence indicated that PFN1 not only regulated the dynamic balance of actin remodeling, but also acted as a key hub gene in some signaling pathways, participating in a series of important physiological and pathological processes.6 PFN1 plays a critical role in regulating many cell functions, including membrane transport, endocytosis, cell cycle, proliferation, and autophagy. PFN1 deletion or abnormal expression can affect normal physiological activities and lead to disease. Recent studies also showed that PFN1 is correlated with breast cancer, liver cancer, pancreatic cancer, and other malignant tumors.7–9 PFN1 overexpression inhibits the tumorigenicity of cancer cells through the typical intrinsic apoptotic pathway.10,11 Therefore, as a tumor suppressor, PFN1 is considered to promote the apoptosis of cancer cells. In addition, high glucose levels increased PFN1 and HIF-1α expression, which are associated with the increased cell permeability and apoptosis in microvascular endothelial dysfunction during diabetic retinopathy.12 Down regulation of PFN1 expression reduced advanced glycation end products (AGEs)-induced apoptosis.13 Nevertheless, the underlying molecular mechanisms of PFN1 have yet to be elucidated.
PFN1 deletion accelerates DNA damage-mediated apoptosis due to the phosphorylation inactivation and Akt activation.14 However, the predisposing factors of DN remain unclear and the molecular mechanisms of PFN1 in DN are also largely unknown.
To better understand the role of PFN1 in DN pathogenesis, PFN1 expression was analyzed using the GENE EXPRESSION OMNIBUS (GEO) database. Analyses of differentially expressed genes (DEGs), Gene Ontology (GO), and Kyoto Encyclopedia of Genes and Genomes (KEGG) pathways were analyzed. We also assessed the relationship between PFN1 and the Hedgehog signaling pathway in HG-induced HK-2 cells to explore the molecular mechanisms of DN.
Materials and Methods
Bioinformatics Analysis
Data Download
From the official website of the Gene Expression Omnibus (GEO) database (https://www.ncbi.nlm.nih.gov/geo/), we downloaded the sample sources of reliable diabetic nephropathy patients’ chip data to express the original dataset, GSE 30122,15,16 using R software (version 4.0.2, http://r-project.org/). The Affy package17 was used to read the original data, and obtain the gene expression matrix of the dataset using background correction and data homogenization. The samples in the dataset were from Homo sapiens. The platform was based on the GPL571 [hg-u133a_2] Affymetrix human genome U133A 2.0 Array, including kidney samples from 19 DN patients and 50 normal samples.
The gene expression data of normal samples in different tissues were downloaded from the Genotype-Tissue Expression (GTEx) database to compare to the expression of the PFN1 gene in different tissues.
Differentially Expressed Genes (DEGs)
To analyze the influence of the PFN1 gene on DN patients, samples were sorted into high and low expression groups based on the expression of the PFN1 gene. The differences between the two groups were analyzed using the factominer package of R18 using a PCA plot. DEGs were analyzed using the limma package in R.19 The threshold of DEGs was set as log fold change (logFc) > 1.0 and a P-value < 0.05. The results were displayed in the form of a volcano map and heat map.
Gene-Set Enrichment Analysis (GSEA)
GO analysis is commonly used for large-scale functional enrichment studies. GO analyses include biological processes (BP), molecular functions (MF), and cellular components (CC). The KEGG database is widely used for storing information such as genes, biological pathways, diseases, and drugs. The Clusterprofiler R package was used to analyze GO and KEGG enrichment information related to Signature gene.20 A FDR < 0.05 was regarded as statistically significant.
To analyze the differences in biological processes, we performed GSEA based on the gene expression profile data of DN patients. GSEA is a method to analyze whether a specific gene has statistically different, and is used to estimate the changes in pathways and biological processes.21 The “c2.cp.kegg.v6.2.- Symbols” was downloaded from the MSigDB database and used for GSEA analysis. An adjusted P < 0.05 was considered statistically significant. The specific genes of related pathways were downloaded from the GeneCard database. The enrichment scores of samples in different pathways were calculated by ssGSEA analysis, and the correlation of PFN1 in different biological pathways was also evaluated.
The Analysis of Protein-Protein Interactions and Screening of Hub Genes
STRING software (http://string-db.org/) was used to construct a protein-protein interaction (PPI) network of selected genes. Using genes with a score > 0.4, a visual network model was constructed using Cytoscape software (version 3.7.2, available at http://www.cytoscape.org)22 based on the string database. In the co-expression networks, the maximum clique centrality (MCC) algorithm was the most effective method to identify nodes. The MCC nodes were calculated by the cytohubba plug-in23 in Cytoscape software. The genes with the first eight MCC values were selected as hub genes.
Establishment of DN Cell Model with High Glucose-induced HK-2 Cells and Verification of Signaling Pathways
Cell Culture and Treatment
Human renal tubular epithelial cells (HK-2) were purchased from American Type Culture Collection (ATCC) (Art. No. CRL-2190). HK-2 cells were cultured in DMEM/F12 medium (Gibco, USA) with 10% fetal bovine serum (Abwbio, USA) under an environment of 5% CO2 at 37°C. When cells were 80−90% confluent, they were digested with 0.25% trypsin-EDTA (Gibco, USA) and passaged at a ratio of 1:3 or seeded into 6-well plates, as appropriate.
PFN1 Overexpression and Knock-Down
To investigate the function of PFN1 in DN, the PFN1 gene was overexpressed or knocked out. PFN1 shRNA and PFN1 overexpression vectors were constructed (Table S1). Sequence verification was performed for all shRNA or plasmid constructs.
HK-2 cells of passage 3 to 12 (P3-P12) were inoculated into 6-well plates (approximately 2×10⁵ cells per well). Cells were divided into six groups, including the control group [normal glucose (NG), 5.5 mmol/L D-glucose], the high glucose (HG) induced for 72 h group (45 mmol/L D-glucose), the shRNA vector (SV) transfection + HG induced for 72 h group, the PFN1 shRNA (SR) transfection + HG induced for 72 h group, the plasmid vector (PV) transfection + HG induced for 72 h group, and the PFN1 plasmid transfection + HG induced for 72 h group. Cells were transfected with shRNA or plasmid using Lipofectamine 2000 (Invitrogen, USA). After 24 h of transfection, cells were replaced with high glucose medium (45 mmol/L D-glucose DMEM (Gibco, USA) + 10%FBS).
Western Blot Analysis
Each group of cells was washed three times in cold PBS and lysed with moderate radio immunoprecipitation assay (RIPA) lysis buffer (Strong) (MCE, USA) on ice for 30 min. Cells were then scraped and the lysates were collected and centrifuged at 12,000 rpm for 15 min at 4°C. The supernatants were aspirated and stored at −80°C. Subsequently, proteins were separated with SDS-PAGE and transferred to polyvinylidene difluoride (PVDF) membranes using a GenScript semi-dry apparatus for 15 min. The PVDF membranes were then blocked with protein free rapid blocking buffer (EpiZyme, China) for 10 min at room temperature. Primary antibodies against glioma-associated oncogene homolog 1 (GLI1) (Proteintech, USA, mouse monoclonal antibody, 1:1000 dilution, 150 kDa), malate dehydrogenase 1 (MDH1) (Proteintech, USA, rabbit polyclonal antibody, 1:5000 dilution, 36 kDa), sonic Hedgehog homolog (SHH) (Proteintech, USA, rabbit polyclonal antibody, 1:500 dilution, 50 kDa), PFN1 (Proteintech, USA, rabbit polyclonal antibody, 1:1000 dilution, 15 kDa), and β-actin (Proteintech, USA, rabbit polyclonal antibody, 1:1000 dilution, 42 kDa; as the internal control) were incubated overnight at 4°C. After three washes with tris buffered saline containing 0.1% Tween 20 (TBST, Solarbio Life Sciences, China), the secondary antibodies (goat anti-rabbit HRP or goat anti-mouse HRP, Jackson ImmunoResearch, USA, 1:8000) were incubated at room temperature for 1 h, followed by washing three times in TBST. The protein bands were analyzed using an ECL detection kit (GeneCopoeia, USA) and quantified by ImageJ software.
RNA Extraction and Quantitative PCR Analysis
Each group of cells was washed three times with cold PBS. Total RNA was extracted using TRIzol reagent (Invitrogen, USA) according to the manufacturer’s protocol. Subsequently, reverse transcription was performed using 1 µg of total RNA according to the instructions of the Prime Script RT master mix (Takara, Japan). The assay was detected in a qTOWER3G systems (Jena, Germany) using a SYBR Premix EX Taq™ II kit. GAPDH was used as the house-keeping gene. Relative gene expression was analyzed using the 2−ΔΔCT method. The primer sequences for qPCR are listed in Table 1.
 |
Table 1 Primer Sequences for qPCR |
AnnexinV/7-AAD Staining for Assessing Apoptosis
AnnexinV can bind to phosphatidylserine (PS) and be used as a probe for detecting early apoptosis. 7-AAD binds to DNA and can be used to detect late apoptotic and dead cells. According to the manufacturer’s protocol for the AnnexinV/7-AAD apoptosis kit, cells were double stained with 5 µL AnnexinV and 10 µL 7-aminoactinomycin D (7-AAD, BD Pharmingen, USA), incubated for 15 min in the dark at room temperature, and then analyzed by flow cytometry (Beckman CytoFlex, USA) within 2 h.
PI Staining to Assess the Cell Cycle
Propidium (PI) can produce fluorescence when embedded within double stranded DNA. The intensity of the fluorescence is proportional to the amount of double stranded DNA. According to the manufacturer’s protocol (Absin, China), cells were fixed overnight with 75% alcohol, stained with PI working solution, incubated for 30 min in the dark at room temperature, and then analyzed by flow cytometry (Beckman CytoFlex, USA).
Statistical Analysis
Analysis of statistical data was performed using R software (version 4.0.2). To estimate the statistical significance of variable distributions, and to compare continuous variables between two groups, an independent samples Student’s t-test was performed. The Mann–Whitney U-test (Wilcoxon rank-sum test) was used to examine differences among non-normally distributed variables. Analyzing the statistical differences between two groups of categorical variables was performed using the chi square test or Fisher’s exact test. Correlation coefficients were calculated between genes using Pearson correlation analyses. Receiver operating characteristic (ROC) curves were drawn using the ROC package of R.24 The area under the curve (AUC) was used to evaluate prognosis accuracy based on risk scores. All statistical P-values were two-tailed. A P < 0.05 was considered statistically significant.
Results
Expression of the PFN1 Gene in the Kidney Tissues of DN Patients and Genome-wide Gene Expression Profiles
Compared to normal tissues, PFN1 expression was significantly increased in transcript level in DN kidney tissues in the GSE 30122 dataset (P < 0.001; Figure 1A). Meanwhile, ROC curves of PFN1 expression could be used to distinguish DN kidney tissues and normal tissues (AUC = 0.882, Figure 1B).
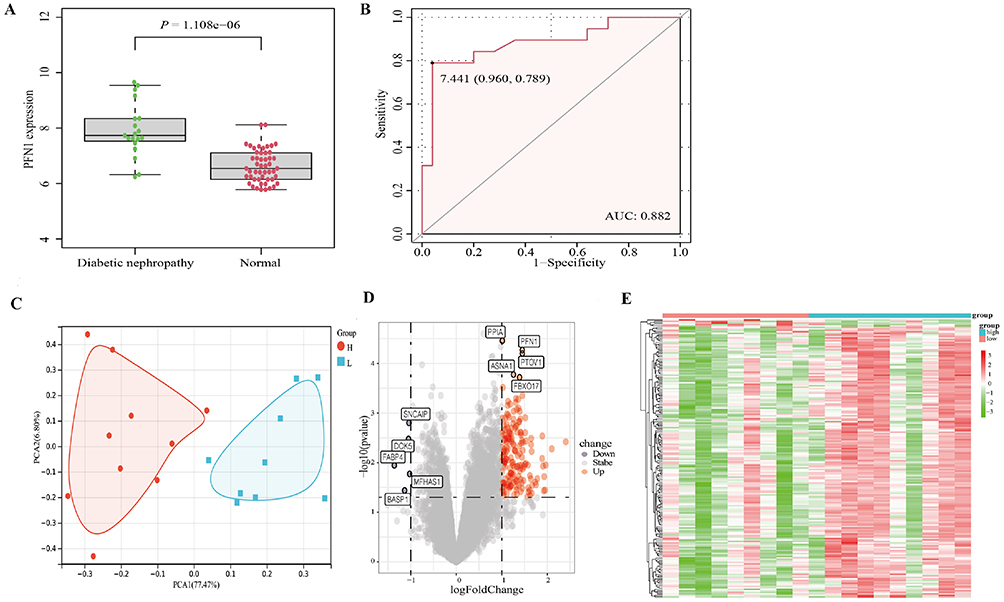 |
Figure 1 PFN1 expression in kidney tissue from DN patients and genome-wide gene expression profiles. (A) The expression levels of PFN1 in DN kidney tissues compared to normal tissues. (B) ROC curve and AUC value of PFN1. (C) Principal component analysis of the top 10 differentially expressed genes between low-expression and high-expression PFN1 groups. (D) Volcano plot of the 186 differentially expressed genes between the low-expression and high-expression PFN1 groups. (E) Heat map of the 186 differentially expressed genes with hierarchical clustering. |
To investigate the association between PFN1 expression and genome-wide gene expression profiles, DN kidney samples were split into low expression and high expression groups according to the PFN1expression level. We further analyzed the DEGs between the two groups. Based on the PCA results, the PFN1 expression levels were different between high- and low-expression groups. The principal components of top 10 differentially expressed genes were analyzed between the low-expression and high-expression groups (Figure 1C. Table S2). Subsequently, 186 DEGs were screened according to | Log (Fold Change) | > 1.0 and P < 0.05 (Figure 1D and E. Table S3).
Functional Enrichment Analysis of DEGs
We performed functional enrichment analysis of the 186 DEGs. The significant GO terms (BP, CC and MF) enriched by DEGs were small molecule catabolic processes, organic acid catabolic processes, and carboxylic acid catabolic processes (Figure 2A and B). The results of KEGG pathway analysis indicated that the differential expression of PFN1 might affect carbon metabolism, the citrate cycle (TCA cycle), and the valine, leucine, and isoleucine degradation pathways (Figure 2C and D).
 |
Figure 2 Functional enrichment analysis of the 186 differentially expressed genes and KEGG pathway analysis between low expression and high expression PFN1 groups. (A and B) The results of Go function analysis. (C and D) The results of KEGG enrichment analysis. (E) Patients with high PFN1 expression exhibited significant enrichments of nicotinate and nicotinamide metabolism, the pentose phosphate pathway, proteasome, aminoacyl tRNA biosynthesis in GSEA enrichment analyses. Furthermore, high PFN1 expression was negatively associated with glycosaminoglycan biosynthesis, heparin sulfate, neuroactive ligand receptor interactions, Hedgehog signaling pathway, and dilated cardiomyopathy. (F) Based on KEGG analyses, patients with high PFN1 expression exhibited significant enrichments of the citrate cycle (TCA cycle), valine, leucine, and isoleucine biosynthesis, and valine, leucine, and isoleucine degradation in GSVA enrichment analysis. |
GSEA revealed that patients with high PFN1 expressions also had significant enrichments in genes associated with nicotinate and nicotinamide metabolism, the pentose phosphate pathway, the proteasome, and aminoacyl tRNA biosynthesis. High PFN1 expression was also negatively associated with glycosaminoglycan biosynthesis heparin sulfate, neuroactive ligand receptor interactions, Hedgehog signaling pathway, and dilated cardiomyopathy (Figure 2E). Meanwhile, GSVA revealed that patients with high PFN1 expression exhibited significant KEGG enrichments of the citrate cycle (TCA cycle), valine, leucine, and isoleucine biosynthesis, and valine, leucine, and isoleucine degradation (Figure 2F). The Hedgehog signaling pathway is an important proliferation and senescence-regulation pathway. Many proteins in this signaling pathway were influenced by oxidative stress.
The Correlation Between PFN1 Expression and Different Biological Processes
We further investigated the impact of PFN1 expression on different biological processes in DN patients. High PFN1 expression was correlated with high apoptosis‐associated scores (Pearson’s correlation = 0.664; Figure 3A) and high cellular senescence-associated scores (Pearson’s correlation = 0.703; Figure 3C). However, there was no association between high PFN1 expression and autophagyigh (Pearson’s correlation = 0.07; Figure 3B).
 |
Figure 3 Correlations between PFN1 expression and PPI network analyses of the 186 differentially expressed genes. (A) The apoptosis-associated scores of PFN1 in DN kidney tissues. (B) The autophagy-associated scores of PFN1 in DN kidney tissues. (C) The senescence-associated scores of PFN1 in DN kidney tissues. (D) The PPI network constructed by the STRING online database. (E) The PPI network was presented using Cytoscape software. Red indicates upregulated genes and blue indicates downregulated genes. (F) Eight hub genes were identified from the PPI network by the MCODE plugin. (G) The correlation analysis among the hub genes. X means P>0.05, no significant difference. |
PPI Network Analysis
The STRING online database was used to gather information about DEGs and PPI networks (Figure 3D). The PPI network was imported into Cytoscape software. Red indicated up-regulated genes and blue indicated down-regulated genes (Figure 3E). The CytoHubba plugin of the Cytoscape software was used to identify the top eight genes from PPI network as the hub genes, using MCC algorithm (Figure 3F). We observed a strong positive correlation among the eight hub genes themselves. Among which, malate dehydrogenase 1 (MDH1), a cytosolic enzyme, had the potential to modulate metabolism between the cytosol and mitochondria via the malate/aspartate shuttle, was as an important hub genes (Figure 3G).
PFN1 Promotes Apoptosis in Diabetic Nephropathy Through the Hedgehog Signaling Pathway
PFN1 was mainly expressed in cytoplasm in HK-2 cells (Figure S1). PFN1 shRNA and overexpression plasmid were transfected into HK-2 cells (Figure S2). The expression of PFN1 was significantly increased in the PFN1 overexpression group, while it was decreased in the PFN1 shRNA treatment group, as detected by q-PCR (Figure 4A). Furthermore, we found that PFN1 was correlated with the inactivation of the Hedgehog signaling pathway in HG-induced HK-2 cells. Overexpression of PFN1 could decrease the expression of Gli1, whereas knockdown of PFN1 could up-regulate Gli1. The expression of SHH was increased in the PFN1 knock-down group. Additionally, MDH1 was down-regulated by PFN1 overexpression and increased after PFN1 knock-down (Figure 4B and C. Table S4). To demonstrate whether the overexpression of PFN1 would mediate cell proliferation and apoptosis, we analyzed the cell cycle and apoptosis of HK-2 cells using flow cytometry. It was found that PFN1 over-expression resulted in a decreased of cells in the G2 phase, inhibited cellular proliferation, and induced apoptosis (Figure 5).
 |
Figure 4 PFN1 was related to the inactivation of the Hedgehog signaling pathway in HK-2 cells induced with high levels of glucose for 72 h. (A) The shRNA and expression plasmid were successfully transfected in HK-2 cells. Q-PCR analysis indicating that the expression of PFN1 was significantly increased in the PFN1 overexpression group, while it was decreased in the PFN1 shRNA knockdown group. (B) Over-expression of PFN1 decreased the expression of Gli1, SHH, and MDH1, whereas PFN1 knockdown up-regulate those genes. (C) Protein expression was quantified by densitometry. Mean ± SD; n = 3; **P < 0.01 vs the control group; ##P < 0.01 vs the group treated with high levels of glucose for 72 h. Western blot of PFN1 (15 kDa), MDH1 (36 kDa), Gli1 (150 kDa), SHH (50 kDa), and β-actin (42 kDa). |
 |
Figure 5 Cell cycle and cell apoptosis were measured by flow cytometry in HK-2 cells treated with high levels of glucose for 72 h. (A) The percentage of apoptotic cells was measured by AnnexinV/7-AAD staining. (B) Statistical analysis of the percentage of apoptotic cells. PFN1 over-expression increased apoptosis, while PFN1 knockdown decreased apoptosis. (C) The percentage of the cell cycle was measured using flow cytometry with PI staining. (D) The ratio of G1, S and G2 phase in cell cycle. Compared to the group treated with glucose for 72 h, the ratio of cells in the G0/G1 and S phase remained unchanged, while the proportion of cells in the G2/M phase decreased, inhibited proliferation in the PFN1 over-expression group. Mean ± SD; n = 3; **P < 0.01 vs the control group; #P< 0.05 vs the group treated with glucose for 72 h. |
Discussion
DN is the most common and severe diabetic microvascular complication worldwide.25 It is a slow progressive condition and the major cause of end-stage renal disease.26 Renal tubular injury is a key link in the progression of DN, and the degree of injury is of great significance to the prognosis of kidney. Chronic inflammation is one of the pathogenic factors of DN. Overactive growth factor-beta1 (TGF-β1) signaling pathway has been implicated as a critical profibrotic factor in the progression of chronic kidney disease in human diabetic kidney disease (DKD). In animal studies, TGF-β1 neutralizing antibodies and TGF-β1 signaling inhibitors were effective in ameliorating kidney fibrosis in DKD. Also, TGF-β has an essential role in proteinuria and chronic kidney disease (CKD) progression.27,28 Previous studies showed that the apoptosis of glomerular cells has been linked to DN.29 Oxidative stress is believed to be a factor influencing the pathogenesis of DN.30
High glucose treatment induces mitochondrial dysfunction and produces a large volume of reactive oxygen species (ROS), which further mediates the activation of transcription factors of downstream genes and causes renal injury. Such factors play a critical role in the emergence and development of DN.31,32 In this study, HK-2 cells were induced by high glucose treatment for 72 h, and the number of apoptotic cells was increased compared to the control group. Compared to normal kidney tissues, the expression of PFN1 was significantly increased in DN kidney tissues in the GSE 30122 dataset. PFN1 expression was also increased in HK-2 cells after high glucose treatment.
PFN1 was originally discovered as an actin-associated protein. Recent studies indicated that PFN1 promoted apoptosis in tumor cells by regulating the SIRT3-HIF1α axis.33 PFN1 expression also has some interaction with TGF-β2R and PLAUR, which is encoding the expression of TGF-β2 receptor and soluble urokinase plasminogen activator receptor (sUPAR) proteins. Thus, they have some essential role in podocyte apoptosis and effacement.34,35 Another study also revealed a novel finding that endothelial cells (ECs) exposed to advanced glycation end products (AGEs) overexpressed PFN1 associated with a cytoskeleton reorganization. AGEs stimulated RAGE (receptor of AGEs) activation and induced oxidative stress, leading to cellular dysfunction in kidneys via activation of intracellular signaling pathways such as PI3K/Akt, MAPK/ERK, and NF-κB, all of which can damage the kidneys structurally and functionally, as well as prematurely aged.36 However, the molecular mechanisms underlying PFN1 in DN has yet to be elucidated.
Metabolic abnormalities play an important role in the occurrence and development of DN. In diabetic complications-prone tissues, energy metabolism may be altered by tissue-specific pathological changes.37 Carbon metabolism could alleviate senescence in DN.38 Pyruvate suppresses PARP activity under high-glucose conditions, which maintains glycolysis-TCA cycle flux and ATP production.39 Sirt1 and nicotinic acid metabolism are essential for communication between tubular epithelial cells and podocytes.40 In our study, the functional enrichment analysis suggested that differential expression levels of PFN1 may affect carbon metabolism and the citrate cycle (TCA cycle). The nicotinate and nicotinamide metabolism pathways were differentially enriched in the PFN1 high expression group. Based on biological process and pathway analyses, PFN1 may participate in the regulation of energy metabolism during the development of DN. However, the underlying regulatory mechanism requires further clarification.
Our findings indicated that high PFN1 expression was negatively associated with the Hedgehog signaling pathway. The Hedgehog signaling pathway regulates cell proliferation, differentiation, apoptosis, and tissue formation.41 The activation of the Hedgehog signaling pathway also plays an important role in stem cell regulation, tissue damage repair, and tumorigenesis.
Gli1 is a transcription factor and target gene of the Hedgehog signaling pathway. SHH is a member of the Hedgehog gene family and plays a critical role in regulating embryonic development.42 In adult mammalian tissues, SHH signaling is inactive. However, during tissue differentiation and proliferation, it becomes active.43 Our data indicated that PFN1 was correlated with the inactivation of the Hedgehog signaling pathway in HG-induced HK-2 cells. PFN1 overexpression could decrease the expression of Gli1, whereas knockdown of PFN1 could up-regulate it. The expression of SHH was increased in the PFN1 knock-down group. These findings suggested that PFN1 was correlated with Hedgehog signaling change.
Malate dehydrogenase 1 (MDH1) is a cytosolic enzyme that plays a crucial role in activating the malate/aspartate shuttle between the cytosol and mitochondria. As one of the essential enzymes in cellular glucose metabolism, MDH1 has a significant impact on oxidative stress.44,45 It has been reported that MDH1 regulates intracellular energy status, which might affect NFATc1 expression and AMPK activity.46 MDH1 knockdown reduces mitochondrial respiration and inhibits glutamine metabolism, which renders PDAC cells more sensitive to oxidative stress and suppresses proliferation.47 The increases of MDH1 acetylation protect neurons against oxidative stress and alleviate neuro-apoptosis.48
In this study, functional enrichment analysis of DEGs indicated that the differential expression of PFN1 might affect carbon metabolism and the TCA cycle. PPI network analysis indicated that MDH1 was as an important hub gene. Based on these findings, we also performed a validation experiment that indicated that PFN1 overexpression could down-regulate the expression of MDH1, while knockdown of PFN1 up-regulated MDH1. Those data suggested that MDH1 expression was related to PFN1 level.
It has been reported that cell proliferation and apoptosis are related to the severity of the classical signs of DN.49 In this study, the expression of PFN1 was correlated with high apoptosis-associated scores. Moreover, PFN1 overexpression in HK-2 cells treated with high levels of glucose for 72 h increased apoptosis, while PFN1 knockdown decreased apoptosis. Meanwhile, PFN1 overexpression inhibited HK-2 proliferation, during which the ratio of the cells in the G0/G1 and S phase remained unchanged, while the proportion of cells in the G2/M phase decreased. These findings suggested that PFN1 may be a potential therapeutic target by affecting apoptosis and proliferation in DN.
In summary, this was the first study to comprehensively analyze the molecular and bioinformatic characteristics of PFN1 in DN. We assessed the expression of PFN1 in DN using data in the GEO database. We also analyzed the functional enrichment and found that the expression level of PFN1 was significantly increased in DN kidney tissues, which was correlated with high apoptosis-associated score.
We observed the relationship between PFN1 expression and the Hedgehog signaling pathway in HG-treated HK-2 cells. Overexpression of PFN1 promoted apoptosis and blocked cell proliferation by activating the Hedgehog signaling pathway in HG-induced HK-2 cells. Therefore, PFN1 may play an integral role in the regulation of cell proliferation and apoptosis by activating the Hedgehog signaling pathway during DN development.
Although our findings revealed the molecular and bioinformatic characteristics of PFN1, and increased our understanding of the molecular mechanisms leading to DN, there were still some limitations. First, to clarify the specific regulatory mechanism of PFN1 in DN, a number of clinical factors should be considered. For example, this study did not consider the type of diabetes. However, this type of information is lacking in public databases. Second, despite discovering important associations and demonstrating statistical significance, the sample size was relatively small. Third, the results should be experimentally investigated to verify if PFN1 acts via precise molecular mechanisms in the Hedgehog signaling pathway.
Data Sharing Statement
The datasets analyzed during the study are available in the GEO database (No. GSE 30122).
Ethics Approval and Consent to Participate
The human transcriptome data of this study are derived from GEO database (No. GSE 30122), and the ethical statement of the article from the dataset is derived as follows: The study was approved by the institutional review board of the Albert Einstein College of Medicine and Montefiore Medical Center (2002-202 to K.S.).15
The use of public databases in this study was also approved by the Ethics Review Committee of Guangdong Provincial People’s Hospital (No. GDERC: KY-Q-2021-244-01).
Author Contributions
All authors made a significant contribution to the work reported, whether that is in the conception, study design, execution, acquisition of data, analysis and interpretation, or in all these areas; took part in drafting, revising or critically reviewing the article; gave final approval of the version to be published; have agreed on the journal to which the article has been submitted; and agree to be accountable for all aspects of the work.
Funding
This study was supported by the Chinese National Natural Science Foundation (No. 82170259) and the Guangdong Provincial Medical Science and Technology Research Foundation (No. A2023034).
Disclosure
The authors report no conflicts of interest in this work.
References
1. Lee CP, Nithiyanantham S, Hsu HT, Yeh KT, Kuo TM, Ko YC. ALPK1 Regulates Streptozotocin-induced Nephropathy through CCL2 and CCL5 Expressions. J Cell Mol Med. 2019;23(11):7699–7708.
2. Wang Y, Bi R, Quan F, et al. Ferroptosis involves in renal tubular cell death in diabetic nephropathy. Eur J Pharmacol. 2020;888:173574.
3. Lv L, Zhang J, Tian F, Li X, Li D, Yu X. Arbutin Protects HK-2 cells Against High Glucose-induced Apoptosis and Autophagy by Up-regulating microRNA-27a. Artif Cells Nanomed Biotechnol. 2019;47(1):2940–2947.
4. Yoon YM, Go G, Yun CW, Lim JH, Lee SH. Knockdown of CK2α Reduces P-cresol-induced Fibrosis in Human Renal Proximal Tubule Epithelial Cells Via the Downregulation of Profilin-1. Int J Med Sci. 2020;17(17):2850–2860.
5. Nekouei M, Aliahmadi A, Kiaei M, Ghassempour AR. Mutant Profilin1 Aggregation in Amyotrophic Lateral Sclerosis: an in Vivo Biochemical Analysis. Basic Clin Neurosci. 2021;12(2):213–222.
6. Yuan G, Cui S, Chen X, et al. Detergent-insoluble Inclusion Constitutes the First Pathology in PFN1 Transgenic Rats. J Neurochem. 2021;157(4):1244–1252.
7. Huang Y, Sun H, Ma X, et al. HLA-F-AS1/miR-330-3p/PFN1 axis promotes colorectal cancer progression. Life Sci. 2020;254:117180.
8. Zhang S, Guo X, Liu X, Zhong Z, Yang S, Wang H. Adaptor SH3BGRL Promotes Breast Cancer Metastasis through PFN1 Degradation by Translational STUB1 Upregulation. Oncogene. 2021;40(38):5677–5690.
9. Wang Y, Wang Y, Wan R, Hu C, Lu Y. Profilin 1 Protein and Its Implications for Cancers. Oncology. 2021;35(7):402–409.
10. Zou L, Ding Z, Roy P. Profilin-1 Overexpression Inhibits Proliferation of MDA-MB-231 Breast Cancer Cells Partly through p27kip1 Upregulation. J Cell Physiol. 2010;223(3):623–629.
11. Yao W, Cai X, Liu C, et al. Profilin 1 potentiates apoptosis induced by staurosporine in cancer cells. Curr Mol Med. 2013;13(3):417–428.
12. Ding H, Chen B, Lu Q, Wang J. Profilin-1 Mediates Microvascular Endothelial Dysfunction in Diabetic Retinopathy through HIF-1α-dependent Pathway. Int J Clin Exp Pathol. 2018;11(3):1247–1255.
13. Yang D, Wang Y, Jiang M, et al. Downregulation of Profilin-1 Expression Attenuates Cardiomyocytes Hypertrophy and Apoptosis Induced by Advanced Glycation end Products in H9c2 Cells. BioMed Res Int. 2017;2017:9716087.
14. Lee CJ, Yoon MJ, Kim DH, Kim TU, Kang YJ. Profilin-1; A Novel Regulator of DNA Damage Response and Repair Machinery in Keratinocytes. Mol Biol Rep. 2021;48(2):1439–1452.
15. Woroniecka KI, Park AS, Mohtat D, Thomas DB, Pullman JM, Susztak K. Transcriptome analysis of Human Diabetic Kidney disease. Diabetes. 2011;60(9):2354–2369.
16. Na J, Sweetwyne MT, Park AS, Susztak K, Cagan RL. Diet-induced Podocyte Dysfunction in Drosophila and Mammals. Cell Rep. 2015;12(4):636–647.
17. Gautier L, Cope L, Bolstad BM, Irizarry RA. Affy--analysis of Affymetrix GeneChip Data at the Probe Level. Bioinformatics. 2004;20(3):307–315.
18. Jombart T. Adegenet: a R Package for the Multivariate analysis of Genetic Markers. Bioinformatics. 2008;24(11):1403–1405.
19. Ritchie ME, Phipson B, Wu D, et al. Limma Powers Differential Expression analyses for RNA-sequencing and Microarray Studies. Nucleic Acids Res. 2015;43(7):e47.
20. Yu G, Wang LG, Han Y, He QY. ClusterProfiler: an R Package for Comparing Biological themes Among Gene Clusters. OMICS. 2012;16(5):284–287.
21. Subramanian A, Tamayo P, Mootha VK, et al. Gene Set Enrichment analysis: a Knowledge-based Approach for Interpreting Genome-wide Expression Profiles. Proc Natl Acad Sci U S A. 2005;102(43):15545–15550.
22. Shannon P, Markiel A, Ozier O, et al. Cytoscape: a Software Environment for Integrated Models of Biomolecular Interaction Networks. Genome Res. 2003;13(11):2498–2504.
23. Chin CH, Chen SH, Wu HH, Ho CW, Ko MT, Lin CY. CytoHubba: identifying Hub Objects and Sub-networks from Complex Interactome. BMC Syst Biol. 2014;4(Suppl 4):S11.
24. Robin X, Turck N, Hainard A, et al. pROC: an Open-source Package for R and S+ to analyze and Compare ROC Curves. BMC Bioinform. 2011;12:77.
25. Sagoo MK, Gnudi L. Diabetic Nephropathy: an Overview. Methods Mol Biol. 2020;2067:3–7.
26. Umanath K, Lewis JB. Update on Diabetic Nephropathy: core Curriculum 2018. Am J Kidney Dis. 2018;71(6):884–895.
27. Zhao L, Zou Y, Liu F. Transforming Growth Factor-Beta1 in Diabetic Kidney Disease. Front Cell Dev Biol. 2020;8:187.
28. Widiasta A, Wahyudi K, Sribudiani Y, Rachmadi D. The level of transforming growth factor-β as a possible predictor of cyclophosphamide response in children with steroid-resistant nephrotic syndrome. Biomedicine. 2021;11(3):68–75.
29. Lorz C, Benito-Martin A, Boucherot A, et al. The Death Ligand TRAIL in Diabetic Nephropathy. J Am Soc Nephrol. 2008;19(5):904–914.
30. Huang W, Man Y, Gao C, et al. Short-chain Fatty Acids Ameliorate Diabetic Nephropathy Via GPR43-mediated Inhibition of Oxidative Stress and NF-κB Signaling. Oxid Med Cell Longev. 2020;2020:4074832.
31. Ding T, Wang S, Zhang X, et al. Kidney Protection Effects of Dihydroquercetin on Diabetic Nephropathy through Suppressing ROS and NLRP3 Inflammasome. Phytomedicine. 2018;41:45–53.
32. Han Y, Xu X, Tang C, et al. Reactive Oxygen Species Promote Tubular Injury in Diabetic Nephropathy: the Role of the Mitochondrial Ros-txnip-nlrp3 Biological Axis. Redox Biol. 2018;16:32–46.
33. Yao W, Ji S, Qin Y, et al. Profilin-1 Suppresses Tumorigenicity in Pancreatic Cancer through Regulation of the SIRT3-HIF1α Axis. Mol Cancer. 2014;13:187.
34. Warde-Farley D, Donaldson SL, Comes O, et al. The GeneMANIA prediction server: biological network integration for gene prioritization and predicting gene function. Nucleic Acids Res. 2010;38:W214–W220.
35. Widiasta A, Wahyudi K, Nugrahapraja H, Sribudiani Y, Rachmadi D. The Unique Difference Between Serum Level of Soluble Urokinase Plasminogen Activator Receptor (suPAR) in Steroid-Resistant Nephrotic Syndrome Children Treated with an Alkylating Agent and Calcineurin Inhibitors. J Compr Ped. 2021;12(2):54.
36. Li Z, Zhong Q, Yang T, Xie X, Chen M. The Role of Profilin-1 in Endothelial Cell Injury Induced by Advanced Glycation end Products (AGEs). Cardiovasc Diabetol. 2013;12:141.
37. Hinder LM, Vivekanandan-Giri A, McLean LL, Pennathur S, Feldman EL. Decreased Glycolytic and Tricarboxylic Acid Cycle Intermediates Coincide with Peripheral Nervous System Oxidative Stress in a Murine Model of Type 2 Diabetes. J Endocrinol. 2013;216(1):1–11.
38. Chen L, Mei G, Jiang C, et al. Carbon Monoxide Alleviates Senescence in Diabetic Nephropathy by Improving Autophagy. Cell Prolif. 2021;54(6):e13052.
39. Yako H, Niimi N, Kato A, et al. Role of Pyruvate in Maintaining Cell Viability and Energy Production Under High-glucose Conditions. Sci Rep. 2021;11(1):18910.
40. Hasegawa K, Wakino S, Sakamaki Y, et al. Communication from Tubular Epithelial Cells to Podocytes through Sirt1 and Nicotinic acid Metabolism. Curr Hypertens Rev. 2016;12(2):95–104.
41. Chang W, Chang Q, Lu H, Li Y, Chen C. MiR-221-3p Facilitates Thyroid Cancer Cell Proliferation and Inhibit Apoptosis by Targeting FOXP2 through Hedgehog Pathway. Mol Biotechnol. 2022;64(8):919–927.
42. Wang XZ, Zhang HH, Qian YL, Tang LF. Sonic Hedgehog (Shh) and CC chemokine Ligand 2 Signaling Pathways in Asthma. J Chin Med Assoc. 2019;82(5):343–350.
43. Jeng KS, Chang CF, Lin SS. Sonic Hedgehog Signaling in Organogenesis, Tumors, and Tumor Microenvironments. Int J Mol Sci. 2020;21(3):65.
44. Souza RWA, Alves CRR, Medeiros A, et al. Differential regulation of cysteine oxidative post-translational modifications in high and low aerobic capacity. Sci Rep. 2018;8(1):17772.
45. Guo X, Park JE, Gallart-Palau X, Sze SK. Oxidative Damage to the TCA Cycle Enzyme MDH1 Dysregulates Bioenergetic Enzymatic Activity in the Aged Murine Brain. J Proteome Res. 2020;19(4):1706–1717.
46. Oh SJ, Gu DR, Jin SH, Park KH, Lee SH. Cytosolic Malate Dehydrogenase Regulates RANKL-mediated Osteoclastogenesis Via AMPK/c-Fos/NFATc1 Signaling. Biochem Biophys Res Commun. 2016;475(1):125–132.
47. Wang YP, Zhou W, Wang J, et al. Arginine Methylation of MDH1 by CARM1 Inhibits Glutamine Metabolism and Suppresses Pancreatic Cancer. Mol Cell. 2016;64(4):673–687.
48. Wang M, Zhou C, Yu L, et al. Upregulation of MDH1 Acetylation by HDAC6 Inhibition Protects Against Oxidative Stress-derived Neuronal Apoptosis Following Intracerebral Hemorrhage. Cell Mol Life Sci. 2022;79(7):356.
49. Li L, Chen X, Zhang H, Wang M, Lu W. MRC2 Promotes Proliferation and Inhibits Apoptosis of Diabetic Nephropathy. Anal Cell Pathol. 2021;2021:6619870.
 © 2023 The Author(s). This work is published and licensed by Dove Medical Press Limited. The full terms of this license are available at https://www.dovepress.com/terms.php and incorporate the Creative Commons Attribution - Non Commercial (unported, v3.0) License.
By accessing the work you hereby accept the Terms. Non-commercial uses of the work are permitted without any further permission from Dove Medical Press Limited, provided the work is properly attributed. For permission for commercial use of this work, please see paragraphs 4.2 and 5 of our Terms.
© 2023 The Author(s). This work is published and licensed by Dove Medical Press Limited. The full terms of this license are available at https://www.dovepress.com/terms.php and incorporate the Creative Commons Attribution - Non Commercial (unported, v3.0) License.
By accessing the work you hereby accept the Terms. Non-commercial uses of the work are permitted without any further permission from Dove Medical Press Limited, provided the work is properly attributed. For permission for commercial use of this work, please see paragraphs 4.2 and 5 of our Terms.