Back to Journals » Journal of Pain Research » Volume 19
Pricing, Popularity, and Customer Satisfaction in Online Pain-Relief Products: An AI-Powered Analysis
Authors Jumreornvong O, Kantagowit P ![]() , Parnicharoende R, Yong RJ, Lo Bianco G
, Parnicharoende R, Yong RJ, Lo Bianco G ![]() , Ruan QZ, Hasoon J, Chung M
, Ruan QZ, Hasoon J, Chung M ![]() , Schatman ME
, Schatman ME ![]() , Rullo G
, Rullo G ![]() , Christo PJ, Issa M, Robinson CL
, Christo PJ, Issa M, Robinson CL ![]()
Received 27 June 2025
Accepted for publication 8 January 2026
Published 9 January 2026 Volume 2026:19 550032
DOI https://doi.org/10.2147/JPR.S550032
Checked for plagiarism Yes
Review by Single anonymous peer review
Peer reviewer comments 2
Editor who approved publication: Dr Jonathan Greenberg
Oranicha Jumreornvong,1,* Piyawat Kantagowit,2,* Runchana Parnicharoende,3,* R Jason Yong,4 Giuliano Lo Bianco,5 Qing Zhao Ruan,6 Jamal Hasoon,7 Matthew Chung,8 Michael E Schatman,9,10 Generoso Rullo,11 Paul J Christo,12 Mohammed Issa,4 Christopher L Robinson12
1Department of Human Performance and Rehabilitation, Icahn School of Medicine at Mount Sinai, New York, NY, USA; 2Department of Surgery, NYU Grossman School of Medicine, New York, NY, USA; 3Department of Rehabilitation Medicine, Faculty of Medicine, Chulalongkorn University, Bangkok, Thailand; 4Department of Anesthesiology, Perioperative, and Pain Medicine, Brigham and Women’s Hospital, Harvard Medical School, Boston, MA, USA; 5Anesthesiology and Pain Department, Foundation G. Giglio, Cefalù, Palermo, Italy; 6Warren Alpert Medical School, Brown University, Providence, RI, USA; 7Department of Anesthesia, Critical Care, and Pain Medicine, UTHealth McGovern Medical School, Houston, TX, USA; 8Department of Pain Medicine, Division of Anesthesia, Critical Care and Pain Medicine, The University of Texas MD Anderson Cancer Center, Houston, TX, USA; 9Department of Anesthesiology, Perioperative Care, and Pain Medicine, NYU Grossman School of Medicine, New York, NY, USA; 10Department of Population Health, Division of Medical Ethics, NYU Grossman School of Medicine, New York, NY, USA; 11Department of Chemistry and Biochemistry, University of Notre Dame, Notre Dame, IN, USA; 12Division of Pain Medicine, Department of Anesthesiology and Critical Care Medicine, The Johns Hopkins University School of Medicine, Baltimore, MD, USA
*These authors contributed equally to this work
Correspondence: Christopher L Robinson, Division of Pain Medicine Department of Anesthesiology and Critical Care Medicine the Johns Hopkins University School of Medicine, Baltimore, MD, USA, Email [email protected]
Objective: To examine how product popularity and pricing are associated with customer satisfaction across pain-relief device types on online e-commerce platforms.
Methods: A cross-sectional study was conducted to analyze pain-relief products from Amazon and Best Buy. Data were collected via automated web scraping, verified, and categorized into 10 device types. Key variables including product names, prices, customer ratings, and review volumes were assessed in multivariable regression models.
Results: A total of 378 distinct pain-relief products were analyzed. The median customer ratings for pain-relief devices varied significantly by type, ranging from 3.2 to 4.5 (p < 0.001). TENS units and cold/heat therapy packs achieved the highest median ratings of 4.5 (4.3– 4.6). In contrast, hand/arm massagers received the lowest median rating of 3.2 (2.2– 4.2). Pricing differences across device types were significant (p < 0.001), with neck stretchers being the least expensive (median: $29.99) and hand/arm massagers being the most expensive (median: $249.50).
Discussion: Although price and the number of reviews were not significant predictors of customer ratings in multivariable regression models, significant interactions were observed between price and device type for hand/arm massagers (p < 0.001) and massage guns (p = 0.006). Additionally, significant interactions between the number of reviews and device type were observed for hand/arm massagers (p = 0.004).
Conclusion: Although pricing and review quantity were not significant predictors of satisfaction for most devices, they did interact with specific categories such as hand/arm massagers and massage guns. These findings indicate that customer satisfaction is driven more by device-specific characteristics than by price or review volume.
Keywords: artificial intelligence, pain-relief, customer satisfaction
Introduction
Chronic pain affects hundreds of millions of individuals worldwide and has contributed to substantial growth in the market for non-pharmacological pain-relief products.1,2 These products encompass a range of noninvasive modalities including transcutaneous electrical nerve stimulation (TENS) units, infrared and red-light therapy devices, vibration or percussive massage devices, cold/heat therapy packs, and posture or lumbar-support braces. Such technologies offer consumers with diverse avenues for managing pain while reducing reliance on pharmacological treatments, which are often associated with side effects and other iatrogenic complications.3,4 In parallel, the modern era of e-commerce has transformed consumer behavior, offering platforms such as Amazon, as resources for accessing and evaluating health products.5,6 Through user reviews and ratings, these platforms not only assist in assessing the real-world effectiveness and usability of products but also help to gauge overall user satisfaction, enabling consumers to make more informed decisions. This relationship between innovative non-pharmacological solutions and the accessibility of e-commerce-driven consumer feedback reflects evolving trends in adjunctive pain management options.
Understanding customer review trends benefits consumers, manufacturers, and healthcare providers. Manufacturers can optimize products using customer feedback and concerns, while buyers can make informed choices based on users’ experiences and professional guidance. Previous research has highlighted the importance of customer reviews in understanding consumer experiences with pain-relief products. For example, a study analyzed 1,589 chronic pain–related Amazon reviews across 1,098 products, using natural language processing to characterize review language, product categories, and comorbidities mentioned by consumers. Their study highlighted that online reviews contain rich, real-world information about chronic pain experiences.7 Other studies have examined how the claim of patients and healthcare practitioners influence the acceptance of home-based pain-relief devices by using semi-structured qualitative interviews of older with chronic pain to identify three determinants including awareness, appeal, and access of adopting nonpharmacologic treatments and found that individuals often preferred low-cost, home-based modalities due to financial and logistical barriers.8 Similarly, one study determined moderate to high levels of acceptance of eHealth pain management interventions, driven by ease of use (p < 0.001), expected effectiveness (p < 0.001), and social influence (p < 0.001).9 While these studies highlight important determinants of device acceptance and adoption, they do not examined how key factors such as pricing (a potential contributor to financial barriers), popularity (a potential proxy for social influence), and customer satisfaction interrelate across pain-relief products.
Given the gaps in the extant literature, there is a need to broaden the research scope to include more datasets of pain-relief products and to explore the relationship between customer reviews, product pricing, and overall market popularity. Based on established consumer-behavior theory, these variables are particularly meaningful. Pricing often serves as a heuristic for expected product quality, consistent with the price–quality inference model, while review volume functions as a proxy for social proof, influencing trust and perceived credibility.10 Although previous research has focused on isolated aspects such as product efficacy or consumer satisfaction, few have systematically examined the intersection of these factors in a manner that accounts for the rapidly expanding e-commerce marketplace, which has transformed how individuals access and evaluate health-related products and underscores the need for further research.7 We aim to address this gap by analyzing pain-relief products on e-commerce platforms, focusing on device types, customer reviews, average ratings, and pricing structures. The current study examines consumer preferences, pricing strategies, and the association of user-generated content on purchasing behavior.
Methods
Study Design and Data Collection
This study employed a cross-sectional design to analyze top-selling pain-relief products from publicly available listings on Amazon and Best Buy online. These platforms were selected due to their extensive consumer bases, established reputation as major online retailers, and feasibility of retrieving data through a web-scraping process. Products were identified using the search term “pain device” and selecting items ranked under the “best sellers” category as of December 10, 2024, to prioritize the real products used by individuals and improve data reliability. Although this approach may introduce sampling bias, it also minimizes the influence of products with extremely low review counts. Many lower-visibility items had only a few reviews, producing highly unstable and non-representative ratings. The dataset included a diverse range of devices such as TENS units, sciatica (radiculopathy) braces, laser therapy devices, heating pads, massage guns, and other related products to ensure a comprehensive representation of pain-relief solutions. Inclusion criteria consisted of products classified as pain device, availability of price and review data, and listing accessibility at the time of extraction. As we used a complete dataset from publicly available product listings, a priori sample size calculation was not conducted. We justified the sample size by referencing methodological guidance that emphasizes appropriateness of available data rather than formal power estimation consistent with recommendations for observational studies.11 By utilizing this approach, we aimed to minimize selection bias and provide an unbiased assessment.
Data Variables
The dataset comprised key variables, including product names, customer reviews, prices, and product types. Product names and descriptions provided context for the intended use and features of each device. Customer reviews were represented quantitatively by ratings on a 5-star scale and the number of reviews. Product prices after promotional discounts or offers at the time of data extraction were recorded. Data were extracted on December 10, 2024, which served as the data collection timeframe.
Data Extraction Process
An automated web-scraping process integrating ChatGPT (GPT-4.0)12 and the Python library Beautiful Soup version 4.12.213 was employed to extract data from Amazon and Best Buy product pages. This integration enabled dynamic adaptability to variations in webpage layouts, ensuring consistent and reliable data retrieval. Product URLs were first collected, and Beautiful Soup was utilized to parse the HTML structure of the pages, systematically isolating relevant elements. GPT-4.0 was then prompted to refine and interpret the extracted data including product names, product types, prices, number of reviews, and customer ratings, while filtering out irrelevant information such as advertisements and sponsored listings (Supplementary Table 1). To ensure accuracy, validity, and consistency, the extracted data were manually cross-checked by two authors (R.P. and P.K). The cleaned dataset was formatted into a structured CSV file, containing key variables including product name, type, price, customer rating, number of reviews, and platform under the websites’ terms of service.
Data Analysis
Products were classified into 10 device types: TENS units, heating pads, neck stretchers/cervical traction devices, back braces and support belts, sciatica braces, red light therapy devices, massage guns, cold/heat therapy packs, foot and leg massagers, and hand/arm massagers. Device classification was based on functional characteristics, device descriptions, and FDA product codes. We aimed to classify products into distinct categories while maintaining sufficient statistical power given the limited sample size. For example, although massage guns, foot and leg massagers, and hand/arm massagers are all classified under “Massager, Therapeutic, Electric” (ISA, 21 CFR 890.5660, Class I) by the FDA, they were identified separately in our study. Back braces and sciatica braces were grouped based on their shared orthopedic functions due to limited sample size. Other devices were directly mapped to unique FDA categories: TENS units (GZJ, 21 CFR 882.5890, Class II), heating pads (IRT, 21 CFR 890.5740, Class II), cervical traction devices (ILH, 21 CFR 890.5900, Class II), red light therapy devices (ILY, 21 CFR 890.5500, Class II), and reusable hot/cold therapy packs (IME, 21 CFR 890.5700, Class I). Descriptive statistics were used to summarize ratings, prices, and review volumes across device types. Continuous variables were reported as medians with interquartile ranges, while categorical variables were summarized as frequency and percentage. Data distributions and trends were visualized using box plots and scatter plots.
Differences in ratings and prices across device types were assessed using the Kruskal–Wallis’s test. Spearman’s rank correlation coefficient was used to evaluate non-linear relationships between price and customer ratings. A generalized linear model (GLM) with a Gaussian family was used to examine the association between predictors and customer ratings using both univariable and multivariable approaches. A multivariable GLM was conducted to identify predictors of customer satisfaction, with subcategories of device type included as a predictor. Interaction terms were incorporated into the multivariable regression model to explore potential interactions between device types and other predictors. Model assumptions included linearity of predictors, independence of observations, and an appropriate error distribution, with diagnostic checks performed using residual analysis and multicollinearity assessment using variance inflation factors (VIF). VIF were calculated following ordinary least squares regression. All statistical analyses were conducted using STATA 18.0 (STATA Corp, College Station, TX). Results were presented with 95% confidence intervals, and statistical significance was set at p < 0.05 for all two-tailed tests.
Results
Customer Ratings and Popularity in Pain-Relief Products
Of the 391 identified pain-relief products, a total of 378 were included. The 13 products excluded from the analysis were omitted due to missing data, primarily because they were recently listed and lacked customer reviews or ratings. The median customer ratings for pain-relief products ranged from 3.2 to 4.5 out of a possible 5.0 across various device types (Table 1).
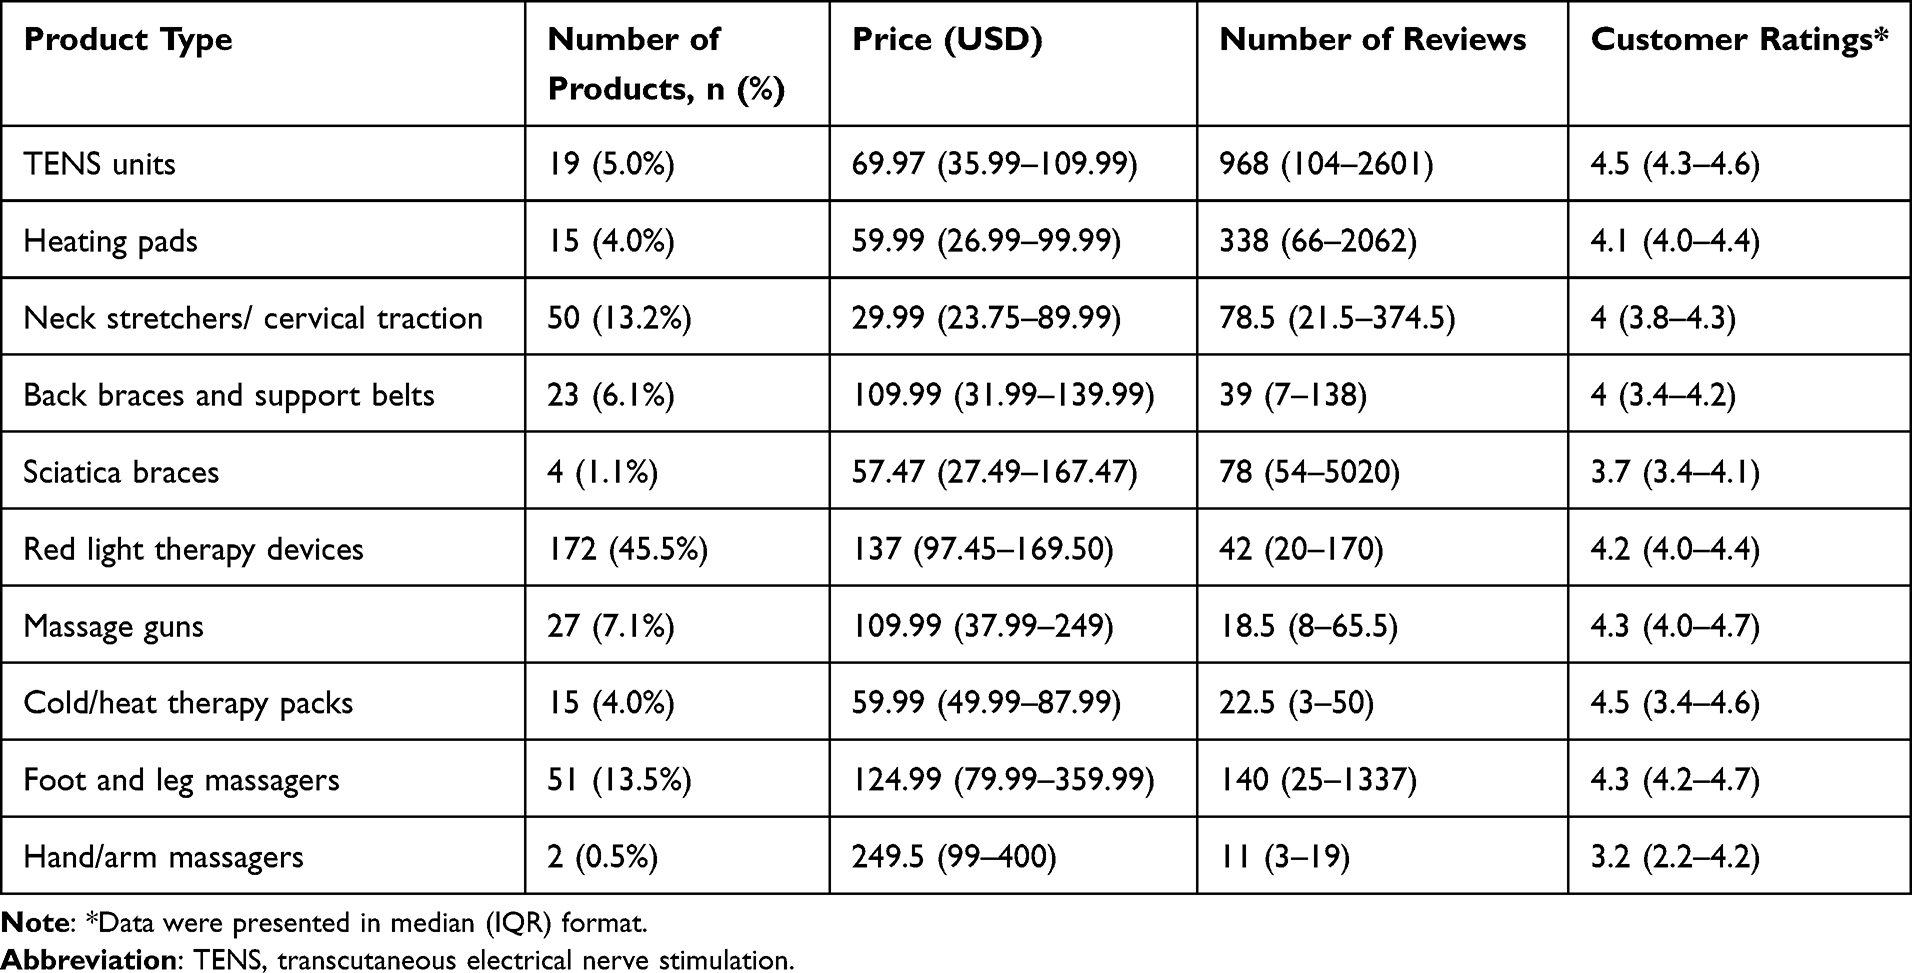 |
Table 1 Product Categories, Pricing, Customer Ratings, and Review Volume for Pain-Relief Devices (n = 378) |
TENS units and cold/heat therapy packs had the highest median ratings and the narrowest interquartile range, with a value of 4.5 (4.3–4.6). Hand/arm massagers had the lowest median rating and the widest interquartile range, with a value of 3.2 (2.2–4.2). Customer ratings differed significantly across device types (p < 0.001, η2 = 0.096).
The number of reviews varied significantly across device types (p < 0.001, ρ = –0.030). Red light therapy devices had the highest number of reviews (n = 164), while hand/arm massagers had the fewest (n = 2). The median number of reviews ranged from 11 (hand/arm massagers) to 968 (TENS units). The scatter plot of the number of reviews and customer ratings illustrated a weak positive correlation, with most products clustered at lower review counts (< 1,000) and ratings around 4 (Supplementary Figure 1). Several products with very high review numbers (> 60,000) maintained ratings above 4. The univariable regression analysis revealed that the number of reviews was not a statistically significant predictor of score (p = 0.109). Multiple linear regression analysis also demonstrated that the number of reviews was not a significant predictor of customer ratings in the family Gaussian model (p = 0.116) and GLM (p = 0.926).
Pricing Trends in Pain-Relief Products
The median prices of pain-relief devices vary across types, ranging from $29.99-$249.50 (Table 1). Neck stretchers/cervical traction had the lowest price, with a median price of $29.99 ($23.75– $89.99), while hand/arm massagers had the highest price, with a median of $249.50 ($99–$400). Cold/heat therapy packs had the smallest interquartile ranges with a median of $59.99 ($49.99–$87.99). The differences in pricing across device types were statistically significant (p < 0.001, η2 = 0.194).
Pricing and Customer Ratings
Hand/arm massagers, the most expensive devices at a median price of $249.50 ($99–$400), had the lowest customer rating (3.2). In contrast, lower-priced products such as TENS units ($69.97 ($35.99–$109.99)) and cold/heat therapy packs ($59.99 ($49.99–$87.99)) received the highest ratings (4.5) (Table 1). Spearman correlation analysis revealed a weak positive association between price and customer ratings (ρ = 0.159, p = 0.003). Similarly, the scatter plot for price and customer ratings yielded a weak positive correlation, with most products clustered in the lower price range and receiving ratings between 4 and 5 (Supplementary Figure 2). However, the univariable regression analysis revealed that price was not a statistically significant predictor of customer ratings (p = 0.109). This finding was further supported by multiple linear regression analysis, where price remained non-significant in both the family Gaussian model (p = 0.413) and GLM (p = 0.615).
Association of Product Features with Customer Ratings
Price and number of reviews were not significant predictors in the analyzed models (Supplementary Table 2). However, statistically significant differences in customer ratings compared with TENS were observed for hand/arm massagers (p < 0.001), cold/heat therapy packs (p = 0.02), neck stretchers/cervical traction (p = 0.002), back braces and support belts (p < 0.001), and sciatica braces (p = 0.008). Interactions were observed between price and device type for hand/arm massagers (p < 0.001) and massage guns (p = 0.006), as well as between review numbers and device type for hand/arm massagers (p = 0.004). The mean VIF was 2.11 with an overall low level of multicollinearity (Table 2).
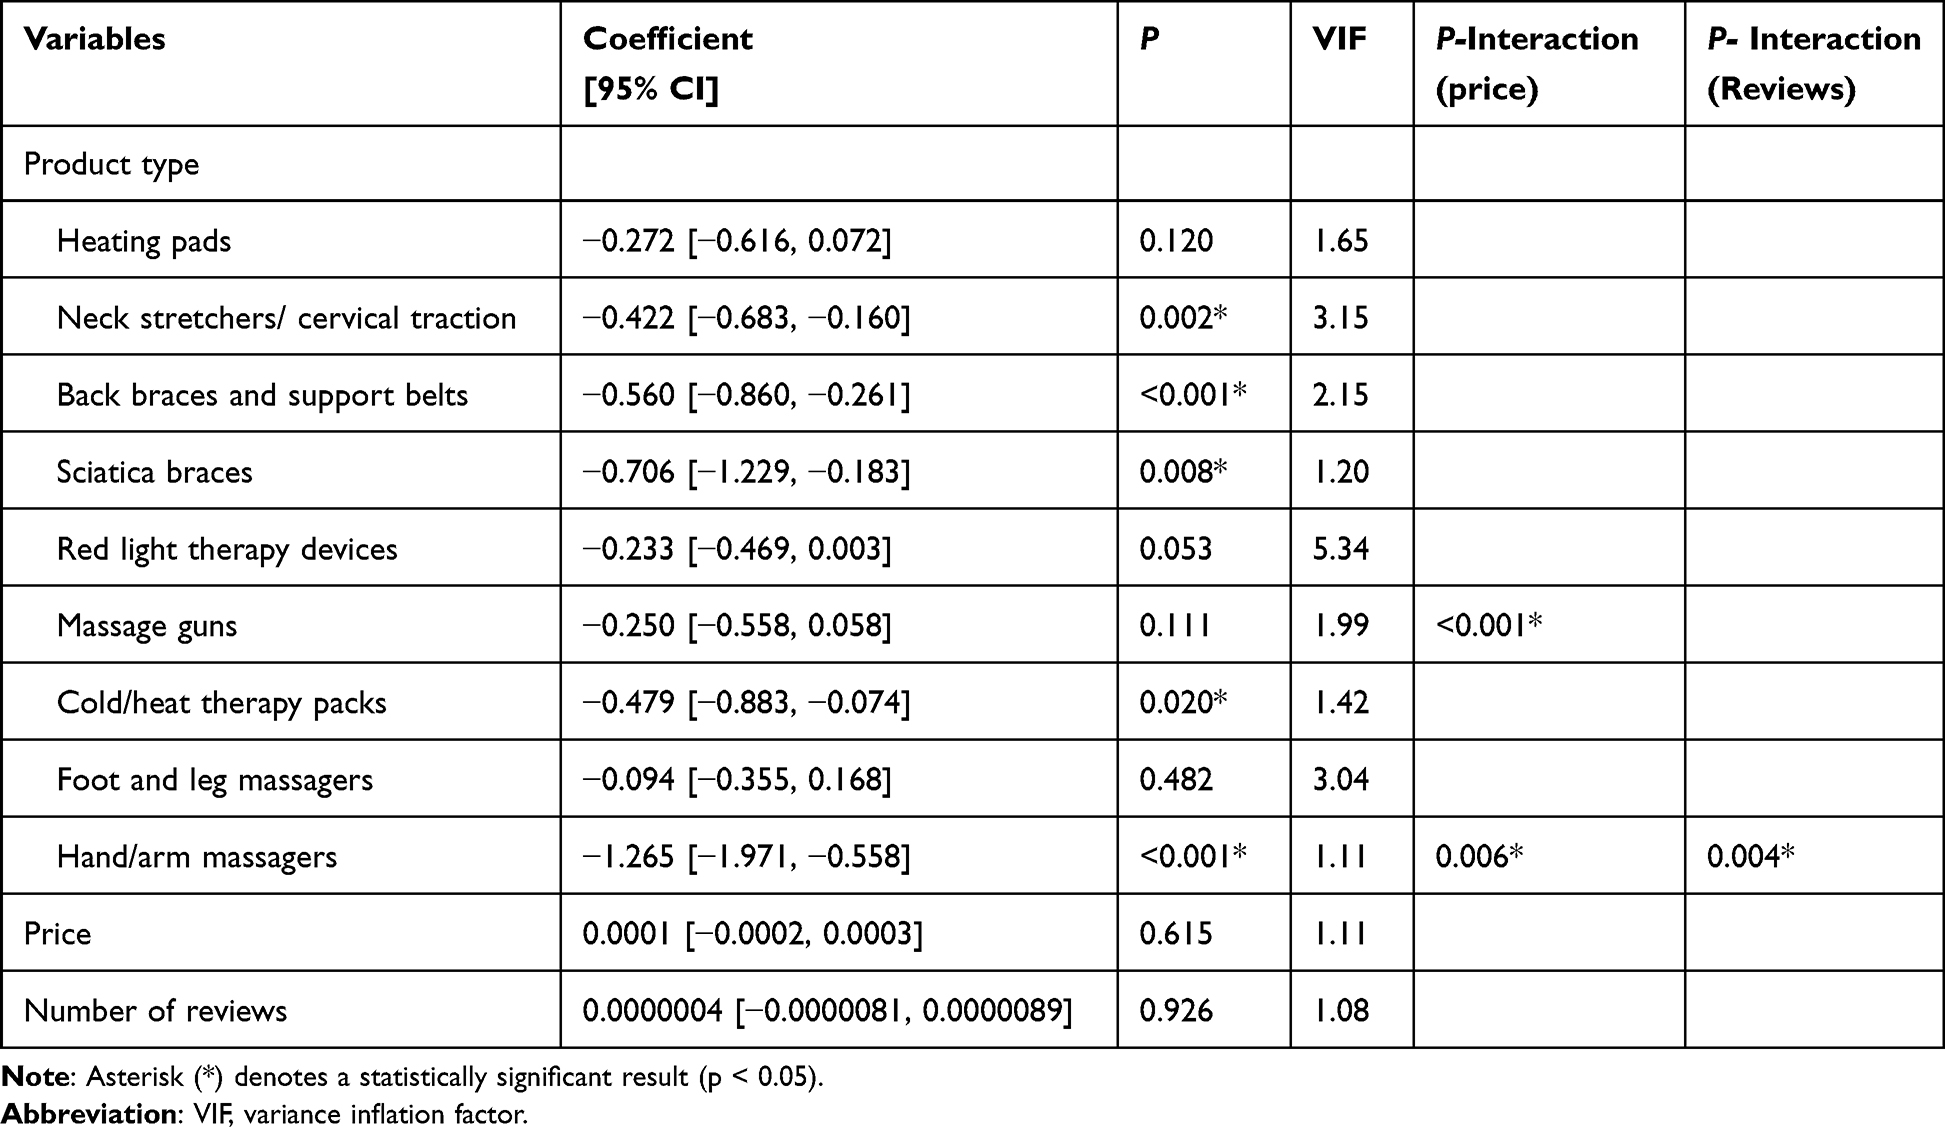 |
Table 2 Multivariable Generalized Linear Regression Examining the Association Between Pain-Relief Product Type and Customer Ratings, Including Interaction Terms with Price and Number of Reviews, and Variance Inflation Factors |
Discussion
The current study is the first to examine the factors associated with customer satisfaction ratings in e-commerce for noninvasive, nonpharmacological devices used to manage pain. Although prices and the number of reviews differ across products, these factors were not significantly associated with customer ratings. An exception was observed in certain products, such as hand/arm massagers and massage guns, for which the interaction with price was determined to be statistically significant. For hand/arm massagers, an increase in price was associated with a decrease in customer ratings, whereas for massage guns, an increase in price was associated with higher customer ratings. The distinct and unique relationship of each product suggests that individual factors are more closely associated with customer ratings than a unified perception of pain-relief products.
Our findings suggest that customer satisfaction is linked to other factors than to pricing or review quantity. TENS units received the highest score with the lowest variability in customer ratings, potentially reflecting their perceived effectiveness. We hypothesize that for TENS units, high satisfaction ratings are more strongly associated with their perceived therapeutic benefit—potentially relating to supporting clinical evidence supporting its efficacy—than with extrinsic factors such as price or the number of customer reviews.10–12 For cold/heat therapy packs, the observed decline in ratings with increasing price may reflect a perceived low price–value relationship rather than diminished product quality. This pattern aligns with perceived value theory in behavioural economics, in which consumers assess satisfaction based on the balance between utility and cost.10
In contrast, hand/arm massagers demonstrated lower customer satisfaction with greater variability, which may be associated with discrepancies between consumer expectations and actual product performance. These discrepancies could be related to factors such as limited supporting clinical evidence or device features.14 Moreover, our analysis revealed that for hand/arm massagers, price and the number of reviews were significantly associated with customer ratings. In the absence of effective pain-relief, customers may rely on secondary factors, such as price, when rating products rather than solely assessing effectiveness. Some evidence suggests that consumers use price as a heuristic for satisfaction, reasoning that a lower-cost purchase may justify suboptimal performance.14 Beyond individual purchasing decisions, broader financial factors are also associated with device adoption. Many pain-relief devices require out-of-pocket purchase or may not be reimbursed by insurance. Research on non-pharmacologic pain management in older adults has identified cost and limited availability as key barriers to use.14 These financial constraints highlight the need for further investigation into how affordability and accessibility impact patient decision-making and health outcomes in chronic low back pain management.
Limitations
Our study has several limitations that should be considered. Firstly, we rely on customer reviews as the primary outcome of interest, which is a subjective measure. This introduces the potential for biases in online reviews, such as selection bias or skewed ratings from customers with extreme experiences. Additionally, we did not conduct a qualitative analysis of individual comments, including length, depth, and specificity, to investigate the root causes behind customer ratings. We also conducted the research under the presumption that the reviews reflected authentic individual feedback rather than content generated automatically or by non-human algorithms. This limits our ability to identify specific factors contributing to customer satisfaction. Another limitation is the potential presence of non-genuine or incentivized reviews. Some online ratings could be influenced by vendor requests or benefits offered to reviewers, and we were unable to verify the authenticity of individual reviews using publicly available data. Moreover, our study does not account for customer demographics, such as age, gender, or physician-diagnosed health conditions, which may significantly influence expectations and satisfaction levels. Understanding these factors would provide more nuanced insights into customer perceptions. Lastly, our study captures a snapshot of customer ratings and reviews at a specific time point. This cross-sectional approach does not account for changes over time, such as product improvements, shifts in marketing strategies, seasonal purchasing behaviors, and cannot establish causal relationships.
More prospective studies are needed to validate the consumer-reported claims observed in our study by addressing these limitations. Future research should also incorporate qualitative analyses of individual review content, integrate device-level design characteristics, and examine rating dynamics longitudinally to better understand the drivers of customer satisfaction. Linking user ratings with clinical evidence and employing methods to detect fraudulent or automated reviews would further enhance the robustness of future evaluations.
Conclusions
While pricing and review quantity were not significant predictors of satisfaction across most devices, these factors interact with specific devices, such as hand/arm massagers and massage guns, and play a role in customer ratings. These findings underscore that customer satisfaction is not governed by a single variable but rather influenced by a combination of product-specific factors. AI-enhanced web scraping offers an efficient method for extracting insights from online reviews, guiding manufacturers toward improving product design and performance rather than focusing solely on pricing strategies.
Disclosure
Dr Michael E Schatman is the senior medical advisor for Apurano Pharma, outside the submitted work. The authors report no other conflicts of interest in this work.
References
1. Zimmer Z, Fraser K, Grol-Prokopczyk H, Zajacova A. A global study of pain prevalence across 52 countries: examining the role of country-level contextual factors. Pain. 2022;163(9):1740–7. doi:10.1097/J.PAIN.0000000000002557
2. Dahlhamer J, Lucas J, Zelaya C, et al. Prevalence of chronic pain and high-impact chronic pain among adults - United States, 2016. MMWR Morb Mortal Wkly Rep. 2018;67(36):1001–1006. doi:10.15585/MMWR.MM6736A2
3. Skelly AC, Chou R, Dettori JR, et al. Noninvasive nonpharmacological treatment for chronic pain: a systematic review. comparative effectiveness review no. 209. AHRQ Publication No. 18-EHC013-EF. Agency for Healthcare Res Quality. 2018;(209).
4. Q A, W TJ, M RM, et al. Noninvasive treatments for acute, subacute, and chronic low back pain: a clinical practice guideline from the American college of physicians. Ann Intern Med. 2017;166(7):514–530. doi:10.7326/M16-2367
5. Xu S, Kwa M, Agarwal A, Rademaker A, Kundu RV. Sunscreen product performance and other determinants of consumer preferences. JAMA Dermatol. 2016;152(8):920–927. doi:10.1001/JAMADERMATOL.2016.2344
6. Chong KPL, Guo JZ, Deng X, Woo BKP. Consumer perceptions of wearable technology devices: retrospective review and analysis. JMIR Mhealth Uhealth. 2020;8(4):e17544. doi:10.2196/17544
7. Fan JW, Wang W, Huang M, Liu H, Hooten WM. Retrospective content analysis of consumer product reviews related to chronic pain. Front Digit Health. 2023;5:958338. doi:10.3389/FDGTH.2023.958338/BIBTEX
8. Garrett SB, Nicosia F, Thompson N, Miaskowski C, Ritchie CS. Barriers and facilitators to older adults’ use of nonpharmacologic approaches for chronic pain: a person-focused model. Pain. 2021;162(11):2769–2779. doi:10.1097/j.pain.0000000000002260
9. Stoppok P, Teufel M, Jahre L, et al. Determining the influencing factors on acceptance of ehealth pain management interventions among patients with chronic pain using the unified theory of acceptance and use of technology: cross-sectional study. JMIR Form Res. 2022;6(8):e37682–e37682. doi:10.2196/37682
10. Zeithaml VA. Consumer perceptions of price, quality, and value: a means-end model and synthesis of evidence. J Mark. 1988;52(3):2–22. doi:10.2307/1251446
11. ChatGPT-4o O. 2024. Available from: https://openai.com/chatgpt.
12. Richardson L, Soup B. 2024. Available from: https://www.crummy.com/software/BeautifulSoup/.
13. Tversky A, Kahneman D. Judgment under uncertainty: heuristics and biases. Science. 1974;185(4157):1124–1131. doi:10.1126/SCIENCE.185.4157.1124
 © 2026 The Author(s). This work is published and licensed by Dove Medical Press Limited. The
full terms of this license are available at https://www.dovepress.com/terms
and incorporate the Creative Commons Attribution
- Non Commercial (unported, 4.0) License.
By accessing the work you hereby accept the Terms. Non-commercial uses of the work are permitted
without any further permission from Dove Medical Press Limited, provided the work is properly
attributed. For permission for commercial use of this work, please see paragraphs 4.2 and 5 of our Terms.
© 2026 The Author(s). This work is published and licensed by Dove Medical Press Limited. The
full terms of this license are available at https://www.dovepress.com/terms
and incorporate the Creative Commons Attribution
- Non Commercial (unported, 4.0) License.
By accessing the work you hereby accept the Terms. Non-commercial uses of the work are permitted
without any further permission from Dove Medical Press Limited, provided the work is properly
attributed. For permission for commercial use of this work, please see paragraphs 4.2 and 5 of our Terms.