")
Back to Journals » Diabetes, Metabolic Syndrome and Obesity » Volume 17
Prevalence of Diabetes and Associated Factors Among Government Employees of Mizan-Aman Town and Zonal Sector Office, Bench Sheko Zone, Southwest Ethiopia Region, 2022
Authors Zegeye MY, Yosef T , Asres A
Received 4 November 2023
Accepted for publication 30 January 2024
Published 12 February 2024 Volume 2024:17 Pages 725—738
DOI https://doi.org/10.2147/DMSO.S444487
Checked for plagiarism Yes
Review by Single anonymous peer review
Peer reviewer comments 2
Editor who approved publication: Prof. Dr. Antonio Brunetti
Mesfin Yimam Zegeye,1 Tewodros Yosef,2,3 Abyot Asres2
1Department of EMT, Mizan Aman Health Science College, Mizan Aman Town, Southwest Ethiopia Regional State, Ethiopia; 2Public Health Department, Mizan Tepi University, Mizan Aman Town, Southwest Ethiopia Regional State, Ethiopia; 3School of Medicine, Faculty of Health, Deakin University, Waurn Ponds, Australia
Correspondence: Mesfin Yimam Zegeye, Department of EMT, Mizan Aman Health Science College, Mizan Aman Town, Southwest Ethiopia Regional State, Ethiopia, Email [email protected]
Introduction: Diabetes mellitus (DM) is a serious non-communicable disease (NCD) that represents a major health and development challenge of the 21st century. Ethiopia is the leading country among the top five high-burden African countries for the number of people with diabetes. To address problems within the population, it is important to assess the prevalence of diabetes and identify the risk factors associated with its diagnosis.
Objective: The study aims to determine the prevalence of diabetes and identify its associated factors among office workers of Mizan-Aman Town administration and Bench Sheko Zone Sector Office.
Methods: A sector office-based cross-sectional study was conducted on 559 randomly selected employees of Mizan Aman Town Administration and Zonal Office from June 5 to June 30, 2022. Fasting plasma glucose was tested, and the result ≥ 126 mg/dL was used to diagnose DM. Data were entered using Epi Data version 4.0.2 and exported to the Statistical Package for the Social Sciences (SPSS version 26) for analysis. Bivariate analyses were included in the multivariable model with p < 0.25. Adjusted odds ratios (AOR) with a confidence interval (CI) of 95% are reported, with a significance level of p < 0.05.
Results: The overall prevalence of Diabetes was 9.4% with 95%CI(7.1,12.1)). Among the participants,60.8% were men, 58.2% of workers were aged 40 years or older, and the mean age was 39.7 ± 9.9 years. Having hypertension (AOR 3.85, 95% CI (1.7,7.4), family history of diabetes (AOR 4.5, 95% CI (1.2, 15.8), physical inactivity defined as failure to participate in moderate intensity activities at work, sitting ≥ 180 minutes per day (AOR = 3.57, 95% CI (1.1, 11.0)) and having central obesity AOR: 3.25, 95% CI (1.5, 6.7) independently associated with higher odds of DM. However, those having good knowledge of DM (AOR=0.26, 95% CI: (0.10, 0.6)) and consuming fruits and vegetables greater than five servings per week (AOR=0.32 95% CI (0.1, 0.7)) predicted lower odds of DM.
Conclusions and Recommendations: The prevalence of DM among office workers was high and is associated with lifestyle, family history, dietary practices, and knowledge about DM. Therefore, arranging regular screening programs at the workplace and promotion of healthy diet, exercise, and awareness creation are needed to lower the prevalence.
Keywords: diabetes mellitus, office workers, Mizan-Aman, prevalence, Ethiopia
Introduction
Diabetes mellitus (DM) is a group of metabolic diseases characterized by hyperglycemia resulting from disorders of insulin secretion, insulin action, or both, and chronic hyperglycemia in diabetes is associated with long-term damage, dysfunction, and failure of various organs.1–3 Diabetes mellitus, simply called diabetes, is a serious, long-term disease that occurs when blood sugar levels rise.4
Diabetes is a major public health problem and one of four priority non-communicable diseases (NCDs) receiving attention from world leaders. The number of cases and the incidence of diabetes have increased steadily in recent decades.5 According to the President of the International Diabetes Foundation (IDF, 2021), “Diabetes is a pandemic of unprecedented proportions that is spiraling out of control”.4
Although no studies have been conducted specifically for government officials on the trends and impacts of diabetes, in the general population, disability-adjusted life years associated with diabetes have trended upward for most major diseases around the world, the highest observed age-standardized mortality occurred in Oceania, followed by sub-Saharan Africa, Southeast Asia, and central Latin America.6 In the worst-case scenario, diabetes becomes increasingly prevalent in productive populations,7 as the IDF reported in 2015, approximately 77.3% of people with diabetes are between 20 and 64 years old.8
According to the 2022 IDF report in Ethiopia, the prevalence of diabetes among adults in the general population was 3.3%,9 and the WHO global diabetes report found that 3.8 people suffered from diabetes among the general population.10 The 2016 STEPS national survey report showed that 5.9% of Ethiopians suffer from diabetes.11 However, to tackle this burden, Ethiopia tried to implement the WHO NCD prevention and strategies, preparing guidelines, policies, and strategies in general, setting targets focusing on the four major shared risk factors.12,13
However, DM prevalence has been documented in many population categories at the community level across the world with varying prevalence rates. Different studies have been done on disease prevalence among rural and urban even in Ethiopia.14,15 However, the magnitude of diabetes among office workers in the Mizan-Aman office is not known. Not only the prevalence but also the factors associated with diabetes are unknown, and previous studies conducted in other parts of Ethiopia have shown inconsistent and ambiguous results on risk factors for diabetes among civil servants and, as far as we know, on the prevalence of diabetes. Diabetes among employees in a limited sector and only in selected facilities.16–18
However, community studies may not identify risk factors for an employee. Because government officials may not be present during the data collection period. This makes it difficult to represent workers in a general population survey. However, this population has more potential risk factors than other populations leading to the development of diabetes because they are physically inactive and follow a sedentary lifestyle compared to the general population.
Therefore, a study on the prevalence of diabetes and related factors among civil servants who work at the office level can demonstrate the overall burden and possible contributing factors, particularly in this population group. Therefore, this study aims to determine the prevalence of diabetes and identify its predictors among office workers of Mizan-Aman Town administration and Bench Sheko Zone, Sector Office.
Method and Materials
Study Setting
The study was conducted in Mizan-Aman, the administrative center of the Bench Sheko zone in the southwestern region of Ethiopia. The city is 581 km from Addis Ababa, the capital of Ethiopia. As an administrative center, the city has two administrative structure sector offices, 26 Zonal Administration Sector offices, and 23 Mizan-Aman town Administration offices, a total of 49 government offices with a total of 2707 permanent public sector employees. In Mizan-Aman town particularly in DM, there are diagnostic and therapeutic services and about 487 cases at Mizan Health Center and Mizan-Tepi University Hospital where chronic cases are observed. In addition, DM associations have been established to encourage patients to adapt to self-care and raise awareness.19
Study Design
This study used a cross-sectional sector-based study design. The source population was all office workers in the town Administrative and Zonal Sector Office of the Government in Mizan-Aman during the study period. The Study Population office workers were selected randomly during the study period. Inclusion Criteria were all civil servants who work at Mizan-Aman town administration, and zonal sector offices were included.
Sample Size Determination
The sample size of a single population survey was used to determine sample size by using Epi info version 7.2.2.2 by taking the following assumptions: 7% prevalence from the study in Ethiopia prevalence of T2DM among government employees was used,17 95% confidence level (z), 2% maximum tolerable error of (d) and population/office workers were 2707. Then, 508 was the estimated sample size, a 10% non-response rate was added, and the final calculated sample size was 559.
Sampling Methods and Techniques
A simple random sampling technique was employed. First, the list of employees was obtained from the public service wage register. A simple survey was used to identify people whose lists were available but who were temporarily absent from the area during data collection, for example, people in long-term training. A total of 74 people were excluded from the study. After verifying the eligible persons with the district and town administration, the program was developed in which the payroll of all employees of the zone and town administration was prepared on a single Excel spreadsheet containing ID card, name, and office. Individual order from 1 to 2633. Randomization was done based on the employee ID entered in Excel. Random numbers were then generated using Excel. The sample size was then selected. If test participants were absent during data collection, an attempt was made to recheck the return time by the next day; otherwise, the next person was included after the second trial.
Variables
Dependent Variable
Prevalence of diabetes.
Independent Variables
Socio-demographic characteristics: Age, gender, religion, marital status, income/salary, education, years of employment, position.
Behavioral factors: Alcohol consumption, smoking, khat chewing, physical activity.
Nutritional status: Obesity/overweight, waist circumference, and dietary habits (fruit and vegetable consumption).
Family and personal history of chronic diseases: History of first-degree relatives, diabetic, hypertension, history of gestational diabetes.
Knowledge of Diabetes: What is Diabetes? Diabetes characteristics, diabetes risk factors, diabetes prevention, and diabetes risk perception.
Methods for Collecting Tools and Data
Data were collected using a pre-structured interviewer-administered questionnaire prepared in English and then Amharic; for consistency, it was eventually converted back into English. The tool was adapted from the WHO NCD Risk Factor Surveillance Questionnaire and the EPHI Ethiopia NCD Risk Factors STEPS Report,11,20 with this study using a standardized and validated tool that has already been used in Ethiopia. The data collectors included representatives of two disciplines: two medical laboratory technicians with bachelor’s degrees for plasma glucose measurements and two nurses with bachelor’s degrees for other medical history, anthropometry, and blood pressure measurements and to provide feedback to participants on the results. A supervisor oversees all data collection processes and checks the quality of each questionnaire. The principal investigator conducted a two-day training on the study and data collection process. The study was conducted according to the WHO stepwise approach to non-communicable diseases,21 which includes 3 steps.
Step 1 Before starting to ask questions, the data collector followed the instructions in the questionnaire. That is greeting, explaining about the study, his/ her right, and benefits from the study finally confirming the agreement with written consent including to become fasting (before eating his/her breakfast in the office). Then collect information on sociodemographic characteristics (age, gender, marital status, education level, location, income level) and behavioral risk factors (current smoking, harmful alcohol consumption, and low physical activity). DM information was assessed based on knowledge and risk perceptions derived from DM knowledge, attitudes, and practices in the Ethiopian community of Bale and Cotonou in southern Benin.22–24
Phase 2 Physical Measurements
Standardization was performed before measurement to avoid inter- and intra-measurement differences by performing measurements on 15 subjects before data collection. This standardization was done for weight measurement. The data were then used to calculate an inter-observer equivalence or agreement index and measured using the kappa coefficient. The agreement was K = 0.89.
A room was prepared in each office to provide a central location for adjacent areas in a single, protected facility for conducting Phase 2 measurements. Position tables, chairs, and equipment to optimize participant flow in the following phases: Phase 2, blood pressure measurement, height measurement, and third weight measurement.
Blood Pressure Measurement: A history of hypertension is considered positive if a person has been diagnosed with hypertension. Blood pressure (BP) was measured in a sitting position on the right arm using automatic digital sphygmomanometers with universal cuffs (NUTEC BP-09). Please sit near the blood pressure measurement area and allow yourself to relax for 15 minutes before taking your blood pressure measurement. Three measurements were taken 5 minutes apart, and the average was used as the final blood pressure measurement. Hypertension was defined as systolic blood pressure of at least 140 mmHg, diastolic blood pressure of at least 90 mmHg, or both.12
Height: Was measured with a calibrated stadiometer. During the height measurement, participants stood in a normal anatomical position and their heels, buttocks, shoulders, and back of the head touched the measurement plate. The size was recorded rounded to 0.5 cm to the next value.
Weight: The SECA Germany weight scale was used after setting up a flat, hard surface. When measuring body weight, each participant wears a light fabric. Before each measurement, the scale was zero-calibrated and its function was checked using a known weighing object. Body mass index (BMI) was calculated by dividing body weight (kg) by the square of height (m2) and classified according to the WHO classification: underweight ≤18.5 kg/m2, normal (healthy body weight) = 18.5 to 24.9 kg/m2, overweight = 25.0 to 29.9 kg/m2, obesity ≥30 kg/m2.25
Waist circumference was measured with a constant tension tape measure (Myo Tape Body Tape Measure); To do this, use an inelastic tape measure that is wrapped around the subject halfway between the bottom edge of the last rib and the top edge of the iliac crest. The central axis served as the reference point.
Phase 3 – Biochemical Measurements
Plasma glucose measurement: The ability to measure fasting plasma glucose, which requires overnight fasting, makes the test difficult to perform in practice. A random plasma glucose test (RBS) was performed for screening purposes. If the plasma glucose level was then ≥200 mg/dL,26–28 overnight fasting plasma glucose was performed to establish the diagnosis of diabetes.
It was determined using the finger stick glucose strip method. Test strips of the CareSens N plasma glucose test were used and its Batch No. TN12LE67B, expired date 12/2023, manufactured in i-SENS, Inc. Korea. A sealed blood lancet was used for puncture, and the kit was accurate for reading the result within 5 seconds in mg/dl, and the result was valid.
Quality control was done every morning and followed the manufacturer’s instructions. The procedure was carried out at the initial contact by two laboratory technicians at the workplace; in the event of an increase in RBS, an appointment was given for the next day, with appropriate indications of the need for fasting. Participants with fasting plasma glucose ≥126 mg/dL who have raised plasma glucose results were linked to a nearby hospital to be checked by the definitive test laboratory for DM, that is to check the fasting plasma glucose for further diagnosis and management of their conditions by providing the result with a feedback request sheet prepared to link. The final classification was based on the FPG result.
Operational Definition
Diabetes is a fasting plasma glucose (FPG) level ≥126 mg/dl.29,30 Individuals with a fasting plasma glucose ≥126 mg/dL are included in the Yes DM category, and all individuals with <126 mg/dL are considered non-diabetic. Individuals having previously known DM cases and who were under medication for DM, historically considered as a previously diagnose Diabetes case.
Undiagnosed diabetes respondents answered “no” known history of DM previously but had fasting plasma glucose ≥126 mg/dl.29,30
Alcohol consumption was defined as the consumption of these four alcoholic beverages, with women consuming more than a glass of Tella (an Ethiopian drink) and/or a cup of araki and/or Teji and/or a bottle of beer more than three times per week and more than three times a week per week more than two glasses of Tella and/or one cup of Areca and/or more than two bottles of beer for men.31
Harmful alcohol consumption: This includes all men who reported drinking ≥5 drinks in the 30 days before the survey and all women who reported drinking ≥4 drinks one or more times. A drink was defined as a bottle or glass of wine or a glass of another alcoholic beverage, eg Gin, red wine, Areki, Tella, Teji.12
Unhealthy diet: This has been described as consuming fewer than 5 servings of fruits and vegetables per week.12 One serving = 80 grams (converted into different cup units depending on the type of vegetable and standard cup size), vegetables (cabbage = 1 cup per serving, other chopped vegetables = ½ cup per serving) and fruits (mango, avocado, banana, 1 medium piece of orange and cooked avocado, tomato and fruit juice (½ cup) for one serving).12
Good knowledge: This was measured using questions about basic characteristics of diabetes, common symptoms, common risk factors/causes, and a total of 16 prevention and control items. Individuals who answered general or above the mean score among the knowledge questions were considered to have good knowledge of diabetes.22–24
Poor knowledge: Individuals who responded below average to the overall knowledge questions were considered to have low diabetes knowledge.22–24
Risk Perception: The way a participant thinks and behaves toward the DM measured by 6 items, and whoever scored above average was considered to have good risk perception if the below average score indicated poor risk perception toward the DM.22–24
Physical Activity: When it is body movement produced by skeletal muscle contraction that increases energy expenditure above baseline levels, physical activity generally refers to the subset of physical activity that improves health.32
Low physical activity: Defined as <150 minutes of moderate-intensity activity per week.12,32
Moderate physical activity: Is defined as activity that lasts longer than 10 minutes at a time, such as gardening, washing clothes by hand, fetching water, or cycling.12
An intense activity: Is defined as an activity that lasts longer than 10 minutes at a time, such as eg plowing, sawing hardwood, or playing football. We also estimated the proportion of study participants who met WHO recommendations for ≥75 minutes of vigorous physical activity or 150 minutes of moderate physical activity per week.12
Sedentary behavior is any behavior expressed by low energy expenditure (≤1.5 MET), ≥180 minutes per day in a sitting, semi-recumbent, or reclining position (excluding normal sitting time). Sleep) the definition of sedentary behavior includes independent sitting (leisure, work time, and general), and television.32–34
Abdominal obesity is defined as a waist circumference (WC) of more than 102 cm in men and 88 cm in women.35
Data Quality Management
To maintain data quality, the data collector and supervisor received two days of training on tools and procedures. Before data collection and re-evaluation, a preliminary test of the reliability and validity of the tools and instruments was carried out in the administrative office of Mizan Tepi University Hospital. After conducting the pretest, corrections were made based on the observed deviation. The correct functioning of the measuring devices and testing devices was checked every morning by respected and experienced specialists. Plasma glucose monitoring was performed according to standard operating procedures, and quality control was performed each morning before sample testing. Close monitoring was conducted and the researcher checked the completeness of the data before the next data collection date. During the data collection process, each questionnaire was reviewed each morning by the supervisor, and principal investigators to ensure that it was complete. Additionally, the study used a standardized data collection tool (classified by WHO) to ensure its accuracy.
Data Analysis and Management
Data were entered, cleaned, coded in version 4.02, and exported for analysis using SPSS for Windows version 26.0. Data were cleaned and whenever missing and/or unexpected values were noted, this value was compared with the completed paper data collection questionnaire to correct data entry errors. When necessary, descriptive statistical analyses such as range, mean, standard deviation, frequency, and percentage were performed for various variables. Because the outcome variable was categorical, bivariate and multivariable logistic regression models were fitted to control for potential confounding variables and to determine factors associated with the presence of diabetes. Variables in the logistic regression model were entered via stepwise (conditional) backward multiple regression.
In the bivariate analysis, a statistically significant variable with a p-value <0.25 was a candidate for multivariable logistic regression analysis. Before any modeling, multicollinearity was performed and a multicollinearity effect was detected (minimum value 1.014 and maximum 12.37 VIF between knowledge and perception on DM); after removing one variable, the minimum value was 1.011 and the maximum value was 1.078. After testing, perception was removed from the multivariable analysis. The Hosmer–Lemeshow goodness-of-fit test was used to evaluate the appropriateness of the model (P value 0.678). Adjusted odds ratios with 95% CI were reported, with the significance level at p < 0.05. Finally, the result is presented in the form of text, frequency, statistical summary, and graphics.
Ethics Approval and Consent to Participate
The study was conducted after approval, and ethical clearance was obtained from the Mizan Tepi University, College of Medicine and Health Sciences Research Ethics Review Committee with reference number PGD/0152/2022. Study participants were asked to provide oral and written consent as the study did not pose any risk to them. The information was confidential. Participation was only voluntary, participants had the right to ask for the result and can withdraw from the survey after having agreed to participate. Strict procedures were done to protect the privacy of participants and the confidentiality of their personal information and to minimize the impact of the study on their physical, mental, and social integrity.
A strict standard procedure (aseptic technique) was used while drawing blood to minimize harm. Raised blood glucose results and raised blood pressure were linked to the health facility after providing health education. Provision of health education about NCD in general and DM in particular to the study participants to ensure beneficence to them. Overall, this study complied with the Declaration of Helsinki Ethical Principles for Medical Research Involving Human Subjects.
Results
Sociodemographic Characteristics of the Study Participants
All study participants were employees of government offices of Mizan-Aman town, which covers only the zonal office and local government sector levels. Of the 521 participants, 317 (60.8%) were men, 204 (39.2%) were women and 303 (58.2%) were workers aged 40 years or older, 218 (41.8%) <40 years and the mean age (± standard deviation) of the study participants was 39.7 ± 9.9 years. Of the study participants, 452 (86.7%) were married, 69 (13.2%) were single, and 312 (59.9%) were followers of the orthodox Tewahido religion. Most participants had an education level of 274 (52.5%). Most of the positions or working conditions of the survey participants in the last 12 months were civil servants or technical experts 267 (51.2%), followed by support staff 111 (21.3%). The average tenure is 16.7 ± 9.8 years. The median monthly salary was 7071 Birr with an interquartile range (IQR) of 5122 (Table 1).
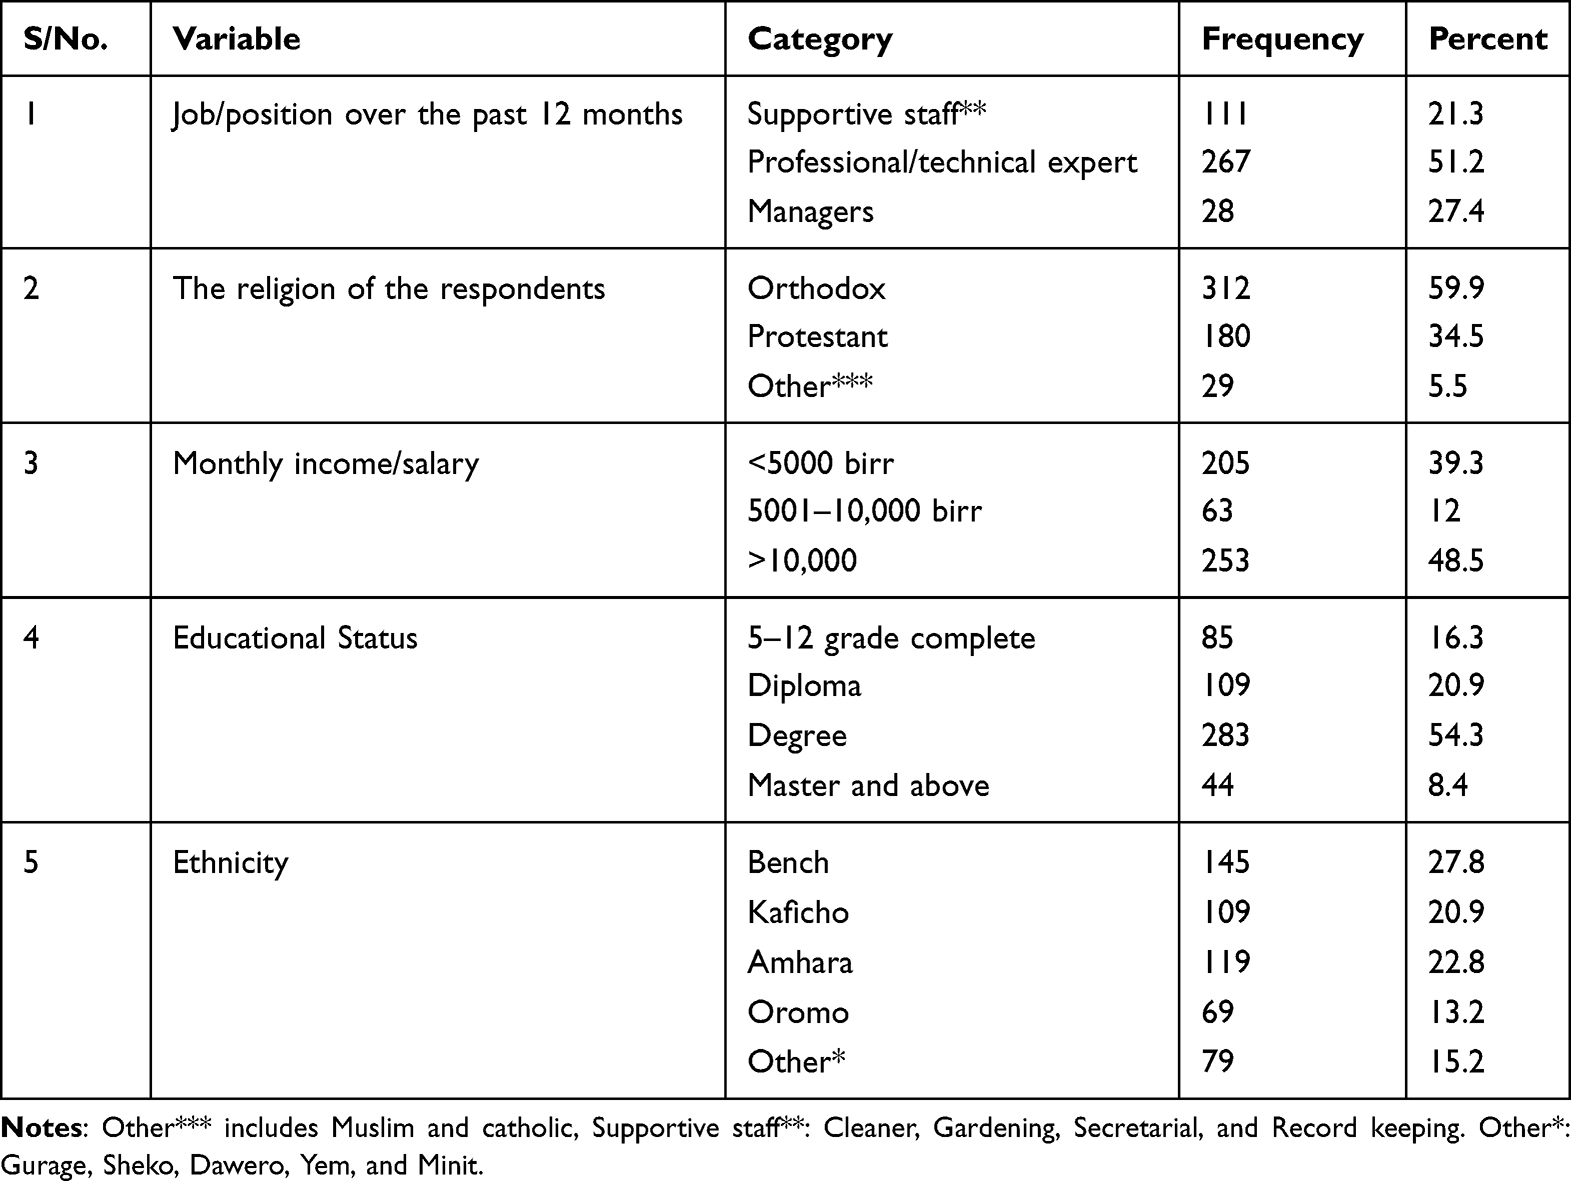 |
Table 1 Sociodemographic Characteristics of Government Employees Who Work in Sector Office in Mizan-Aman Town Administration and Zonal Sector Office,2022 |
Knowledge and Perception of DM Among Employees
Of the total number of respondents, 184 (35.3%) have good knowledge, and 337 (64.7%) have poor knowledge about diabetes, as measured by questions about basic characteristics of diabetes, typical symptoms, typical risk factors, and a total of 16 prevention and control points. Individuals who answered the general knowledge questions with an average score or higher were considered to have good knowledge of DM (average score of at least 0.5). In the questions assessing knowledge about the use of a healthy diet, 272 (52.2%) and regular physical exercise (40.9%) of the employees surveyed had correct answers about prevention methods and other points related to diabetes.
Of the study participants, only 143 (27.4%) have a good perception regarding the risk, basic character, and prevention methods, and 374 (71.8%) of the participants have a poor perception regarding DM. Four hundred and twenty-one (80.8%) of the respondents perceive that they are not potentially at risk for DM and 291 (55.8%) perceives that no need of screening for DM without showing sign and symptom.
Distribution of Behavioral Factors Among Employees
As the result shows, 94 (18.04%) office workers, 105 (20.15%) and 218 (41.84%) office workers smoked cigarettes, chewed khat, and consumed alcohol among the most common risk factors for diabetes assessment. Of the alcohol drinkers, 64 (64%) were harmful alcohol users and 36 (36%) had no harmful alcohol consumption in the 30 days before data collection. The amount of alcohol consumed on one occasion in the past 30 days <4 standard drinks/bottles/glasses among alcohol consumers was 33 (33%) and ≥4 standard drink bottles/glasses per individual alcohol consumer was 68 (68%) (Table 2).
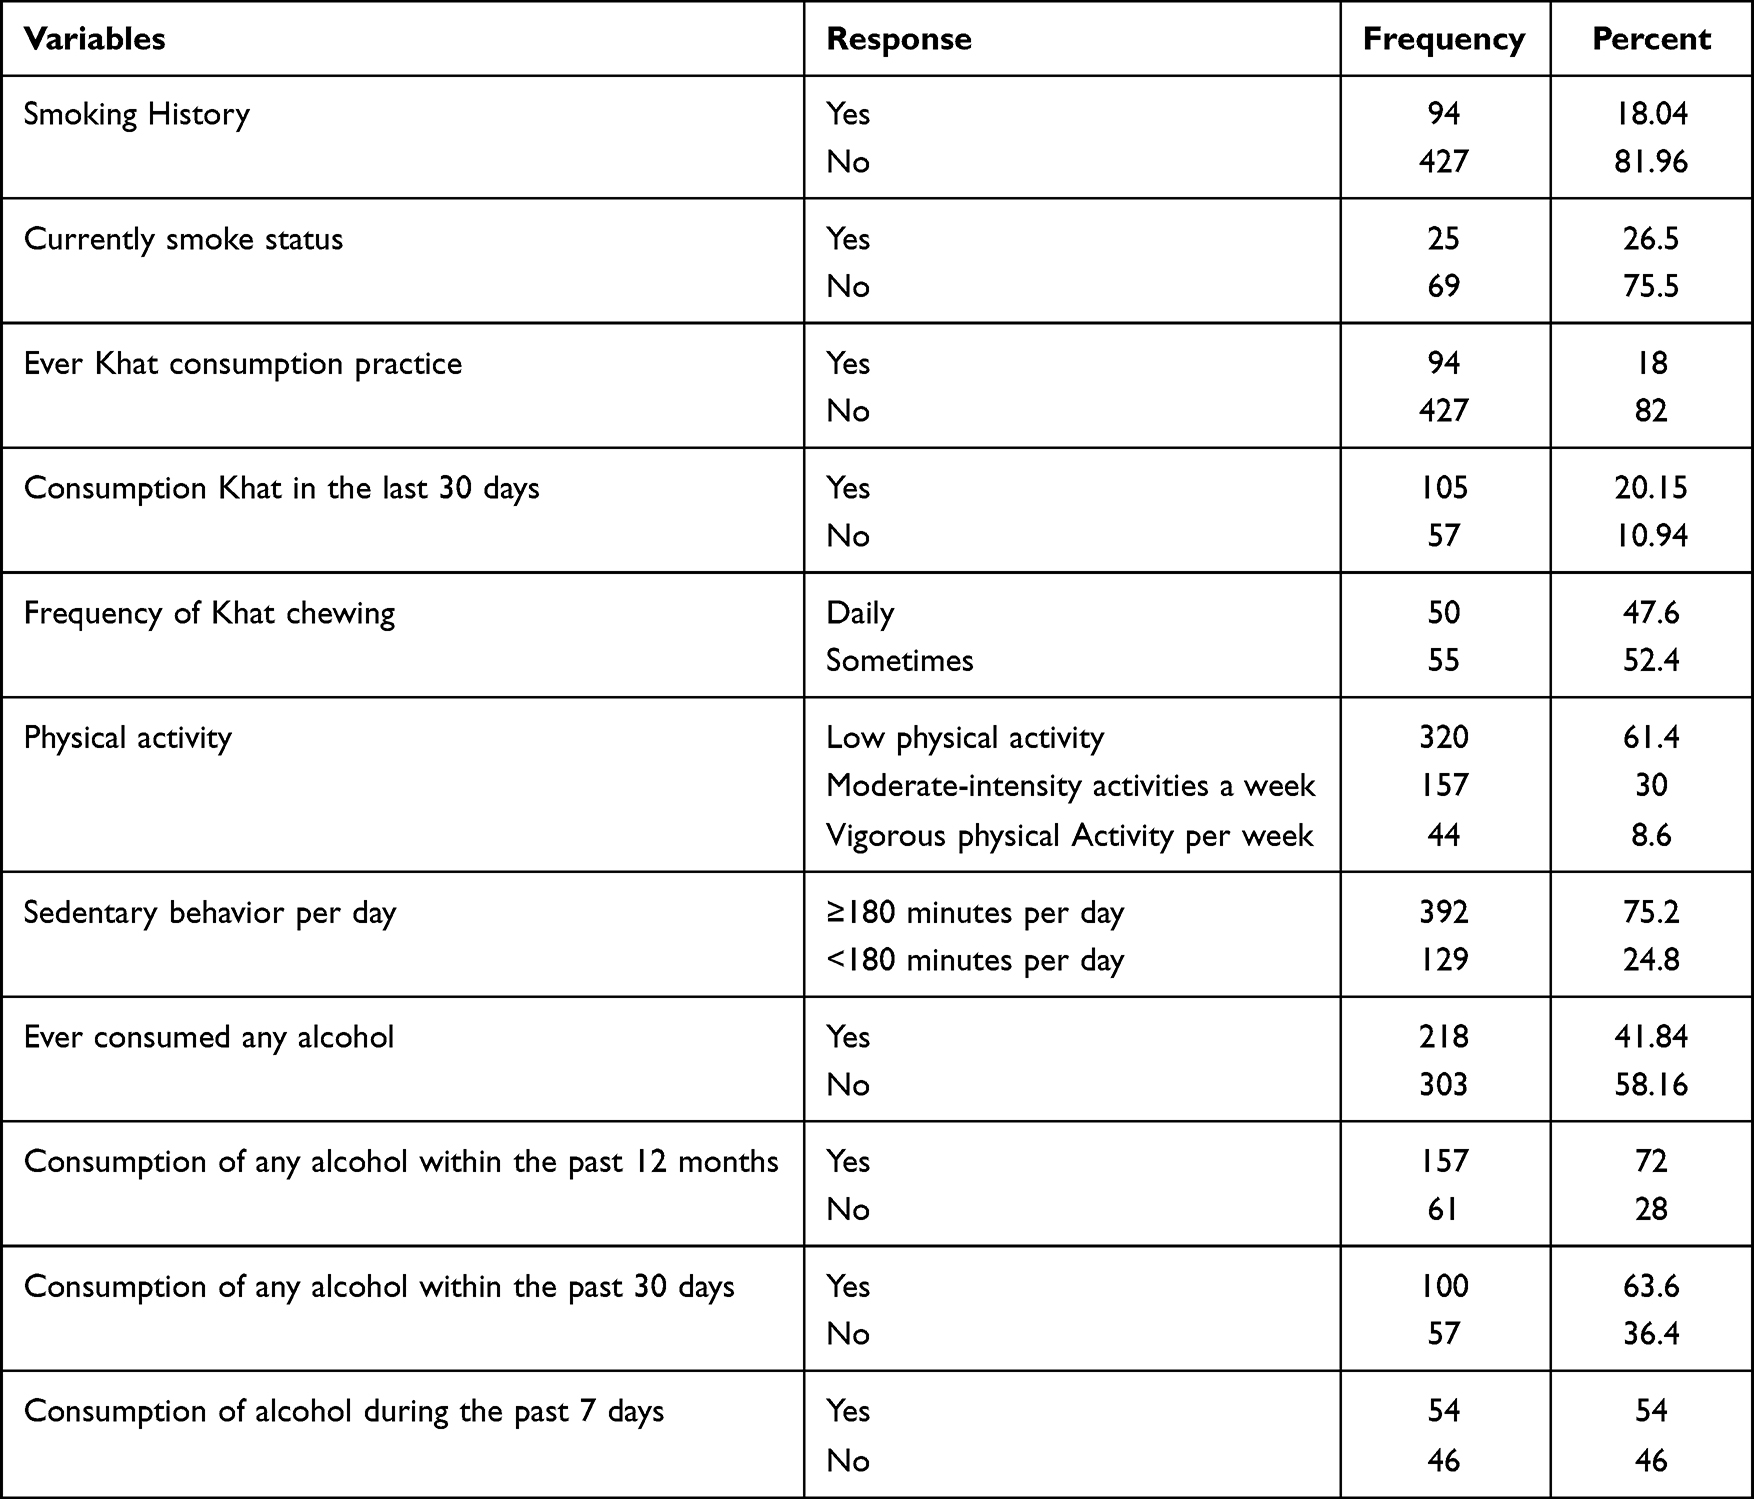 |
Table 2 Behavioral Characteristics of the Study Population Among Office Workers in the Sector Office in Mizan-Aman Town Administration and Zonal Sector Office, 2022 |
Results on the Nutritional Status of the Respondents
A relatively good dietary practice was the consumption of 462 (88.7%) fruits and vegetables or ≥5 servings per week. However, the prevalence of sweet food consumption was 296 (56th place).8th %). From the anthropometric measurements of the employees, the BMI result showed that 114 (22%) were overweight, 43 (8%) were obese, 343 (66%) were normal and 21 (4%) were underweight. Likewise, the result of the central obesity test shows that more than 253 people (48.6%) belong to the risk category and 268 (51.4%) are normal. A relatively good dietary practice was the consumption of 462 (88.7%) fruits and vegetables or ≥5 servings per week. However, sweet foods were consumed frequently: 296 (56.8%) (Table 3).
 |
Table 3 Nutritional Status of the Respondents Among the Mizan-Aman Town Administration and Zonal Sector Office Workers, Southwest Ethiopia Region, Ethiopia, 2022 |
Assessment of Personal and Family History of Chronic Illness
There were 93 (17.8%) currently identified cases (undiagnosed hypertensive patients) and 29 (5.6%) previously known cases of hypertension. Overall, the prevalence of hypertension among the officials of Mizan-Aman Town Corporation and Zonal Sector Office was 122 (23.4%). Of the study participants, 22 (4.2%) had a family history of diabetes, and only 2 women had a history of gestational diabetes.
Prevalence of Diabetes Among Office Workers
The overall prevalence of diabetes (newly diagnosed fasting and previously diagnosed) among civil servants was 49 ((9.4%), 95% CI (7.1, 12.5)). People who took diabetes medication during the study had already been diagnosed with diabetes. Of the employees, 14 (2.7%) already have a diagnosis of diabetes and are taking medication. Of a total of 507 public employees examined (tested), 39 (7.7%) had random plasma glucose values ≥200 mg/dL. After further follow-up with measurement of fasting plasma glucose, the incidence of diabetes (≥126 mg/dL) after an overnight fast was 35 (6.7%). This means that 71.4% of all cases were undiagnosed DM.
Factors Associated with DM Among Employees
Bivariate and multivariate analyses using binary logistic regression to identify factors associated with diabetes. Therefore, family history, hypertension, consumption of ≥5 portions of fruits and vegetables per week, abdominal obesity, lack of participation in moderate-intensity work activities, sedentary lifestyle, knowledge of diabetes, and perception of diabetes were identified as possible factors in the bivariate analysis (p-value <0.25).
In the multiple logistic regression analysis, DM and its associated factors among sector office workers are high blood pressure, lack of participation in moderate-intensity work activities, a sedentary lifestyle, a family history of diabetes, and abdominal obesity, which have a positive association with diabetes. Whereas good knowledge of diabetes and consumption of ≥5 fruits and vegetables per week were protective factors for civil servants working in sector offices.
The most significant variables in the raw analysis behaved similarly in the multivariate model. After controlling for other variables in the multivariable model, the study found a significant positive association between hypertension and diabetes, with the risk of diabetes in people with hypertension being 3.5 times more likely to be diabetic than the non-hypertensive employee’s adjusted odds ratio (AOR)= 3.58, 95% CI (1.7, 7.4) and having a previous relative history of Diabetes were 4.5 times more likely to have DM than sector office workers who had no family history of diabetes (AOR:4.5, 95% CI (1.28, 15.8)).
Sitting ≥180 minutes per day is 3.5 times more likely to lead to diabetes (AOR = 3.5, 95%CI (1.1, 11)), and if no moderate-intensity activity at work is performed for a week, the likelihood of developing diabetes is 5.8 times higher, more common in diabetics than in people who do moderate work (AOR: 5.8, 95%CI (2.7, 12.5)). Employees working in branch offices with central obesity/high waist circumference (>102 cm for men and >88 cm for women) are 3.25 times more likely to have diabetes than workers with a waist circumference and a small waist. AO: 3.25, 95% CI (1.5, 6.7). However, people with good knowledge about diabetes are 74% less likely to develop diabetes than people with low knowledge (AOR=0.26, 95% CI (0.26; 10, 0.6)) and consumption of ≥5 servings of fruits and vegetables per week (AOR = 0.32 95%CI (0.1, 0.7)) were associated with a lower risk of developing diabetes (Table 4).
 |
Table 4 Binary and Multiple Logistic Regression Analysis of Associated Factors Among Office Workers at Sector Office in Mizan-Aman Town Administration and Zonal Sector, Southwest Ethiopia, 2022 |
Discussion
In this study, the overall incidence of diabetes (≥126 mg/dL) after an overnight fast was 9.4% (95% CI: 7.1–12.1). This result was inconsistent and very high compared to studies conducted in Ethiopia in different institutions. The prevalence was 7%17 among employees of selected institutions and civil servants in Harar, and 5%,36 among members of the Federal Police Commission residing in Addis Ababa. DM among commercial banks in Addis Ababa is 6.5%.16 This difference may be due to the time difference, and the studies are conducted in single and selected establishments, whereas the current study included all sector office employees to make the representative sample.
This overall prevalence of diabetes was also close to high at 9.4% among public servants, as shown by various studies conducted in Ethiopian communities. The overall prevalence of diabetes in the community was 6.5% in Mizan Aman town,37 according to the 2022 IDF report in Ethiopia, the prevalence of diabetes among adults was 3.3%,9 and the WHO global diabetes report found that 3.8% people a suffered from diabetes among the general population.10 The 2016 STEPS national survey report showed that 5.9% of Ethiopians suffer from diabetes.11
Therefore, this result showed a rapid increase in the prevalence of DM at an alarming rate and the burden of DM among office workers was high and shared the largest burden than other communities. Therefore, these sub-population groups may be disproportionately affected by DM. The other explanation for this notable difference among office workers with diabetes may be associated with the global increase in the trend of DM and the predicted epidemic in developing countries, the shift of civil servants who work in offices to a sedentary lifestyle, rapid urbanization, age of the study population and lack of practice to enable physical exercise within the area.
Another finding of the present study is that 71.4% of diabetes cases were newly diagnosed and the proportion of people who were previously unaware of their disease was very high, despite the good behavior of the officials working in the offices in the search expected to seek medical care because most employees expected good behavior when seeking medical care were educated. It is possible to imagine the difference between our country’s office workers and Latino agricultural workers in California 61.1% were aware of their status of DM and other chronic health illnesses.38 This result was comparable with the finding from Dessie town 72.5%,39 the 6.7% prevalence of undiagnosed DM was high from a 5.3% cumulative prevalence of undiagnosed DM in African adults, although the same study reported an 8.7% prevalence among urban adults.40
This could be attributed to the poor knowledge of the office workers 337 (64.7%). It may also be due to the poor health-seeking behavior of the employees unless the health problem shows severe signs and symptoms, or they perceive that the disease is severe.41 This result is alarming for the Ministry of Health, public servants, and all relevant authorities, as it indicates that there is a high level of UNDIAGNOSED DM among employees and these people seek medical help after experiencing serious complications of the disease, which can be easily avoided if the disease is diagnosed early.
This study indicated that being hypertensive has a positive association with DM. But also, the prevalence of both seems a twin epidemic among office workers. Because the prevalence of DM among Hypertensive individuals in office workers was high 23 (18.8%). This finding was similar to the study done among government employees in Harar, Eastern Ethiopia, among urban adults in Dire Dawa, Eastern Ethiopia, among members of the federal police commission residing in Addis Ababa, and NCD risk factor profile among public employees in a regional city in northern Ethiopia,17,27,36,42 also similar with the study done on NCD risk factors among civil servants in Ibadan, Nigeria.43
A family history of diabetes was a factor associated with the development of diabetes in civil servants. This finding is also consistent with other studies conducted in Nigeria on the risk of developing diabetes among local officials and in East Gojjam, Ethiopia, at the community level, and a study conducted in Guinea-Bissau at the clinical level reported.34,44,45 The result shows that most of the officials working in sector offices (83.8%) were unaware of genetics/family history which was one of the main factors affecting diabetes.
This study found that a lack of moderate-intensity activity for a week was strongly associated with diabetes, consistent with results from other studies. Physical inactivity is a common risk factor in Ethiopia.17,36,42 Another study conducted in India confirms that the duration of physical activity and sedentary behavior increases the risk of developing diabetes.33 The reduction in physical activity associated with a more sedentary lifestyle at work may partially explain the development of diabetes. Physical activity has been shown to increase insulin-stimulated glycogen synthesis and increase muscle mass, which may contribute to the positive effects of physical activity on insulin sensitivity.46
This study found that sitting for ≥180 minutes per day is strongly associated with diabetes among government employees. This is also similar to a study conducted on bank employees and teachers in Chennai, India, where prolonged sitting at work of ≥180 min/day was associated with elevated plasma glucose levels.33 The results on sedentary behavior are also consistent with previous studies of working adults.47,48 A sedentary lifestyle leads to lower energy expenditure and increases insulin resistance.49 Data suggest that prolonged, uninterrupted sitting may be associated with altered cardiometabolic risk due to low energy expenditure, reduced insulin activity, and reduced skeletal muscle activity.50
Among identified risk factors, high waist circumference was significantly associated with a high prevalence of diabetes among civil servants working in offices. This result is also similar to the results of various studies.16,17,36,44
A healthy diet/serving ≥5 servings per week and good knowledge were found to protect office workers from diabetes. Consuming ≥5 servings of fruits and vegetables per week has been proven to prevent the risk of developing diabetes. Although this study is similar to another previous finding.17,51 This is consistent with a study of metabolic syndrome in working adults in eastern Ethiopia.51 Consuming at least 400g or five servings of fruit and vegetables per day reduces the risk of non-communicable diseases and contributes to adequate daily fiber intake. Consumption of fruits and vegetables can be improved by always including vegetables in meals, eating fresh fruits and raw vegetables as a snack, eating fresh fruit and seasonal vegetables and eating a variety of fruits and vegetables.52
Various evidence also shows that the consumption of fruits and vegetables provides fiber and other essential nutrients that reduce the risk of metabolic syndrome.53 In addition, fruits and vegetables have significant antioxidant effects that reduce the risk of metabolic syndrome by removing reactive oxygen and reducing low-density lipoproteins.54
A high level of knowledge about the protection of the ministerial decree was found among public servants employed in the office. This finding was consistent with conflicting evidence.55,56 This may be because informed people can protect themselves from risk factors. It is clear that as individuals become more knowledgeable, they tend to participate in health education campaigns or watch media such as television to obtain information.
MOH/policymakers shall incorporate screening criteria being civil servants who work in the office irrespective of age by considering as a vulnerable group. For researchers: Shall work on a large-scale study involving government employees to determine the burden of DM at the national level among office workers. Health professionals shall be better educated on the modifiable risk factors of DM. Such as encouraging physical activity, healthy eating, reduction of central obesity, and other risk factors, including early screening of DM by preparing key messages that target office workers. For sectors: Shall better facilitate and collaborate in fulfillment, adjustment, collaborate in reduction of occupational risk related to being physically inactive, by encouraging, and availing facilities for physical exercises, screening, and through collaborating for health sector activity. For the participants who work in the office: Shall be better to contact the health facility and adhere to their advice. As for lifestyle changes.
Here are some things you can do to help keep under control or reduce your health risks: make healthy food choices (eat lots of fruits, vegetables, whole grains, and low-fat dairy products. Limit the amount of meat and fried or fatty foods that you eat), be active (walk, garden, or do something active for 30 minutes or more on most days of the week), lose central obesity (being overweight increases the risk of many health problems), avoid alcohol (alcohol can increase blood sugar and blood pressure) and controlling your blood pressure is just as important as controlling your blood sugar.
Strengths and Limitations of the Study
The strength of the study lies in its novelty in providing information on the overall prevalence of diabetes, particularly among civil servants; due to the lack of information on diabetes, the relatively high response rate, and the use of standard instruments (WHO phase survey).
However, this study is not without limitations. The study focused on sector offices, and the results may not apply to all government employees or to those who work outside the office. The study failed to include key factors such as diglycerol (hyperlipidemia) as a factor, despite using a known factor to diagnose diabetes and only using a blood sugar test that did not differentiate between types of diabetes.
Conclusions
The prevalence of DM among civil servants who work at the office level was significantly high as compared to the national level prevalence among the adult community as indicated by EPHI (2016) and IDF (2022).
The prevalence of DM among office workers was high and is associated with lifestyle, family history, hypertension, abdominal obesity, moderate-intensity activity, dietary practices, and knowledge about DM. However, most of the factors are modifiable risk factors. Therefore, arranging regular screening programs at the workplace and promotion of healthy diet, exercise, and awareness creation are needed to lower the prevalence.
Abbreviations
ADA, America Diabetes Association; AOR, adjusted odd ratio; BMI, body mass index; COR, crude odd ratio; CI, confidence interval; DM, diabetes mellitus; IDFA, International Diabetes Federation Association; IDF, International Diabetes Federation; NCD, non-communicable disease; STEPS, stepwise approach to surveillance; T2DM, Type 2 diabetes mellitus.
Data Sharing Statement
The data sets used and/or analyzed in this study are available from the corresponding author and can be sent upon reasonable request.
Acknowledgments
We thank the staff of Mizan Tepi University, Mizan Aman College of Health Sciences, and the staff of the Administrative Sector of Mizan Aman and Bench Sheko zone for facilitating data collection. Our thanks also go to the data collectors and supervisors, without whom this study would not be possible.
Author Contributions
All authors made a significant contribution to the work reported, from the conception, study design, execution, acquisition of data, analysis, and interpretation, or in all these areas; took part in drafting, revising, and critically reviewing the article; gave final approval of the version to be published; have agreed on the journal to which the article has been submitted; and agree to be accountable for all aspects of the work.
Funding
This study was funded by Mizan Aman Health Science College. The funding agency had no role in study design, data collection and analysis, data interpretation, or writing of the manuscript.
Disclosure
The authors declare that there are no competing interests.
References
1. Petersmann A. German clinical practice guidelines, definition, classification and diagnosis of diabetes mellitus. Exp Clin Endocrinol Diabetes. 2019;127(Suppl 1):s1–s7.
2. Association AD. Diagnosis and classification of diabetes mellitus. Diabetes Care. 2011;34(Supplement 1):s62–s9. doi:10.2337/dc11-S062
3. World Health Organization. Diagnosis and Management of Type 2 Diabetes (HEARTS-D). Geneva: World Health Organization; 2020.
4. IDF. Diabetes atlas. IDF; 2021.
5. World Health Organization. Global Report on Diabetes. France: World Health Organization; 2016.
6. Xiling Lin YX, Xu Y, Pan X, et al. Global, regional, and national burden and trend of diabetes in 195 countries and territories: an analysis from 1990 to 2025. Sci Rep. 2020;10(1):14790. doi:10.1038/s41598-020-71908-9
7. Zimmet PZ, Magliano DJ, Herman WH, Shaw JE. Diabetes: a 21st century challenge. Lancet Diabetes Endocrinol. 2014;2(1):56–64. doi:10.1016/S2213-8587(13)70112-8
8. IDF. IDF Diabetes Atlas. Brussels, Belgium: IDF; 2015.
9. Members IA. Prevalence of DM. IDF; 2022.
10. World Health Organization. Global report on diabetes; 2016.
11. EPHI. Ethiopia STEPS Report on Risk Factors for Non-Communicable Disease and Prevalence of Selected NCDs. Addis Abeba: Ethiopian Public Health Institute; 2016.
12. FDRE-MOH. Guidelines on Clinical and Programmatic Management of Major Non Communicable Diseases. Addis Ababa: FMOH; 2016.
13. Shiferaw F, Letebo M, Misganaw A, et al Non-communicable diseases in Ethiopia: disease burden, gaps in health care delivery and strategic directions. Ethiop J Health Dev. 2018;32(3).
14. Dereje N, Earsido A, Temam L, Abebe A. Prevalence and associated factors of diabetes mellitus in Hosanna Town, Southern Ethiopia. Ann Glob Health. 2020;86(1). doi:10.5334/aogh.2663
15. Zekewos A, Loha E, Egeno T, et al. Prevalence of diabetes mellitus and associated factors in Southern Ethiopia: a Community Based Study. Ethiop J Health Sci. 2018;28(4):451. doi:10.4314/ejhs.v28i4.11
16. Megerssa Y, Gebre M, Birru S, Goshu A, Tesfaye D. Prevalence of undiagnosed diabetes mellitus and its risk factors in selected institutions at Bishoftu Town, East Shoa, Ethiopia. J Diabetes Metab. 2013;s12.
17. Ayana DA, Bacha YD, Roba KT, Kebede DA. Type 2 diabetes mellitus among government employees in Harar, Eastern Ethiopia: a cross-sectional study. Res Rep Endocr Disord. 2015;5:71–77.
18. Utura T, Fikrie A. Prevalence and associated factors of diabetes mellitus among governmental civil servants at Guji Zone, Oromia Region, Ethiopia, 2021 A community-based cross-sectional study. PLoS One. 2022;17(4):1.
19. BSZHD. Annual performance report. Bench Sheko zone health department; 2021.
20. World Health Organization. The STEPS Instrument and Support Materials. Geneva: World Health Organization; 2014.
21. World Health Organization. The WHO STEPwise Approach to Noncommunicable Disease Risk Factor Surveillance. Geneva: WHO; 2017.
22. Kassahun CW, Mekonen AG. Knowledge, attitude, practices and their associated factors towards diabetes mellitus among non diabetes community members of Bale Zone administrative towns, South East Ethiopia. A cross-sectional study. PLoS One. 2017;12(2):e0170040. doi:10.1371/journal.pone.0170040
23. Alaofè H, Hounkpatin WA, Djrolo F, Ehiri J, Rosales C. Knowledge, attitude, practice and associated factors among patients with type 2 diabetes in Cotonou, Southern Benin. BMC Public Health. 2021;21(1):339. doi:10.1186/s12889-021-10289-8
24. Alemayehu AM, Sisay MM. Attitude towards diabetes mellitus among adult communities in Gondar city, Ethiopia. PLoS One. 2021;16(5):e0251777. doi:10.1371/journal.pone.0251777
25. World Health Organization. Global Database on Body Mass Index. Geneva: World Health Organization; 2010.
26. IDF. IDF Diabetes Atlas. Geneva: WHO; 2017.
27. Ayele BH, Roba HS, Beyene AS, et al. Prevalent, uncontrolled, and undiagnosed diabetes mellitus among urban adults in Dire Dawa, Eastern Ethiopia: a population based cross-sectional study. SAGE Open Med. 2020;8(1–11):2050312120975235.
28. Association AD. Standards of medical care in diabetes--2013. Diabetes Care. 2013;36 Suppl 1(Suppl 1):S11. doi:10.2337/dc13-S011
29. World Health Organization. Classification of Diabetes Mellitus. Geneva: WHO; 2019.
30. Association AD. Classification and diagnosis of diabetes: standards of medical care in diabetes. Diabetes Care. 2021;44(sup.1):1.
31. Demilew YM, Firew BS. Factors associated with noncommunicable disease among adults in Mecha district, Ethiopia: a case control study. PLoS One. 2019;14(5):e0216446. doi:10.1371/journal.pone.0216446
32. CDC. Physical Activity Guidelines for Americans 2nd Edition. U.S. Department of Health and Human Services; 2018.
33. Aravindalochanan V, Kumpatla S, Rengarajan M, Rajan R, Viswanathan V. Risk of diabetes in subjects with sedentary profession and the synergistic effect of positive family history of diabetes. Diabetes Technol Ther. 2014;16(1):26–32. doi:10.1089/dia.2013.0140
34. Amsalu TW, Habtamu MB, Dagninet DA, et al. Undiagnosed Diabetes Mellitus and related factors in East Gojjam (NW Ethiopia) in 2016: a community-based study. J Public Health Res. 2017;6(834):1.
35. World Health Organization. Waist Circumference and Waist-Hip Ratio Report of a WHO Expert Consultation. Geneva: World Health Organization; 2008.
36. Tariku Tesfaye T, Shikur B, Shimels T, et al. Prevalence and factors associated with diabetes mellitus and impaired fasting glucose level among members of federal police commission residing in Addis Ababa, Ethiopia. BMC Endocr Disord. 2016;16(1):68. doi:10.1186/s12902-016-0150-6
37. Aynalem SB, Zeleke AJ. Prevalence of diabetes mellitus and its risk factors among individuals aged 15 years and above in Mizan-Aman Town, Southwest Ethiopia, 2016: a cross Sectional Study. Hindawi Int J Endocrinol. 2016;2016:7.
38. Moyce S, Hernandez K, Schenker M. Diagnosed and undiagnosed diabetes among agricultural workers in California. J Health Care Poor Underserved. 2019;30(4):1289–1301. doi:10.1353/hpu.2019.0102
39. Endris TW, Worede A, Asmelash D. Prevalence of diabetes mellitus, prediabetes and its associated factors in Dessie Town, Northeast Ethiopia: a Community-Based Study. Diabetes Metab Syndr Obes. 2019;12:2799–2809. doi:10.2147/DMSO.S225854
40. Asmelash DAa D, Asmelash Y. The burden of undiagnosed diabetes mellitus in adult African population: a systematic review and meta-analysis. Hindawi J Diabetes Res. 2019;2019:1–8. doi:10.1155/2019/4134937
41. Bazie GW, Adimassie MT. Modern health services uti lization and associated factors in North East Ethiopia. PLoSOne. 2017;12(9):e0185381.
42. Gebremariam LW, Chiang C, Yatsuya H. Non-communicable disease risk factor profile among public employees in a regional city in northern Ethiopia. Sci Rep. 2018;8(1):9298. doi:10.1038/s41598-018-27519-6
43. Olawuyi AT, Adeoye IA. The prevalence and associated factors of non communicable disease risk factors among civil servants in Ibadan, Nigeria. PLoS One. 2018;13(9):e0203587.
44. Byberg SB, Bundesen C, Rudolf F, et al. Diabetes in urban Guinea-Bissau; patient characteristics, mortality and prevalence of Undiagnosed dysglycemia. Global Health Action. 2020;13(1):1802136. doi:10.1080/16549716.2020.1802136
45. Agu U, Agu MC, Nnaji GA. Assessment of risk of developing diabetes mellitus among local government employees in Onitsha, south-eastern Nigeria. Epidemiol Rep. 2015;33(4):1.
46. Goodyear LJ, Kahn BB. Exercise, glucose transport, and insulin sensitivity. Annu Rev Med. 1998;49(1):235–261. doi:10.1146/annurev.med.49.1.235
47. Nam JY, Kim J, Cho KH, et al. Associations of sitting time and occupation with metabolic syndrome in South Korean adults: a cross-sectional study. BMC Public Health. 2016;16(1):943. doi:10.1186/s12889-016-3617-5
48. Chini LSN, Greffin S, Lugon JR, et al. Prevalence of metabolic syndrome among workers from the company of generation and distribution of energy in Rio de Janeiro, Brazil. Cad Saude Publica. 2014;22(4):359–364. doi:10.1590/1414-462X201400040009
49. Kim KS, Kim SJ, Kim S, et al. Association of self-reported sedentary time with insulin resistance among Korean adults without diabetes mellitus: a cross-sectional study. BMC Public Health. 2018;18(1):1335. doi:10.1186/s12889-018-6237-4
50. Dunstan DW, Kingwell BA, Larsen R, et al. Breaking up prolonged sitting reduces postprandial glucose and insulin responses. Diabetes Care. 2012;35(5):976–983. doi:10.2337/dc11-1931
51. Motuma A, Gobena T, Teji Roba K, et al. A metabolic syndrome among working adults in Eastern Ethiopia. Diabetes Metab Syndr Obes. 2020;13:4941–4951. doi:10.2147/DMSO.S283270
52. World Health Organization/FAO. Diet, Nutrition and the Prevention of Chronic Diseases: Report of a Joint WHO/FAO Expert Consultation. Geneva: World Health Organization; 2003.
53. Lee M, Lim M, Kim J, et al. Fruit and vegetable consumption and the metabolic syndrome: a systematic review and dose–response meta-analysis. Br J Nutr. 2019;122(7):723–733. doi:10.1017/S000711451900165X
54. Lim M, Kim J. Association between fruit and vegetable consumption and risk of metabolic syndrome determined using the Korean Genome and Epidemiology Study (KoGES). Eur J Nutr. 2019;2019:1–12.
55. Demaio AR, Otgontuya D, de Courten M, et al. Exploring knowledge, attitudes and practices related to diabetes in Mongolia: a national population-based survey. BMC Public Health. 2013;13(1):236. doi:10.1186/1471-2458-13-236
56. Maretha le Roux ML, Walsh C, Reid M, et al. Diabetes-related knowledge, attitude and practices (KAP) of adult patients with type 2 diabetes mellitus in the Free State province, South Africa. South Afr J Clin Nutr. 2019;32(4):83–90. doi:10.1080/16070658.2018.1468536
 © 2024 The Author(s). This work is published and licensed by Dove Medical Press Limited. The full terms of this license are available at https://www.dovepress.com/terms.php and incorporate the Creative Commons Attribution - Non Commercial (unported, v3.0) License.
By accessing the work you hereby accept the Terms. Non-commercial uses of the work are permitted without any further permission from Dove Medical Press Limited, provided the work is properly attributed. For permission for commercial use of this work, please see paragraphs 4.2 and 5 of our Terms.
© 2024 The Author(s). This work is published and licensed by Dove Medical Press Limited. The full terms of this license are available at https://www.dovepress.com/terms.php and incorporate the Creative Commons Attribution - Non Commercial (unported, v3.0) License.
By accessing the work you hereby accept the Terms. Non-commercial uses of the work are permitted without any further permission from Dove Medical Press Limited, provided the work is properly attributed. For permission for commercial use of this work, please see paragraphs 4.2 and 5 of our Terms.