
Back to Journals » Journal of Asthma and Allergy » Volume 19
Prevalence and Patterns of Allergen Sensitization in Southern China: A Retrospective Analysis of 18,777 Routine Checkup Participants in Shenzhen
Authors Xu L, Wu C, He J, Du W, Li Y
Received 25 March 2026
Accepted for publication 23 June 2026
Published 15 July 2026 Volume 2026:19 610904
DOI https://doi.org/10.2147/JAA.S610904
Checked for plagiarism Yes
Review by Single anonymous peer review
Peer reviewer comments 2
Editor who approved publication: Dr Luis Garcia-Marcos
Linlin Xu,1 Changmeng Wu,1 Juan He,2,3 Wenhan Du,1 Yu Li1
1Department of Clinical Medical Laboratory, Peking University Shenzhen Hospital, Shenzhen, Guangdong, People’s Republic of China; 2Department of Rheumatology and Immunology, Peking University Shenzhen Hospital, Shenzhen, Guangdong, People’s Republic of China; 3Shenzhen Key Laboratory of Immunity and Inflammatory Diseases, Shenzhen, Guangdong, People’s Republic of China
Correspondence: Yu Li, Department of Clinical Medical Laboratory, Peking University Shenzhen Hospital, No. 1120 Lianhua Road, Futian, Shenzhen, Guangdong, 518036, People’s Republic of China, Email [email protected]
Purpose: The distribution of allergens exhibits significant geographic variation. Local epidemiological studies are essential for understanding allergic sensitization patterns, which may inform regional epidemiological reference. This study aimed to investigate the sensitization patterns among a routinely screened population in Shenzhen, a coastal metropolis in southeastern China.
Patients and Methods: A total of 18,777 participants undergoing routine health examinations were included. Serum-specific IgE (sIgE) levels against 19 allergens (10 inhalant and 9 food allergens) were measured using an immunoblot assay. The prevalence of sensitization was analyzed across gender, age groups, and seasons.
Results: Among 18,777 participants, overall sIgE positivity was 24.4%. Inhalant allergens (21.7%) were more common than food allergens (6.7%). House dust mite (17.7%), crab (3.5%), cat dander (2.9%) and cockroach (2.7%) were the most prevalent. An 12-allergen panel was able to detected 99% of sensitized individuals in this population. Males showed significantly higher sensitization rates than females (P < 0.05). Inhalant sensitization decreased with age, whereas food sensitization remained relatively stable Seasonal variations were significant for tree, common ragweed, mutton, and house dust (all P < 0.05). Poly-sensitization was observed in 32.5% of sensitized individuals. Strong positive correlations formed four distinct allergen modules.
Conclusion: House dust mite, crab, and cat dander are major allergens in Shenzhen. Sensitization patterns vary significantly by gender, age, and season. Seafood sensitization is more common in younger adults, while peanut sensitization increases in older adults.
Keywords: allergen sensitization, epidemiology, specific IgE, population-based
Introduction
Allergic diseases have become a global health concern, with epidemiological studies estimating that 22% of the population worldwide may suffer from at least one allergic condition.1 A previous study evaluated that 60 million people in the United States were affected by allergic rhinitis annually, including 10–30% of adults and 40% of children based on self-reported data.2 In China, a cross-sectional study covering ten provinces reported that 4.2% of adults aged 20 and above (equivalent to 45.7 million people) had asthma.3 This escalating trend, particularly prominent in rapidly developing nations, imposes substantial medical, social, and economic burdens.4,5 Notably, allergen sensitization—the state in which the body produces allergen-specific IgE upon allergen exposure—is the established precursor of clinical allergic diseases. Therefore, understanding the distribution of allergens can facilitate population-level risk assessment and public health planning for regional populations. Furthermore, the “allergen repertoire” of a population is highly diverse due to the variations in climate, geography, genetics, and dietary habits.6 Such geographic heterogeneity underscores the need for localized allergen profiles to guide screening strategies. While a large number of studies have characterized allergen distribution across regions,7,8 most existing epidemiologic data are derived from symptomatic patient cohorts seeking clinical care.9–11 These data are limited in reflecting the baseline sensitization status of the general population. In contrast, participants attending routine check-ups are largely asymptomatic and cover diverse ages, genders, and health statuses, which can well represent the general local urban population. This allows us to obtain a less biased, more generalizable sensitization profile of the broader community, rather than only data from symptomatic patients.
Moreover, the existing allergen panels, primarily developed for western populations12,13 may fail to capture region-specific allergens. Therefore, a clear understanding of local sensitization patterns is critical to develop simplified, cost-effective screening tools that match regional epidemiological features. In this context, serum allergen-specific Immunoglobulin E (sIgE) test, which is rapid and easy to perform, is widely recognized as the standard method for identifying individual sensitization to specific allergens.
Shenzhen, a large coastal city in southern China with a subtropical climate and a diverse urban population, faces a growing burden of allergic diseases alongside rapid urbanization. We analyzed sIgE test results from 18,777 health-check participants to characterize the sensitization patterns of common inhalant and food allergens in this population. We also built an optimized allergen screening panel tailored to local features, which can identify 99% of allergen-sensitized individuals and support cost-effective population screening. These findings provide true prevalence of sensitization in southern China and offer a model for other high-density urban populations facing similar environmental transitions.
Materials and Methods
Study Population
Participants were included if they completed a routine health checkup between January 2021 and July 2024 in Peking University Shenzhen Hospital and requested serum-specific IgE testing for health-screening purposes. Individuals with incomplete laboratory data, missing demographic information, or duplicate data were excluded. No additional exclusion criteria related to allergic symptoms were applied. To investigate allergen distribution across different age groups, individuals were divided into six groups (Table 1): ≤20 years (157, 0.84%), 20–29 years (1883, 10.03%), 30–39 years (5322, 28.34%), 40–49 years (5528, 29.44%), 50–59 years (3973, 21.16%), ≥60 years (1914, 10.19%). For seasonal analysis, participants were grouped according to the local climate and the time of testing: Spring (March–May), Summer (June–August), Autumn (September–November), and Winter (December–February). The study followed the Declaration of Helsinki and was approved by the Committee of Peking University Shenzhen Hospital (2024–090). Informed consent was waived because the study involved only anonymized laboratory data after routine clinical testing. Patient confidentiality was strictly maintained, and all data were anonymized prior to analysis.
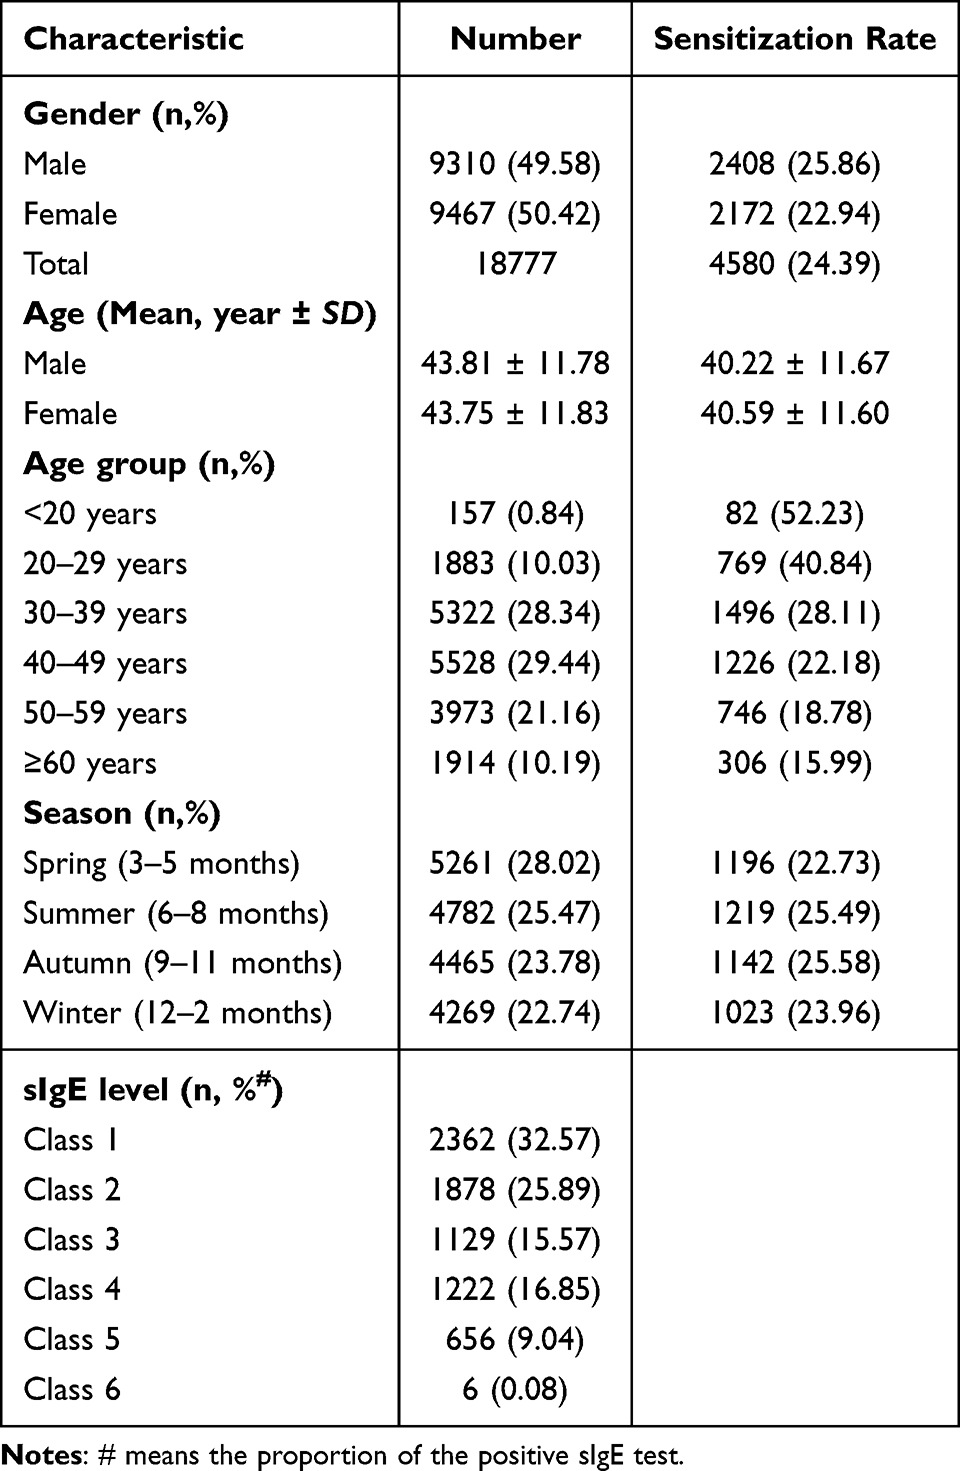 |
Table 1 Baseline Characteristics of 18,777 Physical Examination Participants in Shenzhen |
Allergen Testing
The Enzyme-Allergen-Sorbent test (EUROIMMUN, Luebeck, Germany), an immunoblot assay, was used to semi-quantitatively detect allergen-specific immunoglobulin E (IgE) in human serum. Serum-specific IgE (sIgE) measurements were performed using the EUROLINE Atopy China (IgE) kit on the automated EUROBlotMaster.
The tested allergens included 10 inhaled allergens: tree mix (willow, poplar, elm), common ragweed, mugwort, house dust mite mix (Der.pteronyssinus/Der.farinae), house dust, cat dander, dog epithelium, cockroach, mould mix (Penicillium not., Cladosporium her., Aspergillus fum., Alternaria alt)., hop; along with 9 food allergens as follows: egg white, cow’s milk, peanut, soybean, beef, mutton, shrimp, crab and sea fish mix (codfish, lobster, scallop).
According to the manufacturer’s instructions, the test strip results were divided into six classes base on the concentration: Class 1: ≥0.35 kUA/L to <0.70 kUA/L; Class 2: ≥0.70 kUA/L to <3.50 kUA/L; Class 3: ≥3.50 kUA/L to <17.50 kUA/L; Class 4: ≥17.50 kUA/L to <50.00 kUA/L; Class 5: ≥50.00 kUA/L to <100.00 kUA/L; and Class 6: ≥100.00 kUA/L. The sIgE level of ≤0.35 kUA/L (Class 0) was defined as negative reactivity.
Statistical Analysis
All statistical analyses were performed using the IBM SPSS Statistics version 26. (SPSS Inc., Chicago, IL, USA) and GraphPad Prism 9 software. Chi-squared test or Fisher’s exact probability method was used to determine the between-group differences of numerical data. Multivariate logistic regression was applied to adjust sensitization differences and Bonferroni method was used to adjust P values for multiple pairwise comparisons. P < 0.05 was considered statistically significant. Spearman correlation analysis was employed to explore potential correlations between various allergens.
Results
Demographic Characteristics of the Study Population
A total of 18,777 participants were enrolled from the routine examination center of Peking University Shenzhen Hospital (Table 1). This population comprised 9310 males (49.58%) with a mean age of 43.81±11.78 years and 9467 females (50.42%) with a mean age of 43.75±11.83 years. Overall, 24.39% of participants presented positive sIgE results. The highest sensitization rates occurred in the age groups of <20 years and 20–29 years, at 52.23% and 40.84%, respectively, which were substantially higher than rates in other age groups. Additionally, sensitization rate was negatively correlated with age, gradually decreasing with increasing age. Seasonal analysis also revealed slightly higher sensitization rates in summer and autumn relative to spring and winter. Furthermore, an inverse relationship was observed between allergen rank and detection frequency, with higher-grade allergens exhibiting a lower prevalence.
Prevalence Distribution of 19 Allergens Among Study Participants
Of 18,777 total participants, 4580 (24.39%) were sensitized to at least one of the tested allergen (Supplementary Table S1). Sensitization to inhalant allergens was relatively prevalent (4067, 21.66%) compared with food allergens (1263, 6.73%). The most common inhalant allergens among study participants were house dust mite mix (3322, 17.69%), cat dander (551, 2.93%) and cockroach (503, 2.68%). For food allergens, the highest sIgE positivity was observed for crab (649, 3.46%), sea fish mix (207, 1.10%), and soybean (178, 0.95%) (Figure 1A). Moreover, further analysis of the sensitized population revealed that a panel for only 8 allergens—house dust mite, cockroach, crab, cat dander, tree mix, soybean, egg white, and mutton—could identify 95% of all sensitized cases. Extending the panel with four more items (sea fish mix, mugwort, mould mix, and house dust) to a total of 12 allergens increased the detection rate to 99% (Figure 1B). This optimized panel achieves a good balance between detection efficiency and cost-effectiveness.
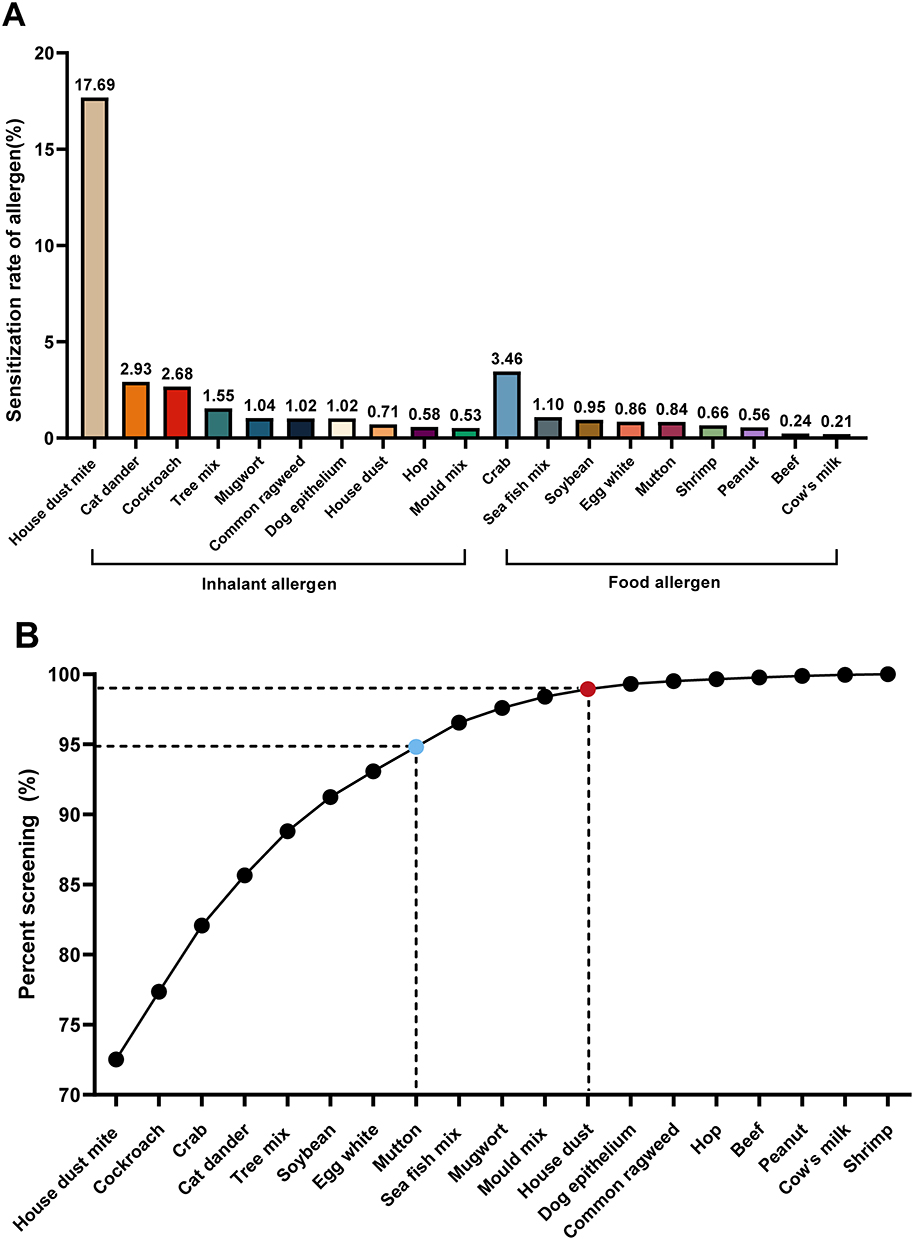 |
Figure 1 The prevalence distribution of the most common allergens. (A) Sensitization rates of 19 allergens among participants receiving routine medical examination (n = 18,777). (B) Coverage of optimized allergen screening panels. Blue dots represent panels detecting 95% of sensitized individuals, and red dots represent panels detecting 99% of sensitized individuals. |
Gender-Specific Distribution of 19 Allergens Among Study Participants
A total of 4580 participants were sensitized to at least one of the 19 allergens. Males had significantly higher overall sensitization rates for inhalant allergens (23.35% vs 20.00%) and food allergens (7.22% vs 6.24%) than females (P < 0.01, Supplementary Table S2). For individual allergens, males demonstrated significantly higher sensitization rates to house dust mite mix, cockroach, tree mix, common ragweed, mugwort, hop, mould mix, crab, sea fish mix, shrimp and peanut (P < 0.05, Figure 2). Conversely, females presented higher sIgE positivity for dog epithelium, egg white, mutton, beef and cow’s milk. Cat dander, house dust and soybean exhibited comparable sensitization levels between genders, with no statistically significant differences (P > 0.05).
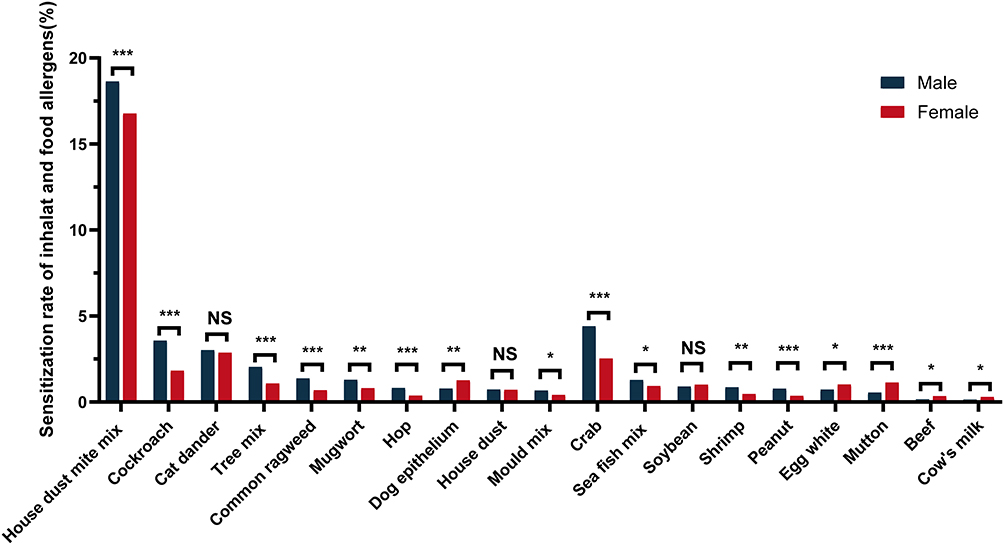 |
Figure 2 Allergen prevalence by gender in the study population. Asterisks denote statistical significant: *0.01 ≤ P < 0.05; **0.001 ≤ P < 0.01; ***P < 0.001. Abbreviation: NS, no significant difference. |
Allergen Sensitization Rates Across Different Age Groups
Our results showed that the positive rate of inhalant allergens declined with increasing age (Figure 3A). In contrast, the positive rate for food allergens was markedly higher in the <20 years group and remained relatively stable across other age groups (P < 0.01, Supplementary Table S3).
 |
Figure 3 The distribution of 19 allergens in different age groups among study population. (A) Sensitization rates of inhalant allergens (red circles), food allergens (yellow squares), and at least one allergen (blue triangles). (B) Sensitization rates of house dust mite (green triangles) and cat dander (Orange circles). (C) Sensitization rates of peanut (blue diamonds) and soybean (red triangles). (D) Sensitization rates of tree pollen mix (blue circles), crab (green squares), and egg white (orange triangles). (E) Sensitization rates of shrimp (pink circles) and sea fish mix (light blue triangles). (F) Sensitization rates of beef (gray diamonds), mutton (orange triangles), mould mix (blue circles), cow’s milk (yellow squares), dog epithelium (green circles), and house dust across age groups. Notes: “At least one allergen” refers to participants with positive sIgE results for any tested allergen. |
Except for common ragweed, mugwort, hop and cockroach, all other allergens exhibited significant age-related differences in distribution (P < 0.05). It can be described in terms of the following five characteristics: i. Sensitization to house dust mite and cat dander decreased gradually with age (Figure 3B); ii. Sensitization rates for peanut and soybean increased with advancing age (Figure 3C); iii. Tree mix, crab and egg white had the highest sensitization prevalence among participants aged <20 years, but showed a progressive increase in groups over 40 years old (Figure 3D); iv. Shrimp and sea fish mix showed the highest sensitization rate in the <20 years group, while rates remained similar across other age groups (Figure 3E); v. The 20–29 years age group had the highest prevalence of sensitization to beef, mutton, mould mix, cow’s milk, dog epithelium and house dust (Figure 3F).
Seasonal Distribution Patterns of 19 Allergens
A significant seasonal variation was observed for inhalant allergens, house dust mite, tree mix, common ragweed, house dust, food allergens, and mutton (Table 2). However, after Bonferroni-corrected post-hoc comparisons, food allergens and house dust mite mix showed no significant differences in sensitization rates across any pairwise seasonal comparisons (Supplementary Table S6 and Supplementary Figure S1, P > 0.05). Inhalant allergen sensitization was significantly higher in summer relative to spring. Tree mix increased in autumn compared with winter, while common ragweed prevalence was elevated in summer and autumn. House dust sensitization peaked in summer, with lower rates in autumn and winter. As the only food allergen with seasonal variation, mutton sensitization was higher in autumn but declined in spring and winter (all P < 0.05).
 |
Table 2 Prevalence of Inhalant and Food Allergens Across Seasons in the Study Population |
Characteristics of the sIgE Level Distribution and Correlation Analysis
Approximately 60% observed positive sIgE responses were predominantly confined to low levels of sIgE reactivity (Class1–2, Table 1 and Figure 4A). However, medium-to-high sIgE reactivity levels (Class ≥3) were detected in approximately 50% positive cases for certain allergens, including house dust mite (67.0%, 2225 cases), dog epithelium (55.5%, 106 cases), and cat dander (43.9%, 242 cases). Intriguingly, house dust mite was the only allergen that induced class 6 sIgE responses. Meanwhile, no high-level sIgE responses (Class 5–6) were detected to peanut, egg white, hop, mold, beef, house dust, cow’s milk, or cockroach in the routine screening population (Supplementary Table S4).
 |
Figure 4 The distribution of sIgE levels and correlation analysis for the 19 allergens. (A) Characteristics of sIgE levels distribution among sensitized participants. (B) Correlation analysis of co-sensitization across the 19 allergens. The correlation coefficient of r ≥ 0.5 indicates a moderate or strong correlation; r < 0.5 signifies a weak or no correlation. |
Among the 4580 sensitized individuals, 3092 (67.51%) were sensitized to a single allergen, while 1488 (32.49%) showed polysensitization (≥2 allergens), including 169 (3.69%) subjects with sensitization to five or more allergens (Supplementary Table S5). So we conducted a correlation analysis among the 19 allergens, as illustrated in Figure 4B. The results revealed a wide range of positive correlations among the 19 allergens. Stronger correlation (r > 0.5, P < 0.001) were primarily concentrated in four specific “allergen modules”: (i) Tree-Grass pollen (tree mix, hop and common ragweed); (ii) Peanut-Plant pollen (peanut, tree mix, hop, common ragweed); (iii) Mammalian milk-Meat (cow’s milk and beef); (iv) Seafood (shrimp and sea fish mix). In addition, weak correlation were observed between cat dander and dog epithelium, mugwort and plant pollen, shrimp and crab, peanut and mugwort, mutton and beef/cow’s milk, and dog epithelium and cow’s milk (r > 0.3, P < 0.001), whereas other allergens demonstrated weak or no correlation (r < 0.3, P < 0.01).
Discussion
Over recent decades, the global prevalence and economic burden of allergic diseases have risen significantly, with marked regional variations in dominant allergen types and sensitization rates.
Elucidating region-specific sensitization patterns through epidemiological studies is critical to understanding population-level immune responses and informing regional screening design. This study presents a comprehensive epidemiological analysis of allergen sensitization patterns in 18,777 health screening participants from Shenzhen, China. Our analysis reveals an overall sensitization prevalence of 24.39%, with statistically significant variations across gender groups, seasonal periods, and age groups. These results align with and expand upon existing literature14 while offering novel insights into the epidemiology of allergic sensitization in Southern China. Critically, sIgE positivity indicates sensitization rather than confirmed clinical allergy, reflecting population-level immune response in this routine checkup population.
Our findings demonstrate that house dust mite (17.69%), cat dander (2.93%), and cockroach (2.68%) were the predominant inhalant allergens, while crab (3.46%), sea fish (1.10%), and soybean (0.95%) were the most common food allergens. These results align with previous findings from western China, where house dust mite (13.38%), house dust (2.54%), and cockroach (2.08%) were the major inhalant allergens, and crab (6.24%), sea fish (6.16%), and shrimp (2.08%) were the primary food allergens. This consistency suggests similar allergen distribution patterns between southern and western China among general population. House dust mites are the predominant inhalant allergen in nearly all regions, including Asia,15 Europe16 and America,17 as previously reported. In China, the prevalence of dust mite allergy is higher in southern and coastal areas compared to northern and inland regions, which aligns with our study’s findings. This phenomenon may attribute to the subtropical monsoon climate, leading to the propagation of mites and cockroaches. Notably, sensitization rates to cat or dog dander is increasing recently,18 especially in China’s economically developed regions. An observational study reported that the sensitization rates to cat dander and dog hair were 11.30% and 13.94%, respectively,3 reflecting the growing popularity of household pets and changing lifestyles in China. In addition, we have established a novel allergen screening panel capable of detecting 99% of sensitized individuals in the general population. This locally optimized panel offers a cost-effective screening candidate for Shenzhen adults; external validation is needed before broader regional application.
Our study uncovered notable gender differences in allergen sensitization, with males exhibiting significantly higher overall rates for both inhalant (23.35% vs 20.00%) and food allergens (7.22% vs 6.24%). Several studies have reported that males have higher positive rate in allergens than females.19,20 This gender disparity may stem from occupational exposures, lifestyle factors, or hormonal influences on immune responses, as suggested by Bertelsen et al21 Age-stratified analysis revealed dynamic changes in allergen sensitization across different life stages. Overall, the sensitization rate of allergens decreases with age, wherein the sensitization to inhaled allergens gradually decreases, whereas the rate for food allergens remains relatively stable House dust mite sensitization exhibited a progressive decline with age,22 consistent with studies suggesting that early-life exposure may lead to immune tolerance over time.23 In contrast, peanut and soybean sensitization demonstrates a distinct age-related pattern among older adults, a phenomenon also noted in American adult populations.24 This trend is possibly due to a weakened intestinal barrier function or age-related declines in immune regulation.25 Moreover, the youngest participants (<20 years) had the highest sensitization rates to crab, shrimp, and sea fish mix, aligning with global observations that seafood allergies often manifest early in life.26,27 The higher prevalence of sensitization to beef, mutton, dog epithelium, cow’s milk, and house dust in younger age groups (<40 y) compared to older groups (>40 y) suggests potential cohort effects or lifestyle differences. These findings highlight age-related population-level immune response patterns.
The lower rate of sensitization to inhalant allergens in spring, relative to summer, is likely due to reduced exposure to seasonal aeroallergens such as pollen and mold spores.28 The elevated sensitization to tree and common ragweed in summer and autumn aligns with their pollination cycles.29 House dust exhibited highest positive rate in summer of the whole year, which aligns with the typical perception of increased exposure during that season. However, several clinical studies reported that a summer peak for house dust sensitization is uncommon, with most cities exhibiting peaks in autumn or winter.30,31 This discrepancy can be attributed to regional variations and differences in the study populations. Additionally, the significantly higher sensitization to house dust in summer suggests that indoor allergen exposure may peak during warmer months, possibly due to increased ventilation and outdoor allergen infiltration. These seasonal trends provide references for population-level public health prevention, informing general environmental control recommendations such as dust prevention measures in houses or workplaces, as well as seasonal health reminders for the general population.
The predominance of low-grade (Class 1–2) IgE reactivity suggests that many sensitized individuals may not exhibit severe clinical symptoms. House dust mite, dog epithelium, and cat dander elicited higher-grade responses (Class ≥3) in a significant subset of participants, indicating a greater risk for symptomatic allergic disease. However, it should be emphasized that the relationship between IgE reactivity and clinical allergic symptoms is not absolute.19 While these levels can serve as useful risk indicators, they must always be interpreted in conjunction with clinical manifestations and patient-specific factors.
Poly-sensitization (≥2 allergens) was observed in 32.49% of sensitized individuals, with 3.69% reacting to five or more allergens. The correlations within allergen modules could be established as due to cross-reactivity between allergens, co-sensitization, or molecular spreading.32,33 For instance, the correlation between peanut and tree/plant pollen may be due to several factors, including the presence of common allergenic epitopes in different but botanically close plant species, long-term exposures to close phylogenetic sources of allergens, and interactions of genetic and environmental factors.34 Moreover, the known cross-reactivity of bovine serum albumin and bovine γ-globulin which are present in both milk and beef is recognized. Epidemiological data indicate that approximately 13–20% of children with cow’s milk allergy are also allergic to beef, while over 90% of those with beef allergy are also allergic to cow’s milk.35 The seafood cluster likely stems from tropomyosin cross-reactivity, which has also been reported in other studies.36 These findings support the use of component-resolved diagnostics (CRD) to differentiate true co-sensitization from cross-reactivity for more accurate risk profiling.
This study benefits from a large, diverse sample size and a comprehensive allergen panel, enhancing its generalizability to urban populations in southern China. However, several limitations should be acknowledged. First, we only tested 19 types of allergens, so sensitization to other unmeasured allergens cannot be ruled out. Additionally, participants recruited from routine check-ups may under-represent individuals with severe allergic symptoms, resulting in potential selection bias. Second, in compliance with medical confidentiality principles, we have no access to participants’ clinical symptom information. Therefore, we cannot analyze the relationship between allergen sensitization and disease severity. It should also be emphasized that allergen sensitization does not equate to clinical allergy, and additional external validation is also needed before our findings can be applied to clinical practice. Future studies should incorporate longitudinal assessments and clinical evaluations to better understand the progression from sensitization to symptomatic allergy.
Conclusion
This study describes the population-level allergen sensitization landscape in Shenzhen, with distinct gender, age, and seasonal patterns. House dust mites remain the predominant allergen, while high prevalence of poly-sensitization and emerging patterns, including seafood sensitization in younger adults and peanut sensitization in older adults are observed. Notably, these findings provide epidemiological baseline data and population-level public health prevention references for southern China, supporting regional screening optimization. Future studies integrating clinical symptom data are required to explore the progression from sensitization to symptomatic allergic disease.
Data Sharing Statement
All data supporting the findings of this study are available within the paper and its Supplementary File.
Acknowledgments
Appreciate all participants for their contributions.
Author Contributions
All authors made a significant contribution to the work reported, whether that is in the conception, study design, execution, acquisition of data, analysis and interpretation, or in all these areas; took part in drafting, revising or critically reviewing the article; gave final approval of the version to be published; have agreed on the journal to which the article has been submitted; and agreed to be accountable for all aspects of the work.
Funding
This research is supported by the National Natural Science Foundation of China (No. 81903069), Shenzhen High-level Hospital Construction Fund, Peking University Shenzhen Hospital Scientific Research Fund and Medical Scientific Research Foundation of Guangdong Province (B2026745).
Disclosure
The authors report no conflicts of interest in this work.
References
1. Warner JO, Kaliner MA, Crisci CD, et al. Allergy practice worldwide: a report by the World Allergy Organization Specialty and Training Council. Int Arch Allergy Immunol. 2006;139(2):166–12. doi:10.1159/000090502
2. Meltzer EO, Blaiss MS, Naclerio RM, et al. Burden of allergic rhinitis: allergies in America, Latin America, and Asia-Pacific adult surveys.
3. Hu Z, Xue J, Pan M, et al. Prevalence of allergen sensitization among children with allergic rhinitis in Changzhou, China: a retrospective observational study. BMC Pediatr. 2023;23(1):466. doi:10.1186/s12887-023-04291-9
4. Li X, Xu X, Li J, et al. Direct and indirect costs of allergic and non-allergic rhinitis to adults in Beijing, China. Clin Transl Allergy. 2022;12(4):e12148. doi:10.1002/clt2.12148
5. Oh J, Kim S, Kim MS, et al. Global, regional, and national burden of asthma and atopic dermatitis, 1990–2021, and projections to 2050: a systematic analysis of the Global Burden of Disease Study 2021. Lancet Respir Med. 2025;13(5):425–446. doi:10.1016/S2213-2600(25)00003-7
6. Bhattacharya K, Sircar G, Dasgupta A, Gupta Bhattacharya S. Spectrum of allergens and allergen biology in India. Int Arch Allergy Immunol. 2018;177(3):219–237. doi:10.1159/000490805
7. Tanaka J, Fukutomi Y, Shiraishi Y, et al. Prevalence of inhaled allergen-specific IgE antibody positivity in the healthy Japanese population. Allergol Int. 2022;71(1):117–124. doi:10.1016/j.alit.2021.08.009
8. Kwong K, Chen Z, Scott L, Hilborne LH. Inhalant allergen sensitization: prevalence, risk factors, and geographic variation in the United States. Int Arch Allergy Immunol. 2025;187:148–159. doi:10.1159/000545508
9. Jo YH, Yoo HW, Kim SH, Kim YM, Kim HY. Clinical characteristics and treatment response of chronic spontaneous urticaria according to age: a single-center Korean study. Asian Pac J Allergy Immunol. 2022;40(4):374–378. doi:10.12932/AP-050719-0594
10. Yamamoto-Hanada K, Borres MP, Åberg MK, et al. IgE responses to multiple allergen components among school-aged children in a general population birth cohort in Tokyo. World Allergy Organ J. 2020;13(2):100105. doi:10.1016/j.waojou.2020.100105
11. Luo W, Huang H, Zheng P, et al. Major grass pollen allergens and components detected in a southern Chinese cohort of patients with allergic rhinitis and/or asthma. Mol Immunol. 2016;78:105–112. doi:10.1016/j.molimm.2016.08.013
12. Spolidoro GCI, Ali MM, Amera YT, et al. Prevalence estimates of eight big food allergies in Europe: updated systematic review and meta-analysis. Allergy. 2023;78(9):2361–2417. doi:10.1111/all.15801
13. Warren CM, Aktas ON, Manalo LJ, Bartell TR, Gupta RS. The epidemiology of multifood allergy in the United States: a population-based study. Ann Allergy Asthma Immunol. 2023;130(5):637–648.e635. doi:10.1016/j.anai.2022.12.031
14. Huang Z, Feng W, Wei W, Yang B, Wang L. Prevalence of food-allergen and aeroallergen sensitization among people in Sichuan, Western China: an 8-year observational study. J Clin Lab Analysis. 2019;33(3):e22723. doi:10.1002/jcla.22723
15. Tham EH, Lee AJ, Bever HV. Aeroallergen sensitization and allergic disease phenotypes in Asia. Asian Pac J Allergy Immunol. 2016;34(3):181–189. doi:10.12932/AP0770
16. Heinzerling L, Burbach G, Edenharter G, et al. GA2LEN skin test study I: GA2LEN harmonization of skin prick testing: novel sensitization patterns for inhalant allergens in Europe. Allergy. 2009;64(10):1498–1506. doi:10.1111/j.1398-9995.2009.02093.x
17. Salo PM, Arbes SJ, Jaramillo R, et al. Prevalence of allergic sensitization in the United States: results from the National Health and Nutrition Examination Survey (NHANES) 2005-2006. J Allergy Clin Immunol. 2014;134(2):350–359. doi:10.1016/j.jaci.2013.12.1071
18. Wang W, Wang J, Song G, et al. Environmental and sensitization variations among asthma and/or rhinitis patients between 2008 and 2018 in China. Clin Transl Allergy. 2022;12(2):e12116. doi:10.1002/clt2.12116
19. Sun B-Q, Zheng P-Y, Zhang X-W, Huang H-M, Chen D-H, Zeng G-Q. Prevalence of allergen sensitization among patients with allergic diseases in Guangzhou, Southern China: a four-year observational study. Multidisciplin Respir Med. 2014;9(1):2. doi:10.1186/2049-6958-9-2
20. Chang ML, Bing S, Liu YH, Li LL, Pei LC, Wang BY. Analysis of allergens in 5 473 patients with allergic diseases in Harbin, China. Biomed Environ Sci. 2013;26(11):886–893. doi:10.3967/bes2013.017
21. Bertelsen RJ, Instanes C, Granum B, et al. Gender differences in indoor allergen exposure and association with current rhinitis. Clin Exp Immunol. 2010;40(9):1388–1397. doi:10.1111/j.1365-2222.2010.03543.x
22. Amaral AFS, Newson RB, Abramson MJ, et al. Changes in IgE sensitization and total IgE levels over 20 years of follow-up. J Allergy Clin Immunol. 2016;137(6):1788–1795.e1789. doi:10.1016/j.jaci.2015.09.037
23. Yuan H, Chen J, Hu S, et al. Early life exposure to house dust mite allergen prevents experimental allergic asthma requiring mitochondrial H(2)O(2). Mucosal Immunol. 2022;15(1):154–164. doi:10.1038/s41385-021-00458-8
24. Gupta RS, Warren CM, Smith BM, et al. Prevalence and severity of food allergies among US adults. JAMA Network Open. 2019;2(1):e185630. doi:10.1001/jamanetworkopen.2018.5630
25. Azzolino D, Verdi L, Perna S, Baldassari I, Cesari M, Lucchi T. Food allergies in older people: an emerging health problem. World Allergy Organ J. 2024;17(9):100967. doi:10.1016/j.waojou.2024.100967
26. Marushko Y, Moskovenko O, Chmil A, Halushko B. Profile of sensitization to fish and seafood allergens in children with allergic conditions in different regions of Ukraine. Modern Pediatrics Ukraine. 2024;6:50–59. doi:10.15574/SP.2024.6(142).5059
27. Leung AS, Wai CY, Leung NY, et al. Real-world sensitization and tolerance pattern to seafood in fish-allergic individuals. J Allergy Clin Immunol. 2024;12(3):633–642.e639. doi:10.1016/j.jaip.2023.09.038
28. Huang Z, Li A, Zhu H, et al. Multicenter study of seasonal and regional airborne allergens in Chinese preschoolers with allergic rhinitis. Sci Rep. 2024;14(1):4754. doi:10.1038/s41598-024-54574-z
29. Zhao Z, Chen L, Huang C, et al. Allergen sensitization patterns in children with allergic rhinitis: insights from a four-year retrospective study in Shenzhen, China. BMC Pediatr. 2025;25(1):544. doi:10.1186/s12887-025-05885-1
30. Choi IS, Lee SS, Myeong E, Lee JW, Kim WJ, Jin J. Seasonal variation in skin sensitivity to aeroallergens. Allergy Asthma Immunol Res. 2013;5(5):301–308. doi:10.4168/aair.2013.5.5.301
31. Wang X, Zhou L, Wei G, Zhang H, Yang B. Prevalence of allergen-specific IgE in southern China: a multicenter research. Aging. 2021;13(14):18894–18911. doi:10.18632/aging.203341
32. Arlian L, Bernstein I, Vyszenski-Moher D, Gallagher J. Investigations of culture medium-free house dust mites: IV. Cross antigenicity and allergenicity between the house dust mites, Dermatophagoides farinae and D. pteronyssinus. J Allergy Clin Immunol. 1987;79(3):467–476. doi:10.1016/0091-6749(87)90364-2
33. Dezfouli SG, Mothes-Luksch N, Jensen AN, Untersmayr E, Kundi M, Jensen-Jarolim E. Linking cross-reactivity clusters of food and respiratory allergens in PAMD@ to asthma and duration of allergy. World Allergy Organ J. 2020;13(12):100483. doi:10.1016/j.waojou.2020.100483
34. Assarehzadegan M-A, Shakurnia A, Amini A. The most common aeroallergens in a tropical region in Southwestern Iran. World Allergy Organ J. 2013;6(1):1–7. doi:10.1186/1939-4551-6-7
35. Martelli A, De Chiara A, Corvo M, Restani P, Fiocchi A. Beef allergy in children with cow’s milk allergy; cow’s milk allergy in children with beef allergy. Ann Allergy Asthma Immunol. 2002;89(6):38–43. doi:10.1016/S1081-1206(10)62121-7
36. Luo W, Hu H, Tang W, et al. Allergen sensitization pattern of allergic adults and children in southern China: a survey based on real life data. Allergy Asthma Clin Immunol. 2019;15(1). doi:10.1186/s13223-019-0357-y
 © 2026 The Author(s). This work is published and licensed by Dove Medical Press Limited. The
full terms of this license are available at https://www.dovepress.com/terms
and incorporate the Creative Commons Attribution
- Non Commercial (unported, 4.0) License.
By accessing the work you hereby accept the Terms. Non-commercial uses of the work are permitted
without any further permission from Dove Medical Press Limited, provided the work is properly
attributed. For permission for commercial use of this work, please see paragraphs 4.2 and 5 of our Terms.
© 2026 The Author(s). This work is published and licensed by Dove Medical Press Limited. The
full terms of this license are available at https://www.dovepress.com/terms
and incorporate the Creative Commons Attribution
- Non Commercial (unported, 4.0) License.
By accessing the work you hereby accept the Terms. Non-commercial uses of the work are permitted
without any further permission from Dove Medical Press Limited, provided the work is properly
attributed. For permission for commercial use of this work, please see paragraphs 4.2 and 5 of our Terms.
Recommended articles
Alpha-Gal Syndrome: Often Hidden, Under-Recognized, and in Need of Attention—A Rapid Review
Thompson CC, Saracco B, Pruthi A, Cerceo E
International Journal of General Medicine 2025, 18:3477-3488
Published Date: 27 June 2025