Back to Journals » Journal of Multidisciplinary Healthcare » Volume 16
Prevalence and Factors Associated with Violence; Perceived Social Support and Health Access Among People with Disabilities in Rural Districts of Southern Ethiopia: Mixed Study
Authors Gebrekirstos LG ![]() , Lencha TT, Asgedom YS
, Lencha TT, Asgedom YS ![]() , Wube TB
, Wube TB
Received 26 July 2023
Accepted for publication 22 September 2023
Published 29 September 2023 Volume 2023:16 Pages 2921—2936
DOI https://doi.org/10.2147/JMDH.S432398
Checked for plagiarism Yes
Review by Single anonymous peer review
Peer reviewer comments 2
Editor who approved publication: Dr Scott Fraser
Lielt Gebreselassie Gebrekirstos,1 Tizita Tekle Lencha,2 Yordanos Sisay Asgedom,3 Tsiyon Birhanu Wube4,5
1Department of Maternity and Reproductive Health Nursing, College of Health Science and Medicine, Wolaita Sodo University, Wolaita Sodo, Ethiopia; 2School of Public Health, College of Health Science and Medicine, Wolaita Sodo University, Wolaita Sodo, Ethiopia; 3Department of Epidemiology, College of Health Science and Medicine, Wolaita Sodo University, Wolaita Sodo, Ethiopia; 4Department of Adult Health Nursing, Aksum University College of Health Science, Aksum, Northern Ethiopia; 5Health Science Education Development Center, St. Paul’s Hospital Millennium Medical College, Addis Ababa, Ethiopia
Correspondence: Lielt Gebreselassie Gebrekirstos, Email [email protected]
Background: Violence is a serious public health problem with far-reaching negative effects. The lack of data on disability-related violence obscures developing nations from taking the appropriate steps to mitigate it.
Objective: This study sought to assess the prevalence and associated factors of violence as well as perceived social support and health access among people with disabilities in Southern Ethiopia.
Methods: This cross-sectional, community-based mixed study was conducted from March 15 to May 15, 2022. Convenience sampling was used to recruit 645 participants. In-depth interviews were conducted with 12 participants. Descriptive statistics and multivariable logistic regression analyses were performed. Qualitative data were transcribed and translated verbatim and analyzed thematically.
Results: The total prevalence of any form of violence within the last year was 61.2%. Being female {AOR: 3.5; 95% CI: (1.61,7.47)}, having no formal education {AOR: 4.8; 95% CI: (1.18, 19.79)}, having a visual disability{AOR: 3.5; 95% CI: (1.61,7.43)}, strong reliance on others {AOR: 5.6; 95% CI: (1.34,23.55)}, and not joining any community group {AOR: 3.9; 95% CI: (1.36,11.35)}were associated with sexual violence. Being female {AOR: 1.9; 95% CI: (1.16, 3.04)}, having no formal education {AOR: 4.9 95% CI: (1.86, 7.78)}, and a low level of perceived social support {AOR: 3.0; 95% CI: (1.74, 5.32)} was associated with emotional violence. Belonging to the lower wealth index group {AOR: 5.4; 95% CI: (1.96, 15.16)} and reliance on others {AOR: 2.9; 95% CI: (1.54, 5.30)} were associated with physical violence. During a qualitative study there is a lack of social support and receiving wrong social support frequently, leading to isolation, depression, and violence. Additionally, access to transportation and health services is not user-friendly for such persons.
Conclusion: A significant proportion of people with disabilities experience violence. The finding highlight there is a need for capacity building particularly, for women with disabilities.
Keywords: violence, sexual violence, physical violence, emotional violence, disability
Introduction
According to a World Health Organization (WHO) report, people with disabilities (PWDs) make up some 15% of the world’s population, 80% of whom reside in low-income countries. It is also estimated that there are 15 million PWDs in Ethiopia, representing 17.6% of the total population.1 The prevalence of disability in Ethiopia is drastically rising owing to the increasing burden of disease and injury.2 The term “disability” comprises activity limitations an individual may have due to physical, mental, and health problems.3
Since PWDs are treated as less human, socially isolated, and dependent on others, and their concerns have been frequently disregarded, they have a 50% higher chance of having suffered violence and raising a threefold increased risk for people with mental disabilities.4–8 The pieces of literature also demonstrate that structural impediments make PWDs more vulnerable to violence.9,10 Such structural impediments include a lack of access to resources and support systems, lack of political consideration for violence in PWDs, inadequate training for service providers, lack of knowledge of existing services, and inaccessibility of services by PWDs.11,12
Violence plays a significant role in factors that impair the lives of PWDs.8 The aftereffects of violence are extreme and possibly lifelong, not only for victims, but also induce psychological trauma for the family, neighbors, and community.5,9 Sexual abuse frequently results in depression and even suicide.12 Since victims of rape cannot negotiate safe sex, they are more likely to contract STDs or HIV/AIDS.9,13
The global community pledges to leave no one behind, in the 2030 agenda. Governments must make sure that PWDs have the opportunity, information, and skills they need to live healthy, happy, and productive lives if they are to make this pledge a reality.12 The WHO emphasized the significance of additional research on violence against PWDs and pointed out a lack of data on this topic in low- and middle-income countries that enables responsible bodies to intervene appropriately.8
To the best of our knowledge, despite having increased disability and risk of violence in Ethiopia, evidence of the prevalence of violence and associated factors among PWDs is unknown in Southern Ethiopia, much alone in the research areas, since analogous studies have not been conducted on these vulnerable groups. This eminent lack of data on PWDs obscures the state of violence in this population, deterring political commitment and thorough public health engagement, particularly in Ethiopia. Thus, conducting this study was crucial, because PWDs have been left behind in research and interventions, and most importantly, more evidence on PWDs regarding violence is needed.
Materials and Methods
Study Setting, Period, and Design
A community-based cross-sectional mixed study was employed from March 15th -to -May 15, 2022, in the rural areas of the Wolaita and Dawro zones. The Wolaita zone has 22 districts, whereas the Dawro zone has 12 districts. Wolaita Sodo is the administrative capital of the Wolaita zone located 380 km south of Addis Ababa, whereas Tercha, the capital of the Dawro zone, is located 500 km far. About 88.3% and 92.9% of Wolaita zone and Dawro zone residents respectively were rural dwellers.14 According to the Labor and Social Affairs Office, more than 37,000 PWDs are residing in both zones.
Population
This study included adults aged ≥ 18 years with physical, hearing, and vision disabilities that live in the area for more than six months. Participants were identified by key informants, women development armies (WDAs), and health extension workers (HEWs) in each Woreda (the third level of the administrative divisions of Ethiopia- after zones and regional states), and some participants were invited while they were begging in the streets, churches, and mosques. To achieve this, we selected easily identifiable disabilities. Adults aged 18 years and above available during the study period and who lives in the area for more than six months were included in the study. Adults who were suffering from a serious illness or had a mental disability at the time the data were collected were not included in this study.
Study Variables and Measurement
The outcome variable of this study was violence that occurred within the last year that is sexual, physical, and emotional. The definition of violence was based on the WHO definition of violence.15 The explanatory variables were conceptualized based on previous studies16,17 [Table 1].
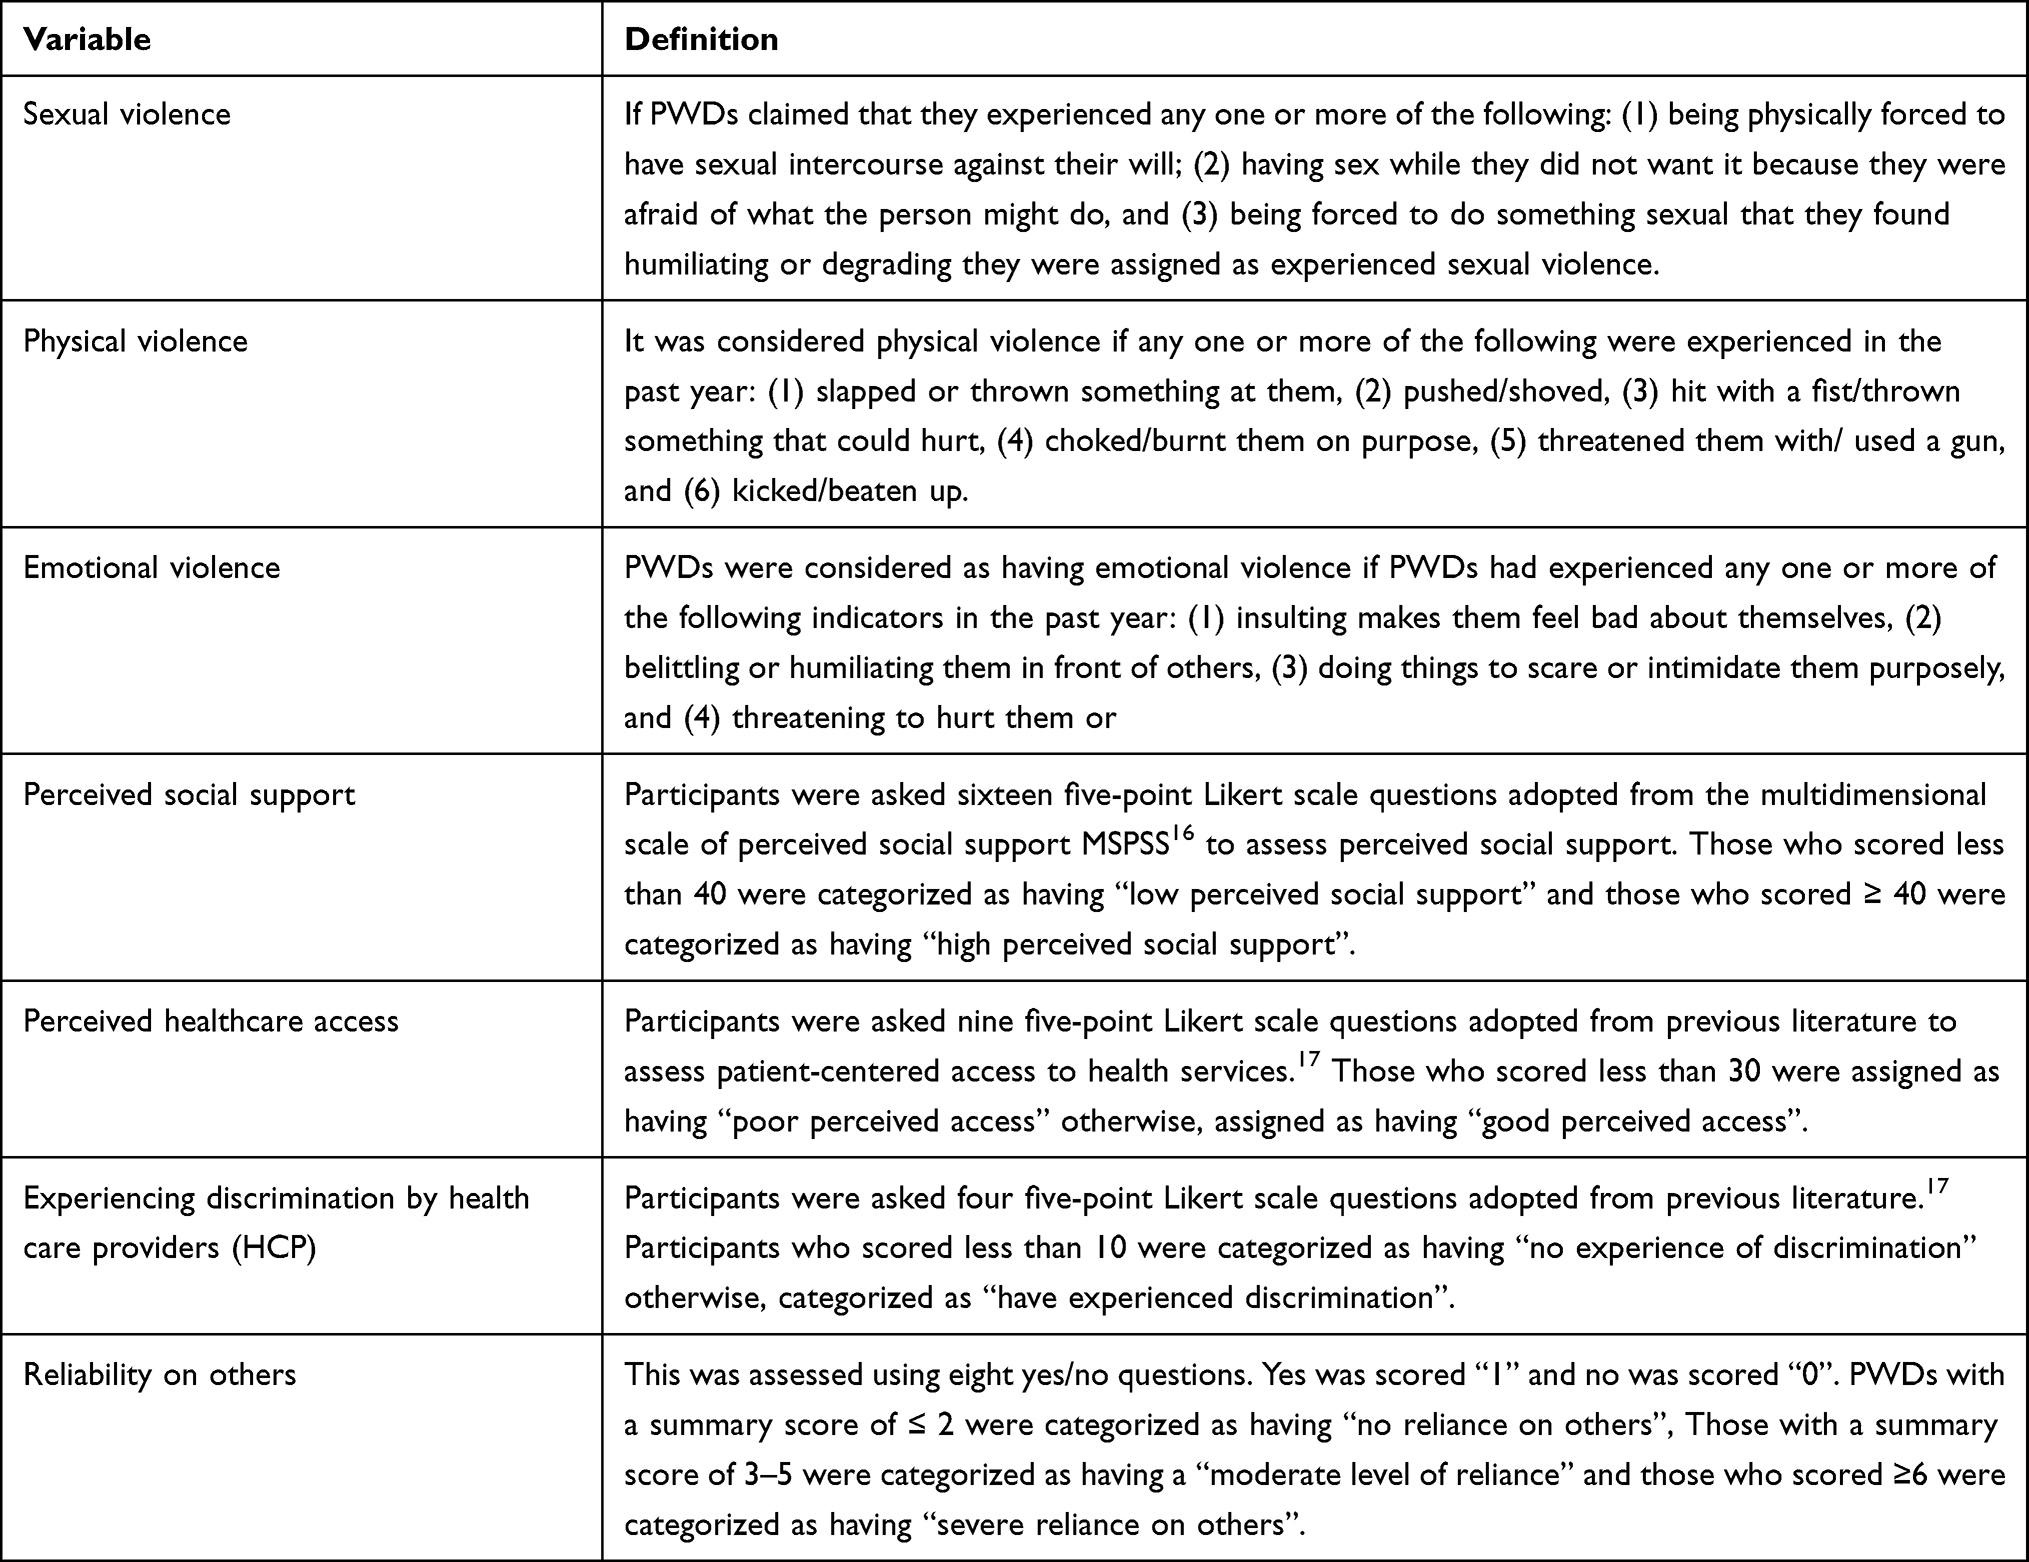 |
Table 1 Study Variables and Their Operational Definitions |
Sample Size and Sampling Procedure
To determine the sample size, the single population proportion formula was used with the 50% proportion of violence with a confidence interval of 95% and a 4% for margin of error, for the non-response, 10% of the sample was added. The final sample size was 660. A total of nine districts were selected using the lottery method. The proportional allocation of sample size was performed.
For the qualitative part, 12 in-depth interviews were conducted with PWDs who had experienced violence, identified during the quantitative survey. The sample size for in-depth interviews was guided by data saturation.
A total of nine districts, six districts from the Wolaita zone and three districts from the Dawro zone were selected using the lottery method. The proportional allocation of samples was performed for each district.
Source of Data and Data Collection Methods
An interviewer-administered structured questionnaire was used to collect data for the quantitative study [Supplementary Material 1]. After being written in English, the questionnaire was translated into the local language, and then back into English. The WHO Multi-country Study on Women’s Health and Domestic Violence against Women served as the basis for questions on our structured questionnaire to assess violence.15 The questionnaire was intended to incorporate different questions to assess socio-demographic characteristics, disability-related characteristics, behavioral characteristics, and history of experience with any type of violence. Data were collected by 12 data collectors and 2 supervisors (MSc nurses) who had extensive experience in conducting interviews and supervision.
For the qualitative analysis, open-ended questions with a flexible probing strategy were employed. The in-depth interviews were conducted by the lead researcher alongside one assistant who tape-recorded the interviews.
Data Quality Control
Before the actual interview began, the tool was pretested on 5% of the sample size and reviewed by two senior experts. Based on the feedback from experts and the pretests, the study tool underwent all necessary adjustments. Experienced enumerators that are 12 BSc nurses and two MSc nurses were hired. Enumerators received a two-day intensive training on the purpose of the study and the sample techniques. An overview of the study and its selection was provided to eligible participants in a private setting and all doubts and concerns were addressed. The collected data were submitted to supervisors on a regular, daily basis. Supervisors also conducted routine check-ups on the completed questionnaires for completeness before the next day’s interview. Additionally, the principal investigator checked the completed questionnaire and provided feedback to the supervisors daily. An in-depth interview guide and field notes were used to avoid missing any relevant information.
Data Processing and Analysis
Quantitative data were exported from Epi-data version 3.1 to STATA version 15. Descriptive statistics followed by multivariable logistic regression analyses were performed. Factors that were significant with a p-value of less than 0.05 in the bivariable logistic regression were retained for further consideration with a multivariable logistic regression. Three different models were fitted to identify the factors that determine different types of violence. The odds ratios and 95% confidence intervals were computed and a p-value of less than 0.05 was used to determine the cut-off points for statistical significance. The Hosmer-Lemeshow goodness-of-fit test statistics were done. Multicollinearity was checked using a variance inflation factor. Qualitative data were transcribed and translated, and then coded and analyzed thematically to complement and supplement the quantitative findings.
Ethical Approval and Consent to Participate
Ethical clearance was obtained from the academic research directorate of Wolaita Soddo University, College of Health Science and Medicine, and an official letter was written to the administrations of Wolaita and Dawro zones. The head of the offices then wrote a cooperation letter to the labor and social affairs office located in each selected district in both zones. Written informed consent was obtained from the participants before interviewing both arms of the study and after discussing about the publication of their anonymized response; the potential harms and benefits of participating in the study. No personal details were recorded or produced in any documentation related to the study and privacy was ensured. None of the participants was obliged to participate unless otherwise agreed to participate. It has declared that the study complies with the Declaration of Helsinki.
Results
Characteristics of the Study Participants
A total of 15 PWDs refused to participate and 645 PWDs participated in the study making the response rate 97.7%. The mean age ± SD of participants was 39.5 ±7.4. The majority of the participants were female 340 (52.7%), attended ≤ primary education 443 (68.7%), single 323 (50.1%), and unemployed 458 (71.0%). A large proportion of participants lived with their families (49.6%) and had no children (55.0%). The majority of participants belonged to the lower wealth index group 442 (68.5%) and had no exposure to mass media (57.5%), and the Internet (78.0%) [Table 2].
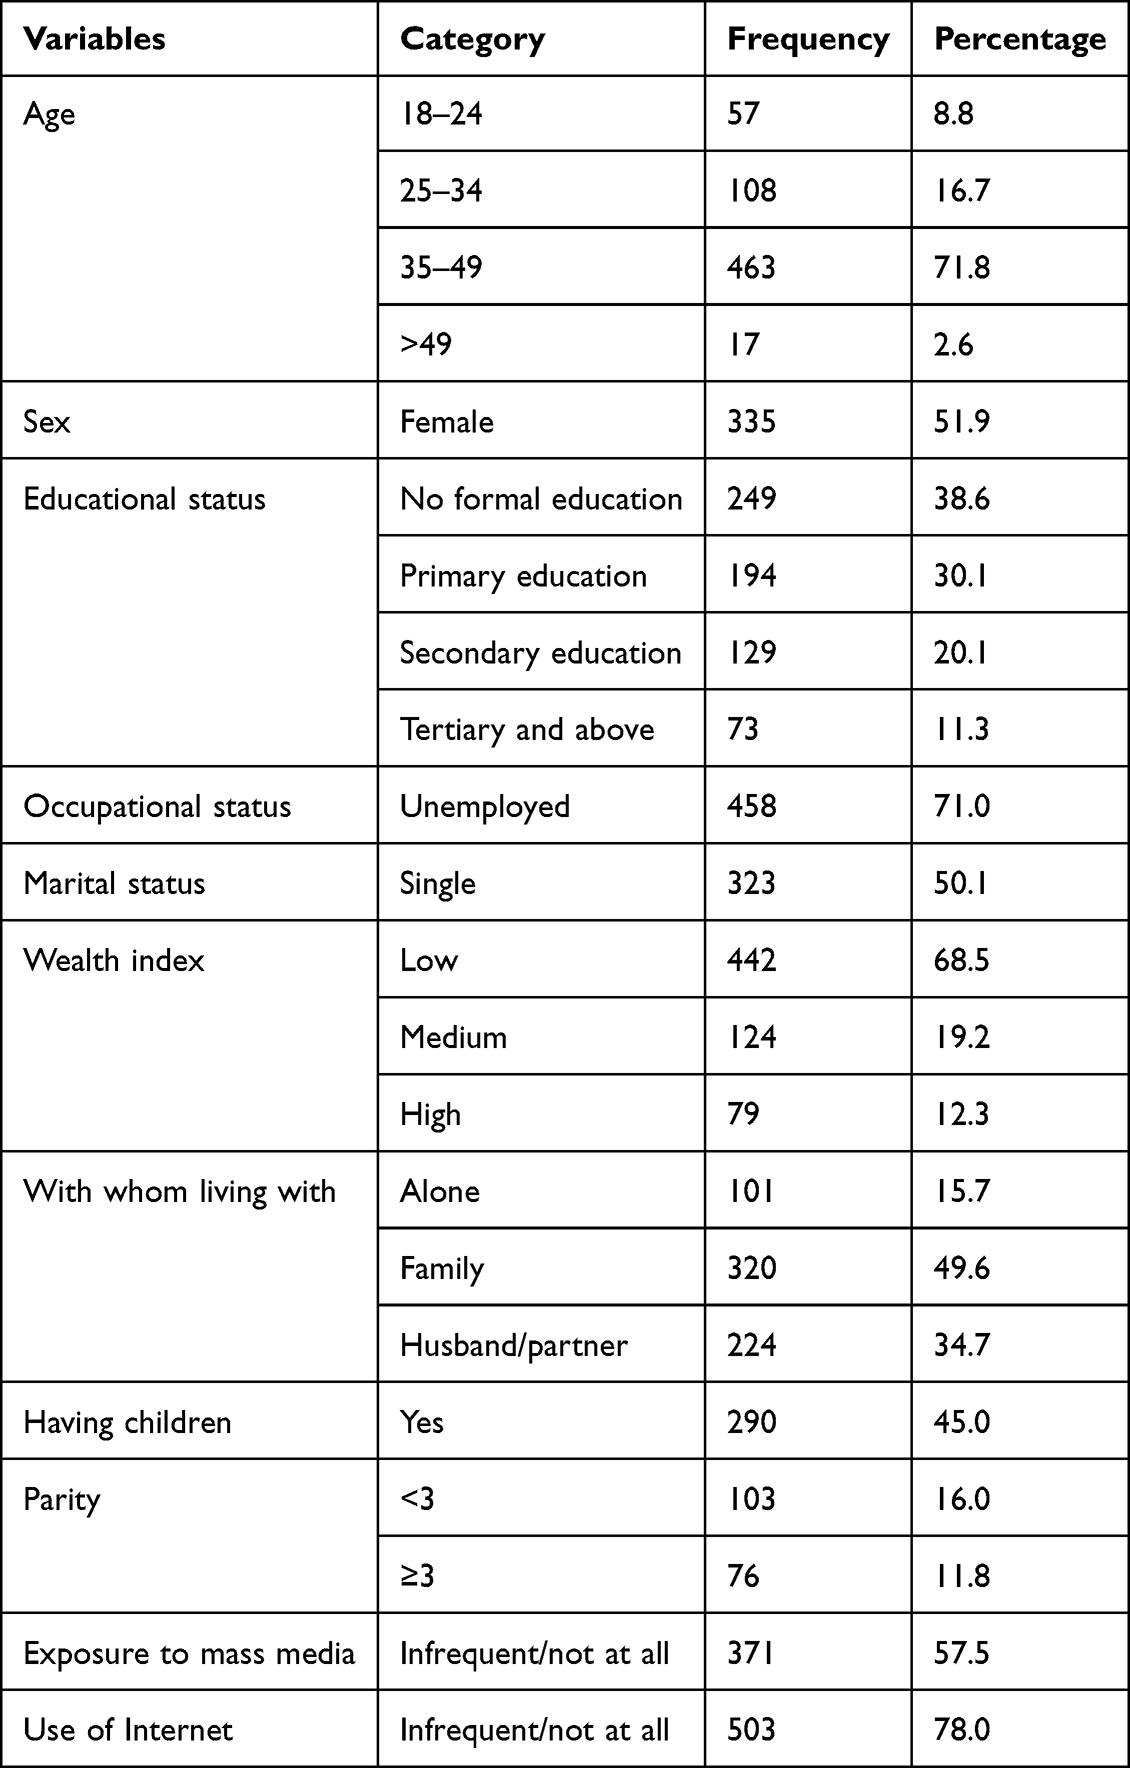 |
Table 2 Socio-Demographic Characteristics of People with Disabilities in Southern Ethiopia, 2022 (N=645) |
Behavioral and Disability-Related Characteristics of Participants
The majority of participants 331 (51.3%) have been living with a disability since, at age of ≥ 5, 285 (44.2%) have a visual disability, 423 (65.6%) severely relied on others, 494 (76.6%) had low body self-esteem, 349 (54.1%) had a low perceived social support, 463 (71.8%), used substance/alcohol ≥ twice a week, 445 (70.1%) engaged with organizations supporting PWDs, whereas the majority of PWDs has not joined any community groups, 327 (50.7%). Nearly one-third of participants did not have control over their personal affairs, (32.6%) and had poor knowledge about violence, (31.5%) [Table 3].
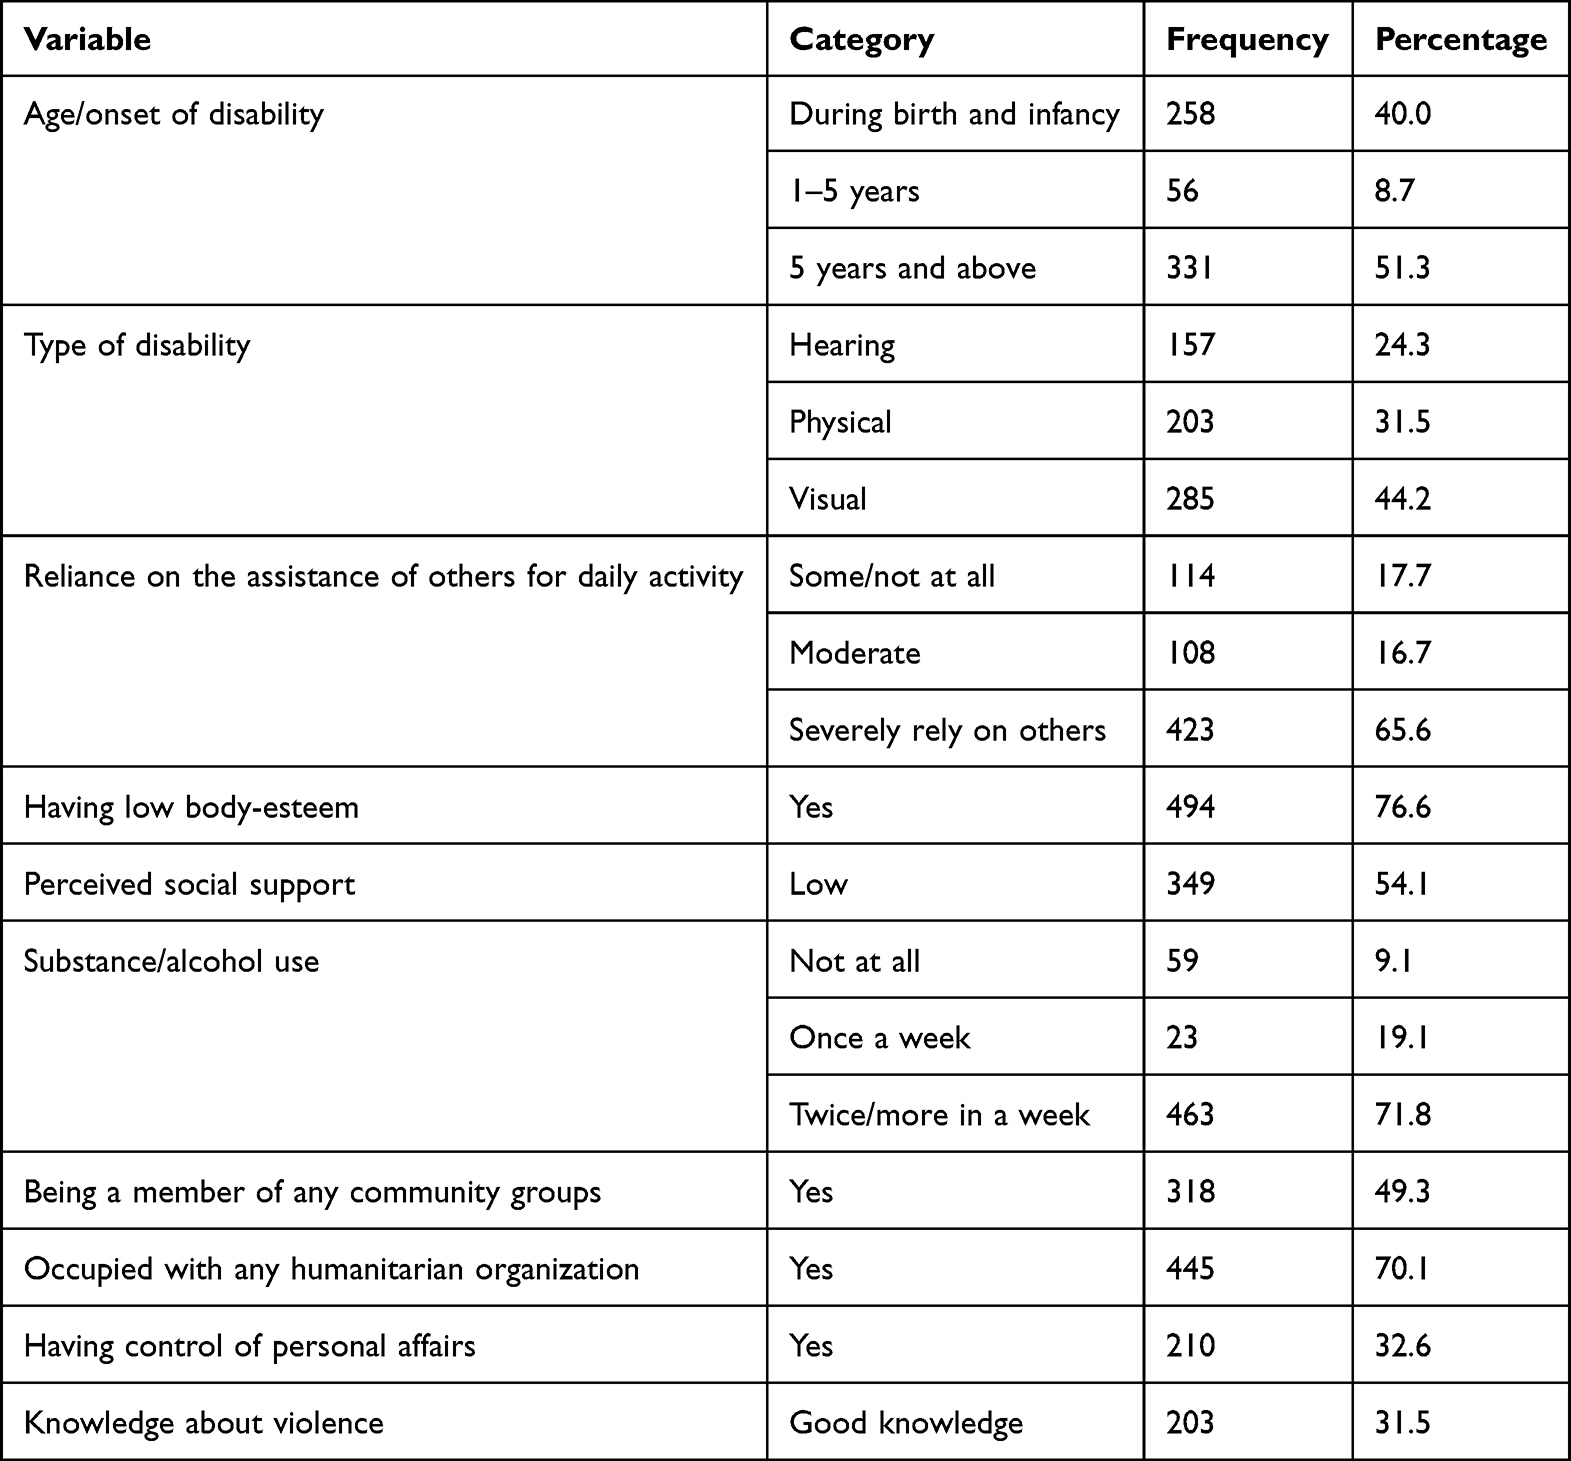 |
Table 3 Behavioral and Disability-Related Characteristics of People with Disabilities in Southern Ethiopia, 2022 (N= 645) |
Perceived Social Support and Health Access Among People with Disabilities
Table 4 presents the level of perceived social support and healthcare access among PWDs. A large proportion of 349 (54.1%) participants had a low level of perceived social support. During the qualitative interview, there is a lack of tangible support like talking to the legal bodies, and affectionate support like making PWDs feel wanted.
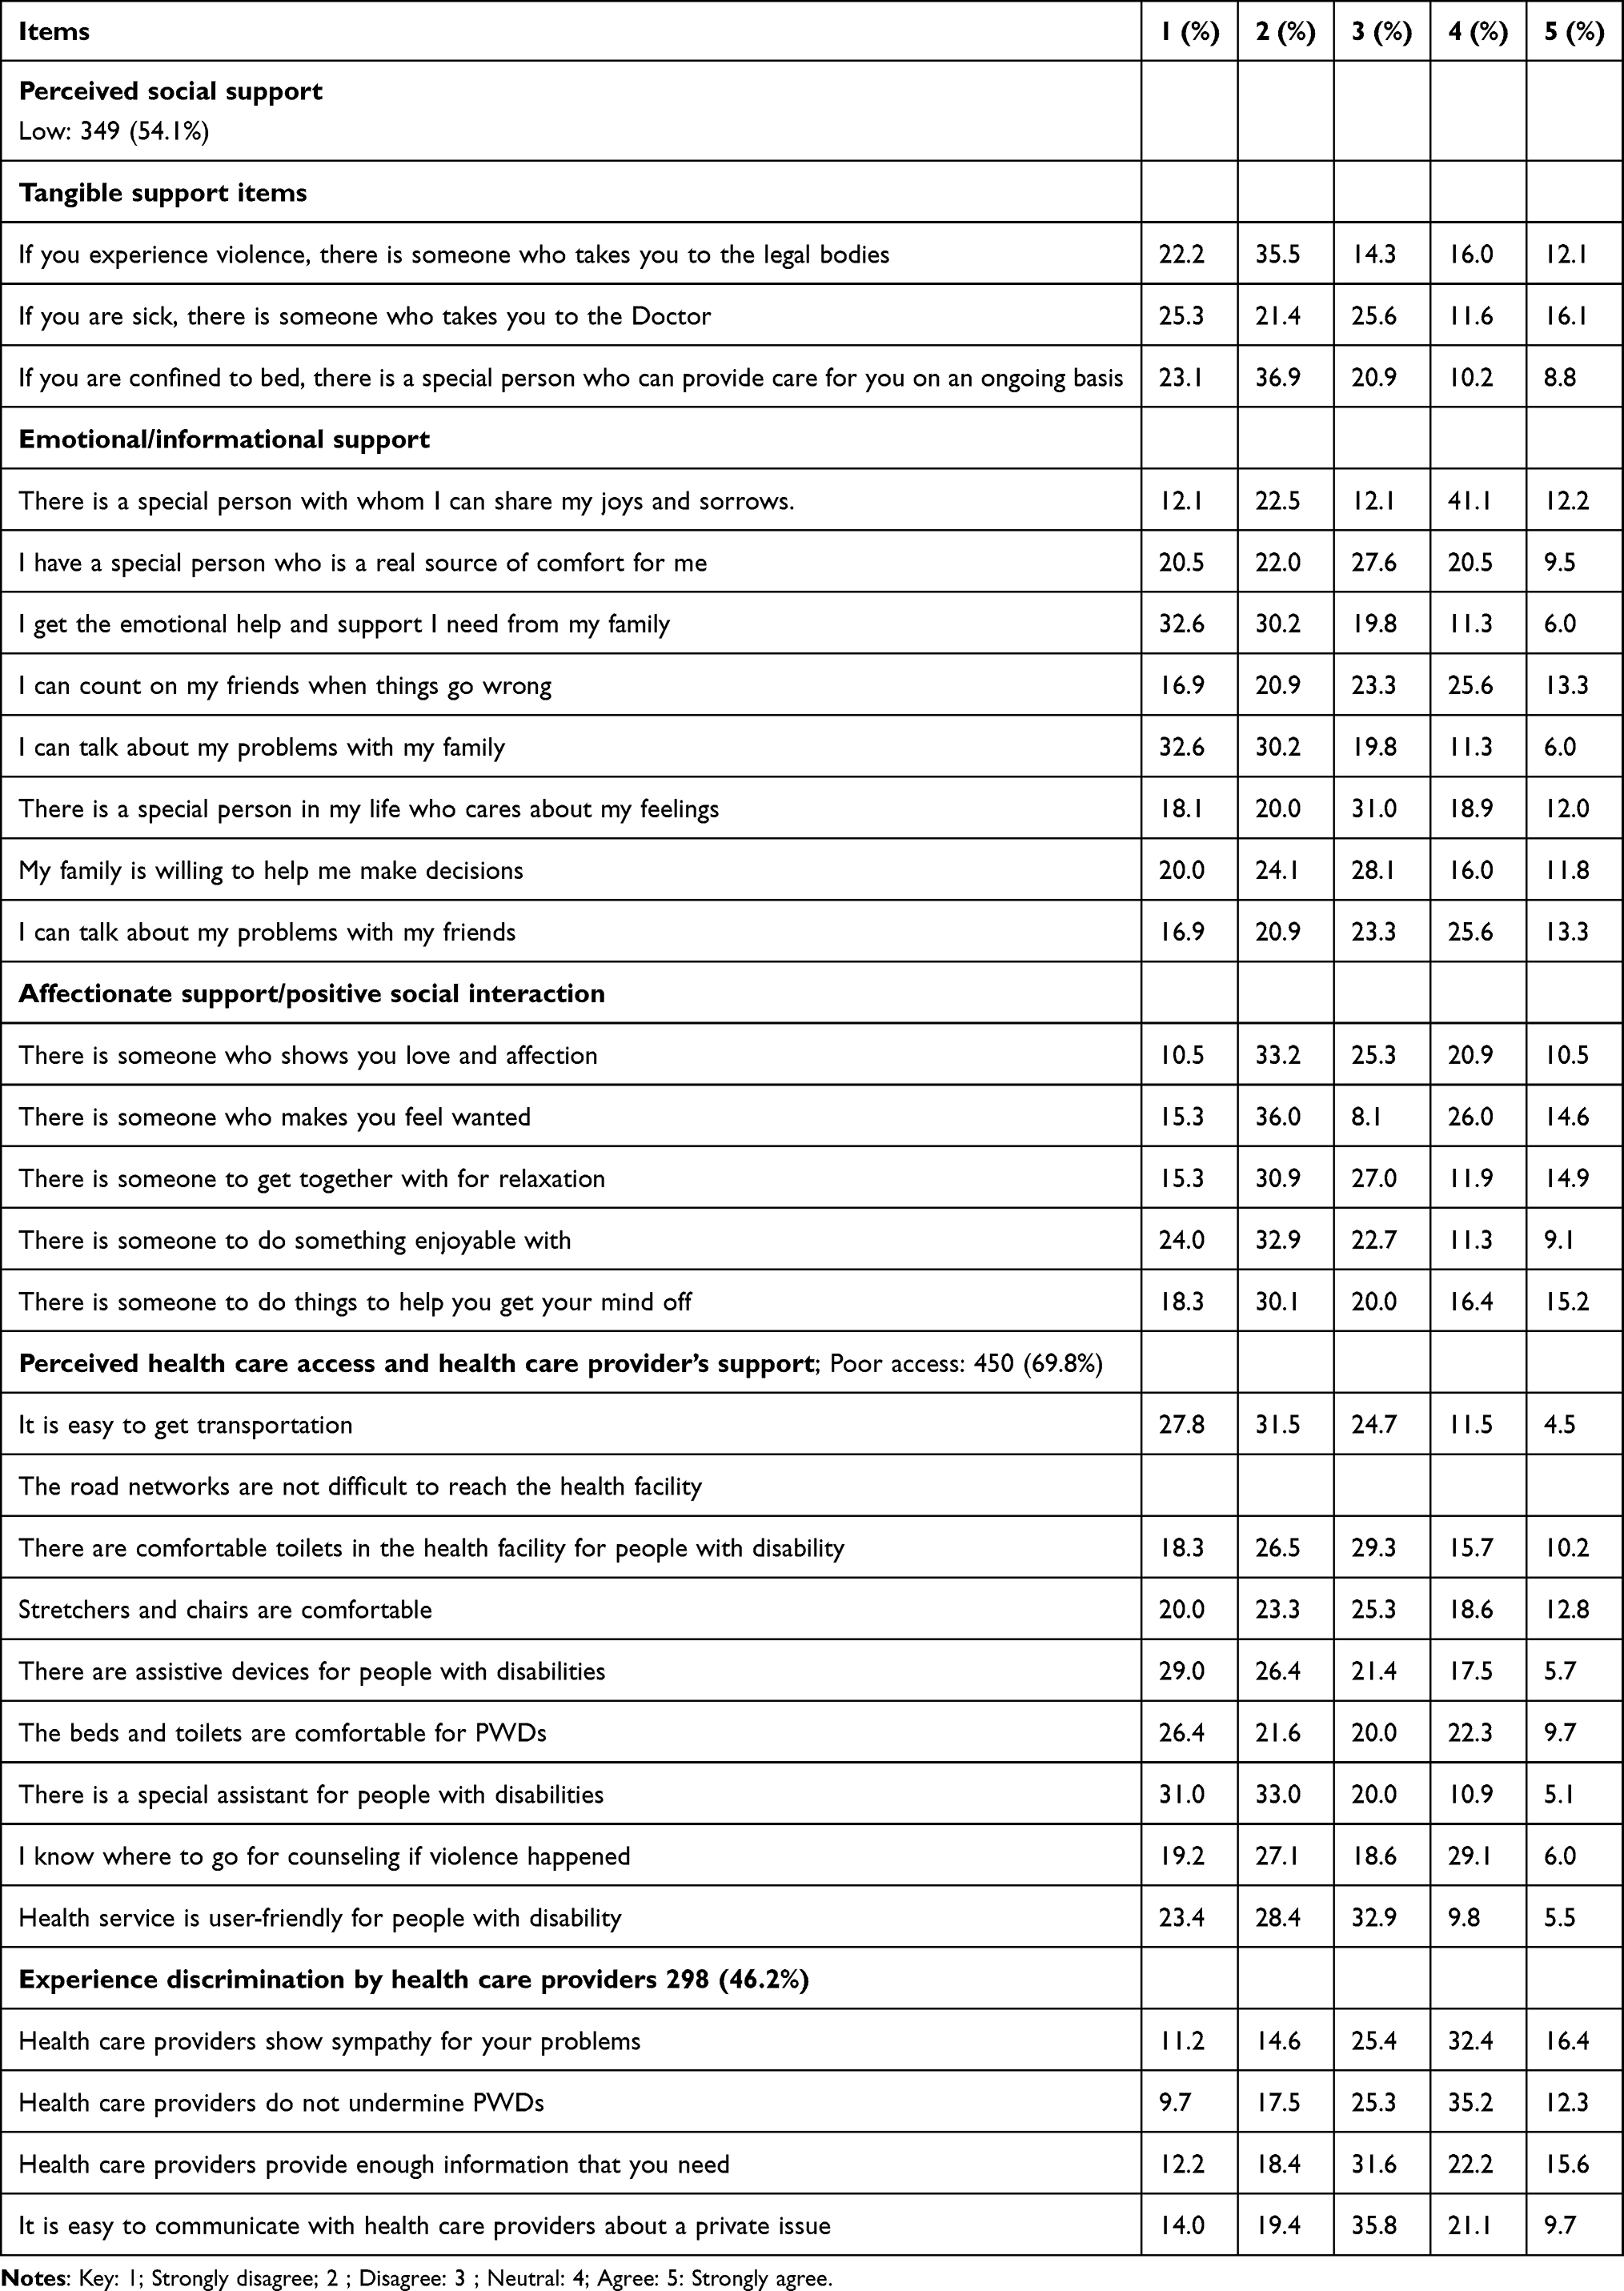 |
Table 4 Perceived Social Support and Health Care Access Among People with Disabilities in Southern Ethiopia, 2022 (N=645) |
For example, 30 years, a single woman participant explained
When the priest forced me to have sex, my cousin, with whom I lived, hugged me and cried with me after she heard what happened. But, after I informed her of my decision to report, she warned me that no one would believe me and we might end up socially isolated. I remained silent for a year, but after the priest regularly raped me, I left my house and ended up on the streets.
Another 32-year, single male participant, explained that
Although people appeared to be considerate, deep down they dismissed us, thought of us as less than human, and did not want to be seen with us. Because of this, I much prefer to be alone and isolated.
A common theme during interviews was the significance of receiving the wrong kind of social support.
23 years, male single university student explained that
Some people show mournful expressions out of sympathy, while they did that they remind me of my deficiencies. Even though, they do not realize how much it killed me internally.
Another 35-year-old married woman explained her experience as
My family wouldn’t let me do things on my own. I knew they were doing it out of care for me, but it made me feel uneasy and unhappy.
Thereby, in the qualitative findings, people who lack social support were subjected to social isolation, depression, and violence.
For example 29 years, a single woman explained
My sister was the person I shared all of my happiness and misery with. She served as a pillar of strength for me. I feel lonely since her death. Those who used to be kind to me while she was alive, stop doing so, they even recommend that I go out to beg on the street. I thought if she would be alive, people might not dismiss me and even my neighbor might not keep forcing me to have sex.
A large proportion of PWDs 440 (68.2%) had poor perceived healthcare access. The main challenges raised by participants during in-depth interviews were problems related to transport and access to quality and appropriate information.
35 years, a married woman explained the challenge as
The distance to the health facility is not walk able even for body-abled people. There was no easy way to get around. Because of this, I was forced to deliver at home this year. I still faced difficulty in accessing the service I need because of the inconvenient transport
Another 27-year-old single woman explained
I desperately needed to utilize contraception when I was in high school, but I did not know where to go and who to ask. Even the WDAs in our areas did not invite me while they provided sexual and reproductive health education, and I was too ashamed to join them by myself. I needed support and shared my ideas with my friend, who mocked me, my secret easily got around and I ended up being scolded. This is because of the community’s perception that people with disabilities are sexually inactive.
Regarding whether they had encountered discrimination from HCPs, the majority 347 (53.8%) of the participants claimed they had not.
During the in-depth interviews, the majority of participants shared comparable experiences. The participants rather blamed the healthcare system for failing to take PWDs into account.
For example 23 years, a female participant explained
I went to the hospital to get contraception, the HCP hardly found a person who knows sign language from the clients, and tried to get me details on different alternatives but the assistant could not give brief information and I hopelessly selected one with doubt. This is not her problem; it is rather the problem of the institution for not recruiting sign language experts.
Prevalence of Different Types of Violence
According to Table 5, the prevalence of lifetime violence in this study was 75.3%; physical (63.0%), emotional (50.1%), and sexual violence (40.0%). The prevalence of any type of violence in the past year was 61.2%; emotional, 59.7%, physical, 40.3%, and sexual violence, 17.7%. The majority of perpetrators of sexual, physical, and emotional violence were people within the community 53 (45.3%), husband/partner 110 (42.3%), and family 162 (42.1%), respectively.
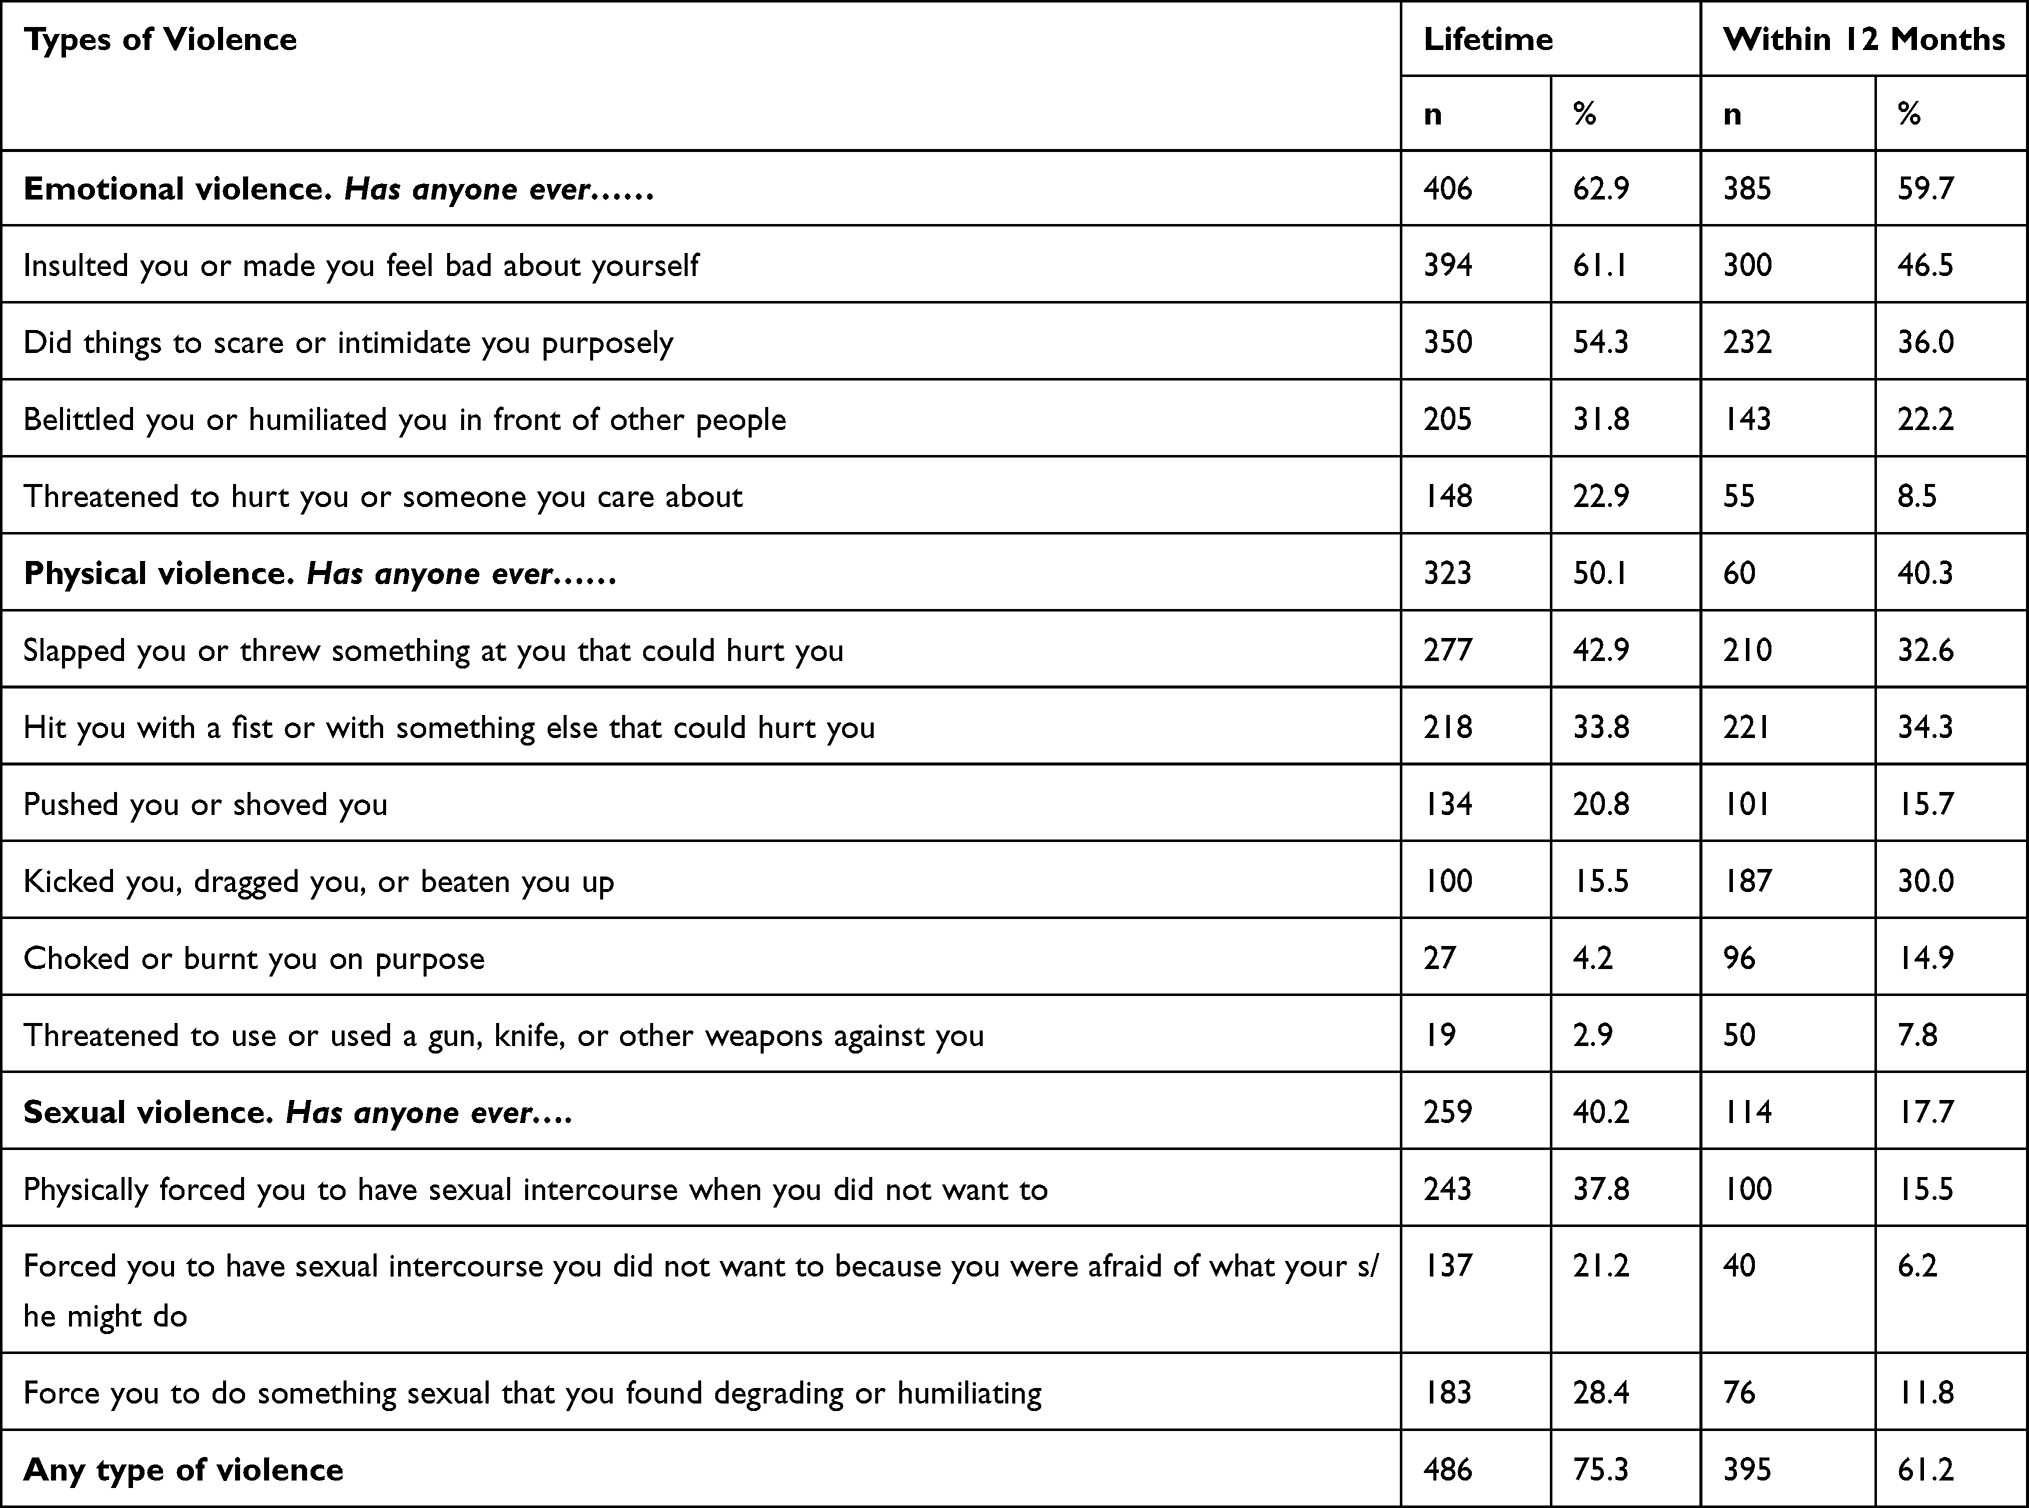 |
Table 5 Prevalence of Violence Against People with Disabilities in Southern Ethiopia, 2022 (N=645) |
The most common act of emotional violence in the past year was being insulted by someone to feel bad about themselves (46.5%), followed by being intimidated by someone deliberately (36.0).
In-depth interviews revealed that PWDs faced various forms of emotional violence.
19 years, a female, and single said
My siblings go to school and can go out and relax on their own, but I am not allowed to do so because they thought I am unworthy of these privileges, My family wants me to stay at home and help them with housework. Even when I went out to relax on occasion, they insulted me with curse words, causing an emotional toll. My stepfather threatened to throw me out earlier today if I told you what they’ve been doing to me.
33 years, single female, explained
Nobody wants to be with me, even my ex-boyfriend often said he felt embarrassed about being seen with me. He only had been with me because of my inheritance. I would cry every day because he constantly made me feel unwanted.
29 years, a single female explained as
I heard when the people gossip, I am accursed and it was better if I had died instead since I am useless.
Of all PWDs who had encountered physical violence in the previous year, (32.6%) and (34.3%) revealed that they had been slapped or had something thrown at them and had been hit with a fist or with something else that could hurt them.
During the in-depth interviews, participants disclosed their multiple experiences with physical violence.
19 years, a single female said
It is easy for my family to unleash their wrath on me even if no fault was counted on me. My stepfather would beat me up when he get angry with others.
35 years, married woman, explained
My husband forbade me from participating in any neighborhood groups. On occasion, I joined without telling him. He becomes furious and beats me after finding out, just like he did earlier today.
Being physically forced to have sex without interest was the most prevalent form of sexual violence (15.5%), followed by being forced to engage in something sexual that was degrading or humiliating (11.8%). In the in-depth interview, 30 years, a single woman explained how she had been sexually abused by a priest and unidentified individuals several times:
When I was 14 years old the priest forced me to have sex with him while I was undressed in the backyard to be baptized with holy water and receive healing. He threatened to use his divinely granted authority to kill me and my cousin if I revealed what he has done. My silence encouraged him and raped me repeatedly for a year. Thereafter, I decided to leave home and end up on the street. This year at midnight, while dosing off in the street, I was sexually assaulted twice by unidentified individuals.
Another 29-year-old female also disclosed
Our neighbor sexually assaulted me while I was alone at my home in the evening. He said it would be better if I keep silent since no one would believe me if I spoke. While I cried, he glanced contemptuously and said, you have to thank me for letting you experience the pleasure of sex since no guy desires you. Since that day, he has been coercing me into having sex with him.
Factors Associated with Sexual Violence
During the bivariable logistic regression model age, sex, educational status, marital status, wealth index, substance abuse, perceived social support, type of disability, reliance on others, and community group membership were associated with sexual violence. However, only sex, educational status, type and severity of the disability, and community group membership remained significant during multivariable association.
Female participants were more likely to experience sexual violence {AOR: 3.5; 95% CI: (1.61, 7.47)} than men. PWDs who had never attended any formal education were more likely to experience sexual violence {AOR: 4.8; 95% CI: (1.18, 19.79)} than those who attended tertiary and above education. Participants with visual disability {AOR: 3.5; 95% CI: (1.61, 7.43)} and physical disability {AOR: 3.2; 95% CI: (1.24, 8.12)} were more likely to experience sexual violence than those with hearing disabilities. People with disabilities who have severely relied on the assistance of others and those who never joined community groups were more likely to experience sexual violence {AOR: 5.6; 95% CI: (1.34, 23.55)}, and {AOR: 3.9; 95% CI: (1.36,11.35)}, respectively than those who did not rely on the assistance of others and community group members [Table 6].
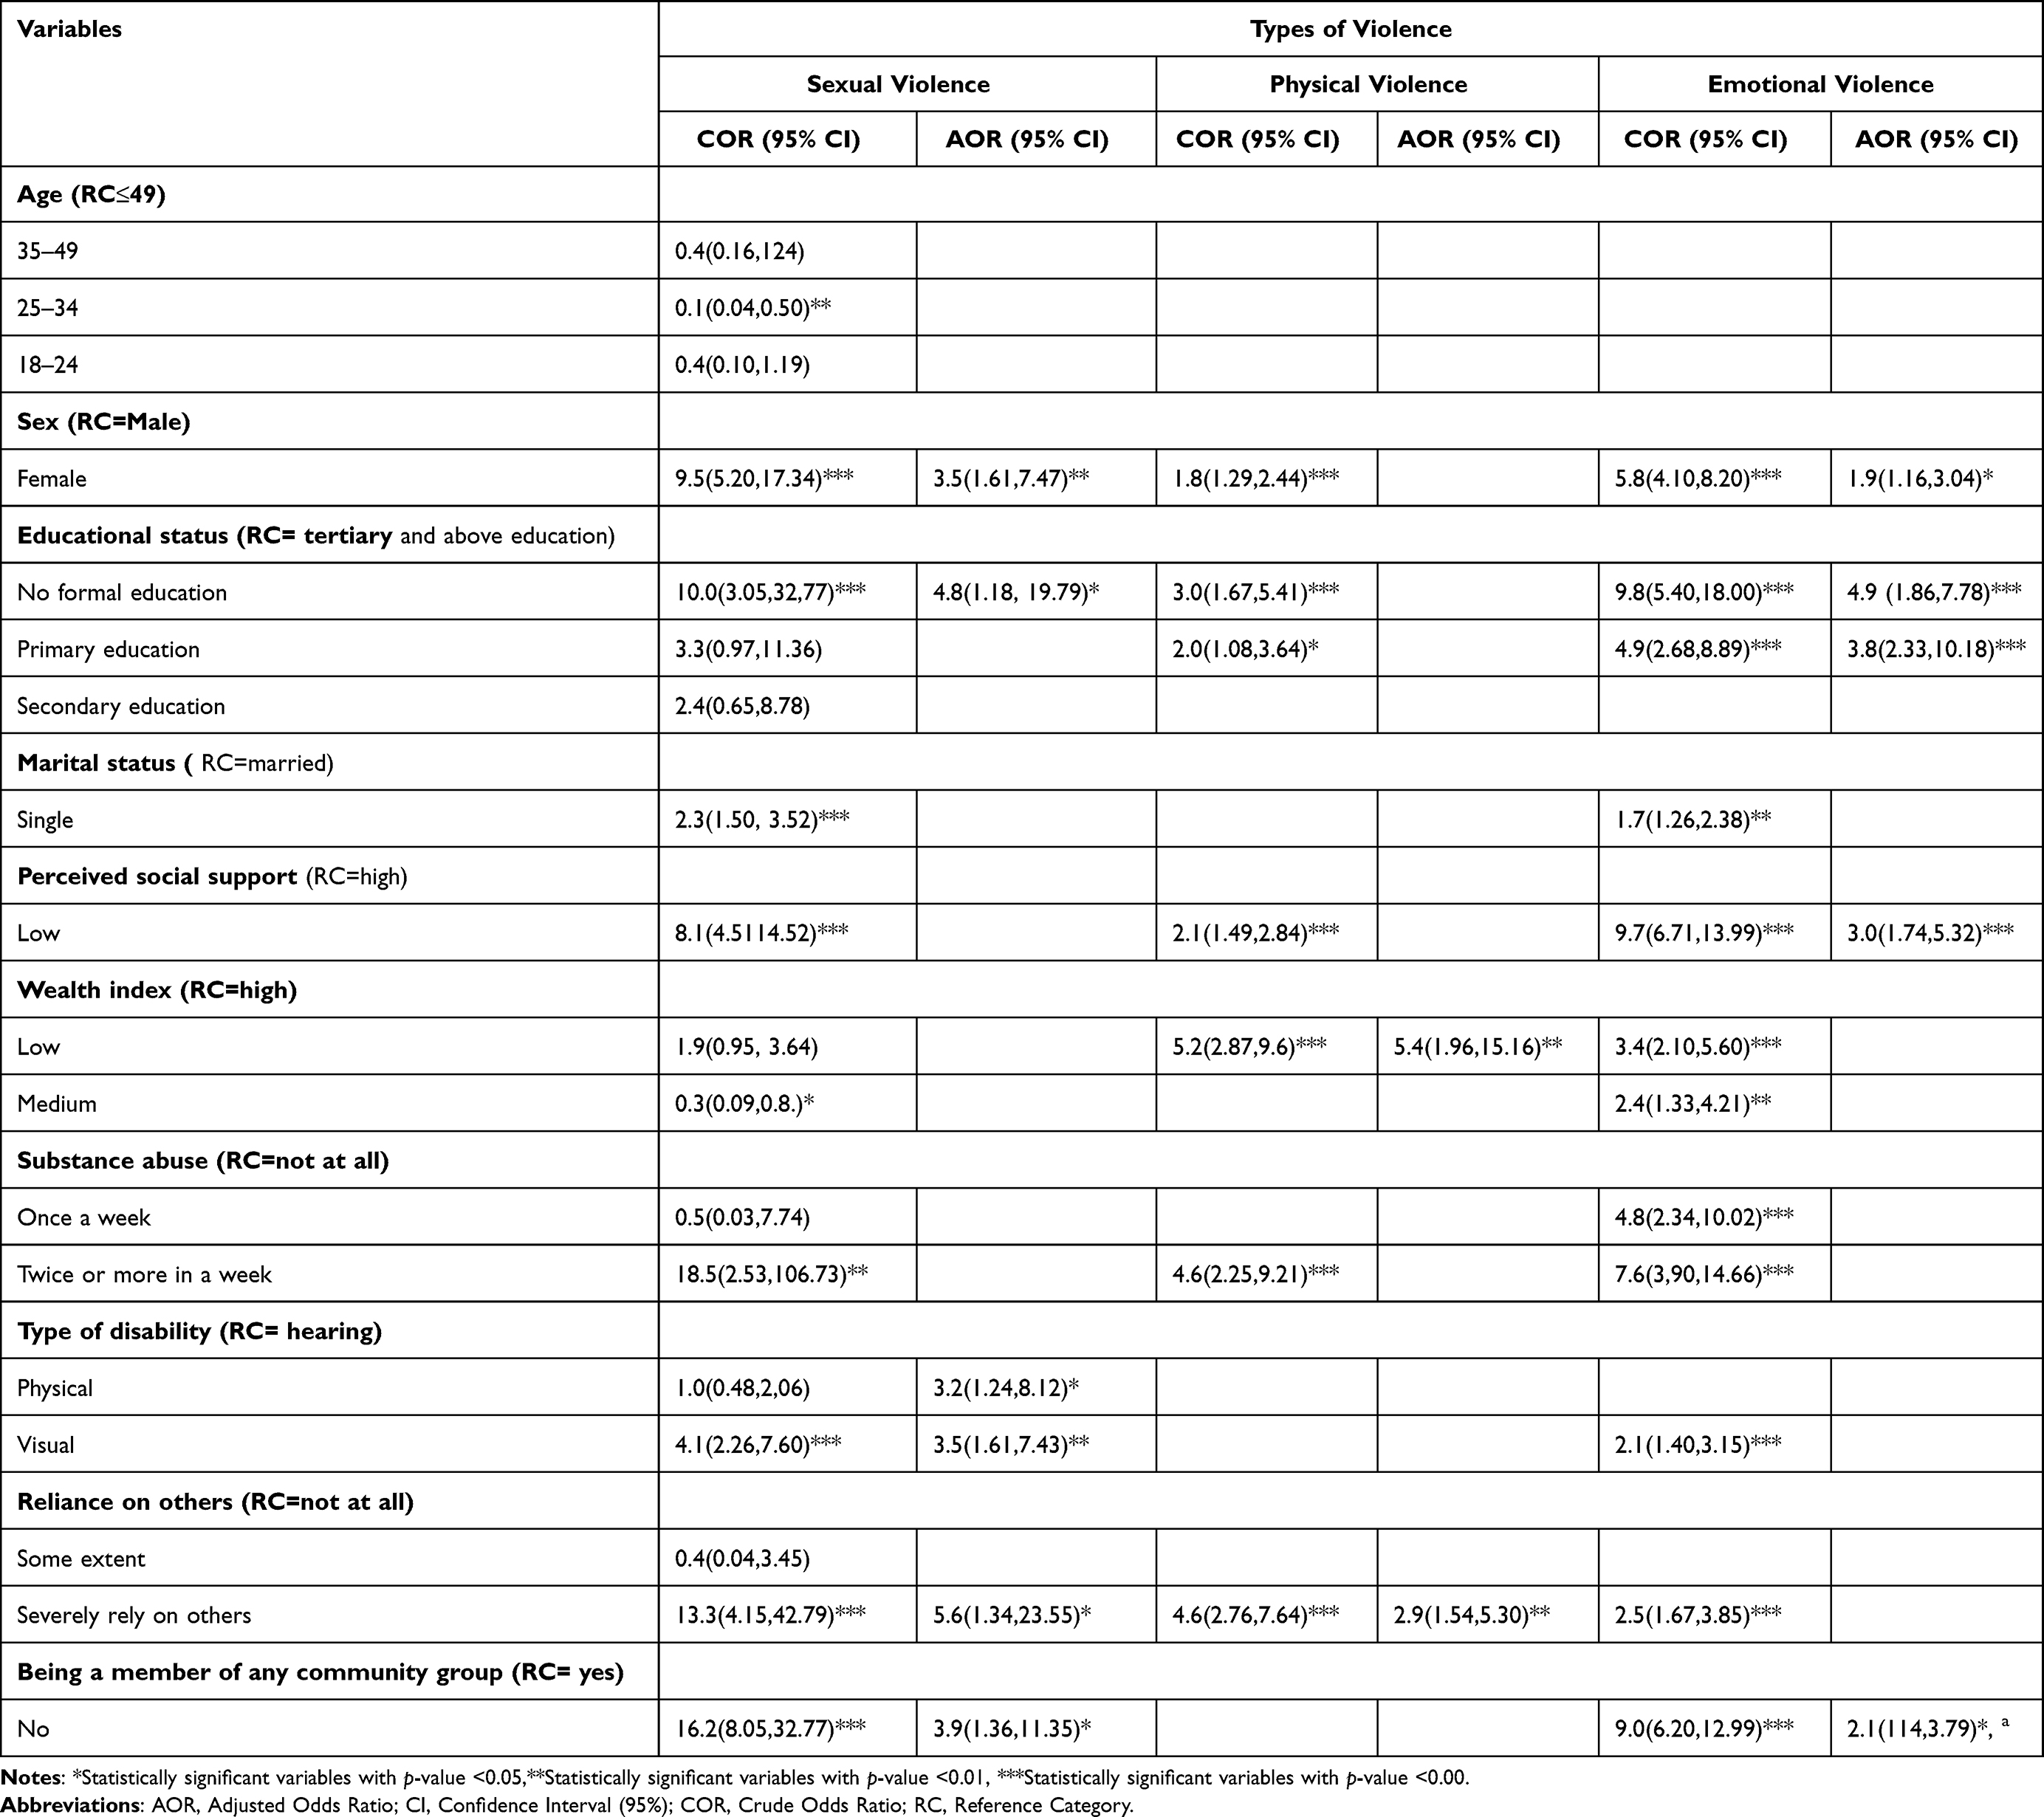 |
Table 6 Factors Associated with Violence Against People with Disabilities in Southern Ethiopia, 2022 (N=645) |
Factors Associated with Emotional Violence
Amid bivariable logistic regression analysis, sex, educational status, marital status, substance abuse, wealth index, perceived social support, type of disability, reliance on others, and community group membership were associated with emotional, whereas only sex, education, perceived social support and reliance on others have remained significant during multivariable regression model.
Female participants were more likely to experience emotional violence {AOR: 1.9; 95% CI: (1.16, 3.04)} than men. PWDs who had never attended any formal education {AOR: 4.9; 95% CI: (1.86, 7.78)} and attended primary education {AOR: 3.8; 95% CI: (2.33, 10.18) were more likely to experience emotional violence than those who attended ≥ tertiary education. Participants who had low perceived social support {AOR: 3.0; 95% CI: (1.74, 5.32)} and who never joined any community group {AOR: 2.1; 95% CI: 2.1(114, 3.79)} were more likely to experience emotional violence than those who had high perceived social support and community group members [Table 6].
Factors Associated with Physical Violence
Factors such as sex, educational status, wealth index, substance abuse, perceived social support, and reliance on others were associated with physical violence during bivariable analysis, whereas, only wealth index and reliance on others remained significant in the multivariable model.
Participants who belonged to the lower wealth index group {AOR: 5.4; 95% CI: (1.96, 15.16)} and strongly relied on the assistance of others {AOR: 2.9; 95% CI: (1.54, 5.30)} were more likely to experience physical violence than those belonging to the high wealth index group and who did not rely on others, respectively [Table 6].
Discussion
People with disabilities are one of the most marginalized and socially excluded groups in many countries and they tend to face particular risks of violence; however, to the best of our knowledge, this is the first study to assess violence against PWDs and its associated factors, perceived social support, and health access in rural areas of Southern Ethiopia. The lack of similar previous studies makes comparisons difficult.
In this study, the prevalence of violence ie, experiencing at least one type of violence (sexual, physical, or emotional violence was 61.2%. This finding was far higher than the previous similar study done in Burkina Faso which was 13.9%.18 This is even higher than a study done in Nepal (42.0%).19 This disparity might be because of the current study was conducted in rural areas, and there might be a weak implementation of violence mitigation strategies for PWDs.
Consistent with the previous research in Australia,6 the current study documents that about 17.0% of PWDs experienced sexual violence in the last year. However, this finding was lower than a previous study done in Nepal on women with disabilities which was 21.5%.19 This might be explained by the fact that women are more likely to be victims of violence in most cases.
In the current study, about 40.3% of PWDs experienced physical violence. This finding was lower than the previous study done in Australia which was 48.2%.6 This might be because the current study excludes people with psychological disabilities, who are considerably at a higher risk of any type of violence.20
This study also documents the prevalence of emotional violence was 59.7%. This finding was slightly higher than the study done in Nepal 55.2%.19 This might be explained by the fact that the current study was conducted in rural populations that are further away from available resources and the influence of the rule of law prohibiting violence, which limits the enforcement of strict laws against violence. In addition, exclusionary socio-cultural attitudes toward PWDs that condone violence against PWDs changed at a slower rate in rural areas.
In the current study, people with disabilities reported a lack of social support, particularly tangible social support like being taken to the authorities while violence occurred. In addition, the social support they did receive was frequently incorrect, making them even more vulnerable to violence, social isolation, and depression. This study was supported by studies conducted in Nepal19 and Iran21 which stated that there is lack of perceived social support and receiving wrong social support. Being aware of social support and creating efficient interventions to enhance it for the disabled is crucial because it is one of the social determinants of health and plays a significant influence in improving psychological circumstances in people’s lives.
People with disabilities reported in the current study that access to health care was unsuitable due to the lack of their consideration in the design of the restroom, transportation and information dissemination systems. However, they have reported that the health care providers treated them without discrimination and are supportive. This study was supported by the study conducted among people with physical disabilities in Hawassa22 that PWDs have limited access to health care. This may be because people with disabilities require specific access to healthcare due to their restrictions. So, the government should implement a particular system that eliminates the problem for those groups.
Previous studies have shown that education has a significant impact on reducing violence.18,23 Consistent with this, the current study uncovered those PWDs who had not attended any formal education more likely to experience sexual and emotional violence than those who had tertiary and above education. This might be explained by the fact that education increases employment opportunities and PWDs might become well aware of the available rule of law. This empowerment of PWDs through education reduces unequal power relationships with violent perpetrators.
Females with disabilities have a higher risk of violence than males with disabilities.6,24,25 Consistent with this, the current study also revealed that women participants were more prone to violence than males. This might be due to gender inequality in income, education, and norms regarding the acceptance of violence against women. In fact, in the current study, there are significantly higher proportion of male who attended tertiary and above education and belonging to higher wealth index groups than female.
The financial level has been significantly associated with people’s experience of violence.24,26 In the current study, PWDs who belonged to the lower wealth index group were 5.2 times more likely to experience physical violence than their counterparts. This might be explained by the fact that lower incomes could result in having limited alternatives and resources.
The current study revealed that adults with visual and physical disabilities are more likely to face sexual violence than those with hearing disabilities. This was supported by the study conducted in Burkina Faso.18 This might be due to people with visual and physical impairments have a power imbalance with the perpetrators of violence, which creates favorable conditions for the perpetrator to commit violence.
Moreover, PWDs who had a low level of perceived social support were 3.0 times more likely to experience emotional violence. This might be because having a low level of perceived social support might result in low self-esteem, as it gives the perception that one is unvalued and not accepted by others, which leaves PWDs to be easily violated emotionally.26
PWDs’ reliance on others may increase their vulnerability to violence.27,28 Consistent with these, PWDs who strongly need assistance with their daily activities were more likely to experience sexual and physical violence than their counterparts. This is because the more PWDs depend on others the more they are likely to be in the control of the caregivers and to learn helplessness since they have no other options. This creates a favorable situation for the caregivers to abuse the people they are supposed to take care of, sexually and physically.
PWDs that have not joined any community group were more likely to experience sexual and emotional violence than their counterparts. This finding is consistent with a study conducted in Nepal.19 This might be because most acts of violence occur at times when victims are isolated from other people, as they are more likely to remain silent about their violence and have less knowledge that can contribute to learned helplessness.
Limitations of the Study
This study may not establish a causal relationship, as we implemented a cross-sectional study design. As participants were recruited using a convenient sampling method there may be the possibility of under- or over-representation of the population or lack of generalizability. Despite training being given to data collectors and the purpose of the study being discussed with participants, the study may still be liable to social desirability bias, especially when assessing the behavioral characteristics of participants. This study was limited to adults with disabilities (physical, visual, and hearing) and did not consider children and people with intellectual disabilities that were expected to be at a higher risk of violence. The absence of previous studies on the same topic made it difficult to compare the findings.
Conclusion
This study is the first to estimate the prevalence of violence against PWDs and associated factors, to examine the perceived level of social support and healthcare access in Ethiopia. It is suspected that the prevalence of sexual, physical as well and emotional violence among people with disabilities is likely to be considerably higher than among non-disabled people. Being female, having lower education, belonging to the lower wealth index group, not being a member of any community group, and relying on others for help were significant determinants of violence among people with disabilities. The findings from this study highlight the need for capacity building for people with disabilities, especially for women with disabilities, and people with visual and physical disabilities to mitigate violence. Creating a strong reporting system by motivating PWDs to engage in the community is also necessary. Awareness creation and attitude change movements in the community to avoid discrimination against PWDs are also needed. There is also a need to take steps towards addressing the challenges in health service access such as transport and delivery of appropriate information.
Abbreviations
AOR, Adjusted Odds Ratio; HCP, Health Care Providers; HEWs, Health Extension Workers; MDGs, Millennium Development Goals; MSPSS, Multidimensional Scale of Perceived Social Support; ORs, Odds Ratios; PWDs, People with Disabilities; WDAs, Women Development Armies; WHO, World Health Organization.
Data Sharing Statement
The data presented in this study are available on request from the corresponding author. The data are not publicly available due to restrictions from data owners.
Informed Consent Statement
Informed consent was obtained from all subjects involved in the study.
Acknowledgments
The authors would like to thank all of the participants in the study and our community-based voluntary disability organizations. The authors are also gratitude Health Professionals Education Partnership Initiative (HEPI) Ethiopia for funding a grant for data collectors. Special thanks go to data collectors, voluntary organizations, and Labor and Social Affair office staff for their commitment to providing valuable information.
Author Contributions
All authors made a significant contribution to the work reported, whether that is in the conception, study design, execution, acquisition of data, analysis, and interpretation, or in all these areas; took part in drafting, revising, or critically reviewing the article; gave final approval of the version to be published; have agreed on the journal to which the article has been submitted; and agree to be accountable for all aspects of the work.
Funding
This research work was supported by a Health Professionals Education Partnership Initiative (HEPI) grant (grant number: R25TW011214) obtained from the US National Institutes of Health, Fogarty International Center. But, no source of fund was received for publication of the study.
Disclosure
The authors report no conflicts of interest in this work.
References
1. World Health Organization. World report on disability; 2011:27.
2. Chataika T, Mckenzie JA, Swart E, Lyner-Cleophas M. Access to Education in Africa: Responding to the United Nations Convention on the rights of persons With disabilities. Disabil Soc;2012;27(3):385–398.
3. Al-Oraibi S, Dawson VL, Balloch S, Moore AP. Rehabilitation services for persons affected by stroke in Jordan. DCID. 2011;22(1):73. doi:10.5463/dcid.v22i1.18
4. Opoku MP, Huyser N, Mprah WK, Badu E, Alupo BA. Sexual violence against women with disabilities in Ghana: accounts of women with disabilities from Ashanti region. DCID. 2016;27(2):91. doi:10.5463/dcid.v27i2.500
5. Mandl S, Sprenger C, Schachner A, et al. Access to specialised victim support services for women with disabilities who have experienced violence. J Appl Res Intellect Disabil. 2014;27(4):378.
6. Krnjacki L, Emerson E, Llewellyn G, Kavanagh AM. Prevalence and risk of violence against people with and without disabilities: findings from an Australian population‐based study. Aust N Z J Public Health. 2016;40(1):16–21. doi:10.1111/1753-6405.12498
7. Khalifeh H, Howard LM, Osborn D, Moran P, Johnson S, Bayer A. Violence against people with disability in England and Wales: findings from a national cross-sectional survey. PLoS One. 2013;8(2):e55952. doi:10.1371/journal.pone.0055952
8. Mikton C, Shakespeare T. Introduction to special issue on violence against people with disability. J Interpers Violence. 2014;29(17):3055–3062. doi:10.1177/0886260514534531
9. Elman RA, Lodholz T. Confronting the sexual abuse of women with disabilities. Harrisburg, PA: VAWnet, a project of the National Resource Center on Domestic Violence/Pennsylvania Coalition Against Domestic Violence; 2005. Available from: https://vawnet.org/material/confronting-sexual-abuse-women-disabilities.
10. World Health Organization. World report on disability; 2011. Available from: http://www.who.int/disabilities/world_report/2011/report.pdf.
11. World Bank Group. Violence against Women and Girls(VAWG). Disaster Risk Management Brief Second Edition. Available from: http://documents.worldbank.org/curated/en/099112006302323414/IDU06b818f1f0e080a17d0235df565a5ba.
12. Swedlund NP, Nosek MA. An exploratory study on the work of independent living centers to address abuse of women with disabilities. J Rehabil. 2000;66:57–64. PMID: 39043.
13. Davis LA. People with intellectual disabilities & sexual offenses. The Arc; 2011. http://www.thearc.org/wp-content/uploads/forchapters/Sexual%20Offenses.pdf.
14. Federal Democratic Republic of Ethiopia, Population Census Commision. Summary and Statistical report of the 2007 Population and Housing census: population size by age and sex. Available from: https://www.ethiopianreview.com/pdf/001/Cen2007_firstdraft(1).pdf.
15. World Health Organization. WHO Multi-Country Study on Women’s Health and Domestic Violence Against Women. Geneva: World Health Organization; 2005.
16. Zimet GD, Dahlem NW, Zimet SG, Farley GK. The multidimensional scale of perceived social support. J Pers Assess. 1998;52(1):30–41. doi:10.1207/s15327752jpa5201_2
17. Levesque JF, Harris MF, Russell G. Patient-centred access to health care: conceptualizing access at the interface of health systems and populations. Int J Equity Health. 2013;12(1):1–9. doi:10.1186/1475-9276-12-18
18. Kouanda S, Arelatan J, Ouedraogo HG, et al. Prevalence and risk factors of violence among persons with disabilities in Burkina Faso. AIDS Care. 2022;8:1–6. doi:10.1080/09540121.2022.2072804
19. Puri M, Misra G, Hawkes S. Hidden voices: prevalence and risk factors for violence against women with disabilities in Nepal. BMC Public Health. 2015;15(1):1.
20. Hughes K, Bellis MA, Jones L, et al. Prevalence and risk of violence against adults with disabilities: a systematic review and meta-analysis of observational studies. Lancet. 2012;379:1621–1629.
21. Forouzan AS, Mahmoodi A, Shushtari ZJ, Salimi Y, Sajjadi H, Mahmoodi Z. Perceived social support among people with physical disability. Iran Red Crescent Med J. 2013;15(8):663. doi:10.5812/ircmj.12500
22. Tesfaye T, Woldesemayat EM, Chea N, Wachamo D. Accessing healthcare services for people with physical disabilities in Hawassa City Administration, Ethiopia: a cross-sectional study. Risk Manag Healthc Policy. 2021;24:3993–4002.
23. Marium S. Women’s level of education and its effect on domestic violence in rural Bangladesh. IOSR J Humanit Soc Sci. 2014;19(5):40–45. doi:10.9790/0837-19534045
24. Malihi ZA, Fanslow JL, Hashemi L, Gulliver PJ, McIntosh TK. Prevalence of non-partner physical and sexual violence against people with disabilities. Am J Prev Med. 2021;61(3)329–337. doi:10.1016/j.amepre.2021.03.016
25. Fomba H, Ouedraogo HG, Cissé K, Kouanda S. Prevalence and factors associated to the occurrence of sexual violence among people with disabilities in Burkina Faso. Psychol Health Med. 2022;1:1.
26. Yoshida K, DuMont J, Odette F, Lysy D. Factors associated with physical and sexual violence among Canadian women living with physical disabilities. Health Care Women Int. 2011;32(8)762–775. doi:10.1080/07399332.2011.555826
27. Oktay JS, Tompkins CJ. Personal assistance providers’ mistreatment of disabled adults. Health Soc Work. 2004;29(3):177–188. doi:10.1093/hsw/29.3.177
28. Sobsey D. Sexual offenses and disabled victims: research and practical implications. Visà-Vis. 1988;6:4.
 © 2023 The Author(s). This work is published and licensed by Dove Medical Press Limited. The
full terms of this license are available at https://www.dovepress.com/terms
and incorporate the Creative Commons Attribution
- Non Commercial (unported, 3.0) License.
By accessing the work you hereby accept the Terms. Non-commercial uses of the work are permitted
without any further permission from Dove Medical Press Limited, provided the work is properly
attributed. For permission for commercial use of this work, please see paragraphs 4.2 and 5 of our Terms.
© 2023 The Author(s). This work is published and licensed by Dove Medical Press Limited. The
full terms of this license are available at https://www.dovepress.com/terms
and incorporate the Creative Commons Attribution
- Non Commercial (unported, 3.0) License.
By accessing the work you hereby accept the Terms. Non-commercial uses of the work are permitted
without any further permission from Dove Medical Press Limited, provided the work is properly
attributed. For permission for commercial use of this work, please see paragraphs 4.2 and 5 of our Terms.