")
Back to Journals » Neuropsychiatric Disease and Treatment » Volume 18
Prevalence and Consequences of Cerebral Small Vessel Diseases: A Cross-Sectional Study Based on Community People Plotted Against 5-Year Age Strata
Authors Mu R, Qin X, Guo Z, Meng Z, Liu F, Zhuang Z, Zheng W, Li X, Yang P, Feng Y, Jiang Y, Zhu X
Received 6 December 2021
Accepted for publication 22 February 2022
Published 3 March 2022 Volume 2022:18 Pages 499—512
DOI https://doi.org/10.2147/NDT.S352651
Checked for plagiarism Yes
Review by Single anonymous peer review
Peer reviewer comments 2
Editor who approved publication: Dr Jun Chen
Ronghua Mu,1,2,* Xiaoyan Qin,2,* Zixuan Guo,1,2,* Zhuoni Meng,1,2 Fuzhen Liu,2 Zeyu Zhuang,1,2 Wei Zheng,1,2 Xin Li,2 Peng Yang,2 Yuling Feng,2 Yanchun Jiang,3 Xiqi Zhu2
1Graduate School of Guilin Medical University, Guilin, 541004, People’s Republic of China; 2Department of Radiology, Nanxishan Hospital of Guangxi Zhuang Autonomous Region, Guilin, 541004, People’s Republic of China; 3Department of Neurology, Nanxishan Hospital of Guangxi Zhuang Autonomous Region, Guilin, 541004, People’s Republic of China
*These authors contributed equally to this work
Correspondence: Xiqi Zhu, Tel +86 13737399757, Email [email protected]
Purpose: To study the variation tendency of cerebral small vessel disease (CSVD) imaging markers and total burden with aging and to research the relationship between aging, CSVD markers and cognitive function.
Methods: Participants in local urban communities were recruited for neuropsychological and magnetic resonance imaging assessments. Montreal Cognitive Assessment (MoCA), Mini-mental State Examination (MMSE), Number Connection Test A (NCT-A) and Digital Symbol Test (DST) were adopted as neuropsychological scale. Age was stratified at 5-year intervals, and the variation tendency of imaging markers and variables of neuropsychological scales in different age groups was studied. We further studied the relationship between aging, image markers and neuropsychological scales by multi-linear regression.
Results: Finally, a total of 401 stroke-free participants (age, 54.83± 7.74y; 45.9% were male) were included in the present analysis. With the increase of age, the incidence of imaging markers of CSVD were increased with aging except cerebral microbleeds. The performance results of NCT-A and DST were significant difference in 6 age groups (P < 0.001). In addition, linear decline of the neuropsychological function reflected by NCT-A and DST variables was observed. Linear regression found that age was an independent factor affecting the neuropsychological function reflected by NCT-A and DST variables, and the standard correction coefficients among different age groups increased gradually with age. In addition, brain atrophy is an independent factor affecting neuropsychological variables (odds ratio: − 2.929, 95% CI: [− 5.094 to − 0.765]). There was no correlation between the number of neuroimaging markers and neuropsychological variables after full adjustment.
Conclusion: There are many CVSD markers even in younger people, the incidence rate and CVSD marker numbers increase with age. Aging and CSVD may eventually affect cognitive function through brain atrophy.
Keywords: cerebral small vessel disease, aging, imaging marker, neuropsychological scales, community-based study
Introduction
Cerebral small vessel disease (CSVD) is a disorder induced by intracranial small vessel lesions, which manifests as a series of changes in neuropathology, cognitive function, sphincter dysfunctions and gait disorder, etc.1 CSVD is used to describe a series of imaging changes in the white matter and subcortical grey matter, including recent small subcortical infarct (SBI), lacunar infarct (LI), white matter hyperintensities (WMHs), enlargement perivascular spaces (EPVSs), cerebral microbleeds (CMBs) and brain atrophy (BA). CSVD accounts for 25% of the etiology of ischemic stroke and doubles the risk of recurrence of stroke.2
Studies have previously verified that age is an accepted independent risk factor for CSVD.2–4 It was also reported that the severity and progression of CSVD increased with aging, and more severe CSVD was observed in individuals aged over 75 years.5 Yu et al found that among physical examinees with one or more vascular disease risk factors, age was independently related to the severity of WMH, and the incidence of WMH in people over 50 years old increased significantly.6 CSVD is common in the elderly and stroke patients, but its incidence in young people or young patients with ischemic stroke is unclear. In recent years, the proportion of ischemic stroke in young people has gradually increased.7 Another study reported that the prevalence of CMBs in CSVD gradually increased with aging, and the prevalence of CMBs increased by 6.5% among people aged 45 to 50 years in 3979 participants.8 Fan et al studied 400 patients aged 18~49 years with first ischemic stroke and found that the incidence of SBI and WMH increased with age, among young stroke patients aged 40~45, more than half of them had SBI, WMH or both.9
In several studies, the variation tendency of CSVD imaging makers among different age groups were studied by different age stratification.3,10,11 The reported prevalence of CSVD imaging makers in elderly populations varies greatly across different studies.12 Prevalence of CMBs was 11.5%, 16.8%, 28.9% and 35.7%, respectively, in 50–80 years people grouped at 10 years interval.3 Incidence rate of LI was 4.8%, 6.8%, 9.7% and 17.3%, respectively, in over 65 years old people plotted against 5 years strata.11 In a Chinese cross-sectional study based on the community population aged 35–80, Han et al reported that the incidence rate of SBI, LI, WMH and CMB gradually increases with age.10 At present, the distribution and the variation tendency of CSVD markers and CSVD total burden with aging between different age groups needs further validation.
The majority of previous studies had incorporate age as an overall independent variable rather than age stratification into statistics models in CSVD study. The lack of incorporating age stratification into the design of statistics models ignore the fact that the epidemiology of CSVD is not consistent among different age groups. In addition, mechanistic determinants of CSVD including genetics, inflammation, and oxidative stress often change with aging. The cognitive dysfunction can be caused not only by the progression of brain damage due to CSVD but also by the aging-related neurodegeneration. But the relationship between aging, CSVD marker (single imaging marker and total load) and cognitive function is currently blurred.
Therefore, we conducted a cross-sectional study in urban community-based people. Age was stratified at 5-year intervals, and the distribution and changing tendency of CSVD imaging markers with aging were studied. Variables of cognition and their changing tendency among different age group were also studied. We further studied the relationship between aging, image markers and neuropsychological scales by regression analysis.
Materials and Methods
Study Population and Study Sample
A community-based cross-sectional study was conducted at Nanxishan Hospital of Guangxi Zhuang Autonomous Region. From May 2020 to June 2021, 427 participants ranged from 40 to 70 years were recruited with the following exclusion criteria: (1) Severe medical or mental illness. (2) Neurological diseases other than CSVD (eg, hydrocephalus, brain tumors, cerebrovascular malformations, etc.). (3) History of psychotropic medication use or alcohol abuse. (4) Liver, kidney or other important organ dysfunction; (5) History of craniocerebral operation; (6) Unable to cooperate with neuropsychological tests.
Standard clinical examinations were performed for each participant. In addition, all participants were asked to undergo brain MRI examination. Each participant signed an informed consent form. All protocols of the study were approved by the Ethics Committee of our hospital (2020NXSYEC-006).
MRI Protocol and Image Analysis
All MRI examinations were performed using a 3.0T MRI system (Ingenia 3.0CX; Philips Healthcare, Best, The Netherlands) and 32-channel coils of the head were used to perform MRI scans. Scan sequence: D T1-weighted fast field echo, repetition time (TR) =6.4ms, echo time (TE) =3.0ms, Field of vision (FOV)=240mm×240mm×180mm, Reconstruction voxel = 1.1×1.1×1.1, Reconstruction matrix = 512×512, Slice thickness = 1.1mm; 3D fluid–attenuated inversion recovery (FLAIR), TR = 4800ms, TE = 244ms, FOV = 240 mm×240mm×173mm, Reconstruction voxel = 1.1×1.1×1.1, Reconstruction matrix = 384×384, Slice thickness = 1.2 mm; DWI, TR = 2462ms, TE = 63ms, FOV = 230mm×230mm×143mm, Reconstruction matrix = 192×192, Slice thickness = 5mm, gap = 1, Reconstruction voxel = 1.5×2.2×5, NSA = 1, axial slices = 24. SWI: TR = 29ms, TE = 7.2ms, FOV = 230mm×189mm×130mm, Reconstruction matrix = 768×768, Slice thickness = 2mm, gap=−1, Reconstruction voxel = 0.6×06×2, NSA = 1, axial slices = 130. Each subject underwent the above MRI scan regimen, which took about 30 minutes.
The acquired images were transferred to the post-processing workstation of “IntelliSpace Portal” version 8 (Philips Healthcare, The Netherlands) for further processing. Two radiologists were blinded to any patient’s clinical data to mitigate potential cognitive biases. MRI findings related to CSVD were classified according to standard published criteria.13 LI were defined as hyperintense lesions on T2-weighted images with corresponding hypointense lesions with a hyperintense rim on FLAIR-weighted image. WMH were graded according to Fazekas’ scale.14 CMBs were defined as punctate (<10mm) homogeneous foci of low signal intensity on SWI-weighted images.15 EPVS were defined as round, oval, or linear-shaped lesions with a smooth margin, absence of mass effect and with signal intensity equal to cerebrospinal fluid on T2-weighted images and hypointense on FLAIR images without hyperintense rim to distinguish them from silent LI.16 BA included both deep and superficial BA, and regions assessed included bilateral frontal, temporal (including hippocampal regions), parietal occipital, as well as whole-brain cortex. For this study, the regions were scored according to Kippss/Dacies score, MTA-scale, Koedam score, and GCA-scale, which ranged from 0 to 3 points for each region: 0-normal volume/no ventricular enlargement, 1-opening of sulci/mild ventricular enlargement, 2-volume loss of gyri/moderate ventricular enlargement, 3-“knife blade” atrophy/severe ventricular enlargement.17 We labeled patients with a deep or superficial score ≥2 points as having BA because mild degenerative pathologies can also manifest as a score of 1 point in normal elderly patients.
Patients were divided into groups 1 to 5 based on the number of CSVD marker types present. The prevalence of these 5 CSVD markers and marker number groups was plotted against 5-year age strata. Patients with fazekas1 WMH and EPVS were divided into four groups according to the quartile. To prevent result bias due to small sample sizes, we combined the cases of 4 and 5 markers into one group for statistical analysis.
Collection of Demographic and Clinical Data
Clinical data of all patients were collected, including general demographic data such as gender, age, educational experience, and vascular risk factors. Height, weight, and body mass index (BMI, kg/m2) were measured. The systolic blood pressure (SBP) and diastolic blood pressure (DBP) were measured three times with a blood pressure monitor, and the pulse pressure difference and mean arterial pressure were calculated. Pulse pressure difference = systolic-diastolic pressure. Mean arterial pressure (MAP) = diastolic + 1/3 (systolic - diastolic).
Neuropsychological Assessment
Subjects underwent cognitive domain neuropsychological tests after MRI examination. The Beijing version of Montreal Cognitive Assessment (MoCA) and Mini-mental State Examination (MMSE) scale were used to test multiple cognitive domains. For those with less than 12 years of education, the total score was added by 1 point (the full score was no more than 30 points). Number Connection Tests A (NCT-A) and Digital Symbol Test (DST) were used to test for psychomotor function, attention and processing speed. The scale was assessed by a neurologist trained in neuropsychological assessment.
Statistical Analysis
SPSS21.0 (IBM Corp., Armonk, NY, USA) was used for statistical analysis. Bilateral P < 0.05 indicates that the difference is statistically significant. Intraclass correlation coefficients (ICC) were calculated for the measurements of the two radiologists (ICC ≥ 0.75, excellent; 0.60 ≤ ICC < 0.75, good; 0.40 ≤ ICC < 0.60, fair; and ICC < 0.40, poor).18 All parameters were finally averaged over the measurements made by the two physicians. The normal distribution of the data was tested by Kolmogorov Smirnov method. Data are presented as mean with standard deviation (SD), median with interquartile range, or number with percentage, where appropriate. The differences of demographic characteristics, risk factors and neuropsychological scales among different age groups (40–45y to 66–70y) were analyzed by one-way ANOVA, Kruskal Wallis test and chi square test (or Fish exact probability method). The relationship between image marker numbers (CSVD total load), aging and neuropsychological scale score was analyzed by multi-linear regression, the image marker numbers and aging were used as independent variable, and the continuous neuropsychological scale score was used as result variable; the relationship between single image marker, aging and neuropsychological scale score was analyzed by multi-linear regression, the single image marker and aging were used as independent variable, and the continuous neuropsychological scale score was used as result variable. β Value (95% confidence interval) and P value were calculated. Based on previous knowledge of potentially important confounders, all analyses were adjusted for age, gender, educational level, blood pressure, and history of cardiovascular disease (diabetes, coronary heart disease, and atherosclerosis).
Results
Consistency Test and Patient Demographics
The data measured by the two observers had excellent consistency. The ICC was 0.970, 0.961, 0.965, 0.977, 0.970 between the two neuroradiologists for the diagnosis of the five CSVD imaging markers LI, WMH, EPVS, CMBs, BA, respectively.
Five patients with severe hearing impairment failed to complete valid scale collection. Fourteen patients refused to participate or had absolute contraindications to MRI imaging. Seven patients were excluded from the analysis because of data distortion due to motion artifacts. Finally, a total of 401 stroke-free participants were included in the present analysis. The mean±SD age was 54.83±7.74 years (range, 40–70 years), and 45.9% were male. The baseline characteristics of the study population are listed in Table 1.
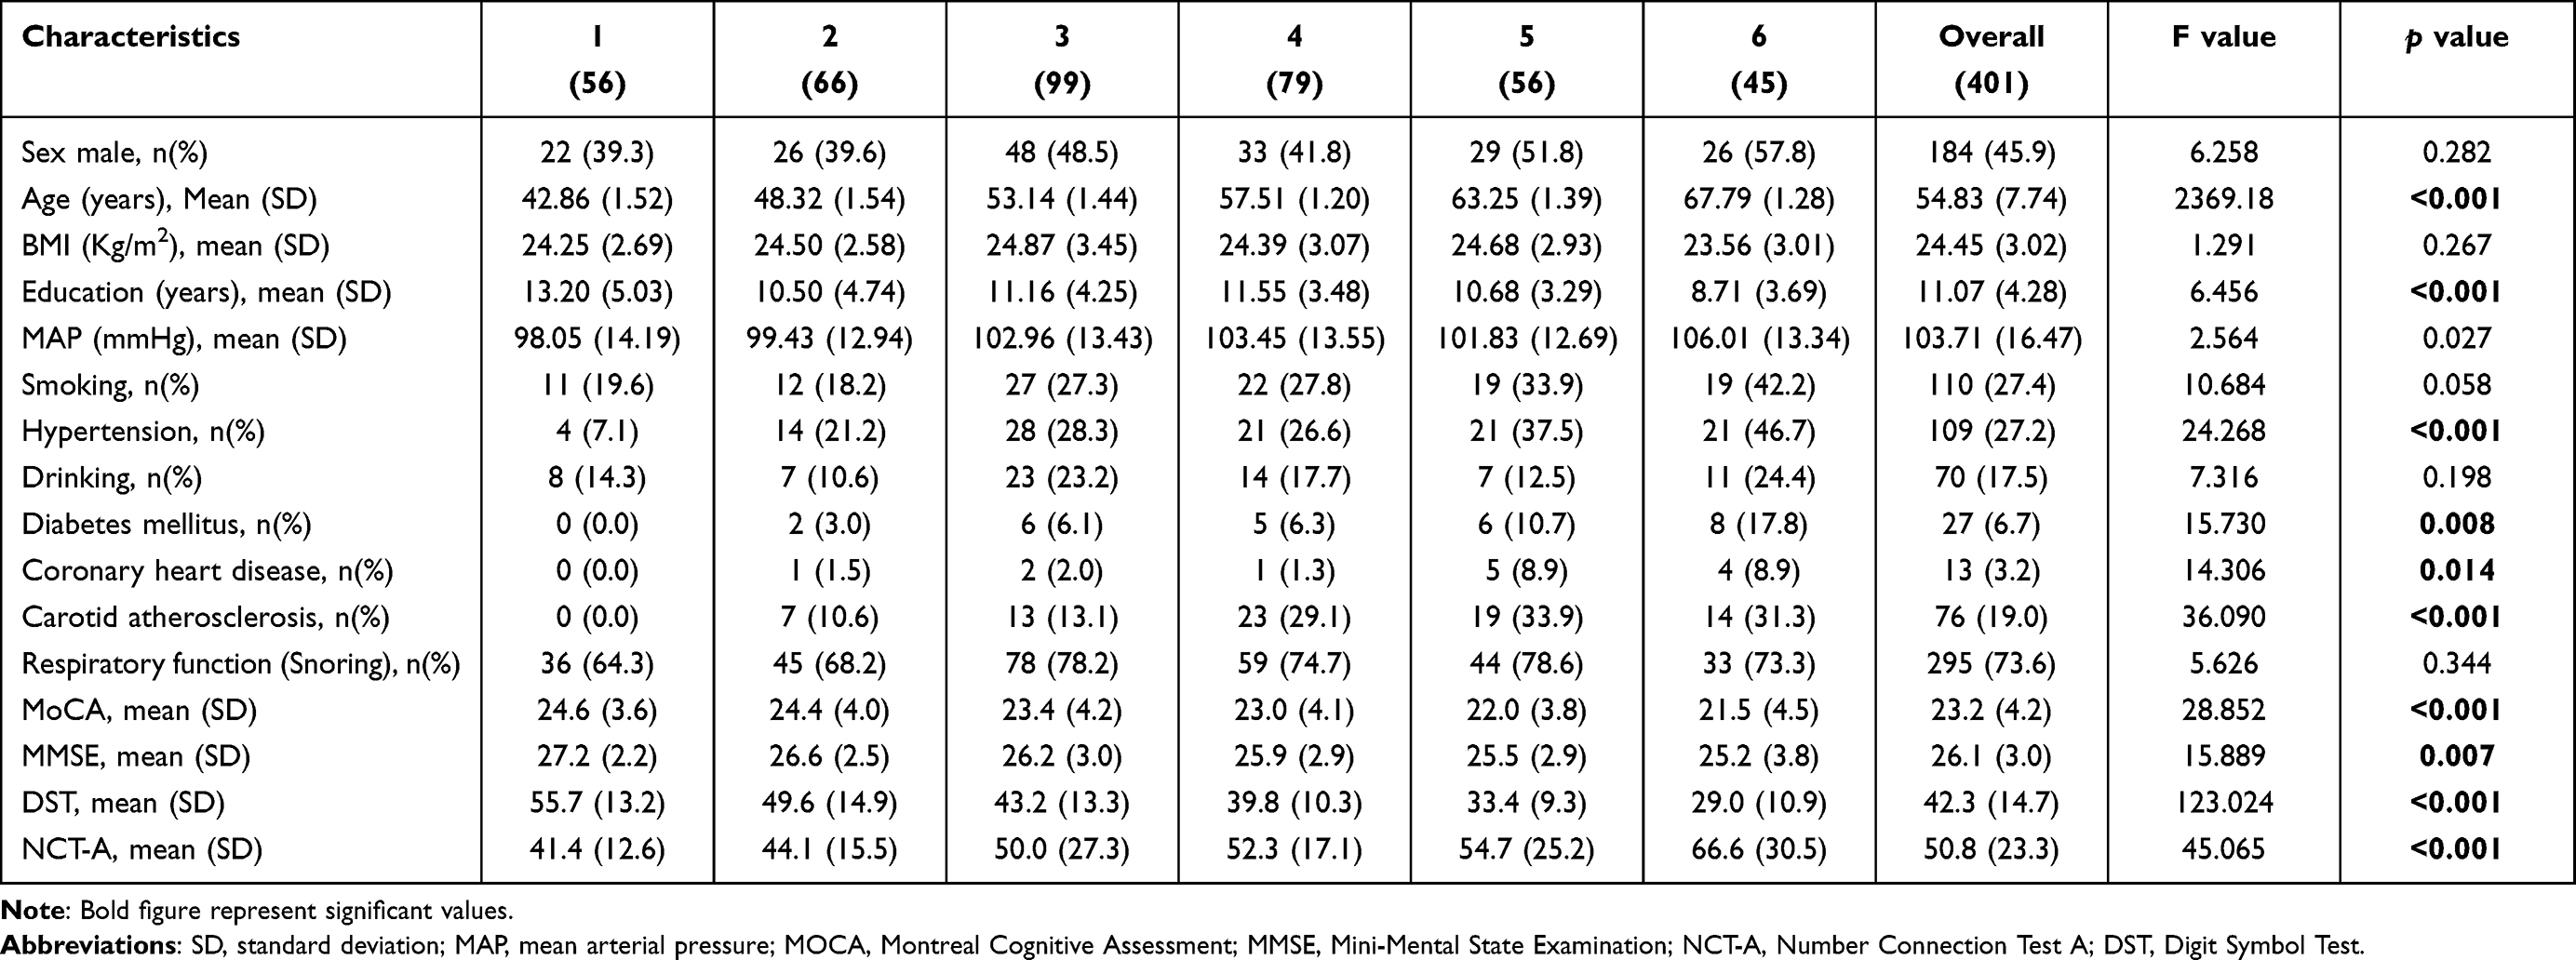 |
Table 1 Baseline Characteristics of the Study Participants |
Distribution Frequency of Neuroimaging Markers in Different Age Strata
The data were divided into 6 groups according to age at 5-year interval. The general information of each group is shown in Table 2. The incidence of LI was 8.7% (35 cases), CMB was 11.7% (47 cases) among 401 enrolled participants. The incidence of WMH was 82.5% (331 cases), of which 18.7% in 1–5 group, 12.9% in 6–12 group, 15.9% in 13–26 group, 14.4% in >26 group, 14.7% in Fazekas 2 group and 5.7% in Fazekas 3 group, respectively. The incidence of EPVS was 74.8%, of which 22.4% in 1–3 group, 17.9% in 4–6 group, 17.7% in 7–13 group, and 16.7% in >13 group, respectively. The incidence of BA was 56.2%, of which 56.2% in whole brain, 41.9% in temporal lobe and hippocampus, 40.2% in parietal lobe, and 47.4% in frontal and temporal lobes, respectively. The incidence of CMB did not show a regular pattern in each age group.
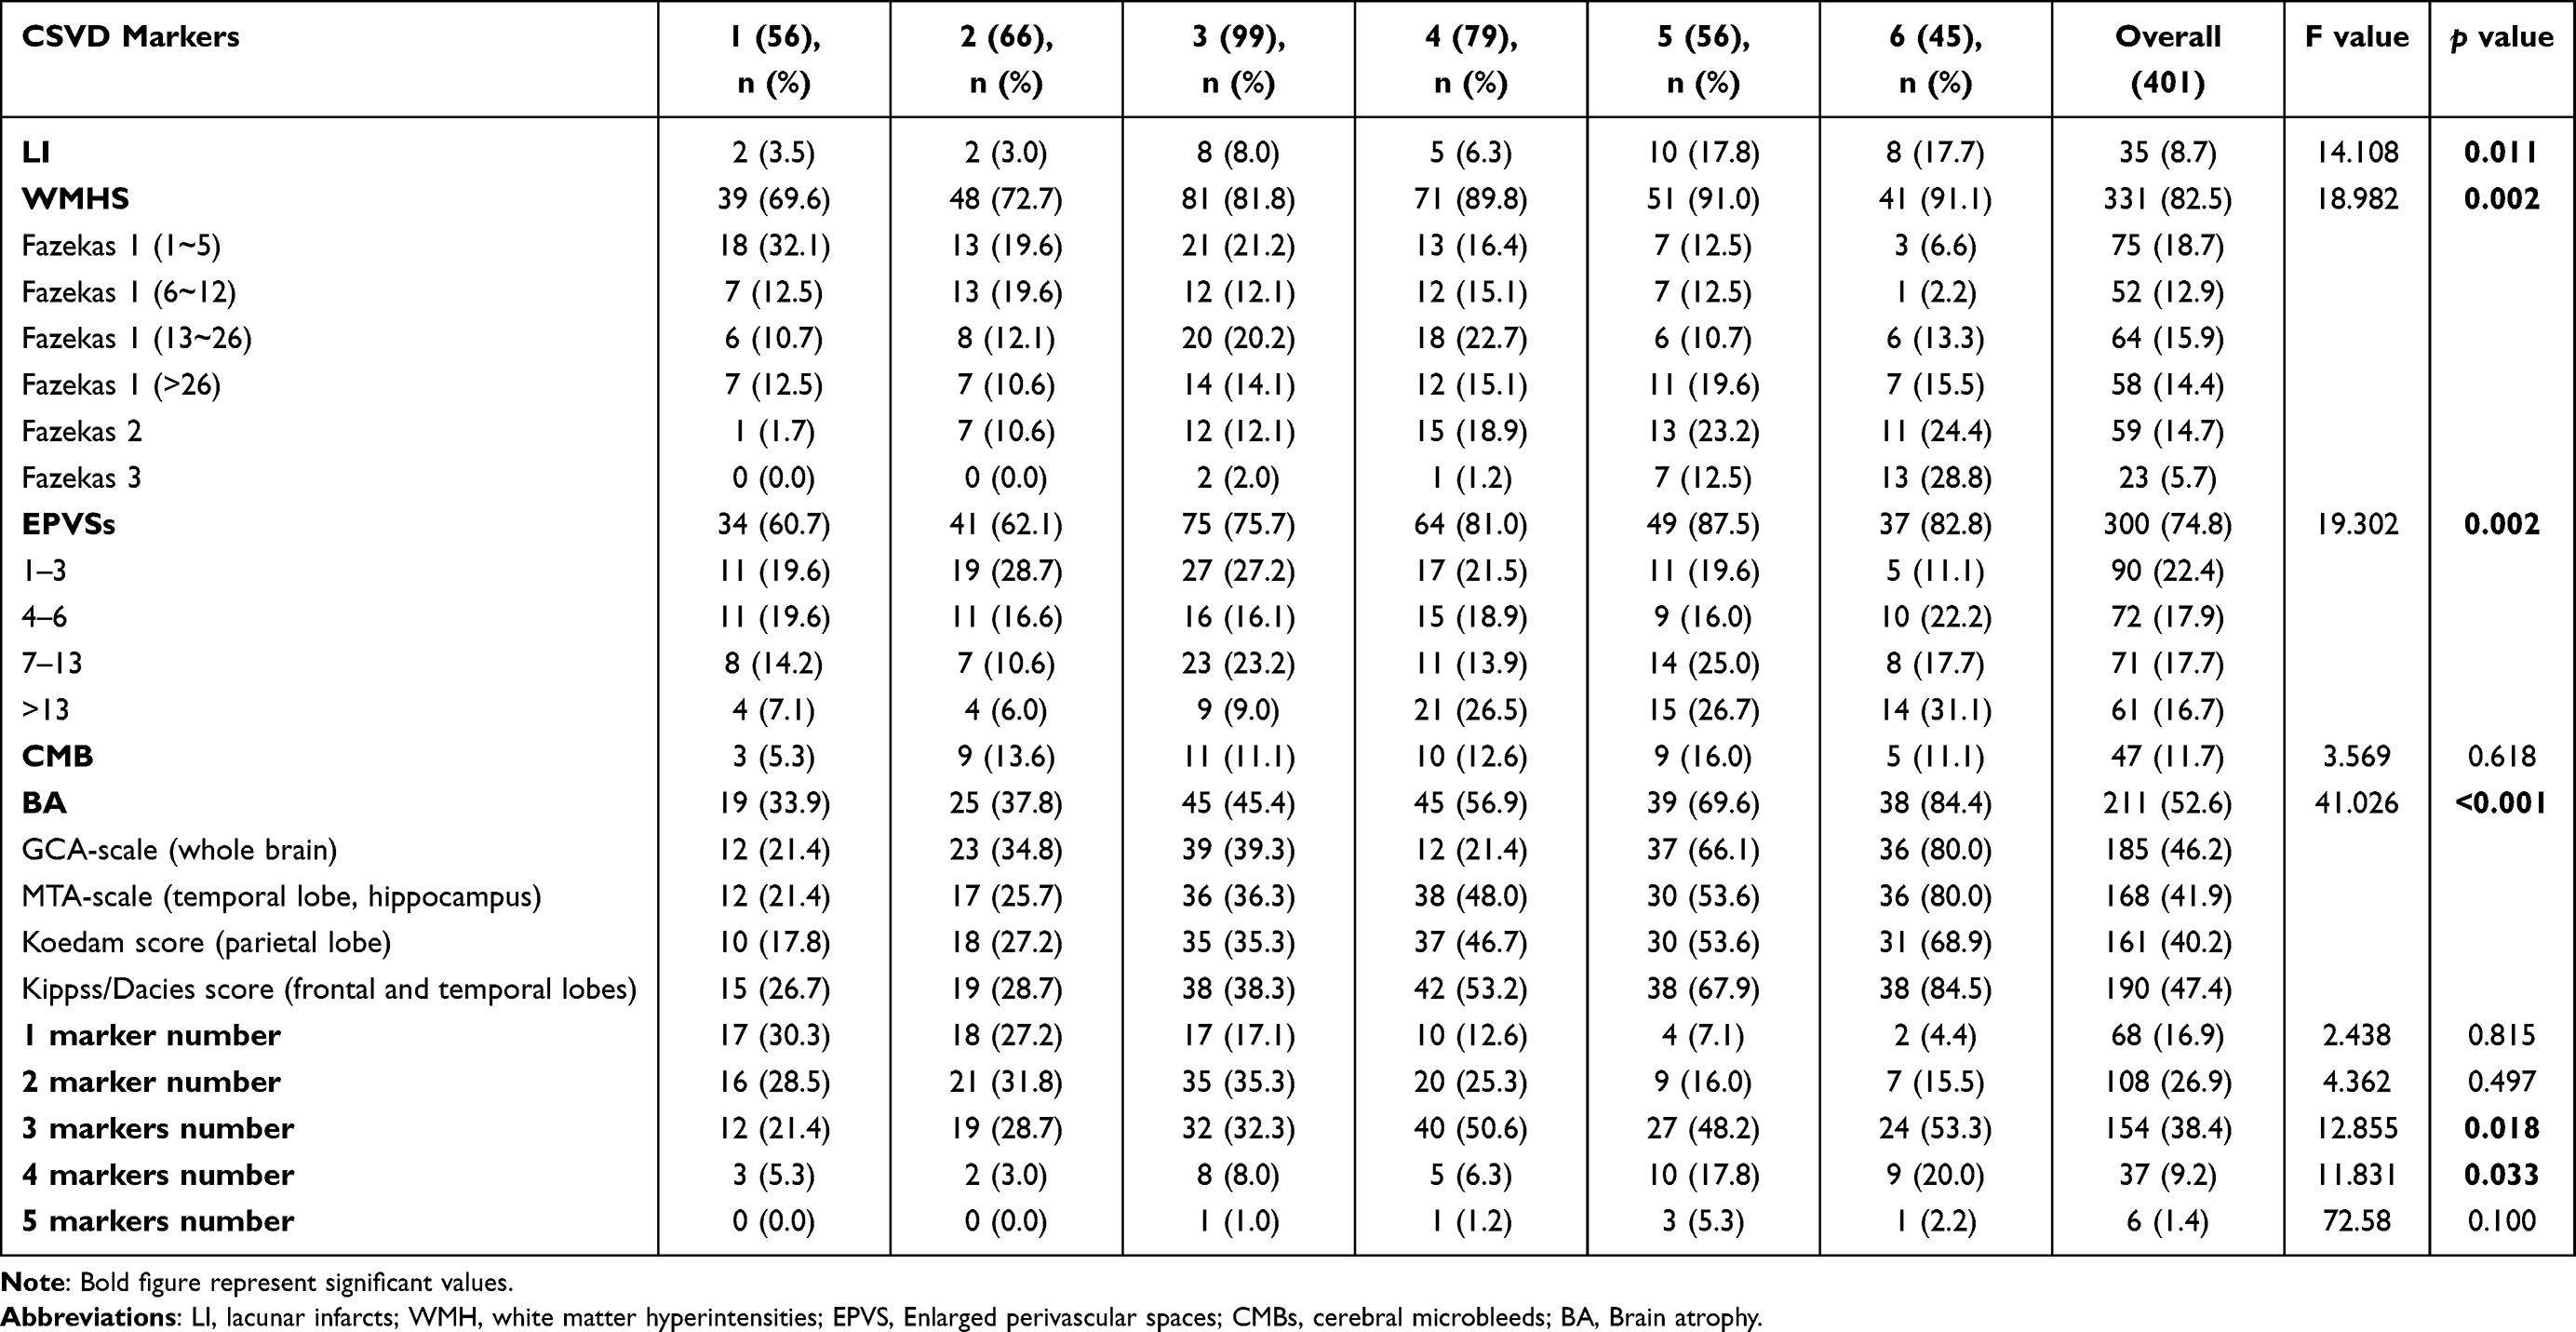 |
Table 2 Presence of SVD Markers in Different Age Strata |
Even in the younger age group (40–50y), there are also many CVSD markers, of which mainly WMH, EPVS and BA, with incidence rates of 69.6%, 60.7% and 33.9%, respectively (Table 2 and Figure 1). With the increase of age, the incidence of LI, BA, WMH and EPVS increased continuously. The incidence of WMH and EPVS reached a peak and tended to be stable around 60 years of age, with the incidence of 91.0% and 87.5% in 60–65y. The incidence of BA increased continuously with age (Table 2 and Figure 1).
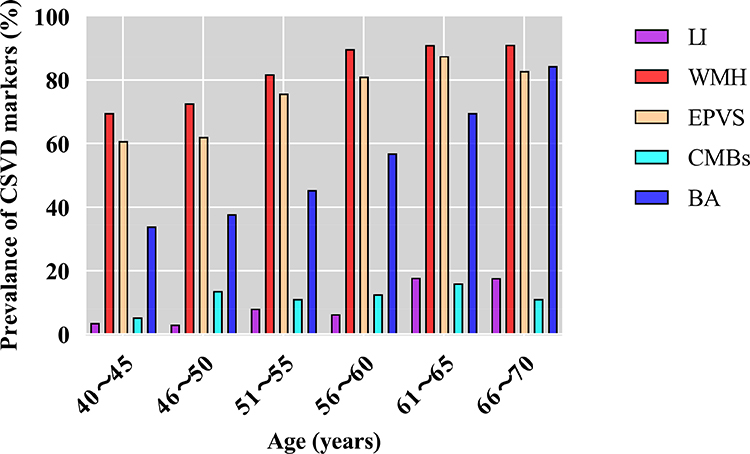 |
Figure 1 Proportion of different CSVD markers in different age groups. Abbreviations: CSVD, cerebral small vessel disease; LI, lacunar infarcts; WMH, white matter hyperintensities; EPVS, enlarged perivascular spaces; CMBs, cerebral microbleeds; BA, brain atrophy. |
The incidence of the mild WMH (1–5 and 6–12) decreased with age, while the incidence of Fazekas grade 2 and 3 increased with age (Table 2). The same tendency occurred in EPVS. The proportion of the group of (1–3) in EPVS decreases with age, while that of the group of (>13) in EPVS increases with age (Table 2). With respect to the number of CVSD markers, the presence of 1 and 2 markers gradually declines with increasing of age, the presence of 3 and 4 markers gradually increases with age. The prevalence of 1 marker is 30.4% in 40–45 age group and descend to 4.4% in 65–70 age group, by contrary, the prevalence of 4 markers is 5.4% in 40–45 age group and increased to 20% in 65–70 age group. The incidence of 3 CSVD imaging markers was the highest (38.4%) among 5 imaging numbers, which was stable at about 50% in people over 60 years old (Table 2 and Figure 2).
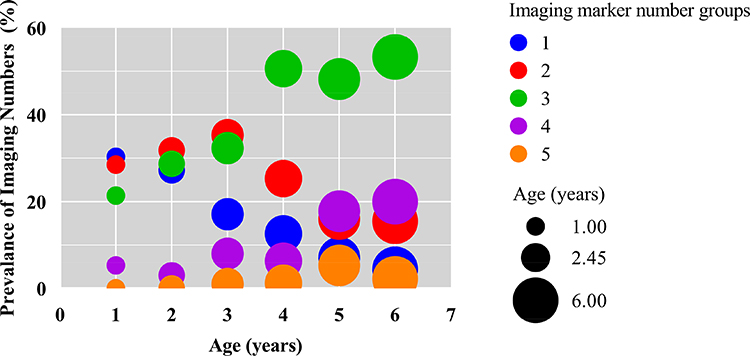 |
Figure 2 Distribution of different imaging markers in different age groups. |
Associations Between Age, Neuroimaging Markers and Psychometric Tests
The average scores of the four psychometric tests stratified by age are shown in Table 1. The study shows coincident results in MoCA and MMSE, the same outcome appears in NCT-A and DST. The performance results of NCT-A and DST are significant difference in 6 age groups, in addition, linear decline of the neuropsychological function reflected by NCT-A and DST was observed (Figure 3). We next tested associations between age, neuroimaging markers and NCT-A (DST) variables using a linear regression model (LRM), and fully adjusted LRM results indicated that age was more associated with NCT-A (DST) variables as compared to neuroimaging numbers (Table 3 and Figure 4). The standard correction coefficients between different age groups increased with age. After controlling for imaging CSVD marker numbers, gender, education, and risk factors for CSVD, the score of the neuropsychological scale, especially the DST scale, standard correction coefficients was estimated from −7.975.41 (−11.285 to-4.665) to −16.532 (−20.804 to −12.261) from 51 ~ 55 to 66 ~ 70 years old. Before adjustment, 3 and 4 marker groups were associated with DST (−9.250 [−14.962 to −3.538] and −14.125 [−20.877 to −7.373]), they were associated with NCT-A (12.3950 [3.1832 to 21.607] and 17.311 [6.422 to 28.200]), and no association between neuroimaging markers numbers and NCT-A (DST) variables was found after full adjustment. Table 4 and Figure 5 shows that after controlling for imaging markers, gender, education and risk factors of cerebrovascular diseases, the Odds ratio (95% CI) of DST scale from 51–55 to 66–70 years ranges from −8.223 (- 11.504 to −4.942) to −16.188 (- 20.456 to −11.920). Linear regression analysis of CSVD imaging marker showed that BA was an independent risk factor associated with NCT-A (DST) variables (- 2.929 [−5.094 to −0.765]).
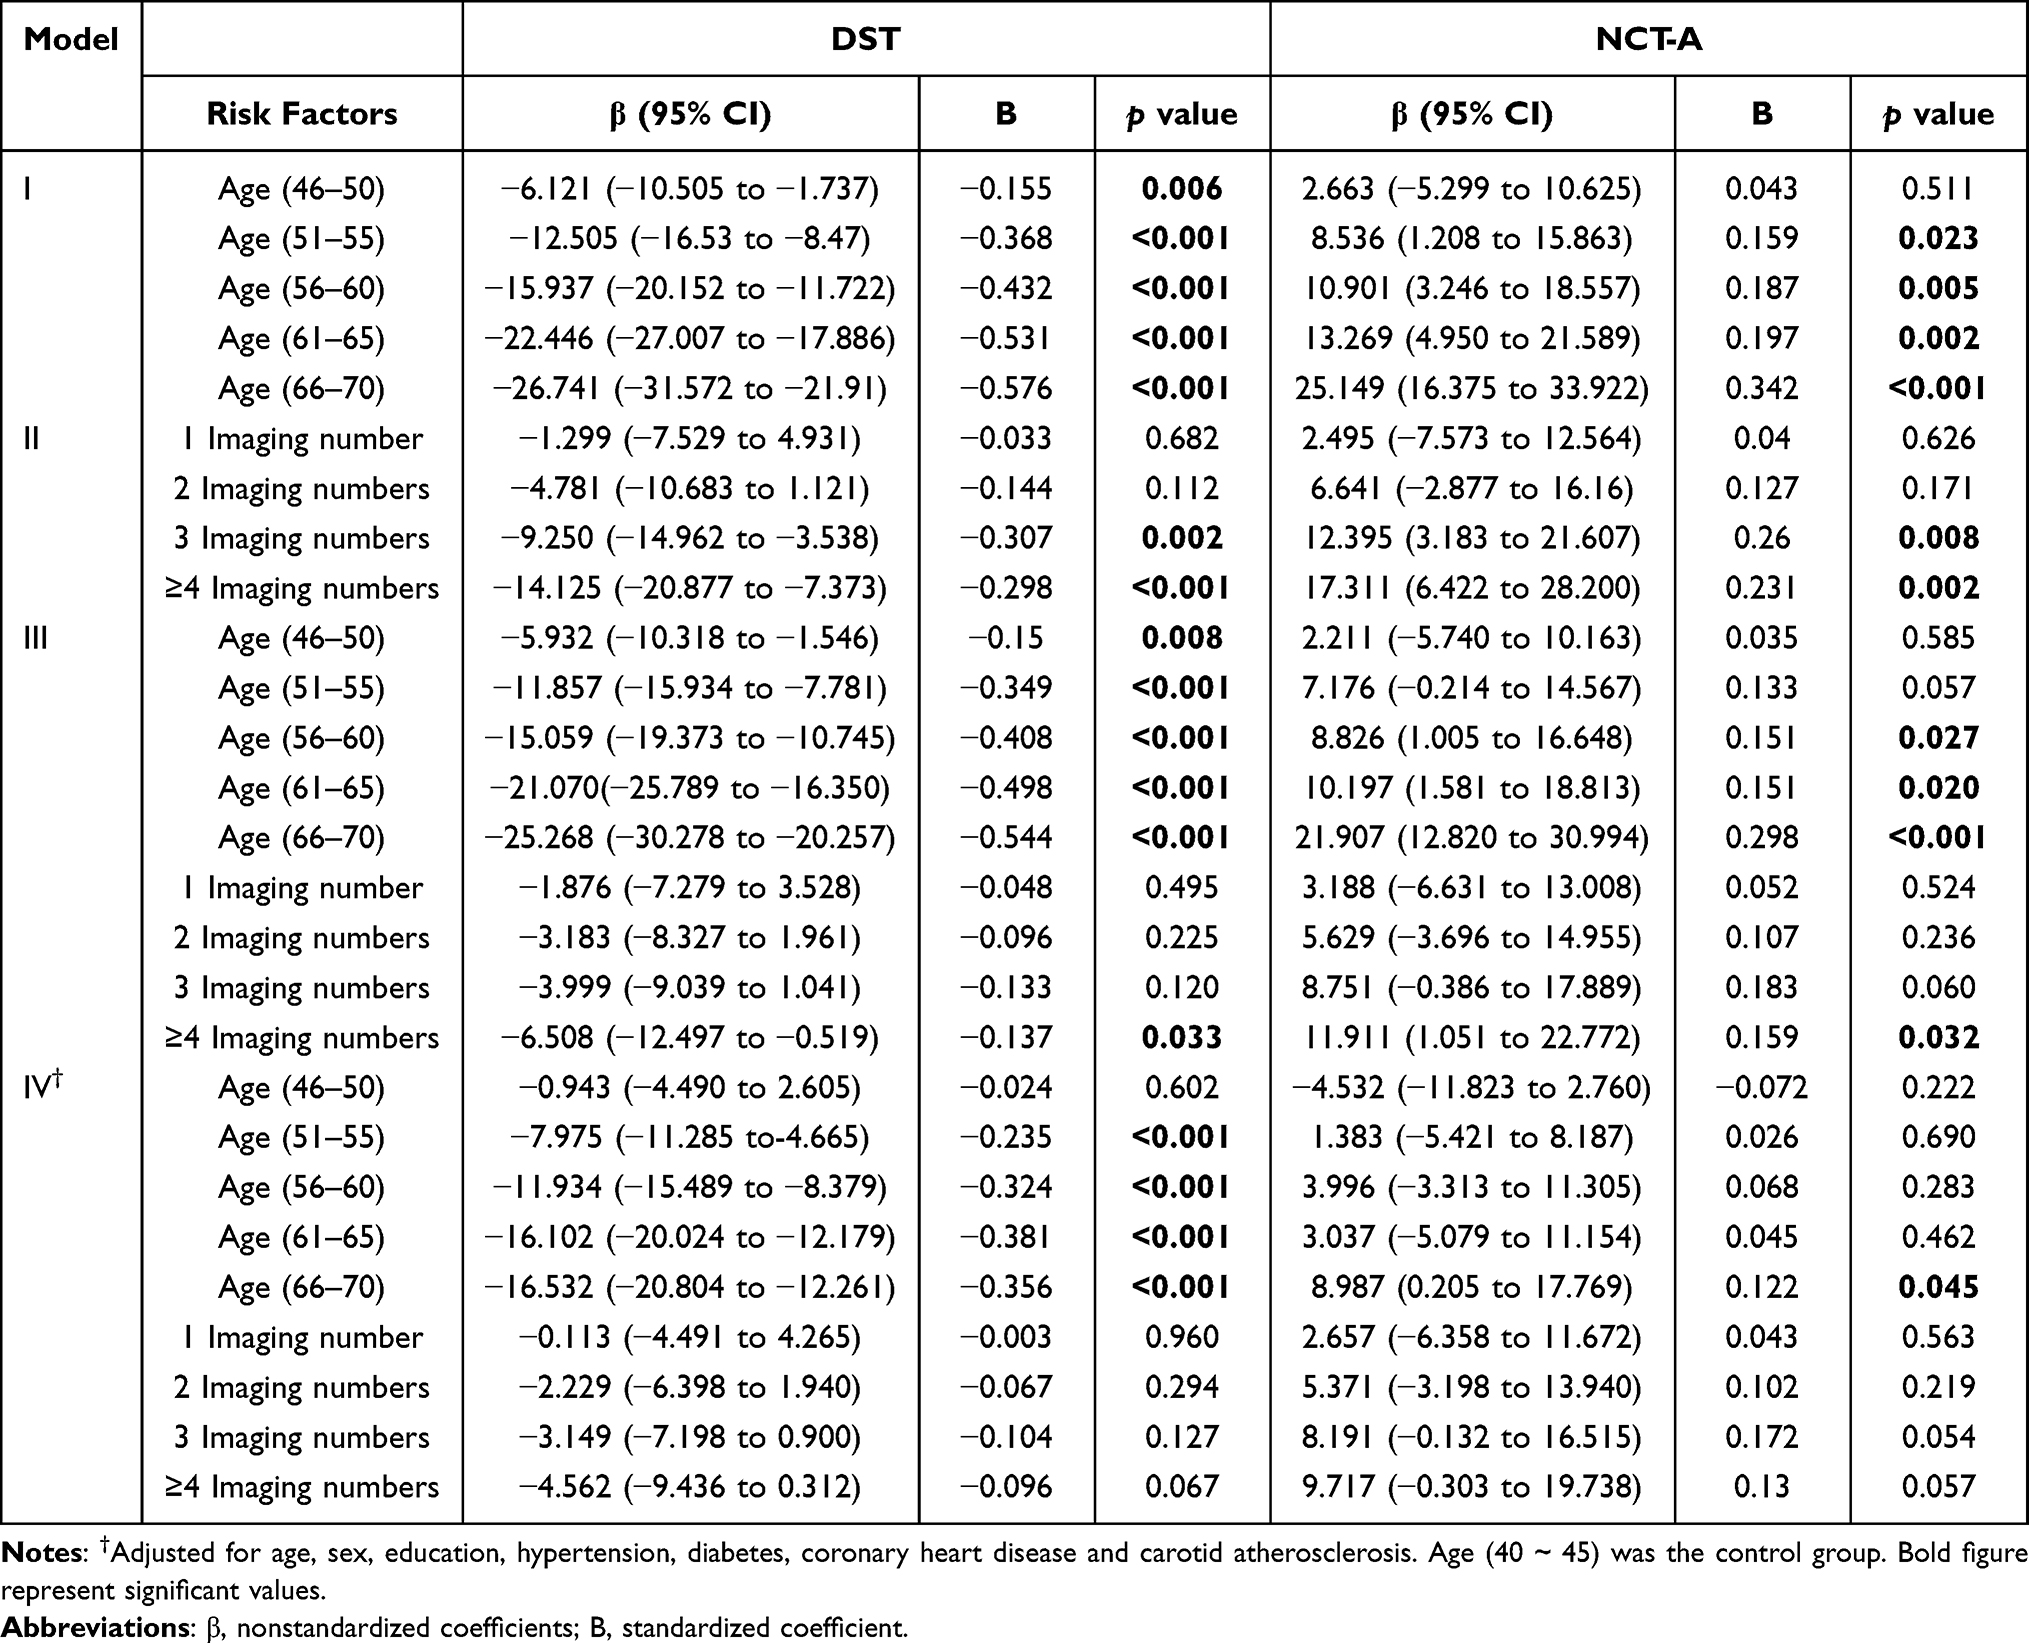 |
Table 3 Association of Age and Number of CSVD with NCT-A (DST) Variables |
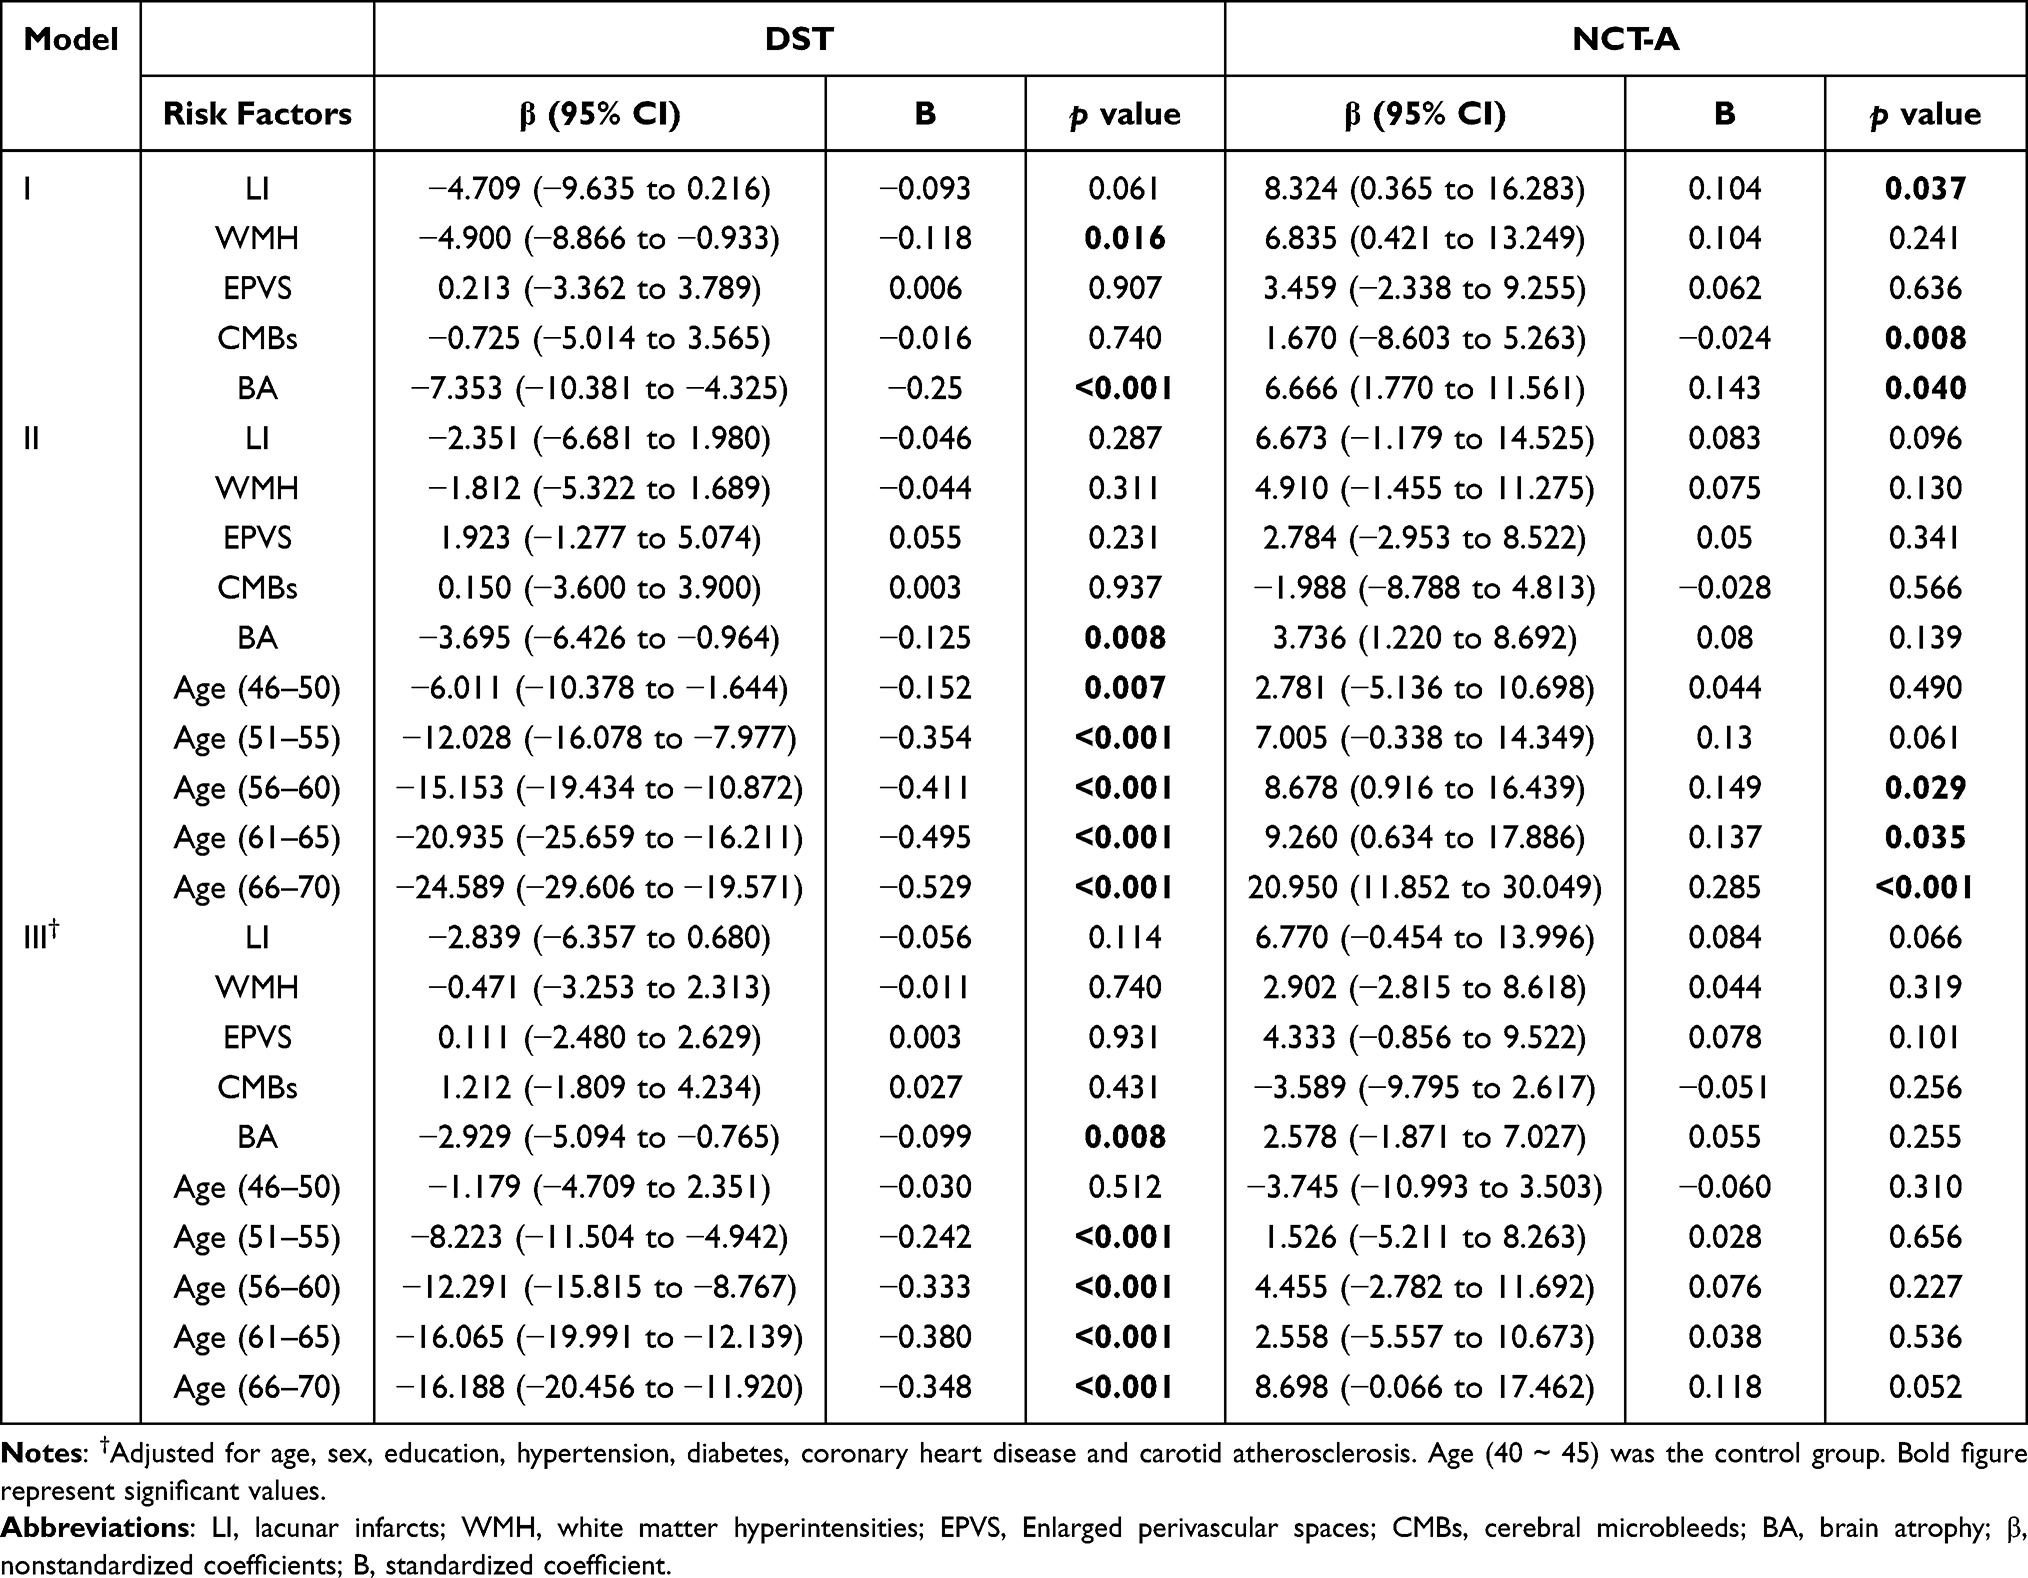 |
Table 4 Association of Age and CSVD Markers with NCT-A (DST) Variables |
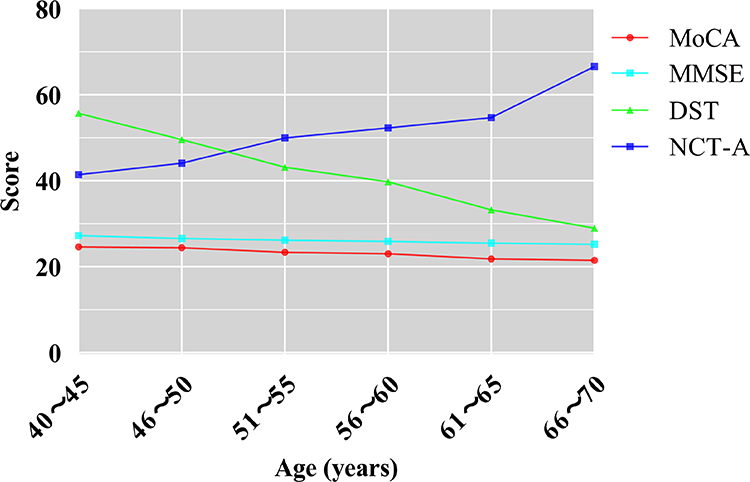 |
Figure 3 Line chart of the scores of different neuropsychological scales in different age groups. Abbreviations: MoCA, Montreal Cognitive Assessment; MMSE, Mini-Mental State Examination; NCT-A, Number Connection Test A; DST, Digit Symbol Test. |
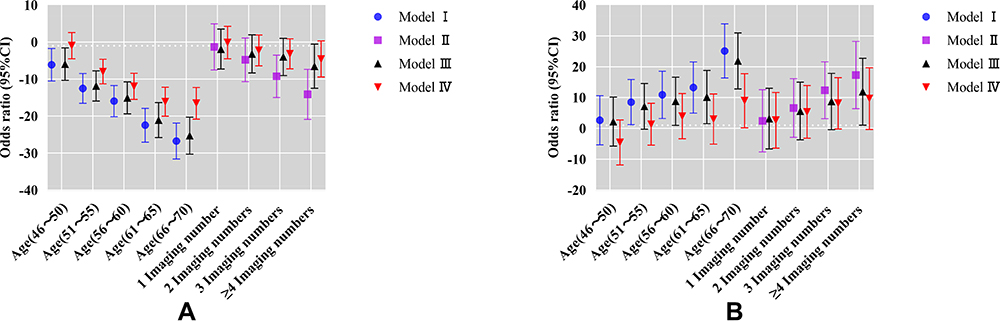 |
Figure 4 (A) Assosiation of age and numbers of cerebral vessel disease markers with DST variables; (B) Association of age and numbers of cerebral vessel disease markers with NCT-A variables. Model I, relationship between age and NCT-A (DST) executive function; Model II, relationship between imaging numbers and NCT-A (DST) executive function; Model III, correlation between age as well as imaging numbers and NCT-A (DST) execution; Model IV, adjusted for age, sex, education, hypertension, diabetes, Coronary heart disease and carotid atherosclerosis for Model III. |
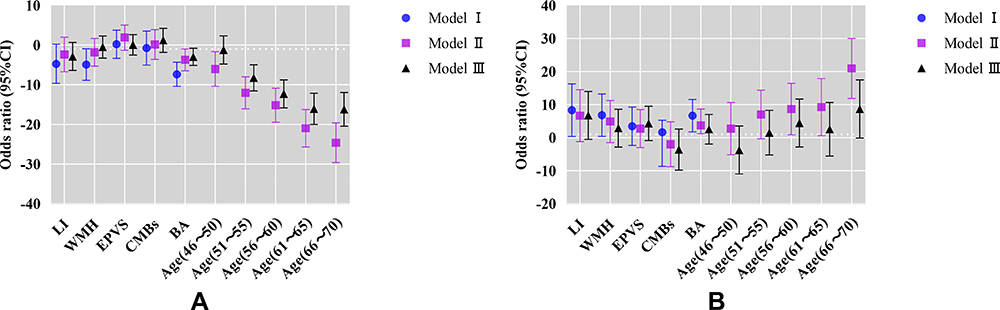 |
Figure 5 (A) Assosiation of age and cerebral vessel disease markers with DST variables; (B) Association of age and cerebral vessel disease markers with NCT-A variables.. Model I, relationship between CSVD markers and NCT-A (DST) variables; Model II, correlation between age as well as CSVD markers and NCT-A (DST) execution; Model III, adjusted for age, sex, education, hypertension, diabetes, coronary heart disease and carotid atherosclerosis for Model II. |
Discussion
This study found that there are more CVSD imaging markers even in people under 50 years old. The neuropsychological function reflected by NCT-A (DST) variables linear decline with aging. Linear regression found that age was an important factor affecting NCT-A (DST) variables, and the standard correction coefficients among different age groups increased gradually with age. In addition, BA is an independent factor affecting NCT-A (DST) variables.
The present study found that the incidence of WMH is highest among 5 imaging markers, followed by EPVS and BA, which was similar to the results of Shunyi cohort based on Chinese community.10 Previous study has demonstrated that age was a determining factor for CSVD progression.19 This study found that the incidence of severe EPVS (the group of >13) and WMH (Fazekas 2, 3) increased with age. Kynast et al reported that the prevalence of WMH increases exponentially with age, with 11–21% of adults in their mid-60s, and more than 90% of the healthy elderly older than 80 years are affected.20 Charidimou et al reported that age was the only significant independent predictor of increasing EPVS severity in the centrum semiovale, for every 10 years increase in age, the odds of having an increase in centrum semiovale EPVS was 1.5.21 In contrast, we not only stretched the age width of the enrolled population, but also stratified the age and the severity of WMH and EPVS in the order of increasing degree. Our study also found that the incidence of LI increased with age, and there was a node with a sudden increase in the 60–65 age group. It has been reported that LI correspond to more severe small vessel changes, mortality, and poor cognitive function of CVSD,22 and may be an important predictor of future cognitive decline in CVSD patients.23 The appearance of LI may be a warning signal that CSVD has developed to a severe period, and it is also a consequence of the disease deterioration. Previous studies have suggested that CMBs frequency increased with age, reported in 17.8% of those aged 60 to 69 years and 38.3% of those aged 80 to 99 years,24 but we did not find any regularity in the incidence of CMBs in our age stratified study. Another intriguing aspect of our study is that BA rate 35.7% in 40–45 age group, and appeared to progress linearly with aging in all age strata. It had been reported that the decrease of brain volume with aging may start between age 30 and 40 years.25 Another study suggests that, while gray matter volume decreases linearly from the second decade, white matter volume follows a quadratic pattern with a peak value around age 40 years.26 The atrophy rate is moderate at 40 years an estimated about 0.2% per year, and it accelerates progressively with aging reaching after 70 years of age about 0.5% per year.27
Previous studies have noted the possibility of overlaps of image markers and cumulative or synergistic effects.1 In recent years, it has been advocated to study CSVD with total load as a variable,28 or even to consider CSVD as a whole brain disease.29 We studied the number of image markers by age stratification and found that there were also individuals with multiple markers even in young people. The incidence of 3 or 4 markers increased with age, while that of single or 2 markers decreased with age.
All in all, the imaging marker shows a certain progression regularity with the increase of age, but it cannot be ignored that there is a high incidence of CSVD even in people aged 40–45 years. Although mild WMH and EPVS are predominant, LI, CMB, and BA have all appeared in this age group, and even four or five markers coexist. Therefore, CSVD is not just an elder-related disease. Its prevention and treatment needs to be stretched to an earlier age.
Another result of our studies shows that NCT-A (DST) is more sensitive than MoCA (MMSE) in detecting brain dysfunction at an early stage and mild CSVD. MoCA (MMSE) tests multiple cognitive domains, NCT-A (DST) tests for psychomotor function, attention and processing speed, they tend to be very sensitive and are an early indicator.30 Our study shows that the results of NCT-A (DST) are significant difference in 6 age strata, in addition, linear decline with time of the neuropsychological function reflected by NCT-A (DST) was observed. Age is a recognized influencing factor for CSVD, and the incidence of BA increases with age, BA appear not only a key marker of CSVD but also a key marker of aging.25 They can both cause cognitive impairments; therefore, we conducted a linear regression study of the effects and inter-dependency of age, image markers, and number of markers on neuropsychological function. Interestingly, we found that the number of image markers (equivalent to total load) was not associated with NCT-A (DST) variables after full adjustment. Several studies have previously reported that CSVD marker numbers or total load of CSVD impacts multiple cognitive domains and increases the risk of dementia and cognitive decline.31–34 Most of these studies were in older or specific populations (eg, stroke, hypertension people et al.). Before adjustment, we did find 3 image markers and 4 marker group associated with NCT-A (DST) variables, after age adjustment, only 4 marker group remained statistically significant. After full adjustment, the statistical difference of the 4 marker group disappeared. The results show that only when the CSVD is severe enough does a certain statistical abnormality appear, which also indicates that methods based solely on the number of markers are not necessarily highly sensitive because the weights of neuropsychological abnormalities caused by each image marker are not equipotent. Regression analysis of individual image marker revealed that only BA and WMH were associated with NCT-A (DST) variables. After full adjustment, only BA was found to be an important influencing factor for NCT-A (DST) variables. Age was also an important influencing factor for NCT-A (DST) variables, and the standard correction coefficients between different age groups increased with aging, and the incidence of BA increased linearly with the same tendency. Age, as a time factor, may not directly affect the decline of brain function and can be detected by neuropsychological scales. Age may represent a cumulative time course of aging-induced neurodegenerative diseases and persistent white matter damage caused by CVSD. BA may be an outcome variable for these chronic injurious processes. Previous studies have noted that the progression and speed of global, cortical, and subcortical brain atrophy in non-dementia patients are associated with cognitive deterioration and conversion to Alzheimer’s disease.35,36 Cognitive impairment due to aging neurodegeneration and cognitive impairment due to CSVD have traditionally been recognized as independent clinical and pathophysiological entities. However, there is increasing evidence that there is overlap between the pathways that cause cognitive decline in CSVD and neurodegenerative processes.37,38 Several studies have observed an association between WMH and progression of BA,39–41 suggesting that CSVD may cause cognitive impairment through BA. Pathophysiological processes vary from cause to cause. Patients with symptomatic CSVD, silent vascular lesions, or imaging-negative ischemia have a different course of brain volume loss and cerebrovascular lesion development.42 But this does not preclude the fact that BA would be their common outcome. Therefore, BA outperforms all other lesions in predicting cognitive outcome and disability in CSVD.25 Thus, measurement of BA may capture all these pathological processes observed in elderly people related to cognitive and motor decline developing with aging.
There are still some limitation. First, it is a cross-sectional study, which is less effective than longitudinal follow-up studies, and the sample size is relatively insufficient, but we deliberately paid attention to sex and age matching between different age groups during participant recruitment, potentially partially reducing this bias. Neuropsychological scales used in present study only reflected the multiple cognitive domains, psychomotor function, attention and processing speed, and no scale battery was used.
Conclusion
In conclusion, there are many CVSD markers even in young adults, and the incidence and number of CVSD imaging markers increase with age. Age is an independent factor affecting the NCT-A and DST variables, aging and CSVD may ultimately affect cognitive function through BA.
Abbreviations
CSVD, cerebral small vessel disease; MoCA, Montreal Cognitive Assessment; MMSE, Mini-mental State Examination; NCT-A, Number Connection Tests A; DST, Digital Symbol Test; BA, brain atrophy; LI, lacunar infarct; WMH, white matter hyperintensity; EPVS, enlargement perivascular spaces; CMBs, cerebral microbleeds; BMI, body mass index; SBP, systolic blood pressure; DBP, diastolic blood pressure; MAP, Mean arterial pressure.
Data Sharing Statement
The datasets used in this study are available from the corresponding authors on reasonable request.
Ethics Approval and Informed Consent
This study was approved by the Ethics Committee of the Nanxishan Hospital of Guangxi Zhuang Autonomous Region (2020NXSYEC-006), which was conducted in conformity to the principles and guidelines set out in Declaration of Helsinki. Informed consent was obtained either from the participants.
Acknowledgments
The authors thank the dedicated CSVD Project participants, their loved ones, and the devoted staff and trainees who contributed to recruitment, screening, and enrollment of the cohort. This paper has not been presented anywhere, and is not being considered for publication elsewhere.
Author Contributions
All authors made substantial contributions to conception and design, acquisition of data, or analysis and interpretation of data; took part in drafting the article or revising it critically for important intellectual content; gave final approval of the version to be published; agreed on the journal to which the article will be submitted; and agree to be accountable for all aspects of the work.
Funding
This study was sponsored by the Project of Health Commission of Guangxi Zhuang Autonomous Region (Z20190997, Z20191023), Social Development Program of Guilin Science and Technology Bureau (2020011206-7) and Graduate Student Innovation Program of Guilin Medical University (GYYK2021018).
Disclosure
The authors report no conflicts of interest in this work.
References
1. Wardlaw JM, Smith C, Dichgans M. Mechanisms of sporadic cerebral small vessel disease: insights from neuroimaging. Lancet Neurol. 2013;12(5):483–497. doi:10.1016/S1474-4422(13)70060-7
2. Wardlaw JM, Smith EE, Biessels GJ, et al. Neuroimaging standards for research into small vessel disease and its contribution to ageing and neurodegeneration. Lancet Neurol. 2013;12(8):822–838. doi:10.1016/S1474-4422(13)70124-8
3. Poels MM, Vernooij MW, Ikram MA, et al. Prevalence and risk factors of cerebral microbleeds: an update of the Rotterdam scan study. Stroke. 2010;41(10 Suppl):S103–S106. doi:10.1161/STROKEAHA.110.595181
4. Simoni M, Li L, Paul NL, et al. Age- and sex-specific rates of leukoaraiosis in TIA and stroke patients: population-based study. Neurology. 2012;79(12):1215–1222. doi:10.1212/WNL.0b013e31826b951e
5. Hilal S, Mok V, Youn YC, et al. Prevalence, risk factors and consequences of cerebral small vessel diseases: data from three Asian countries. J Neurol Neurosurg Psychiatry. 2017;88(8):669–674. doi:10.1136/jnnp-2016-315324
6. Li Y, Liu N, Huang Y, et al. Risk factors for silent lacunar infarction in patients with transient ischemic attack. Med Sci Monit. 2016;22:447–453. doi:10.12659/msm.895759
7. Smajlović D. Strokes in young adults: epidemiology and prevention. Vasc Health Risk Manag. 2015;11:157–164. doi:10.2147/VHRM.S53203
8. Müller K, Courtois G, Ursini MV, et al. New insight into the pathogenesis of cerebral small-vessel diseases. Stroke. 2017;48(2):520–527. doi:10.1161/STROKEAHA.116.012888
9. Fan H, Hao X, Yang S, et al. Study on the incidence and risk factor of silent cerebrovascular disease in young adults with first-ever stroke. Medicine (Baltimore). 2018;97(48):e13311. doi:10.1097/MD.0000000000013311
10. Han F, Zhai FF, Wang Q, et al. Prevalence and risk factors of cerebral small vessel disease in a Chinese population-based sample. J Stroke. 2018;20(2):239–246. doi:10.5853/jos.2017.02110
11. Satizabal CL, Zhu YC, Mazoyer B, Dufouil C, Tzourio C. Circulating IL-6 and CRP are associated with MRI findings in the elderly: the 3C-Dijon study. Neurology. 2012;78(10):720–727. doi:10.1212/WNL.0b013e318248e50f
12. Prins ND, Scheltens P. White matter hyperintensities, cognitive impairment and dementia: an update. Nat Rev Neurol. 2015;11(3):157–165. doi:10.1038/nrneurol.2015.10
13. Chen X, Wang J, Shan Y, et al. Cerebral small vessel disease: neuroimaging markers and clinical implication. J Neurol. 2019;266(10):2347–2362. doi:10.1007/s00415-018-9077-3
14. Fazekas F, Chawluk JB, Alavi A, et al. MR signal abnormalities at 1.5 T in Alzheimer’s dementia and normal aging. AJR Am J Roentgenol. 1987;149(2):351–356. doi:10.2214/ajr.149.2.351
15. Yates PA, Villemagne VL, Ellis KA, et al. Cerebral microbleeds: a review of clinical, genetic, and neuroimaging associations. Front Neurol. 2014;4:205. doi:10.3389/fneur.2013.00205
16. Li Q, Yang Y, Reis C, et al. Cerebral small vessel disease. Cell Transplant. 2018;27(12):1711–1722. doi:10.1177/0963689718795148
17. Shi Y, Li S, Li W, et al. MRI lesion load of cerebral small vessel disease and cognitive impairment in patients with CADASIL. Front Neurol. 2018;9:862. doi:10.3389/fneur.2018.00862
18. Shieh G. Choosing the best index for the average score intraclass correlation coefficient. Behav Res Methods. 2016;48(3):994–1003. doi:10.3758/s13428-015-0623-y
19. Yang S, Yuan J, Qin W, et al. Twenty-four-hour ambulatory blood pressure variability is associated with total magnetic resonance imaging burden of cerebral small-vessel disease. Clin Interv Aging. 2018;13:1419–1427. doi:10.2147/CIA.S171261
20. Kynast J, Lampe L, Luck T, et al. White matter hyperintensities associated with small vessel disease impair social cognition beside attention and memory. J Cereb Blood Flow Metab. 2018;38(6):996–1009. doi:10.1177/0271678X17719380
21. Charidimou A, Meegahage R, Fox Z, et al. Enlarged perivascular spaces as a marker of underlying arteriopathy in intracerebral haemorrhage: a multicentre MRI cohort study. J Neurol Neurosurg Psychiatry. 2013;84(6):624–629. doi:10.1136/jnnp-2012-304434
22. Ghaznawi R, Geerlings MI, Jaarsma-Coes MG, et al. The association between lacunes and white matter hyperintensity features on MRI: the SMART-MR study. J Cereb Blood Flow Metab. 2019;39(12):2486–2496. doi:10.1177/0271678X18800463
23. Benjamin P, Trippier S, Lawrence AJ, et al. Lacunar infarcts, but not perivascular spaces, are predictors of cognitive decline in cerebral small-vessel disease. Stroke. 2018;49(3):586–593. doi:10.1161/STROKEAHA.117.017526
24. Vernooij MW, van der Lugt A, Ikram MA, et al. Prevalence and risk factors of cerebral microbleeds: the Rotterdam Scan study. Neurology. 2008;70(14):1208–1214. doi:10.1212/01.wnl.0000307750.41970.d9
25. Chabriat H, Jouvent E. Imaging of the aging brain and development of MRI signal abnormalities. Rev Neurol (Paris). 2020;176(9):661–669. doi:10.1016/j.neurol.2019.12.009
26. Courchesne E, Chisum HJ, Townsend J, et al. Normal brain development and aging: quantitative analysis at in vivo MR imaging in healthy volunteers. Radiology. 2000;216(3):672–682. doi:10.1148/radiology.216.3.r00au37672
27. Peters R. Ageing and the brain. Postgrad Med J. 2006;82(964):84–88. doi:10.1136/pgmj.2005.036665
28. Huijts M, Duits A, van Oostenbrugge RJ, et al. Accumulation of MRI markers of cerebral small vessel disease is associated with decreased cognitive function. A study in first-ever lacunar stroke and hypertensive patients. Front Aging Neurosci. 2013;5:72. doi:10.3389/fnagi.2013.00072
29. Hamilton OKL, Cox SR, Okely JA, et al. Cerebral small vessel disease burden and longitudinal cognitive decline from age 73 to 82: the Lothian Birth Cohort 1936. Transl Psychiatry. 2021;11(1):376. doi:10.1038/s41398-021-01495-4
30. Bajaj JS, Wade JB, Sanyal AJ. Spectrum of neurocognitive impairment in cirrhosis: implications for the assessment of hepatic encephalopathy. Hepatology. 2009;50(6):2014–2021. doi:10.1002/hep.23216
31. Fan Y, Hou C, Peng L, et al. Twenty-four-hour ambulatory blood pressure variability associated with cerebral small vessel disease MRI burden and its progression in inpatients with cerebrovascular disease. Front Neurol. 2020;11:513067. doi:10.3389/fneur.2020.513067
32. Chen YC, Wei XE, Lu J, et al. Correlation between the number of lenticulostriate arteries and imaging of cerebral small vessel disease. Front Neurol. 2019;10:882. doi:10.3389/fneur.2019.00882
33. Zhi N, Zhang L, Wang Y, et al. Modified cerebral small vessel disease score is associated with vascular cognitive impairment after lacunar stroke. Aging (Albany NY). 2021;13(7):9510–9521. doi:10.18632/aging.202438
34. Hou Y, Li Y, Yang S, et al. Gait impairment and upper extremity disturbance are associated with total magnetic resonance imaging cerebral small vessel disease burden. Front Aging Neurosci. 2021;13:640844. doi:10.3389/fnagi.2021.640844
35. Mungas D, Reed BR, Jagust WJ, et al. Volumetric MRI predicts rate of cognitive decline related to AD and cerebrovascular disease. Neurology. 2002;59(6):867–873. doi:10.1212/wnl.59.6.867
36. Jack CR, Shiung MM, Weigand SD, et al. Brain atrophy rates predict subsequent clinical conversion in normal elderly and amnestic MCI. Neurology. 2005;65(8):1227–1231. doi:10.1212/01.wnl.0000180958.22678.91
37. Iadecola C, Gorelick PB. Converging pathogenic mechanisms in vascular and neurodegenerative dementia. Stroke. 2003;34(2):335–337. doi:10.1161/01.str.0000054050.51530.76
38. Muller M, Appelman AP, van der Graaf Y, et al. Brain atrophy and cognition: interaction with cerebrovascular pathology? Neurobiol Aging. 2011;32(5):885–893. doi:10.1016/j.neurobiolaging.2009.05.005
39. Schmidt R, Ropele S, Enzinger C, et al. White matter lesion progression, brain atrophy, and cognitive decline: the Austrian stroke prevention study. Ann Neurol. 2005;58(4):610–616. doi:10.1002/ana.20630
40. Walters RJ, Fox NC, Schott JM, et al. Transient ischaemic attacks are associated with increased rates of global cerebral atrophy. J Neurol Neurosurg Psychiatry. 2003;74(2):213–216. doi:10.1136/jnnp.74.2.213
41. Enzinger C, Fazekas F, Matthews PM, et al. Risk factors for progression of brain atrophy in aging: six-year follow-up of normal subjects. Neurology. 2005;64(10):1704–1711. doi:10.1212/01.WNL.0000161871.83614.BB
42. Rissanen I, Lucci C, Ghaznawi R, et al.; UCC-SMART-Study Group. Association of ischemic imaging phenotype with progression of brain atrophy and cerebrovascular lesions on MRI: the SMART-MR study. Neurology. 2021;97(11):e1063–e1074. doi:10.1212/WNL.0000000000012539
 © 2022 The Author(s). This work is published and licensed by Dove Medical Press Limited. The
full terms of this license are available at https://www.dovepress.com/terms.php
and incorporate the Creative Commons Attribution
- Non Commercial (unported, v3.0) License.
By accessing the work you hereby accept the Terms. Non-commercial uses of the work are permitted
without any further permission from Dove Medical Press Limited, provided the work is properly
attributed. For permission for commercial use of this work, please see paragraphs 4.2 and 5 of our Terms.
© 2022 The Author(s). This work is published and licensed by Dove Medical Press Limited. The
full terms of this license are available at https://www.dovepress.com/terms.php
and incorporate the Creative Commons Attribution
- Non Commercial (unported, v3.0) License.
By accessing the work you hereby accept the Terms. Non-commercial uses of the work are permitted
without any further permission from Dove Medical Press Limited, provided the work is properly
attributed. For permission for commercial use of this work, please see paragraphs 4.2 and 5 of our Terms.