")
Back to Journals » Nature and Science of Sleep » Volume 14
Prevalence and Characteristics of Sleep Apnea in Intensive Care Unit Survivors After SARS-CoV-2 Pneumonia
Authors Traore I, Eberst G, Claudé F, Laurent L, Meurisse A, Paget-Bailly S, Roux-Claudé P, Jacoulet P, Barnig C, Martarello R, Poirson B , Bouiller K, Chirouze C, Behr J, Grillet F, Ritter O, Pili-Floury S, Winiszewski H, Samain E, Capellier G, Westeel V
Received 14 June 2022
Accepted for publication 14 November 2022
Published 22 December 2022 Volume 2022:14 Pages 2213—2225
DOI https://doi.org/10.2147/NSS.S377946
Checked for plagiarism Yes
Review by Single anonymous peer review
Peer reviewer comments 3
Editor who approved publication: Prof. Dr. Ahmed BaHammam
Ibrahim Traore,1 Guillaume Eberst,1– 3 Fréderic Claudé,1 Lucie Laurent,1 Aurelia Meurisse,2,3 Sophie Paget-Bailly,2,3 Pauline Roux-Claudé,1 Pascale Jacoulet,1 Cindy Barnig,1 Rachel Martarello,1 Bastien Poirson,4 Kevin Bouiller,5 Catherine Chirouze,5 Julien Behr,6 Franck Grillet,6 Ophélie Ritter,1 Sébastien Pili-Floury,7 Hadrien Winiszewski,8 Emmanuel Samain,7,9 Gilles Capellier,8– 10 Virginie Westeel1– 3
1Respiratory Medicine Department, University Hospital of Besançon, Besançon, France; 2Methodology and Quality of Life in Oncology Unit, University Hospital, Besançon, France; 3UMR 1098, University of Franche-Comté, Besançon, France; 4Department of Geriatrics, University Hospital of Besançon, Besançon, France; 5Department of Infectious Disease, University Hospital of Besançon, Besançon, France; 6Department of Radiology, University Hospital of Besançon, Besançon, France; 7Anesthesia and Intensive Care Unit, University Hospital of Besançon, Besançon, France; 8Medical Intensive Care Unit, University Hospital of Besançon, Besançon, France; 9Research Unit EA3920, Université de Franche Comté, Besançon, France; 10Australian and New Zealand Intensive Care Research Center, Department of Epidemiology and Preventive Medicine, Monash University, Monash, Australia
Correspondence: Ibrahim Traore, Respiratory Medicine Department, University Hospital of Besançon, Besançon, France, Email [email protected]
Background: Sleep apnea (SA) was reported as possibly exacerbating symptoms of COVID-19, a disease induced by SARS-CoV-2 virus. The same comorbidities are common with both pathologies. This study aimed to estimate the prevalence, characteristics of SA and variation in AHI three months after severe COVID-19 requiring intensive care unit (ICU) admission.
Methods: A prospective cohort of patients admitted to ICU for severe COVID-19 underwent an overnight home polygraphy 3 months after onset of symptoms, as part of a comprehensive follow-up program (pulmonary function tests, 6-minute walk tests and chest CT-scan). Patients with an apnea hypopnea index (AHI) ≥ 5 were considered as having SA. We performed a comparative descriptive analysis of 2 subgroups according to the existence, severity of SA and indication for effective SA treatment: patients with absent or mild SA (AHI < 15) vs patients with moderate to severe SA (AHI ≥ 15).
Results: Among 68 patients included, 62 (91%) had known comorbidities (34 hypertension, 21 obesity, 20 dyslipidemia, 16 type 2 diabetes). It has been observed a preexisting SA for 13 patients (19.1%). At 3 months, 62 patients (91%) had SA with 85.5% of obstructive events. Twenty-four patients had no or a mild SA (AHI < 15) and 44 had moderate to severe SA (AHI ≥ 15). Ischemic heart disease exclusively affected the moderate to severe SA group. Except for thoracic CT-scan which revealed less honeycomb lesions, COVID-19 symptoms were more severe in the group with moderate to severe SA, requiring a longer curarization, more prone position sessions and more frequent tracheotomy.
Conclusion: SA involved 91% of patients in our population at 3 months of severe COVID-19 and was mainly obstructive type. Although SA might be a risk factor as well as consequences of ICU care in severe COVID-19 infection, our results underline the importance of sleep explorations after an ICU stay for this disease.
Keywords: SARS-CoV-2, pneumonia, obstructive sleep apnea syndrome, intensive care unit
Introduction
Sleep Apnea (SA) is a disorder characterized by repetitive pauses in breathing during sleep, caused by airway occlusion (obstructive sleep apnea) or altered control of breathing (central sleep apnea).1,2 The prevalence of SA differs in the literature depending on the characteristics of the population studied, the definition of SA used and the studies design.3–5 The estimated prevalence of sleep-disordered breathing, defined as an Apnea-Hypopnea Index value (AHI) of 5 or higher concerned 24% of men and 20% of women in an American study of 427 elderly people aged 65 years and over.6 The strongest risk factor is obesity, reflected by markers including body mass index (BMI), neck circumference, and waist-to-hip ratio.7 Other risk factors include older age, male gender, menopause, craniofacial and upper airway abnormalities, alcohol consumption, smoking, and genetic factors associated with craniofacial structure, body fat distribution and neural control of the upper airway muscles.8,9 The prevalence of cardiovascular comorbidities in obstructive sleep apnea syndrome (OSA) has been estimated at 39% for hypertension, 34% for obesity and 15% for diabetes.10 The prevalence of one or more of these comorbidities increases with age, male gender and severity of the SA.10–14
COVID-19 is an infectious disease caused by the most recently discovered coronavirus: SARS-CoV-2. It is not clear if the frequency of SA increases after an ICU stay for non-COVID-19 causes, with divergent results from small studies evaluating sleep quality within 10 days and 6 months after discharge.15 However, several arguments exist to suspect a higher rate of SA in COVID-19 ICU survivors. Studies have shown that several risk factors for severe COVID-19 infection overlap with the risk factors for, and potential complications of SA, such as obesity, high blood pressure, diabetes, as well as cardiovascular and cerebrovascular diseases. Several articles have described the prevalence of known SA in hospitalized cases and even suggest a direct link between SA and the severity of the COVID-19.16–19
Moreover, a growing body of data indicates that SARS-CoV-2 can also invade the nervous system, causing neurological diseases, such as encephalitis, encephalopathy, meningitis, Guillain-Barré syndrome.20,21 Therefore, SA secondary to a direct viral attack of the central nervous system could explain sleep disturbances among patients with severe COVID-19. After Severe Acute Respiratory Syndrome (SARS), an epidemic also due to a coronaviridae between 2002 and 2004, a study by Moldofsky et al evaluated 30 patients by an overnight polysomnography performed a mean of 19.8 months after infection. Twenty-two post-SARS patients were compared to a group of 8 younger, healthy females. Polysomnographic data showed more arousal disturbances, alpha electroencephalography sleep disorders, stage 2 non rapid eye movement (REM) sleep and a delay in onset to REM sleep in the group of post-SARS patients, possibly related to the infection. The frequency of SA was not increased.22
In COVID-19, sleep disorders could also be expected from the healing process, with pulmonary fibrosis, after the severity of the initial lung damage.23 Indeed, several studies have demonstrated the interdependence between upper airway size in OSA and lung volumes24,25 or reported an increased frequency of OSA in patients with idiopathic pulmonary fibrosis.26–28 In a study by Lancaster et al,26 88% of 50 patients with idiopathic pulmonary fibrosis who underwent polygraph had SA.
Common risk factors and consequences of SA are shared by SARS-CoV-2 infection and several physiopathological mechanisms such as a neurological damage, pulmonary fibrosis or post-ventilation consequences suggest that there may be an increased frequency of SA after severe COVID-19 infection. Therefore, the objective of this study was to estimate the prevalence and characteristics of SA 3 months after respiratory symptoms that required ICU admission for COVID-19. The secondary objectives were first to describe the evolution of AHI in patients with previously known SA and second for all patients to describe the relationship between the magnitude of the estimated AHI and demographic, resuscitation data indicating the severity of respiratory compromise, respiratory function and scanographic data at 3 months of symptoms onset.
Methods
Study Design of COV- RECUP
This single-center, prospective, observational study was performed in a French university hospital (University hospital of Besançon) from April to July 2020. All patients who had been admitted to any of the ICUs in the hospital for COVID-19 were contacted and invited to participate in the study.
The COV-RECUP study consisted of follow-up including outpatient evaluation at 3, 6 and 12 months after symptom onset. At 3 months (±3 weeks), patients underwent a complete overnight home respiratory polygraphy. At 3, 6 and 12 months, they had a physical examination, pulmonary function testing, blood gas analysis, non-contrast enhanced millimeter section chest CT scan, resting oximetry, a standardized six-minute walk test (6MWT) with continuous oximetry, and they completed the SF36 health-related quality of life questionnaire. Routine spirometry, constant-volume body plethysmography, lung diffusing capacity for carbon monoxide (DLCO) and fractional concentration of exhaled NO (FeNO) were measured in accordance with current standards (MedGraphics Platinium Elite; Medisoft FeNO; MSE Medical, Strasbourg, France).29–31 The instruments were calibrated and used according to the manufacturer’s instructions and used in conjunction with a personal computer. Hypoxemia was defined at the threshold of 9.3 kPa.
All data regarding demographics (age, sex), anthropometry (body mass index [BMI]), social habits (smoking), and comorbidities (COPD, SA, OHS, hypertension, type 2 diabetes, arrhythmia, coronary artery disease or stroke, thromboembolic disease, chronic renal disease) were extracted at 3 months.
We also extracted critical care support data during the critical care stay, including use and duration of invasive mechanical ventilation (IMV), use and duration of curarization, use and duration of prone position treatment, tracheostomy, length of ICU stay, total hospital days, and weight loss at M3.
Our study is a substudy of the larger COV-RECUP study.15 The present analysis focuses on polygraph data collected at the 3-month follow-up.
Population and Eligibility Criteria
Patients were eligible if they were aged between 18 and 79 years old, had SARS-CoV-2 infection diagnosed by viral RNA detection by quantitative RT-PCR on nasal swabs or bronchoalveolar lavage sample. Patients had to have been admitted to the ICU with SpO2 of 92% or less, and evidence of air-space changes in 25% of lung parenchyma on chest CT scan. Patients were excluded if they were known to have chronic respiratory insufficiency, were on long-term oxygen therapy or followed for interstitial lung disease, if they had a significant psychiatric pathology, or if they had a life expectancy estimated at less than one year.
Ethical Consideration
Written consent was obtained before the first visit at 3 months and the protocol was approved by the ethics committee (CPP Grand-Est le 21/04/2020). The COV-RECUP study15 was performed in accordance with the Declaration of Helsinki and Good Clinical Practice guidelines.
Sleep Investigations
Clinical Data on Sleep
Before polygraphy, patients completed a standardized Epworth sleepiness scale questionnaire to assess the presence of daytime sleepiness. An Epworth sleepiness score ≥10 points was indicative of daytime sleepiness. Three additional clinical signs suggestive of SA were collected: nocturnal snoring, nocturia defined by more than one nocturnal micturition and morning headaches.
Diagnosis of SA by Polygraphy
Respiratory polygraphy was performed on an outpatient basis using the NOX T3-ResMed polygraph model and the NOXTURNAL software version 5.1.2.20294 (Nox Medical, Reykjavik, 2017). The devices were given to the patient on the day of the 3-month visit.
The straps and sensors were put in place by a hospital nurse and the rest of the elements by the patient before bedtime after clear explanations on how to proceed. The following signals were continuously recorded: airflow (nasal cannula), heart rate and SpO2 (pulse oximeter sensor), respiratory effort (thoracic and abdominal band with respiratory effort sensor), breath sounds (microphone), patient position (sensors). Bedtime and wake-up time were left at the discretion of the patient, marked the beginning and end of the interpretable recording. Tracings were read by a physician specialized in sleep pathology and the apnea and hypopnea episodes were scored manually.
The scoring was based on American Academy of Sleep Medicine recommendations.32 An apnea event was defined as cessation of breathing lasting 10 seconds or more. Hypopneas were scored when there was a 30% or more decrease in airflow with 3% or more oxygen desaturation. Apnea or hypopnea was central when it was associated with absence of respiratory effort. Otherwise, it was obstructive.32 SA was defined as an Apnea-Hypopnea Index (AHI) ≥5.33 It was defined moderate if AHI was equal or greater than 15/h and severe if AHI was equal or greater than 30/h. SA was obstructive type (OSA) when the proportion of obstructive events was greater than or equal to 50% of all events scored. For all patients with a history of SA, the results of a previous comparative polygraphy were sought.
Statistical Analysis
We compared patient characteristics and 3-month results between two groups defined according to the AHI: patients with absent or mild SA (defined as an AHI <15) and patients with moderate to severe SA (defined as AHI ≥15). AHI threshold of 15 events/h to distinguish our 2 groups was chosen because it is considered sufficient diagnostic criteria regardless of the presence of symptoms and a threshold for therapeutic implication according to the recommendations of the American Academy of Sleep Medicine (AASM) and the International Classification of Sleep Disorders-Third Edition.34
SA type was not considered in group formation or statistical analyses.
Categorical variables are described as number and percentage, and quantitative variables as mean ± standard deviation or median and interquartiles. The Chi-square or Fisher’s exact test was used for categorical variables and the Wilcoxon test for medians for comparisons between groups. All analyses were performed using SAS version 9.4 (SAS Institute, Cary, NC).
Results
Among 149 patients with an initial diagnosis of SARS-CoV-2 pneumonia who were admitted to any ICU, 85 were included in the study (Figure 1). Seventeen patients did not participate in the present sleep ancillary study (7 refused the polygraphy, 4 could not be recorded due to technical issues, 5 had a recording problem, and 1 was under 4L/min night oxygen therapy). The mean time between COVID-19 symptom onset and polygraphy was 3 months (range 2.6–3.4 months). The demographic characteristics of study population (n = 68) are detailed in Table 1.
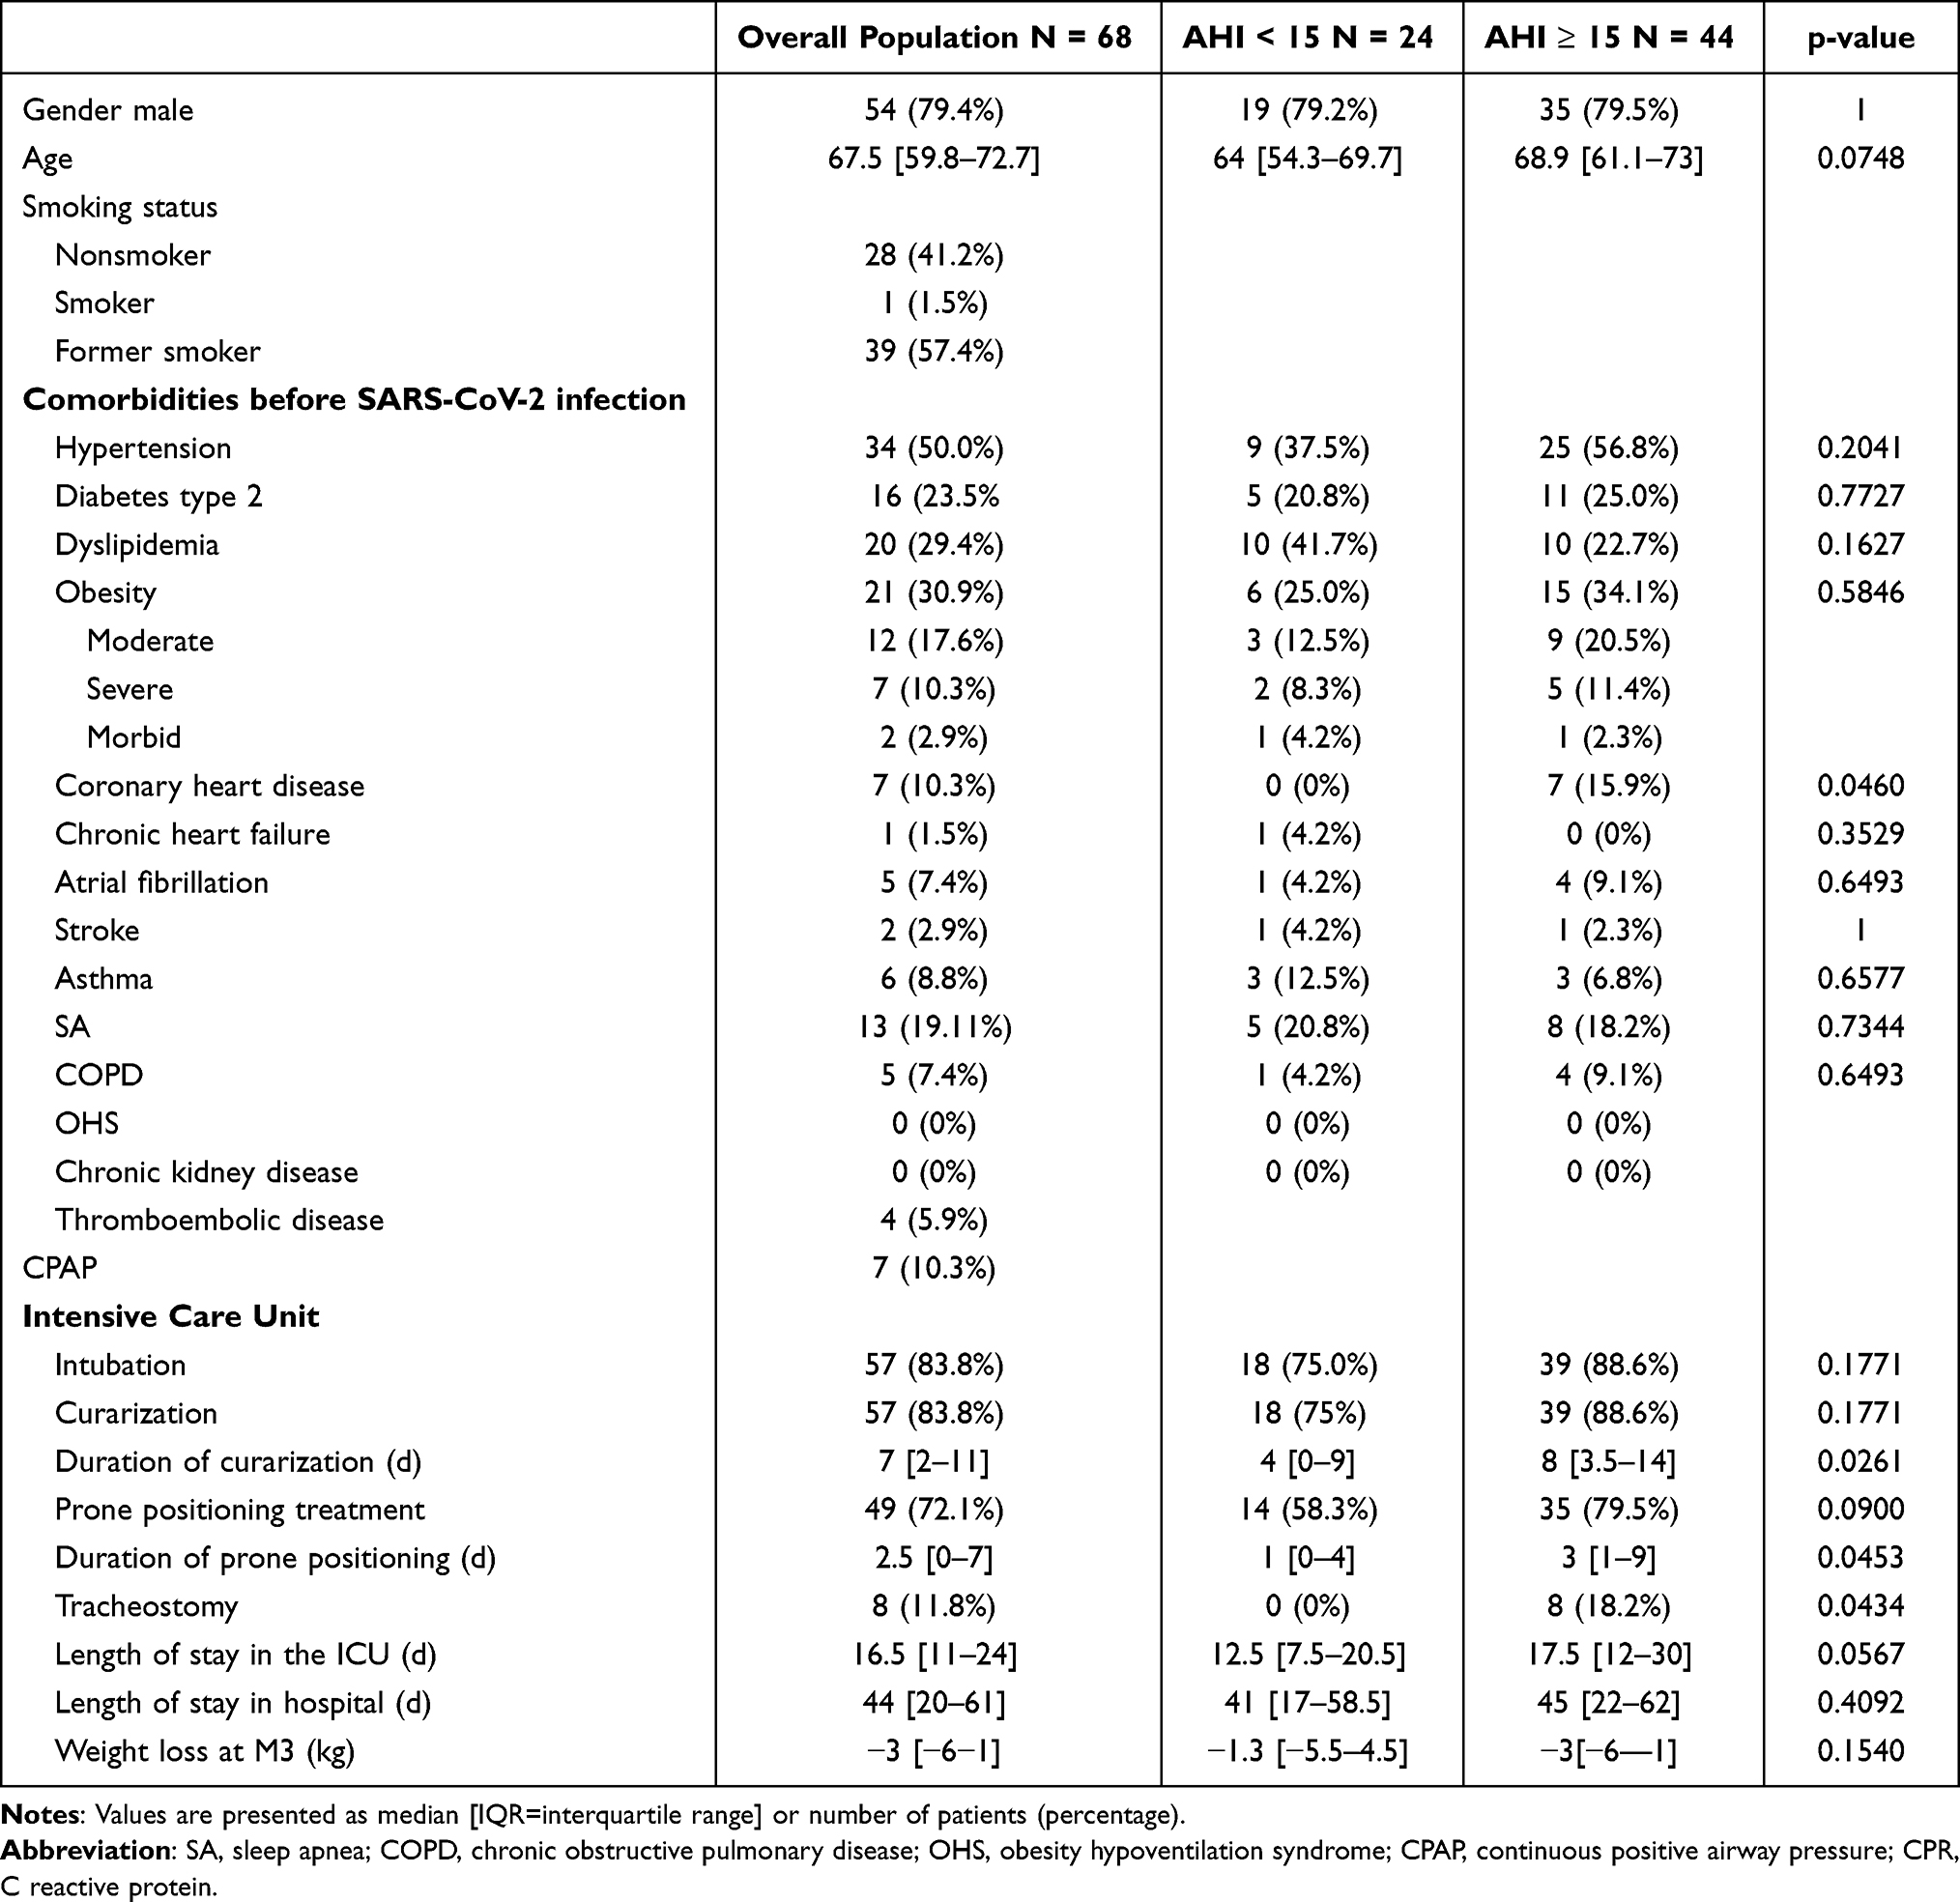 |
Table 1 Baseline Characteristics, Medical History and AHI Estimation at 3 Months in Intensive Care Unit Survivors After SARS-CoV-2 Pneumonia |
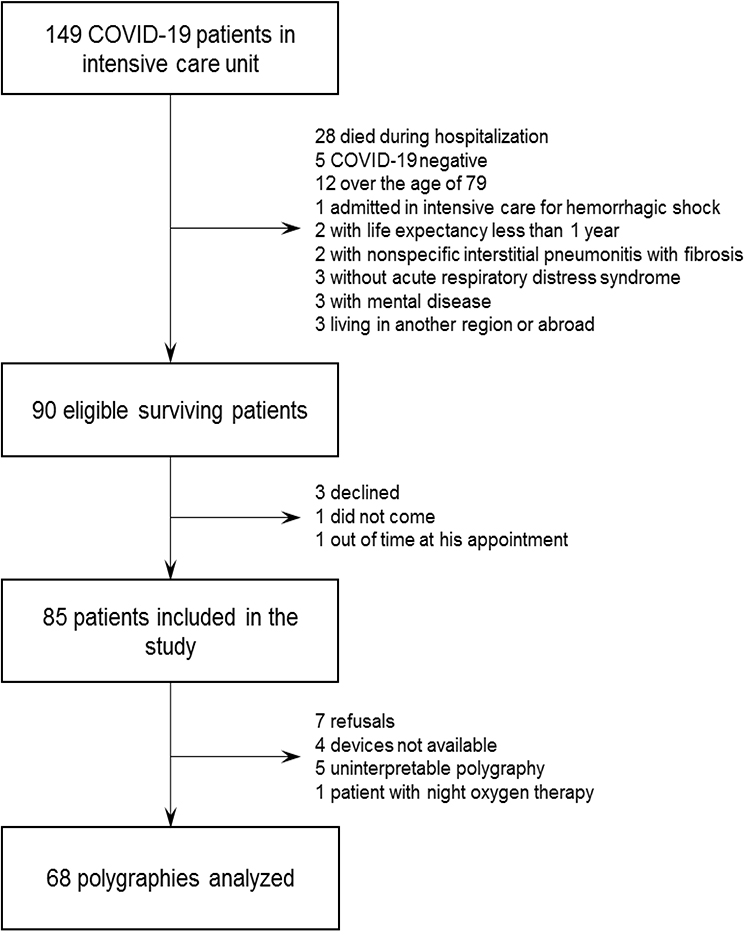 |
Figure 1 Flowchart of the COV-RECUP sleep study population. |
Prevalence and Characteristics of Sleep Apnea Syndrome
The results of the respiratory polygraphy at 3 months revealed SA in 62 patients (91.3%). Among them, SA was mild (5 ≥AHI ≤15) in 18 patients (26.5%), moderate (15 ≥AHI≤ 30) in 22 patients (32.4%), and severe (AHI ≥ 30) in 22 patients (32.4%) (Table 2). SA was predominantly obstructive as central events were in the minority with a median value of 5.15% [0.6–17.9%] for all patients with sleep apnea. The median value of Epworth Score was 5 points [3–8] for patients with mild SA, 5 points [4–10] for patients with moderate SA and 5 points [0–12] for patients with severe SA with a value of 10/18 or more found in 5 (27.8%), 1 (4.5%) and 2 patients (9.1%) of each group respectively. For the entire population, 43 patients snored (64.2%) among whom 39 had OSA. Nocturia concerned 15 patients (22.7%) among whom 14 had OSA, and morning headaches concerned 5 patients (7.4%) and all of them had OSA (Table 3).
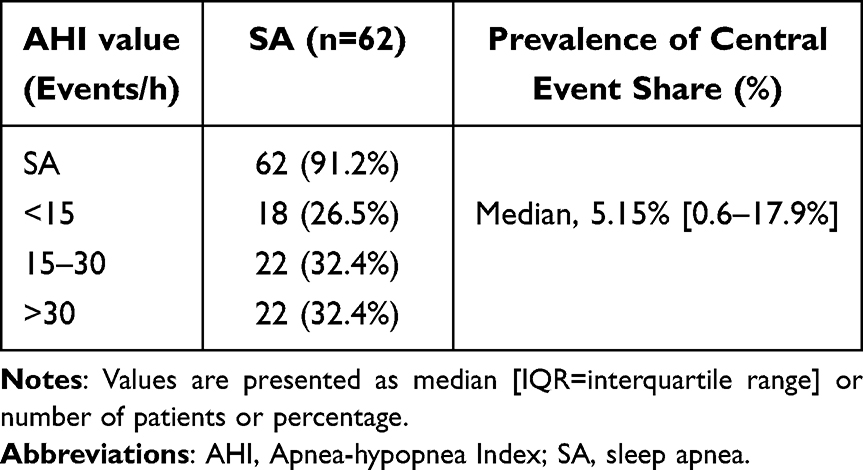 |
Table 2 Prevalence and Characteristics of SA Based on Polygraph Results at 3 Months in Intensive Care Unit Survivors After SARS-CoV-2 Pneumonia |
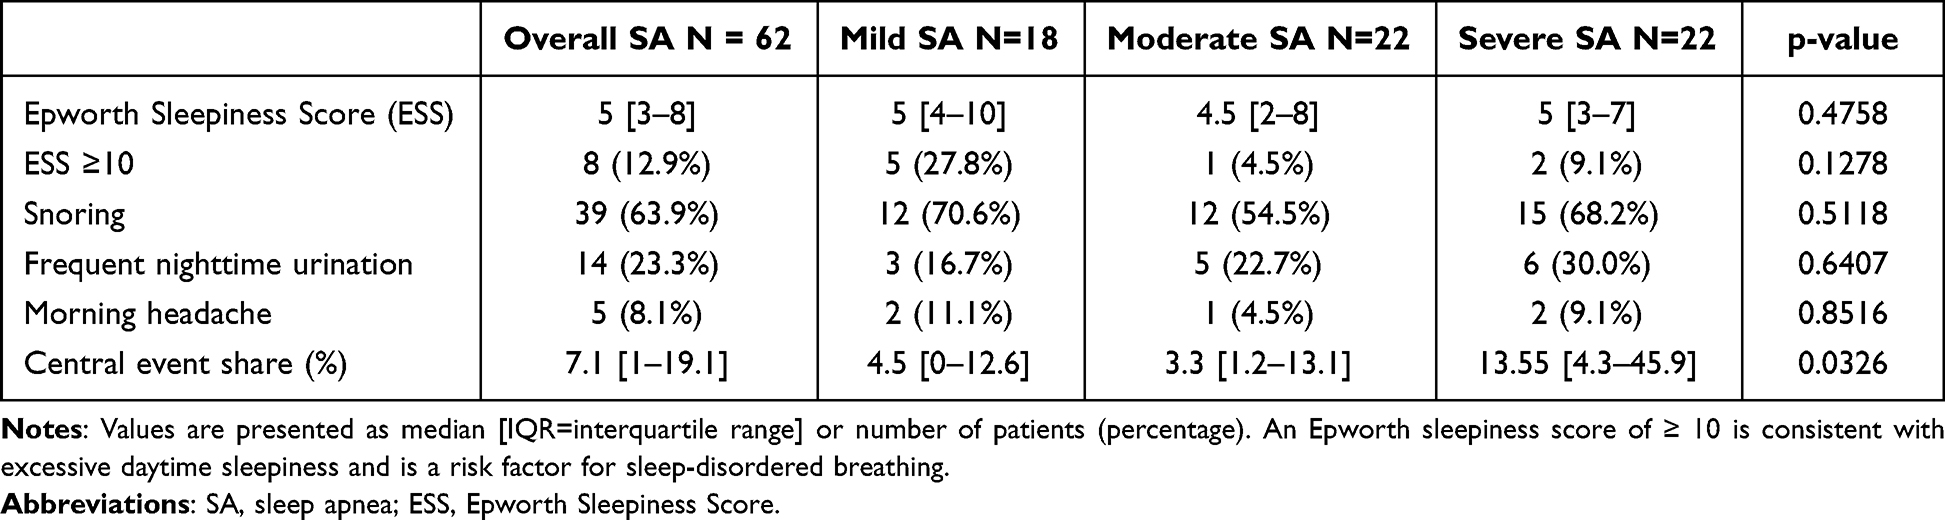 |
Table 3 Epworth Sleepiness Score and Clinical Signs of SA at 3 Months in Intensive Care Unit Survivors After SARS-CoV-2 Pneumonia |
Prevalence of Previously Diagnosed Sleep Apnea Syndrome and Evolution of AHI
Thirteen patients had a known SA (19.1%): 5 patients in the no or mild SA group (20.8%) vs 8 patients in the moderate to severe SA group (18.2%), treated by continuous positive airway pressure therapy (CPAP) for 7 of them.
Among the 13 patients with history of SA, the results of a polygraphy dating from the previous years were found for 11. The median time between the 2 sleep assessments was 7 years [4–10.5] and the median change in AHI was −11 points [(−23)-0.75].
Among the 11 patients, a decrease in the AHI value was observed at the polygraph performed 3 months after COVID-19 for 7 patients, each with a weight loss of 3 kg or more between the two sleep explorations. The value was stable for 3 patients (Figure 2). Only one patient had an increase in AHI from 33.1 to 74 events/h associated with a 6 kg weight gain.
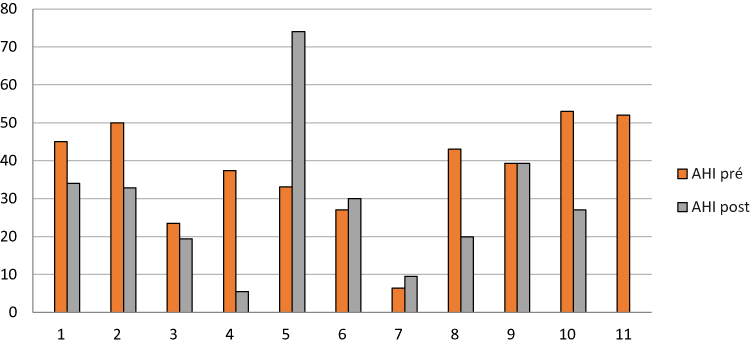 |
Figure 2 Comparison of AHI for the 11 intensive care unit survivors with known SA and available polygraphic data before and 3 months after COVID-19. |
Characteristics of the Study Population at ICU Admission
Comparing patients with absent or mild SA (AHI < 15) versus patients with moderate to severe SA (AHI ≥ 15), there was no statistical difference in terms of age and sex (Table 1). The median age was 64 years [54.3–69.7] for the group with no or mild SA and 68.9 years [61.1–79] for the second group. The prevalence for each sex was equivalent in the 2 groups with 19 males (79.2%) vs 35 (79.5%). Sixty-two of the 68 patients (91.2%) had at least one cardiovascular comorbidity. Arterial hypertension 9 (37.5%) vs 25 (56.8%), ischemic heart disease 0 (0%) vs 7 (15,9%), atrial fibrillation 1 (4.2%) vs 4 (9.1%), stroke 1 (4,2%) vs 1 (2.3%), chronic heart failure 1 (4.2%) vs 0 (0%), obesity 6 (25%) vs 15 (34.1%), dyslipidemia 10 (41.7%) vs 10 (22.7%), type 2 diabetes 5 (20.8%) vs 11 (25%). There was no statistical difference except for ischemic heart disease which concerned exclusively the group with moderate to severe SA (p = 0.046).
Characteristics of the Study Population Concerning ICU Stay
Intubation and curarization concerned 57 of our patients (83.8%): 18 patients in the group with AHI inferior to 15 (75%) vs 39 patients in the group with a AHI greater than or equal to 15 (99.6%) (p = 0.177). All intubated patients were curarized. Data on the ICU stay showed that the median duration of curarization was longer for patients with moderate to severe SA (median duration: 8 days [3.5–14]) than for the rest of the patients (median duration: 4 days [0–9]) (p = 0.026). Prone positioning was applied for 14 patients (58.3%) with no or mild SA vs 35 (79.5%) patients with moderate to severe SA (p = 0.090), with a median number of sessions of 1 [0–4] vs 3 [1–9], respectively (p = 0.045). There was a statistical difference in the use of tracheostomy for difficult weaning of from the mechanical ventilation, which concerned exclusively the moderate to severe SA group with 8 patients (18.2%; p = 0.043). The median length of stay in the ICU was 16.5 days [1–49] in the whole population (12.5 days [7.5–20.5] for patients with no or mild SA vs 17.5 days [12–30] in the moderate to severe SA group) (p = 0.056).
Characteristics and comparison of the 2 groups on the scannographic and respiratory functional data at 3-month follow-up
At the 3-month follow-up, 63 of the 68 patients had undergone a chest CT-Scan at 3-month. The most frequent scan abnormalities were persistent reticulations in 53 patients (88.3%), traction bronchiectasis in 48 patients (66.7%), ground glass opacities in 43 patients (71.7%) and honeycomb lesions in 5 patients (8.3%). Sixty patients had at least one CT scan abnormality (95.2%). The abnormalities did not differ statistically between the 2 groups, except for honeycomb lesions which were observed in 4 patients (20%) in the group with no or mild SA vs 1 patient (2.5%) in the moderate to severe SA group (p = 0.038) (Table 4).
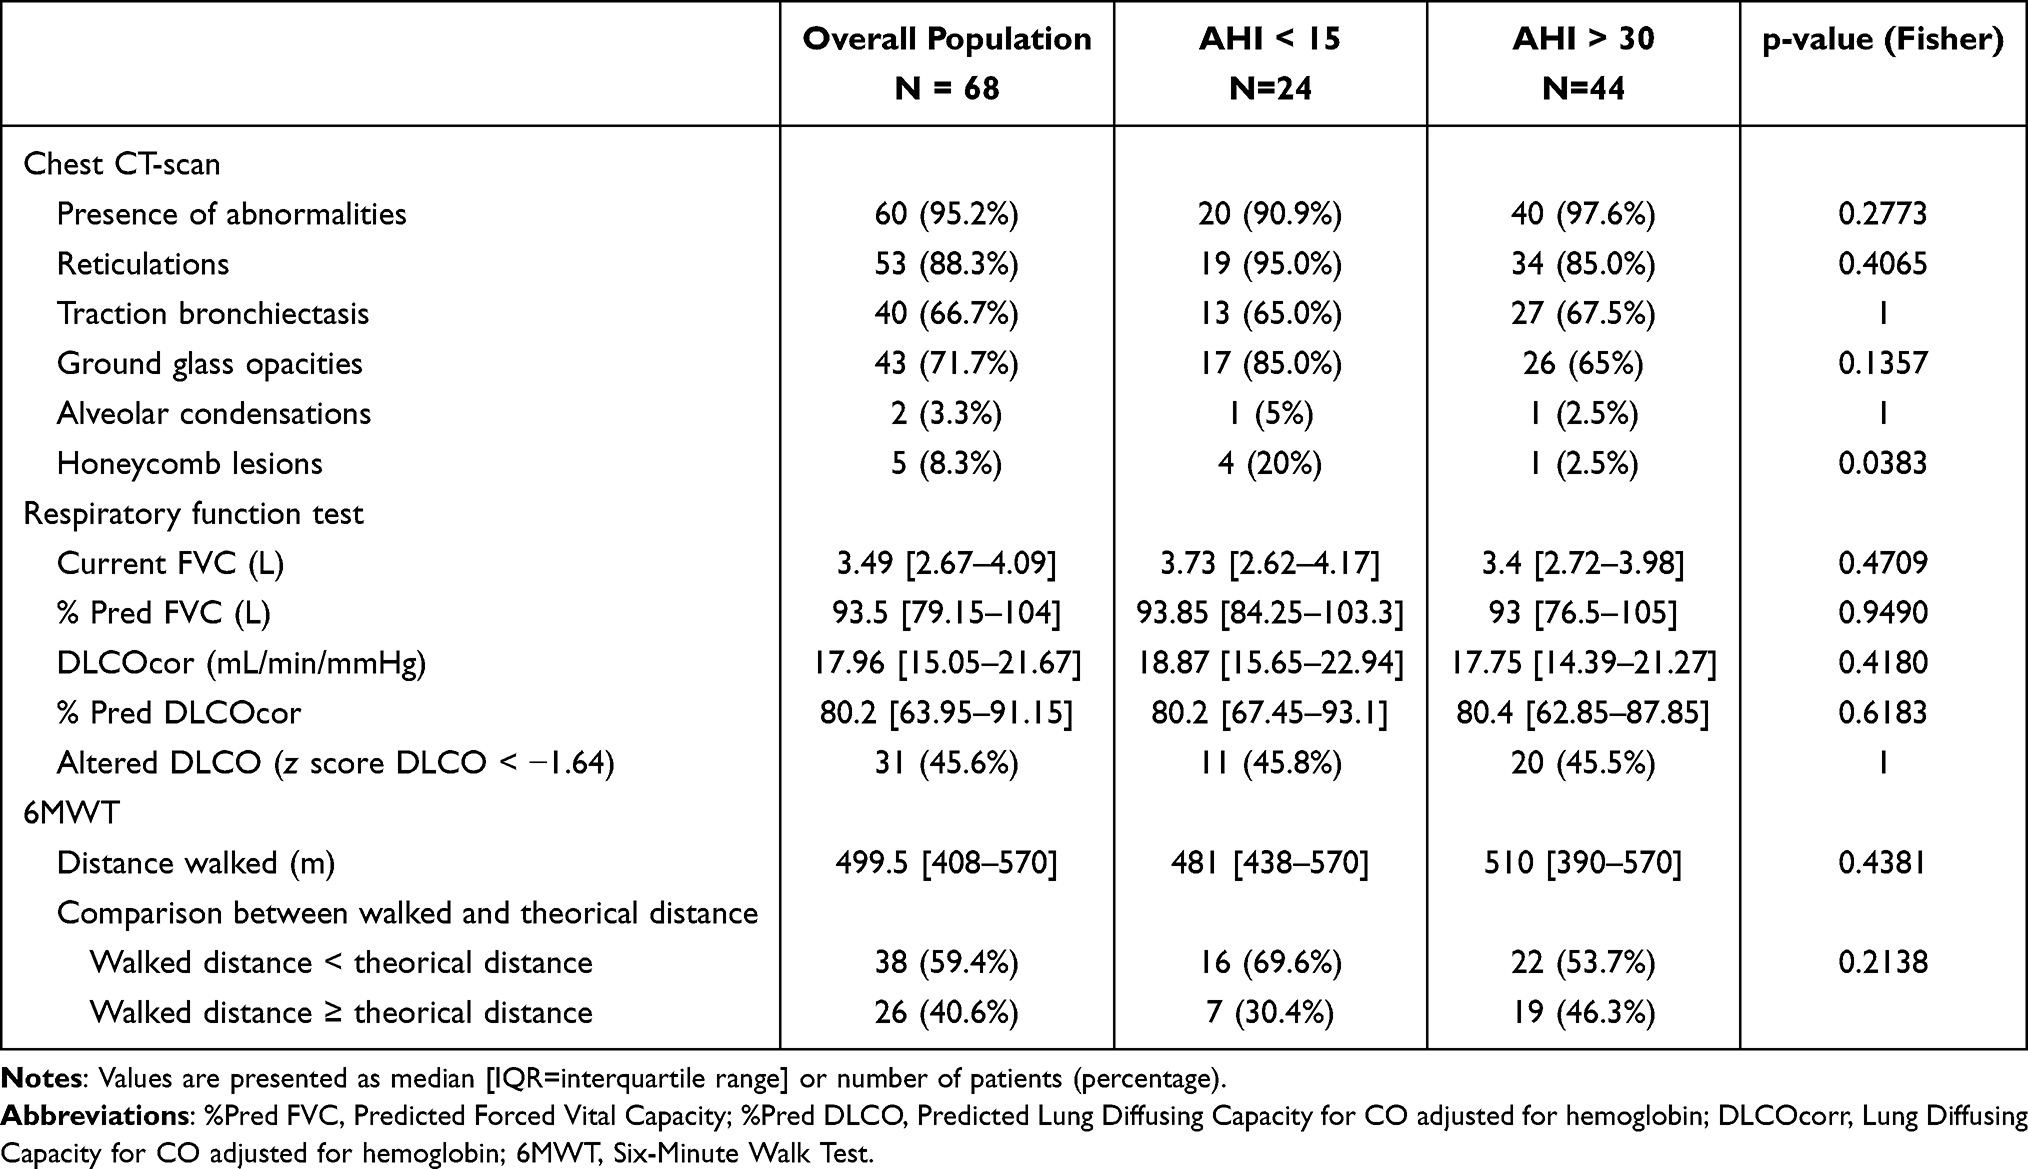 |
Table 4 Scannographic, Respiratory Functional and 6MWT Results at 3 Months in Intensive Care Unit Survivors After SARS-CoV-2 Pneumonia |
Median percentage of corrected DLCO predicted value was 80.2% [67.45–93.1] vs 80.4% [62.85–87.85] for each group, respectively (p = 0.618). As well, there was no statistical change in median percentage of vital capacity predicted value between groups, which remained within the range of normal values (93.85% [84.25–103.3] vs 93% [76.5–105], respectively (p = 0.95)) (Table 4).
Discussion
We prospectively assessed the prevalence of SA three months after a severe COVID-19 infection. Among 68 post-ICU patients, 62 (91%) had known comorbidities (34 hypertension, 21 obesity, 20 dyslipidemia, 16 type 2 diabetes). At 3 months, 62 patients (91%) had SA, all of which were OSA. This pathology was known before COVID-19 in only 13 patients (19.1%). Twenty-four patients had no or mild SA (AHI <15) and 44 had moderate to severe SA (AHI ≥15). Ischemic heart disease exclusively affected the moderate to severe SA group.
COVID-19 symptoms were more severe in the moderate to severe SA group, requiring a longer curarization, more prone position sessions and more frequent tracheostomy. Thoracic CT-scan revealed fewer honeycomb lesions in this group, which is not consistent with the hypothesis of SA induced by a reduction of lung volumes due to fibrosis and rather suggests pre-existing SA.
Several studies retrospectively evaluated the frequency of diagnosed SA before the COVID-19 infection. Arentz et al35 described 21 ICU patients with COVID-19. The prevalence of known OSA was 28.6%. Their mean age and the prevalence of comorbidities were comparable to those found in our study. Severity of COVID-19 infection was comparable to that of our population since 95% of their patients progressed to ARDS and 75% required mechanical ventilation. In a case-control study of 445 patients with a SARS-COV-2 infection, Strausz et al36 found that known OSA was a risk factor for hospitalization with an OR of 2.37 ([95% CI 1.14 to 4.95] p = 0.021), after adjustment for age, sex, BMI and comorbidities. No information was given about the overall proportion of ICU patients within the cohort. Among 9405 patients with COVID-19 infection including 3185 (33.9%) who were hospitalized, Maas et al37 also identified a higher prevalence of known OSA in patients requiring hospitalization (OR 1.65; 95% CI (1.36, 2.02), adjusted for diabetes, hypertension, and BMI) and in those who progressed to respiratory failure (OR 1.98; 95% CI (1.65, 2.37)), adjusted for BMI. Respiratory failure occurred in 1779 patients (18.9%). These results suggest that SA is a risk factor for severe COVID-19.
Several studies have attempted to identify a relationship between severe COVID-19 and a high risk of SA, using post-infection screening questionnaires to evaluate the risk of SA. Iannella et al38 studied 96 hospitalized patients with severe COVID-19 using the STOP-BANG questionnaire. Among them, 41.6% of those requiring enhanced respiratory assistance (high flow nasal cannula, non-invasive ventilation or invasive mechanical ventilation) had a high risk of having SA vs 20.8% of patients requiring conventional oxygen therapy (p = 0.05). In a prospective observational study, Kar et al included 213 COVID-19 hospitalized patients,39 of whom 71 had no oxygen requirement and 43 were under conventional oxygen therapy, 62 received invasive mechanical ventilation and 37 received non-invasive ventilation or high-flow cannula. Overall, 57 died from COVID-19-related ARDS. Sixteen percent of survivors had a high risk of OSA as estimated by the STOP-BANG score, compared to 45% of the deceased group. In addition, the STOP-BANG score was found to be significantly associated with an increased risk of death after adjustment for diabetes, hypertension, coronary artery disease, and neck circumference (OR 2.48 (1.09–5.69, p = 0.031)). In a cross-sectional population-based web survey of 20,598 adults, Chung et al40 also used the STOP-BANG questionnaire. The prevalence of high risk of OSA was 9.5%, and high risk of OSA was associated with an increased risk of hospitalization or ICU treatment (OR 2.11, 95% CI: 1.10–4.01, adjusted for BMI, age, gender, and comorbidities).
These studies suggest an increased risk of SA in patients hospitalized for COVID 19 infection, and particularly in patients requiring ventilation support and ICU admission. However, they also may underestimate the frequency of SA, because prior SA was undiagnosed or due to a lack of sensitivity of the questionnaires used. Our study shows that detection of SA using the Epworth Sleepiness Questionnaire, only based on excessive daytime sleepiness, lacks sensitivity with only 8 patients (12%) having an Epworth Sleepiness Score equal or greater than 10. A systematic polygraphy allowed us to avoid an induced bias. However, in the context of screening, the STOP-BANG questionnaire is more sensitive than the Epworth sleepiness score41–43 (mean sensitivity of 0.54 and specificity of 0.65 for the Epworth versus 0.88 and 0.42, respectively, for the STOP-BANG questionnaire according to a meta-analysis reported by Chiu et al42) and should be preferred although the diagnosis of SA is only reliable when obtained by polygraphy or polysomnography.
Our study can be compared to 2 others based on the same diagnosis criteria of SA using poly(somno)graphy.44,45 The first study conducted by Labarca et al44 evaluated a cohort of COVID-19 patients 3 and 6 months after diagnosis. Thirty-four patients with COVID-19 ARDS were compared with a control group of 28 patients with mild to moderate COVID-19 symptoms. SA was found in 27 (79%) ARDS patients versus 10 (38%) in the control group. Undiagnosed sleep-disordered breathing was independently associated with ARDS (OR 6.72 (CI, 1.56–28.93), p < 0.01) after adjustment for age, sex, hypertension, BMI, smoking status, while untreated sleep-disordered breathing was associated with a significant increase in the risk of persistent CT alterations between 12 and 24 weeks after acute COVID-19 (hazard ratio (HR) 17.2 (CI, 1.68–177.4, p = 0.01)). The prevalence of OSA (79%) was lower than in our study, perhaps because COVID-19 infection was less severe in their patients, as reflected by a higher mean DLCO (85.5% (±22.6) vs 77.65% (±21.14) of predicted), fewer persistent CT abnormalities (67.6% vs 95.2%), a higher mean distance on 6MWT (509 meters (±121.9) vs 480.56 (±120.46)), less frequent intubation (70.5%), curarization (52.9%), prone positioning (41.1%), and shorter duration of ICU stay (10.8±8.9 days) and overall hospitalization (23.8±21). The second study by Goyal et al45 was an Indian hospital-based longitudinal study conducted among COVID-19 ICU survivors followed over a period of two months. All consecutive COVID-19 patients with moderate to severe ARDS were evaluated 4–6 weeks after ICU discharge. As in our study, they found a high prevalence of SA, namely 65 out of 67 patients (97%), with moderate to severe SA in 49 patients (73%).41
All these studies are in line with a recently published quantitative meta-analysis based on data from 13 articles with 31,933 COVID-19 patients that demonstrated a statistically significant relationship between OSA and an elevated risk for fatal COVID-19 based on adjusted effect estimates (pooled effect estimate = 1.56, 95% CI: 1.20–2.02). When the participants were restricted only to the hospitalized COVID-19 patients, this significant relationship still existed (pooled effect estimate = 1.71, 95% CI: 1.38–2.12).46
For our patients with a history of SA, the overall decrease in AHI after SARS-COV-2 infection (Figure 2), associated with weight loss, is in favor of the preexistence of SA before COVID-19 infection. However, with an average BMI of 27.5 (±6.2) in the study by Goyal et al, and a prevalence of obesity of 30.9% in our population, the frequency of SA remains higher than expected, with excess weight considered as responsible for OSA in 58% of more severe OSA (AHI ≥ 15 events/h).12
Among the conflicting results of studies addressing the frequency of SA after an ICU stay for ARDS, Alexopoulou et al47 evaluated 36 ICU patients (including 75% of ARDS) (median age 54.5 [39.3–65.5], median BMI 27.5 (24.8–31)) by polysomnography at 10 days and 6 months after hospital discharge. Twenty-nine patients had SA (including 28 OSA) at 10 days and 22 patients at 6 months. Seven of the 9 patients with mild SA normalized their AHI without a parallel decrease in BMI. At 6 months, SA was less severe, with a decrease in AHI [21.5 (6.5–29.4) vs 12.8 (4.7–20.4)]. Neuropathy and/or myopathy induced by mechanical ventilation, sedatives and curare affecting the upper airways and the respiratory muscles were suspected, considering a significant increase in median MIP and MEP between the two evaluations, which was also observed in our population (data not shown). On the contrary, in the study by Dhooria et al,48 only 3 patients among 20 younger ARDS survivors (median age of 24 [22–28] years, median BMI 20 (18–23.8) had SA one month after an ICU stay for ARDS. Srikanth et al49 also evaluated 30 ARDS patients by polysomnography (mean age 33.50 years, mean BMI 23.50 ± 3.02)) within 7 days of admission and 6 weeks after discharge. Four patients had AHI > 5 at early evaluation and none at the later evaluation. However, subjects with SA had a longer duration sedation in the ICU, with higher cumulative doses of midazolam administered in Dhooria’s study and AHI in the early period positively correlated with the duration of ICU and duration of IMV in Srikanth’s study. Population differences may account for the discrepancy in SA prevalence, as intrinsic risk factors come into play for both pre-existing SA and resuscitation-facilitated SA.
The high prevalence of SA does not seem to be fully explained by the fibrotic lesions that appeared secondary to the infectious disease. Indeed, only 45.6% of our patients had abnormal DLCO values, probably related to CT scan abnormalities on the lung parenchyma. However, respiratory function measurements were within normal limits and honeycomb lesions were more frequently present in the group without SA or with mild SA. A propensity towards neuroinvasion has been demonstrated as a common feature of coronaviruses and the presence of SARS-CoV particles in the brain has previously been reported.50 The fact that all SA were OSA goes against the physio pathological hypothesis of central neurological SARS-CoV-2 involvement.
In addition to generating and potentiating comorbidities now recognized as independent risk factors for severe COVID-19, OSA is known to promote and maintain a chronic inflammatory state, associated with an increase in pro-inflammatory markers (IL6, TNF alpha, CRP).51 Apneic events also cause intermittent hypoxia. The pathophysiological hypothesis of a potentiation of hypoxemia and inflammation caused by COVID-19 through these 2 effects of SA, especially during the cytokine storm phase, could explain a greater risk of severity directly attributable to SA.
Our study has some weaknesses. Recruitment of a larger population from several centers, as well as centralized, double-blind interpretation of the polygraphy findings would have given more power to our results. All patients who were diagnosed with SA were offered individualized management and therapy if the indication was retained. There was no long-term follow-up data for the sleep disturbances identified in the present analysis. It would have been of interest to assess the clinical and polygraphic progression of patients with SA in the study. Finally, although our diagnosis was based on a systematic polygraphy, it would have been interesting to introduce in the methodology and to compare with the polygraphic results the STOP-BANG questionnaire known to be more sensitive in routine in addition or instead of the Epworth Sleepiness Questionnaire.
Conclusion
Our study highlights the high prevalence of SA three months after an ICU stay for COVID-19, which deserves systemic screening. SA shares common risk factors with severe COVID-19 infection, but is underdiagnosed, and therefore might have only been diagnosed after hospitalization for COVID-19. Part of the high frequency of SA in this context might be partially explained by the consequences of ICU care, including mechanical ventilation and Neuromuscular Blocking Agents.
Abbreviations
6MWT, Six-Minute Walk Test; ARDS, Acute Respiratory Distress Syndrome; AHI, Apnea Hypopnea Index; BMI, Body Mass Index; COVID-19, Coronavirus disease 2019; CT, computed tomography; DLCO, Lung Diffusing Capacity for CO; FeNO, fractional concentration of exhaled NO; FVC, Forced Vital Capacity; ICU, Intensive Care Unit; IMV, Invasive Mechanical Ventilation; OSA, Obstructive Sleep Apnea; OR, Odds Ratio; REM, Rapid eye movement; RT-PCR, Reverse-Transcriptase Polymerase Chain Reaction; SARS, Severe Acute Respiratory Syndrome by SARS-CoV-1; SARS-CoV-2, Severe Acute Respiratory Syndrome Coronavirus 2; SA, Sleep Apnea; SF-36, Medical Outcomes Survey 36-item Short Form Health Survey.
Data Sharing Statement
The datasets used and analysed during the current study are available from the corresponding author on reasonable request.
Ethics Approval and Consent to Participate
Written consent was obtained for all patients and the protocol approved by the ethics committee (CPP Grand-Est le 21/04/2020). The study was performed in accordance with the Declaration of Helsinki and Good Clinical Practice guidelines (Clinical trial registration number, NCT04519320).
Author Contributions
All authors made a significant contribution to the work reported, whether that is in the conception, study design, execution, acquisition of data, analysis and interpretation, or in all these areas; took part in drafting, revising or critically reviewing the article; gave final approval of the version to be published; have agreed on the journal to which the article has been submitted; and agree to be accountable for all aspects of the work.
Funding
This study was supported by a grant from the Don Du Souffle for institutional support. The funder had no role in the design and conduct of the study; collection, management, analysis, and interpretation of the data; preparation, review, or approval of the manuscript; and decision to submit the manuscript for publication.
Disclosure
Professor Gilles Capellier is the President of Association le Don du Souffle which has developed apnea syndrome diagnostic activities. Professor Virginie Westeel reports grants from SOS Oxygène, during the conduct of the study. The authors report no other conflicts of interest in this work.
References
1. Jun JC, Chopra S, Schwartz AR. Sleep apnoea. Eur Respir Rev. 2016;25(139):
2. Punjabi NM. The epidemiology of adult obstructive sleep apnea. Proc Am Thorac Soc. 2008;5(2):
3. A Comparison of Apnea–Hypopnea Indices Derived from Different Definitions of Hypopnea. American journal of respiratory and critical care medicine; 2022. Available from: https://www.atsjournals.org/doi/10.1164/ajrccm.159.1.9709017?url_ver=Z39.88-2003&rfr_id=ori:.
4. Young T, Peppard PE, Gottlieb DJ. Epidemiology of obstructive sleep apnea, a population health perspective. Am J Respir Crit Care Med. 2002;165(9):
5. Redline S, Kapur VK, Sanders MH, et al. Effects of varying approaches for identifying respiratory disturbances on sleep apnea assessment. Am J Respir Crit Care Med. 2000;161(2 Pt 1):
6. Ancoli-Israel S, Kripke DF, Klauber MR, Mason WJ, Fell R, Kaplan O. Sleep-disordered breathing in community-dwelling elderly. Sleep. 1991;14(6):
7. Martinez-Rivera C, Abad J, Fiz JA, Rios J, Morera J. Usefulness of truncal obesity indices as predictive factors for obstructive sleep apnea syndrome. Obesity. 2008;16(1):
8. Redline S, Tishler PV. The genetics of sleep apnea. Sleep Med Rev. 2000;4(6):
9. Clinical presentation and diagnosis of obstructive sleep apnea in adults – upToDate; 2021. Available from: https://www.uptodate.com/contents/clinical-presentation-and-diagnosis-of-obstructive-sleep-apnea-in-adults/print.
10. Pinto J, Ribeiro D, Cavallini A, Duarte C, Freitas G. Comorbidities associated with obstructive sleep apnea, a retrospective study. Int Arch Otorhinolaryngol. 2016;20(02):
11. Jennum P, Sjøl A. Epidemiology of snoring and obstructive sleep apnoea in a Danish population, age 30-60. J Sleep Res. 1992;1(4):
12. Young T, Peppard PE, Taheri S. Excess weight and sleep-disordered breathing. J Appl Physiol. 2005;99(4):
13. Phillips BG, Hisel TM, Kato M, et al. Recent weight gain in patients with newly diagnosed obstructive sleep apnea. J Hypertens. 1999;17(9):
14. Phillips BG, Kato M, Narkiewicz K, Choe I, Somers VK. Increases in leptin levels, sympathetic drive, and weight gain in obstructive sleep apnea. Am J Physiol Heart Circ Physiol. 2000;279(1):H234–237. doi:10.1152/ajpheart.2000.279.1.H234
15. Eberst G, Claudé F, Laurent L, et al. Result of one-year, prospective follow-up of intensive care unit survivors after SARS-CoV-2 pneumonia. Ann Intensive Care. 2022;12(1):23. doi:10.1186/s13613-022-00997-8
16. Memtsoudis SG, Ivascu NS, Pryor KO, Goldstein PA. Obesity as a risk factor for poor outcome in COVID-19-induced lung injury, the potential role of undiagnosed obstructive sleep apnoea. Br J Anaesth. 2020;125(2):
17. Miller MA, Cappuccio FP. A systematic review of COVID-19 and obstructive sleep apnoea. Sleep Med Rev. 2021;55:101382. doi:10.1016/j.smrv.2020.101382
18. McSharry D, Malhotra A. Potential influences of obstructive sleep apnea and obesity on COVID-19 severity. J Clin Sleep Med. 2020;16:
19. Pazarlı AC, Ekiz T, Ilik F. Coronavirus disease 2019 and obstructive sleep apnea syndrome. Sleep Breath. 2020;1:371.
20. Moriguchi T, Harii N, Goto J, et al. A first case of meningitis/encephalitis associated with SARS-Coronavirus-2. Int J Infect Dis. 2020;94:
21. Wan D, Du T, Hong W, et al. Neurological complications and infection mechanism of SARS-COV-2. Signal Transduct Target Ther. 2021;6:406. doi:10.1038/s41392-021-00818-7
22. Moldofsky H, Patcai J. Chronic widespread musculoskeletal pain, fatigue, depression and disordered sleep in chronic post-SARS syndrome; a case-controlled study. BMC Neurol. 2011;11:37. doi:10.1186/1471-2377-11-37
23. George PM, Wells AU, Jenkins RG. Pulmonary fibrosis and COVID-19, the potential role for antifibrotic therapy. Lancet Respir Med. 2020;8(8):
24. Heinzer RC, Stanchina ML, Malhotra A, et al. Lung volume and continuous positive airway pressure requirements in obstructive sleep apnea. Am J Respir Crit Care Med. 2005;172(1):
25. Stanchina ML, Malhotra A, Fogel RB, et al. The influence of lung volume on pharyngeal mechanics, collapsibility, and genioglossus muscle activation during sleep. Sleep. 2003;26(7):
26. Lancaster LH, Mason WR, Parnell JA, et al. Obstructive sleep apnea is common in idiopathic pulmonary fibrosis. Chest. 2009;136(3):
27. Mermigkis C, Chapman J, Golish J, et al. Sleep-related breathing disorders in patients with idiopathic pulmonary fibrosis. Lung. 2007;185(3):
28. Schiza S, Mermigkis C, Margaritopoulos GA, et al. Idiopathic pulmonary fibrosis and sleep disorders, no longer strangers in the night. Eur Respir Rev. 2015;24(136):
29. Miller MR, Hankinson J, Brusasco V, et al. Standardisation of spirometry. Eur Respir J. 2005;26(2):
30. Graham BL, Brusasco V, Burgos F, et al. 2017 ERS/ATS standards for single-breath carbon monoxide uptake in the lung. Eur Respir J. 2017;49(1):1600016. doi:10.1183/13993003.00016-2016
31. American Thoracic Society, European Respiratory Society. ATS/ERS recommendations for standardized procedures for the online and offline measurement of exhaled lower respiratory nitric oxide and nasal nitric oxide, 2005. Am J Respir Crit Care Med. 2005;171(8):
32. Berry RB, Brooks R, Gamaldo C, et al. AASM scoring manual updates for 2017 (Version 2.4). J Clin Sleep Med. 2017;13(5):
33. Balk EM, Moorthy D, Obadan NO, et al. Diagnosis and treatment of obstructive sleep apnea in adults. Rockville (MD): Agency for Healthcare Research and Quality (US); 2011. Available from: http://www.ncbi.nlm.nih.gov/books/NBK63560/.
34. Sateia MJ. International classification of sleep disorders-third edition. Chest. 2014;146(5):
35. Arentz M, Yim E, Klaff L, et al. Characteristics and outcomes of 21 critically Ill patients with COVID-19 in Washington State. JAMA. 2020;323(16):1612. doi:10.1001/jama.2020.4326
36. Strausz S, Kiiskinen T, Broberg M, et al. Sleep apnoea is a risk factor for severe COVID-19. BMJ Open Respir Res. 2021;8(1):e000845. doi:10.1136/bmjresp-2020-000845
37. Maas MB, Kim M, Malkani RG, Abbott SM, Zee PC. Obstructive sleep apnea and risk of COVID-19 infection, hospitalization and respiratory failure. Sleep Breath. 2020;2020:
38. Iannella G, Vicini C, Lechien JR, et al. Association Between Severity of COVID-19 respiratory disease and risk of obstructive sleep apnea. Ear Nose Throat J. 2021;1455613211029783. doi:10.1177/01455613211029783
39. Kar A, Saxena K, Goyal A, et al. Assessment of obstructive sleep apnea in association with severity of COVID-19, A prospective observational study. Sleep Vigil. 2021;2021:
40. Chung F, Waseem R, Pham C, et al. The association between high risk of sleep apnea, comorbidities, and risk of COVID-19, a population-based international harmonized study. Sleep Breath. 2021;25(2):
41. Chung F, Yegneswaran B, Liao P, et al. STOP questionnaire, a tool to screen patients for obstructive sleep apnea. Anesthesiology. 2008;108(5):
42. Chiu HY, Chen PY, Chuang LP, et al. Diagnostic accuracy of the Berlin questionnaire, STOP-BANG, STOP, and Epworth sleepiness scale in detecting obstructive sleep apnea, A bivariate meta-analysis. Sleep Med Rev. 2017;36:
43. Europe PMC. The utility of three screening questionnaires for obstructive sleep apnea in a sleep clinic setting. Abstract Europe PMC; 2021. Available from: https://europepmc.org/article/MED/25837173.
44. Labarca G, Henriquez-Beltran M, Llerena F, et al. Undiagnosed sleep disorder breathing as a risk factor for critical COVID-19 and pulmonary consequences at the midterm follow-up. Sleep Med. 2021;S1389–9457(21):128.
45. Goyal A, Saxena K, Kar A, et al. Obstructive sleep apnea is highly prevalent in COVID19 related moderate to severe ARDS survivors, findings of level I polysomnography in a tertiary care hospital. Sleep Med. 2021;S1389–9457(21):350–356.
46. Hu M, Han X, Ren J, Wang Y, Yang H. Significant association of obstructive sleep apnoea with increased risk for fatal COVID-19, A quantitative meta-analysis based on adjusted effect estimates. Sleep Med Rev. 2022;63:101624. doi:10.1016/j.smrv.2022.101624
47. Alexopoulou C, Bolaki M, Akoumianaki E, et al. Sleep quality in survivors of critical illness. Sleep Breath. 2019;23(2):
48. Dhooria S, Sehgal IS, Agrawal AK, Agarwal R, Aggarwal AN, Behera D. Sleep after critical illness, Study of survivors of acute respiratory distress syndrome and systematic review of literature. Indian J Crit Care Med. 2016;20(6):
49. Srikanth JK, Kumar R, Gupta NK, et al. A prospective study evaluating sleep quality and disorders in post-ARDS patients. Sleep Vigil. 2021;2021:
50. Xu J, Zhong S, Liu J, et al. Detection of severe acute respiratory syndrome coronavirus in the brain, potential role of the chemokine mig in pathogenesis. Clin Infect Dis. 2005;41(8):
51. Kheirandish-Gozal L, Gozal D. Obstructive sleep apnea and inflammation, proof of concept based on two illustrative cytokines. Int J Mol Sci. 2019;20(3):459. doi:10.3390/ijms20030459
 © 2022 The Author(s). This work is published and licensed by Dove Medical Press Limited. The full terms of this license are available at https://www.dovepress.com/terms.php and incorporate the Creative Commons Attribution - Non Commercial (unported, v3.0) License.
By accessing the work you hereby accept the Terms. Non-commercial uses of the work are permitted without any further permission from Dove Medical Press Limited, provided the work is properly attributed. For permission for commercial use of this work, please see paragraphs 4.2 and 5 of our Terms.
© 2022 The Author(s). This work is published and licensed by Dove Medical Press Limited. The full terms of this license are available at https://www.dovepress.com/terms.php and incorporate the Creative Commons Attribution - Non Commercial (unported, v3.0) License.
By accessing the work you hereby accept the Terms. Non-commercial uses of the work are permitted without any further permission from Dove Medical Press Limited, provided the work is properly attributed. For permission for commercial use of this work, please see paragraphs 4.2 and 5 of our Terms.