Back to Journals » ClinicoEconomics and Outcomes Research » Volume 17
Prevalence & Economic Burden of Adult Spinal Deformity in a Large United States Commercial Payer Population
Authors Koltsov JC ![]() , Ackerman SJ, McFarlane KH, Mehta S, Brown M, Gardner MJ, Hu SS, Polly DW Jr
, Ackerman SJ, McFarlane KH, Mehta S, Brown M, Gardner MJ, Hu SS, Polly DW Jr
Received 12 June 2025
Accepted for publication 20 September 2025
Published 3 October 2025 Volume 2025:17 Pages 687—704
DOI https://doi.org/10.2147/CEOR.S546619
Checked for plagiarism Yes
Review by Single anonymous peer review
Peer reviewer comments 2
Editor who approved publication: Prof. Dr. Dean Smith
Jayme CB Koltsov,1 Stacey J Ackerman,2 Kelly H McFarlane,1 Sanket Mehta,1 Marsalis Brown,3 Michael J Gardner,1 Serena S Hu,1 David W Polly Jr4
1Department of Orthopaedic Surgery, Stanford University School of Medicine, Redwood City, CA, USA; 2Department of Biomedical Engineering, Johns Hopkins University, San Diego, CA, USA; 3Department of Orthopaedic Surgery, MetroHealth Medical Center, Cleveland, OH, USA; 4Department of Orthopedic Surgery, University of Minnesota, Minneapolis, MN, USA
Correspondence: Jayme CB Koltsov, Department of Orthopaedic Surgery, Stanford University School of Medicine, 450 Broadway Street Pavilion C, 4th Floor, Mail Code 6342, Redwood, CA, 94063, USA, Email [email protected]
Purpose: Evaluate the prevalence and economic burden of adult spinal deformity (ASD) in a large, United States (US) commercial payer population.
Patients and Methods: Patients aged 21– 64 having an encounter with an ASD diagnosis from the MerativeTM Marketscan® Commercial Databases 2016– 2022 were included to calculate prevalence. The economic burden cohort included those with an outpatient ASD encounter and no spine surgery within the prior year. Continuous health plan enrollment was required for tracking. Expenditures are tabulated from the payer and societal perspectives (2023 US$) and rates of utilization and expenditures are reported overall and by service category.
Results: Annual ASD prevalence was 0.50%. 169,855 patients (46± 13 years, 67.7% female) had an outpatient ASD encounter and were included in the economic burden cohort. Total spine-related payer expenditures averaged $7,619 (95% CI; $7,438, $7,800) per patient within 1 year – a payer burden of $3.8 million per 100,000 commercially-insured beneficiaries. Spine-related societal expenditures were $8,759 ($8,570, $8,947) per patient within 1 year – a societal burden of $6.2 billion among the US commercially-insured population. Nonoperative costs comprised 44% of the 1-year payer burden and 48% of the societal burden. While surgical treatment rates were low (3.5% fusions and 2.9% decompressions within 1 year), the associated economic burden was high (55% of payer burden, 51% of societal burden). The 2-year cumulative payer burden totaled $5.4 million per 100,000 commercially-insured beneficiaries, and the US commercially-insured societal burden totaled $8.9 billion.
Conclusion: The burden of both operative and nonoperative care for ASD is large. Considerable opportunity exists for development of improved nonoperative treatment modalities to increase the value of ASD care by reducing the need for continued nonoperative interventions of limited benefit and reducing the use of costly surgical interventions.
Keywords: adult spinal deformity, healthcare resource utilization, costs, payments, payer perspective, societal perspective, economic burden, fusion
Introduction
Adult spinal deformity (ASD) is a highly and increasingly prevalent condition in the aging United States (US) population and carries a large physiologic burden associated with high costs and healthcare resource utilization.1–7 In the movement towards value-based care, ASD is a prime target for payers and policy makers seeking to combat rising healthcare expenditures.
The management of ASD (inclusive of scoliosis, kyphosis, lordosis, and flatback) typically starts with nonoperative modalities, although the strength of evidence regarding the effectiveness of these interventions is limited. Much of the evidence regarding nonoperative modalities is derived from observational research. Randomized trials, when present, have produced disparate results attributable to highly variable patient populations, spinal regions, diagnoses, procedure types, and procedural techniques.8–10 Reported costs of nonoperative treatment range from $1,000-$7,000 annually, while associated improvements in health-related quality of life (HRQOL) such as back pain have so far been limited or nonexistent.2,6,11 ASD surgery is a high-cost intervention, but provides more substantive improvements in several HRQOL metrics, including the Oswestry Disability Index (ODI), Short Form (SF)-6D, and Scoliosis Research Society (SRS) scores.7,12,13 When successful, surgical intervention can be cost-effective; however, the relatively high rates of complications and reoperations in ASD surgery can compromise cost-effectiveness.7,12–15
Therefore, the goals of this study were to: 1) evaluate the prevalence of ASD in a large, national US commercial payer population, 2) determine the total direct economic burden from the perspectives of the US commercial payer and society, and 3) to better understand the breakdown of expenditures by service category such as inpatient admissions, physician office visits, radiology, injections, physical therapy, and pain medications.
Materials and Methods
Cohorts were derived from the MeritiveTM MarketScan® 2016–2022 Commercial Databases (DOI 10.57761/n5v8-0v21). This study was approved by the Stanford University Institutional Review Board (#40974). Marketscan® is a large, national US data resource containing deidentified payment and encounter data from approximately 350 payers and includes data from employer-based health plans of active employees, early retirees, COBRA continuees, and dependents insured by employer-sponsored health plans.16
Estimation of ASD Prevalence
For calculation of the prevalence of ASD within the MarketScan® commercial population, all adult patients aged 21–64 years presenting with diagnoses of scoliosis, kyphosis, flatback, and/or lordosis were identified via International Classification of Diseases-10th revision (ICD-10-CM) codes (Supplemental Table 1). This included patients presenting in the inpatient (Inpatient Admissions Table) and outpatient setting (Outpatient Services Table with accompanying records from the Facility Header file). Note that the MarketScan® Outpatient Services Table contains all outpatient encounters, including those occurring at physician offices, ambulatory surgery centers, and hospital and non-hospital associated outpatient centers. The annual prevalence of ASD within the MarketScan® Commercial population was calculated as: the number of patients that had 1) an ASD diagnosis on at least one encounter during the plan year and 2) full health plan enrollment for that plan year, divided by the total number of fully-enrolled patients in Marketscan® for that plan year. The overall prevalence of ASD in the Marketscan® population was calculated by averaging the prevalence across 2016–2022. ASD can be coded either with location-specific codes or with non-location-specific codes, with these being used interchangeably. ASD is more prevalent in the thoracic, lumbar, and sacral spine than in the cervical spine; and likely most of the patients having non-specific codes are thoraco-lumbar-sacral ASD patients. We therefore calculated the annual prevalence in 2 ways: a primary analysis including both the location-specific and non-specific codes, and a sensitivity analysis using only the location-specific codes. These two prevalence estimates serve as upper and lower bounds on the true prevalence within this population.
Economic Burden Cohort Definition
For the calculation of healthcare resource utilization and payments within the nonoperative ASD MarketScan® cohort, all adult patients aged 21–64 years having one or more outpatient encounters with an associated diagnosis of ASD were identified. The index encounter was defined as the 1st encounter for each patient where an ASD diagnosis was present. Patients were required to have continuous medical and pharmacy enrollment for at least 1 year before and after their index ASD encounter for longitudinal tracking. Patients with diagnoses of pregnancy, neoplasms, intraspinal abscesses, osteomyelitis, discitis, fracture, dislocation, vehicular accidents, and inflammatory spondyloarthropathies were excluded, as documented previously (Supplemental Table 2).17 Patients having thoracic, lumbar, or sacral spine surgery within the year prior were excluded (Supplemental Tables 3 and 4). Patients on capitated or partially-capitated healthcare plans were excluded, as these plans do not report complete, validated financial information. The small subset of patients on plans not reporting outpatient pharmacy data were also excluded.
Calculation of 1-Year Total Payer and Societal Expenditures per Patient
From the index ASD diagnosis, patients were followed for 1 year to track the total spine-related net and gross payments. All payment data were converted to 2023 United States Dollars (US$) using the medical care component of the consumer price index.18 Spine-related payments were identified as payments for any healthcare encounter with a spine-related diagnosis (Supplemental Table 5). The total net payments, representing commercial payer expenditures, were calculated as the sum of all payments made by the payer. The total gross payments, representing the direct economic burden to society, were calculated as the sum of all payments for inpatient admissions, outpatient encounters, and outpatient pharmacy services made by both the payer and the patient (including deductibles, co-pays, and coordination of benefits fees). Indirect costs, such as lost productivity (work presenteeism/absenteeism) and caregiver burden, were not included in the calculation of societal burden. All services for which the total gross payments were negative or 0 were excluded from the payment calculations.
While payment data are highly skewed due to a small proportion of “super-utilizers” accounting for a large proportion of payments,19 we have chosen to present our primary results as means with 95% confidence intervals (CI) expenditures, providing the payer-level expectation regarding the typical amount incurred on a per patient basis. In addition to the total spine-related net and gross payments per patient, spine-related payments were also summed for the following categories:
- Inpatient admissions
- Outpatient services
- Fusion (± decompression) surgery (primary or revision), inclusive of all costs incurred during the surgical admission (or day of outpatient surgery), eg costs for the surgery (including surgeon professional fees, anesthesia, and instrumentation), cost of the hospitalization, etc.
- Other thoraco-lumbo-sacral surgery (primary or revision), inclusive of all costs incurred during the surgical admission (or day of outpatient surgery)
- Inpatient admissions other than for spine surgery
- 18 relevant resource utilization categories (based on Medistat categories contained within Marketscan®): physical therapy (PT) (mental health and substance abuse PT categories excluded), injections, chiropractic care, radiology (X-ray, MRI, and CT), office visits, laboratory services, diagnostic services, surgical supplies and devices, nonsurgical supplies and devices, durable medical equipment, on-site pharmacy (administered at inpatient and/or outpatient facilities), home health services, skilled nursing facilities (SNF), inpatient rehabilitation facilities (IRF), emergency room services (ER), and urgent care
- Spine-related outpatient pharmacy: outpatient pharmacy data within Marketscan® does not include diagnoses, so filled prescriptions were defined as potentially spine-related if they fell into 5 drug categories commonly used for spine-related pain relief (nonsteroidal anti-inflammatory drugs [NSAIDs], opioids, analgesics/antipyretics, muscle relaxants, anticonvulsants, antidepressants, and anxiolytics).20
The number and percentage of patients using each of the above categories of services was also calculated.
Calculation of 1-Year Commercial Payer and Societal Economic Burden
The 1-year total economic burden of ASD per 100,000 commercially-insured beneficiaries was calculated as:

The economic burden of ASD per 100,000 commercially-insured beneficiaries for each service category was calculated as the above for each category multiplied by the proportion of ASD patients using that category of service.
The 1-year total societal burden of direct healthcare costs for commercially-insured ASD patients in the United States was calculated as:

The size of the US commercial payer population aged 21–64 years was determined from the US census.21 The societal burden for each service category was calculated as the above for each category multiplied by the proportion of ASD patients using that category of service.
Sub-Analysis of 2-Year Payer and Societal Economic Burden
A sub-analysis was performed in the subset of patients with continuous medical and pharmacy health plan enrollment through 2 years following their index ASD diagnosis. All calculations parallelled those for the calculation of 1-year payments as outlined above.
Statistical Analyses
Differences in expenditures for patients with versus without surgery were assessed with Mann Whitney U-tests. All descriptive statistics and analysis were computed with SAS version 9.4 (Cary, NC, US).
Results
From 2016–2022, 567,370 patients with a diagnosis of ASD were identified in the MarketScan® Commercial population (Figure 1). The average annual prevalence over this time frame was 0.50% with both location-specific and non-specific codes included (Figure 2). A sensitivity analysis only including the location-specific codes resulted in a lower bound of 0.26% prevalence. The prevalence by year was relatively constant, with the exception of a slight dip in 2020 aligning with fewer patients seeking healthcare services during the coronavirus pandemic.
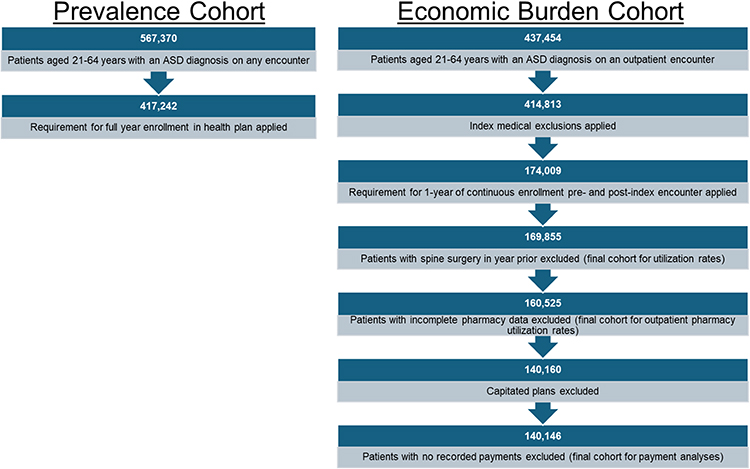 |
Figure 1 Cohort flowcharts for the prevalence and economic burden cohorts. |
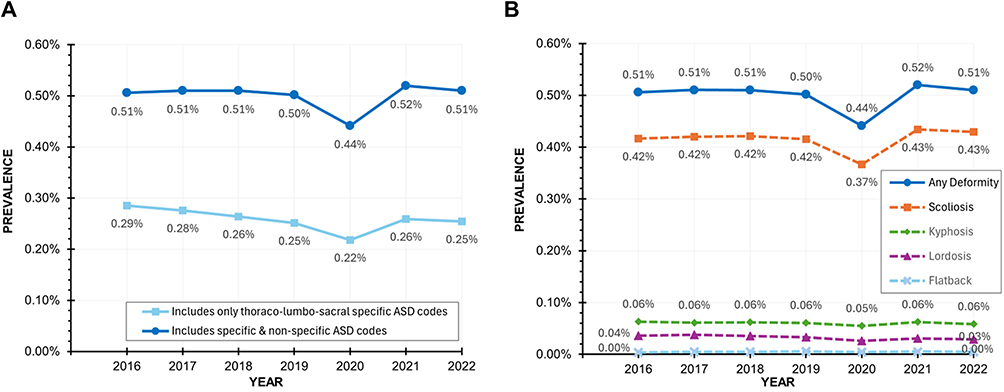 |
Figure 2 (A) Annual prevalence of ASD among the fully-enrolled MarketScan® population when calculated from both location-specific and non-specific codes (primary analysis—upper bound) and from only location-specific codes (sensitivity analysis—lower bound). As thoraco-lumbo-sacral ASD is much more common than cervical deformity, the true prevalence is likely closest to the primary analysis. (B) Annual prevalence of ASD by deformity type. |
Economic Burden Cohort and Medical Resource Utilization
A total of 169,855 unique patients presenting in an outpatient encounter with a diagnosis of ASD and meeting the inclusion and exclusion criteria were identified (Figure 1). Of these, 160,525 had outpatient pharmacy coverage for the year following the index encounter for tracking of outpatient pharmacy utilization, and 140,146 were enrolled in health plans providing accurate financial information and had recorded healthcare payments. The mean age of the cohort was 46 ±13 years, and 67.7% were female. Scoliosis was the most common diagnosis (81.9%), followed by kyphosis (11.4%), lordosis (7.1%), and flatback (0.8%). Commercial health plan types included preferred provider organizations (54.0%), consumer-driven (12.6%), health maintenance organizations (10.9%), high deductible (9.4%), point of service (6.5%), comprehensive (3.5%), exclusive provider organizations (0.9%), and point of service with capitation (0.8%).
Within 1 year, 3.5% of the cohort had fusion surgery (± decompression) and 2.9% had decompressive or other thoraco-lumbo-sacral surgery not involving fusion (Table 1). In the subset of patients with 2 years of continuous health plan enrollment following their index encounter (n = 101,077), 4.5% had fusion surgery and 4.0% had decompressive or other thoraco-lumbo-sacral surgery. Of those having fusion within the 1st year, 8.5% to 15.3% had another spine surgery within the 1st year, and 16.9% to 22.2% had another spine surgery within 2 years. The lower bounds on these ranges exclude surgeries within 1 week of each other to conservatively exclude the second stages of staged surgeries (planned and unplanned), while the upper bound has no such constraint. Similarly, of those having decompressive or other non-fusion surgery within the 1st year, 8.6% to 14.0% had another spine surgery within the 1st year, and 17.2% to 20.6% had another spine surgery within 2 years. Patients had a median of 7 [interquartile range (IQR): 3, 15] PT sessions, 2 [1,3] injections, and 8 [3, 16] chiropractic sessions within 1 year. Of patients with outpatient pharmacy coverage, nearly one-third (30.8%) of patients used opioids within one year after the index encounter for ASD and 40.9% used opioids within 2 years.
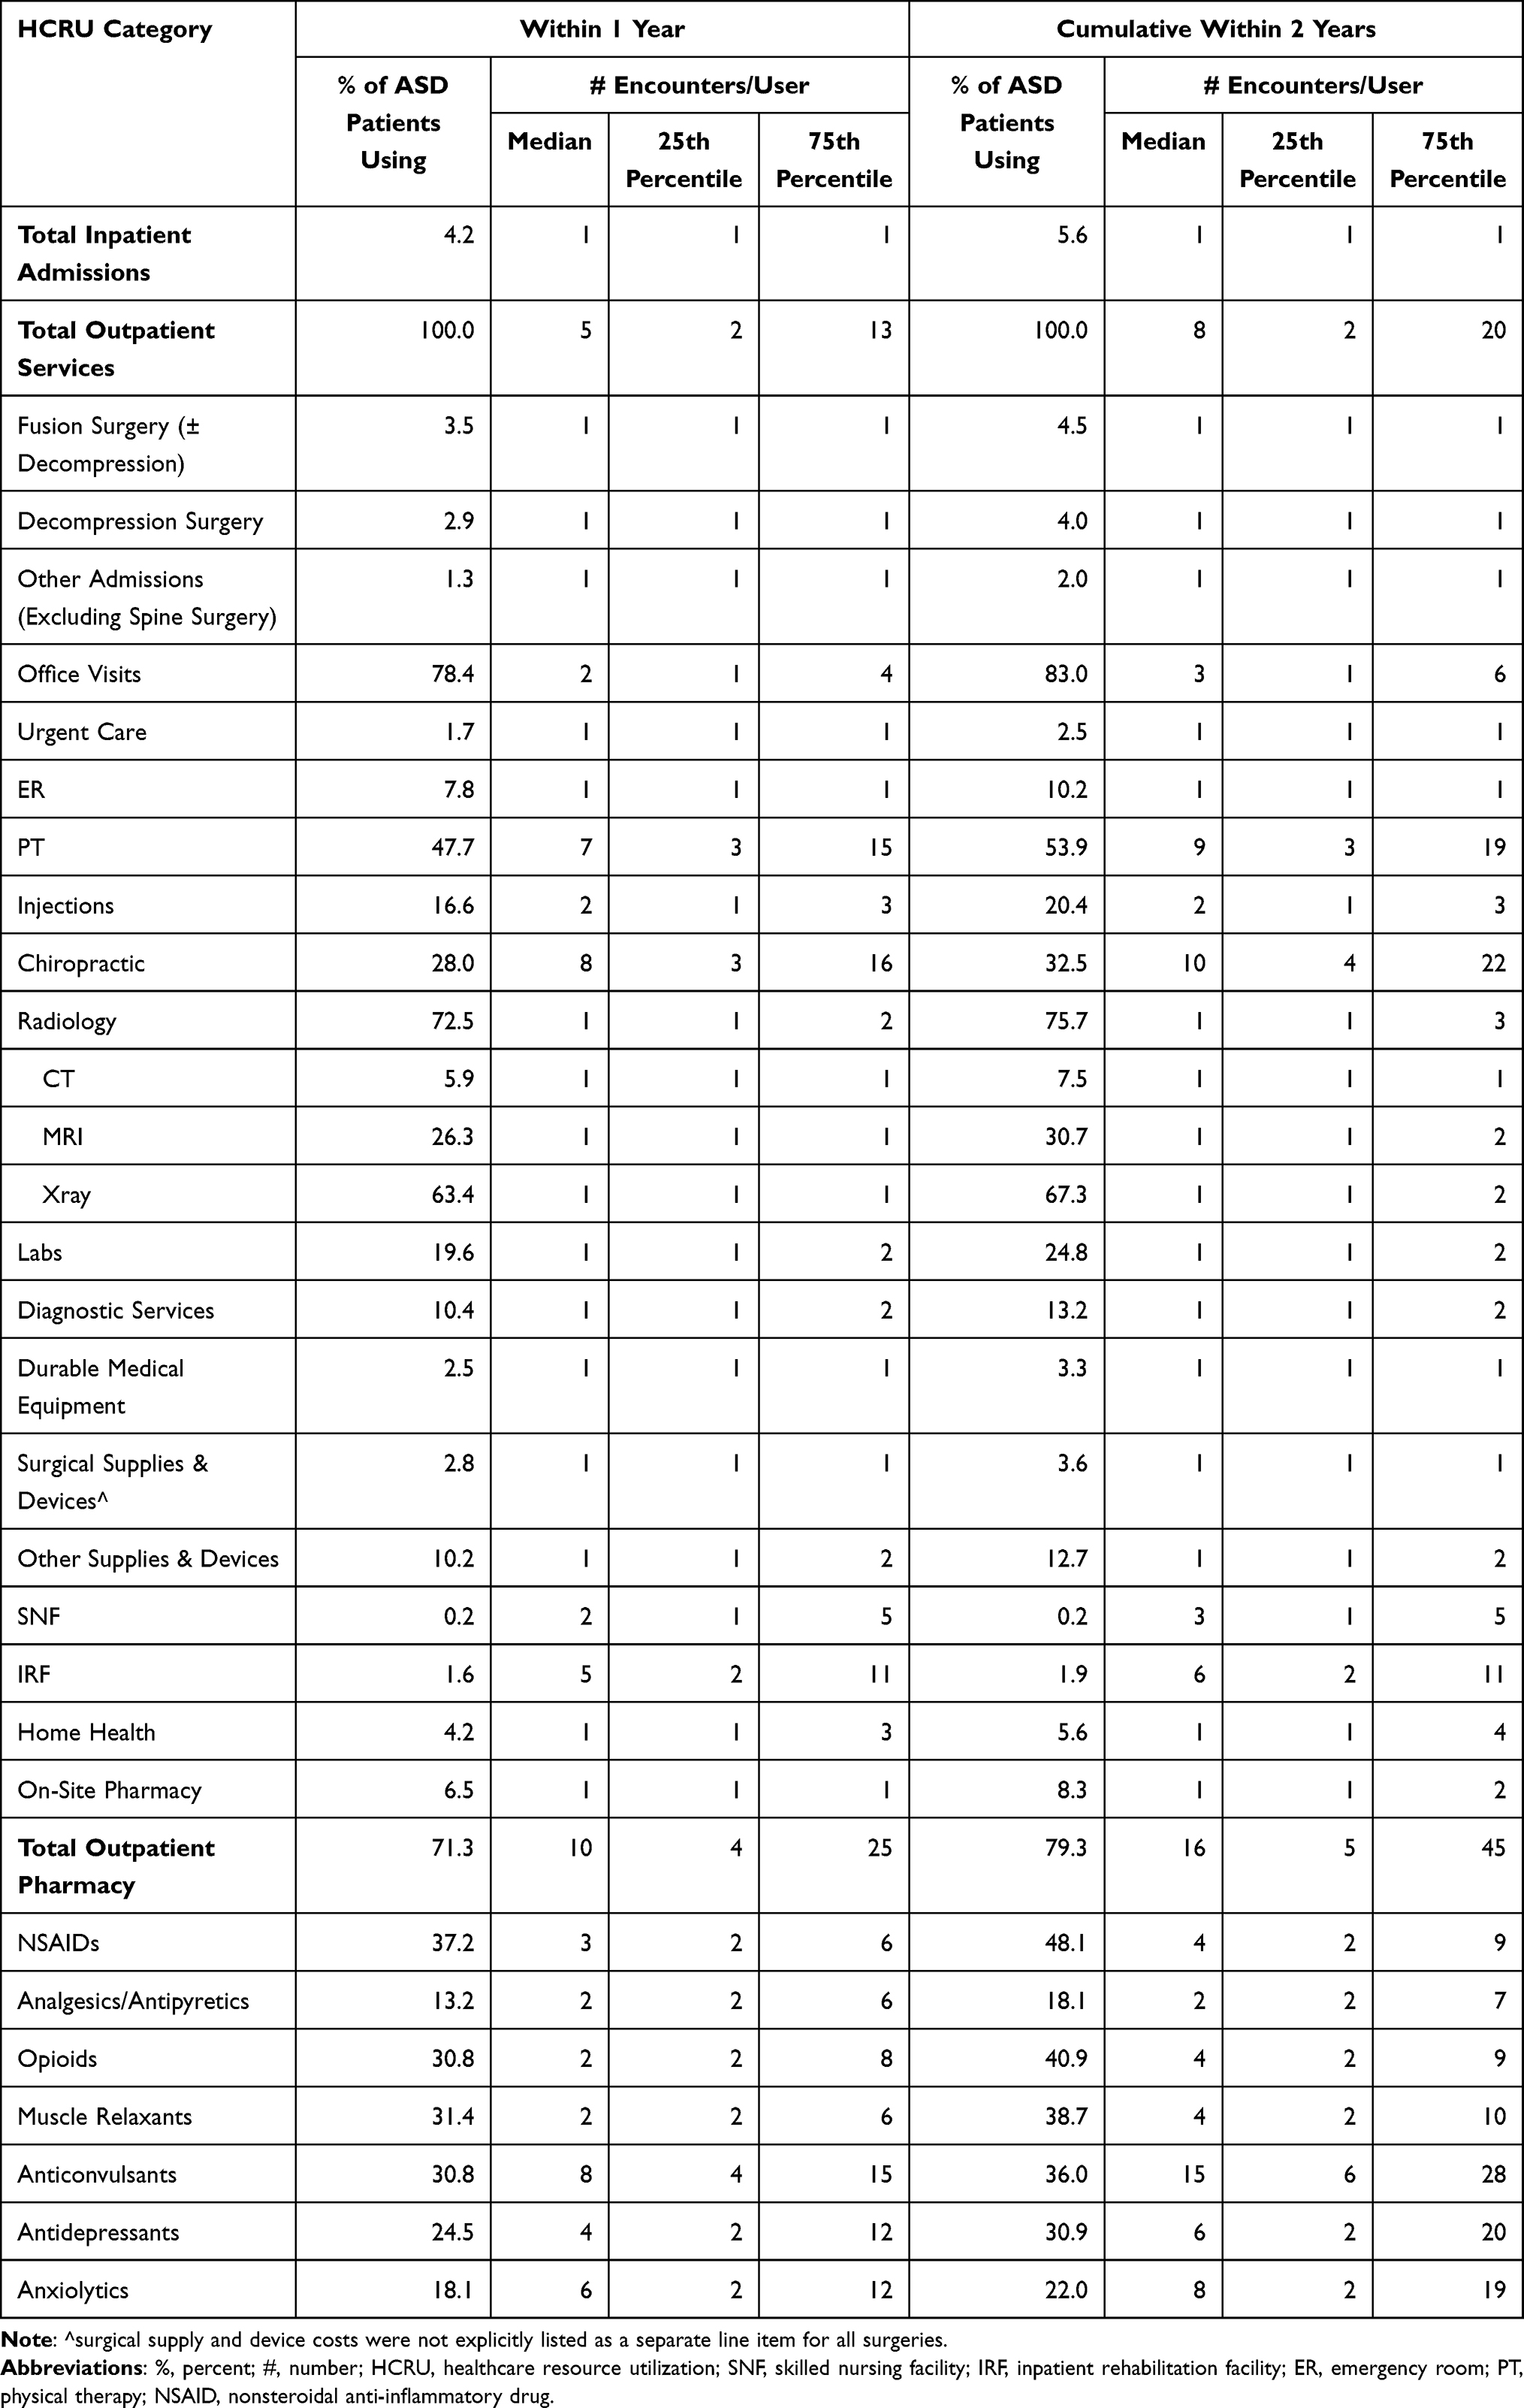 |
Table 1 % of ASD Patients Using Each Category of Service and the Number of Encounters of Each Service Type per User (Presented as Medians with 25th and 75th Percentiles) |
Commercial Payer Economic Burden
The total spine-related payer expenditures averaged $7,619 (95% CI; $7,438, $7,800) per patient within the 1st year following the index outpatient encounter for ASD (Table 2). In the subset of patients with 2-year follow up, total spine-related payer expenditures across 2 years following the index encounter averaged $10,752 ($10,475, $11,029). The total expenditures for nonoperative spine care averaged $3,338 ($3,259, $3,418) in the 1st year and $5,175 ($5,032, $5,319) across 2 years. In those having surgery, payer expenditures per patient averaged $100,494 ($97,187, $103,800) for fusion surgery and $23,093 ($22,238, $23,949) for other decompressive surgery within the 1st year. Interestingly, patients who had their 1st spine surgery in the 2nd year incurred 2.5-fold higher payer expenditures for nonoperative care within the 1st year relative to those that did not go on to have surgery [$7,177 ($6,416, $7,937) vs $2,849 ($2,777, $2,921); p<0.001]. For patients who had spine surgery within the 1st year but no additional surgery in the 2nd year, payer expenditures in the 2nd year for nonoperative care remained elevated versus those that never had surgery [$3,947 ($3,590, $4,305) vs $1,743 ($1,675, $1,810); p<0.001].
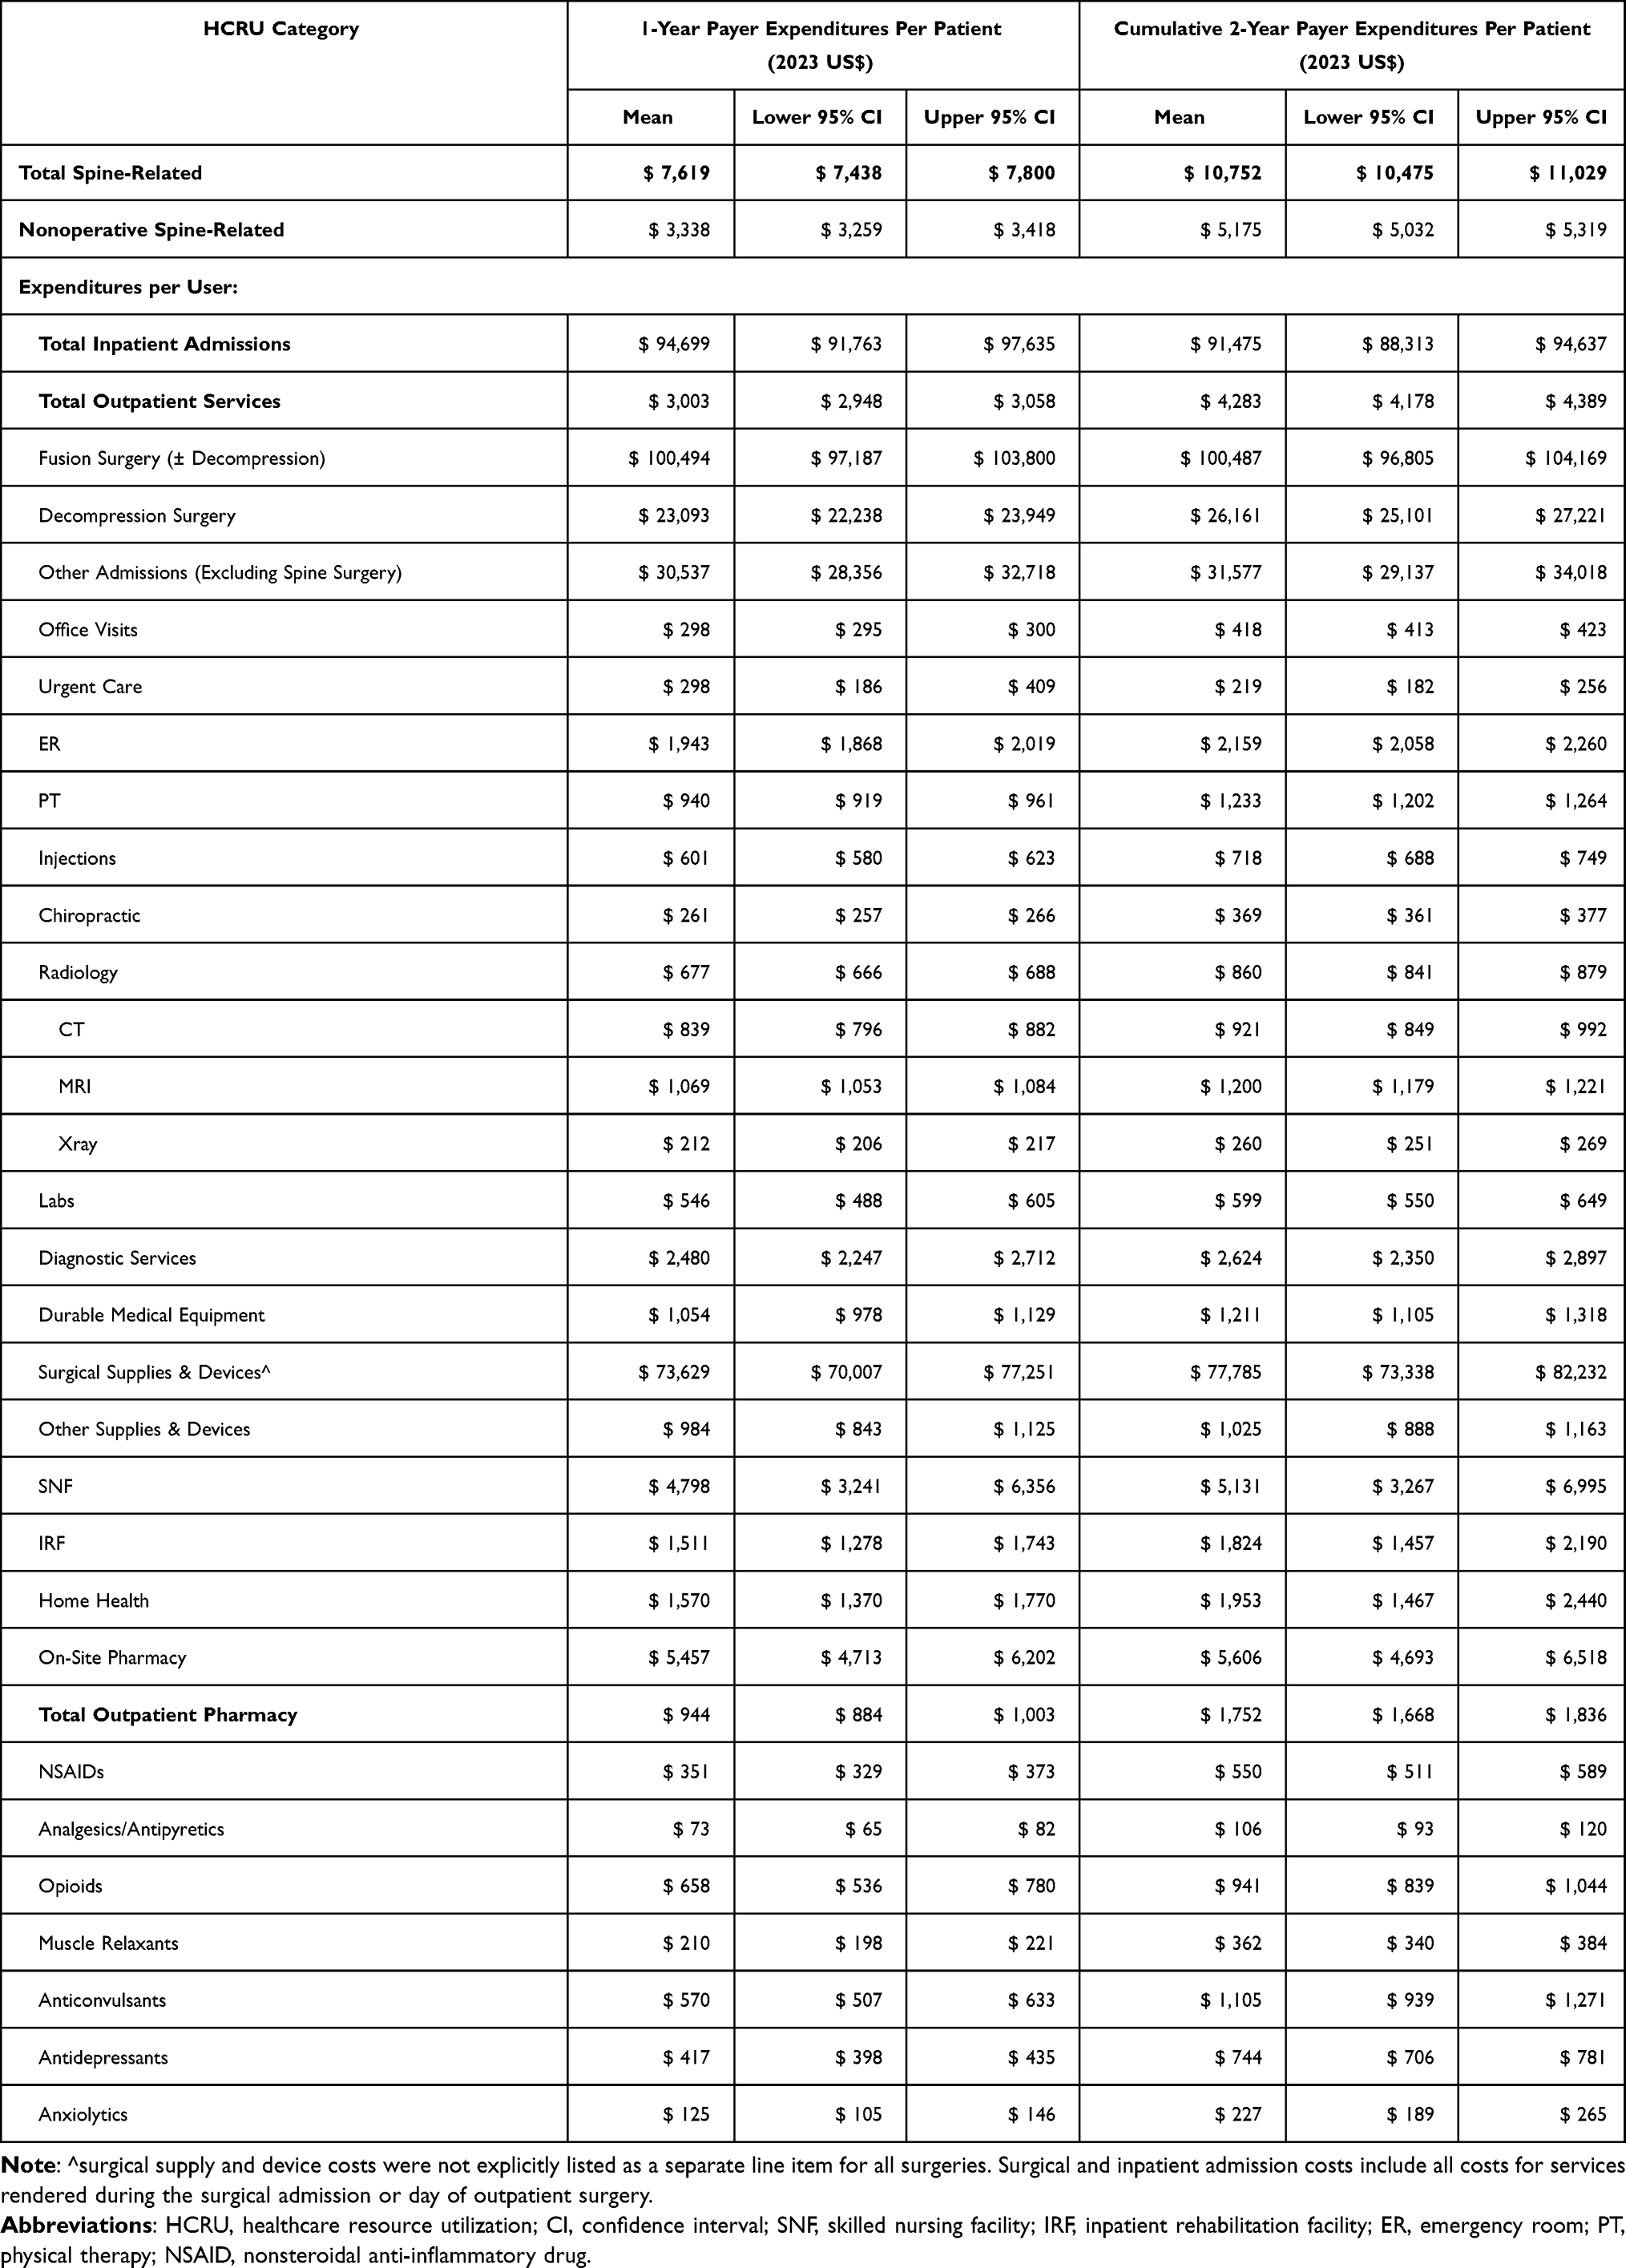 |
Table 2 Spine-Related Payer Expenditures (2023 US$) Per Patient Overall and Per User for Each Service Category |
Payer expenditures per 100,000 commercially-insured beneficiaries totaled over $3.8 million for ASD patients in the 1st year following the index outpatient encounter (Table 3). Payer expenditures for nonoperative spine care totaled over $1.7 million per 100,000 beneficiaries, 43.8% of total expenditures. While only 3.5% of patients underwent spinal fusion, fusion surgery accumulated a $1.8 million in payer expenditures per 100,000 commercially-insured beneficiaries, 46.3% of total payer expenditures (Figure 3). For some surgeries, the surgical supply and device costs were included within the surgical payment and not explicitly as a separate line-item. In cases where these costs were explicitly enumerated, over half of the surgical costs were attributable to surgical supply and device costs. Other categories of service with high payer burdens per 100,000 beneficiaries included pharmacy ($336,254 outpatient, $177,997 inpatient), decompression surgery ($333,372), radiology ($245,278), PT ($224,007), and hospital admissions other than those for spine surgery ($198,492). Over 2 years total spine-related expenditures per 100,000 commercially-insured beneficiaries increased to nearly $5.4 million, with $2.6 million (48.1%) going to nonoperative care.
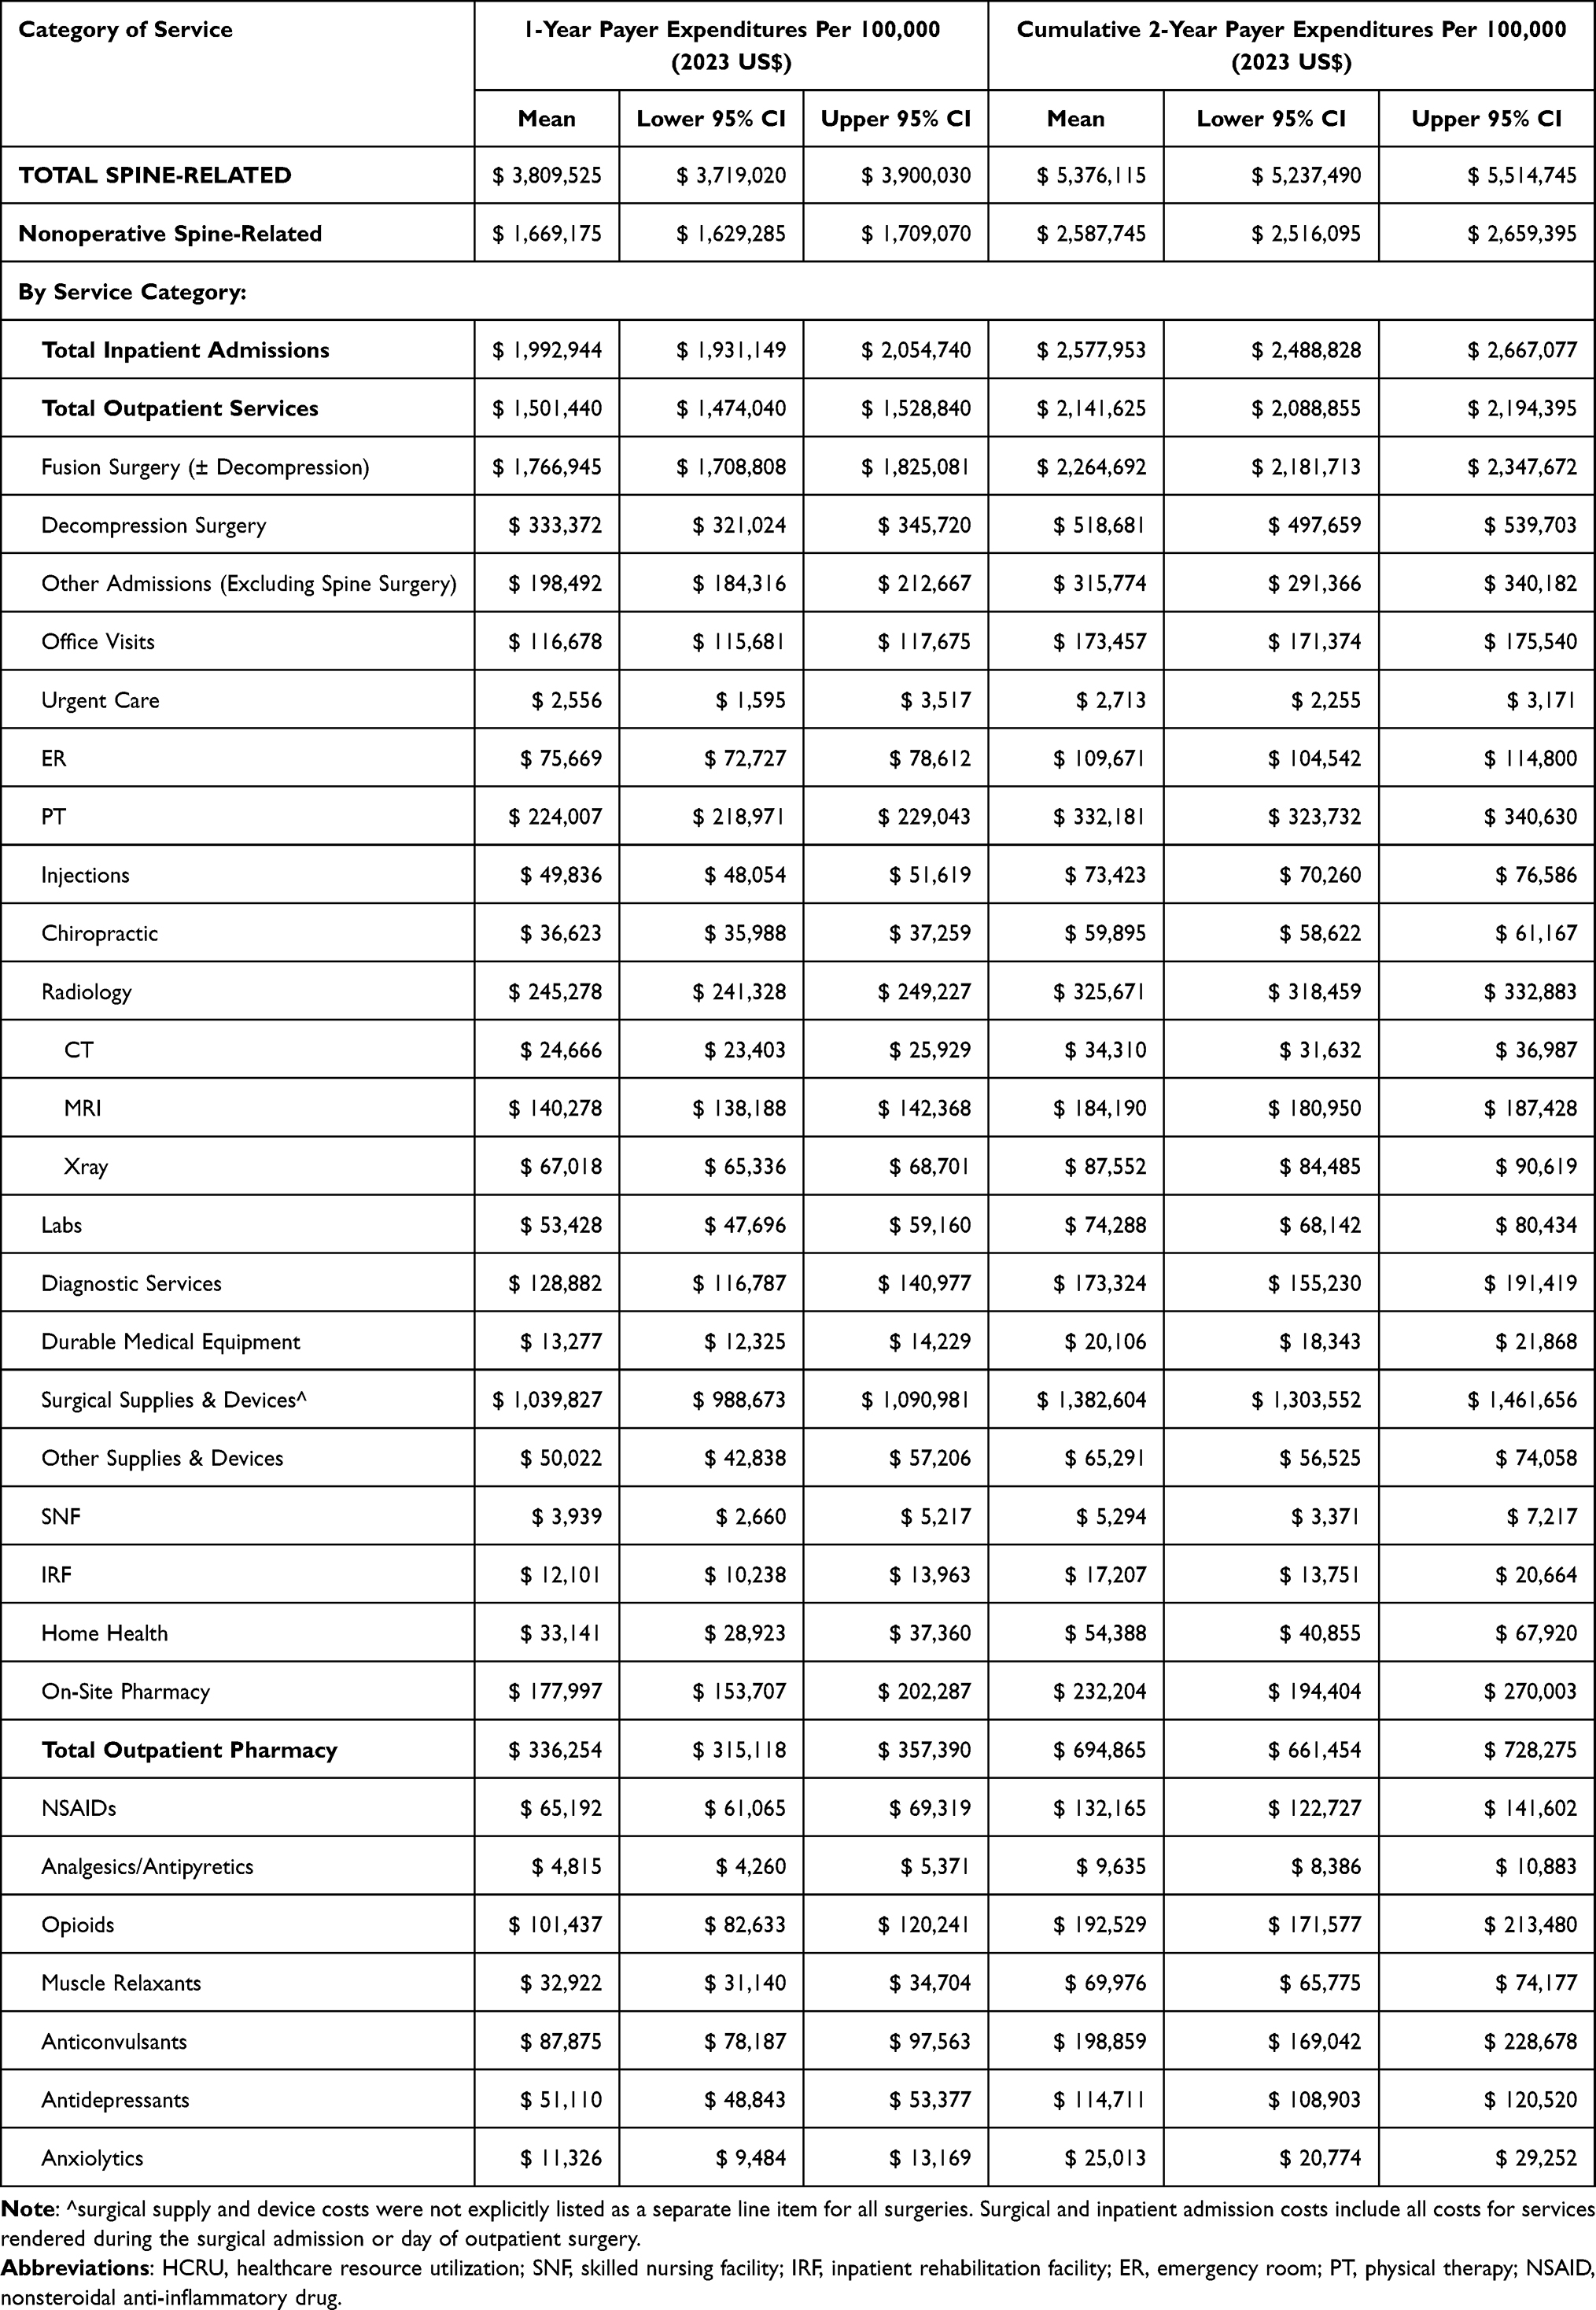 |
Table 3 Spine-Related Payer Expenditures (2023 US $) Per 100,000 Commercially-Insured Beneficiaries Overall and By Service Category |
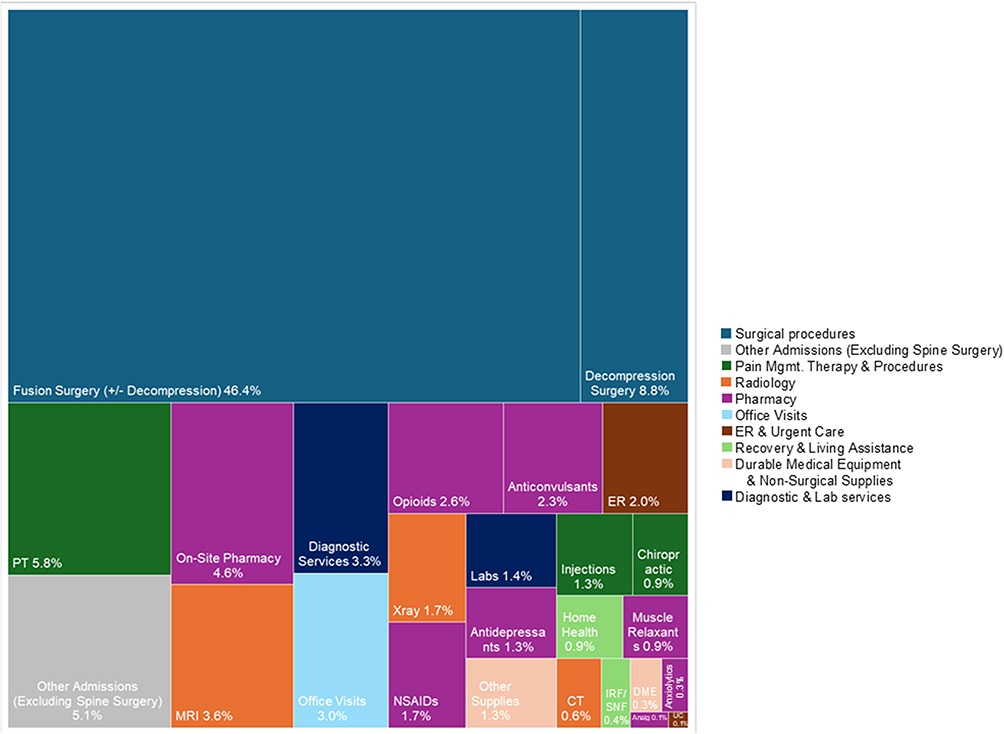 |
Figure 3 Visual representation showing the percent of 1-year spine-related payer expenditures per 100,000 commercially-insured beneficiaries incurred for each category of service. Boxes are scaled to the percentage of total expenditures. Surgical cost categories include costs of surgical supplies and devices. Note that the surgical costs include all costs from the procedure and any associated admission, so there is some minor overlap with other categories. Abbreviations: PT, physical therapy; MRI, magnetic resonance imaging; NSAIDS, nonsteroidal antinflammatory inhibitors; On-site RX, onsite pharmacy; IRF/SNF, inpatient rehabilitation facility/skilled nursing facility; Analg, analgesics/antipyretics; UC, urgent care. |
Societal Economic Burden
The total spine-related societal burden per ASD patient averaged $8,759 ($8,570, $8,947) per patient within the 1st year following the index outpatient encounter for ASD (Table 4). In the 2-year subset, the total spine-related societal burden across the 2 years following the index encounter averaged $12,460 ($12,168, $12,752) per patient. The total societal expenditures for nonoperative spine care averaged $4,239 ($4,115, $4,323) in the 1st year and $6,563 ($6,410, 6,716) across 2 years. In those having surgery, the per patient surgical expenditures in the first year averaged $105,224 ($101,808, $108,640) for fusion surgery and $25,391 ($24,464, $26,318) for other decompressive surgery. Patients who had their 1st spine surgery in the 2nd year incurred nearly 2.5-fold higher societal expenditures for nonoperative care within the 1st year relative to those that did not go on to have surgery [$8,875 ($7,998, $9,752) vs $3,697 ($3,621, $3,774); p<0.001]. For patients who had spine surgery within the 1st year but no additional surgery in the 2nd year, societal expenditures for nonoperative care in the 2nd year remained elevated versus those that never had surgery [$4,746 ($4,361, $5,130) vs $2,189 ($2,118, $2260); p<0.001].
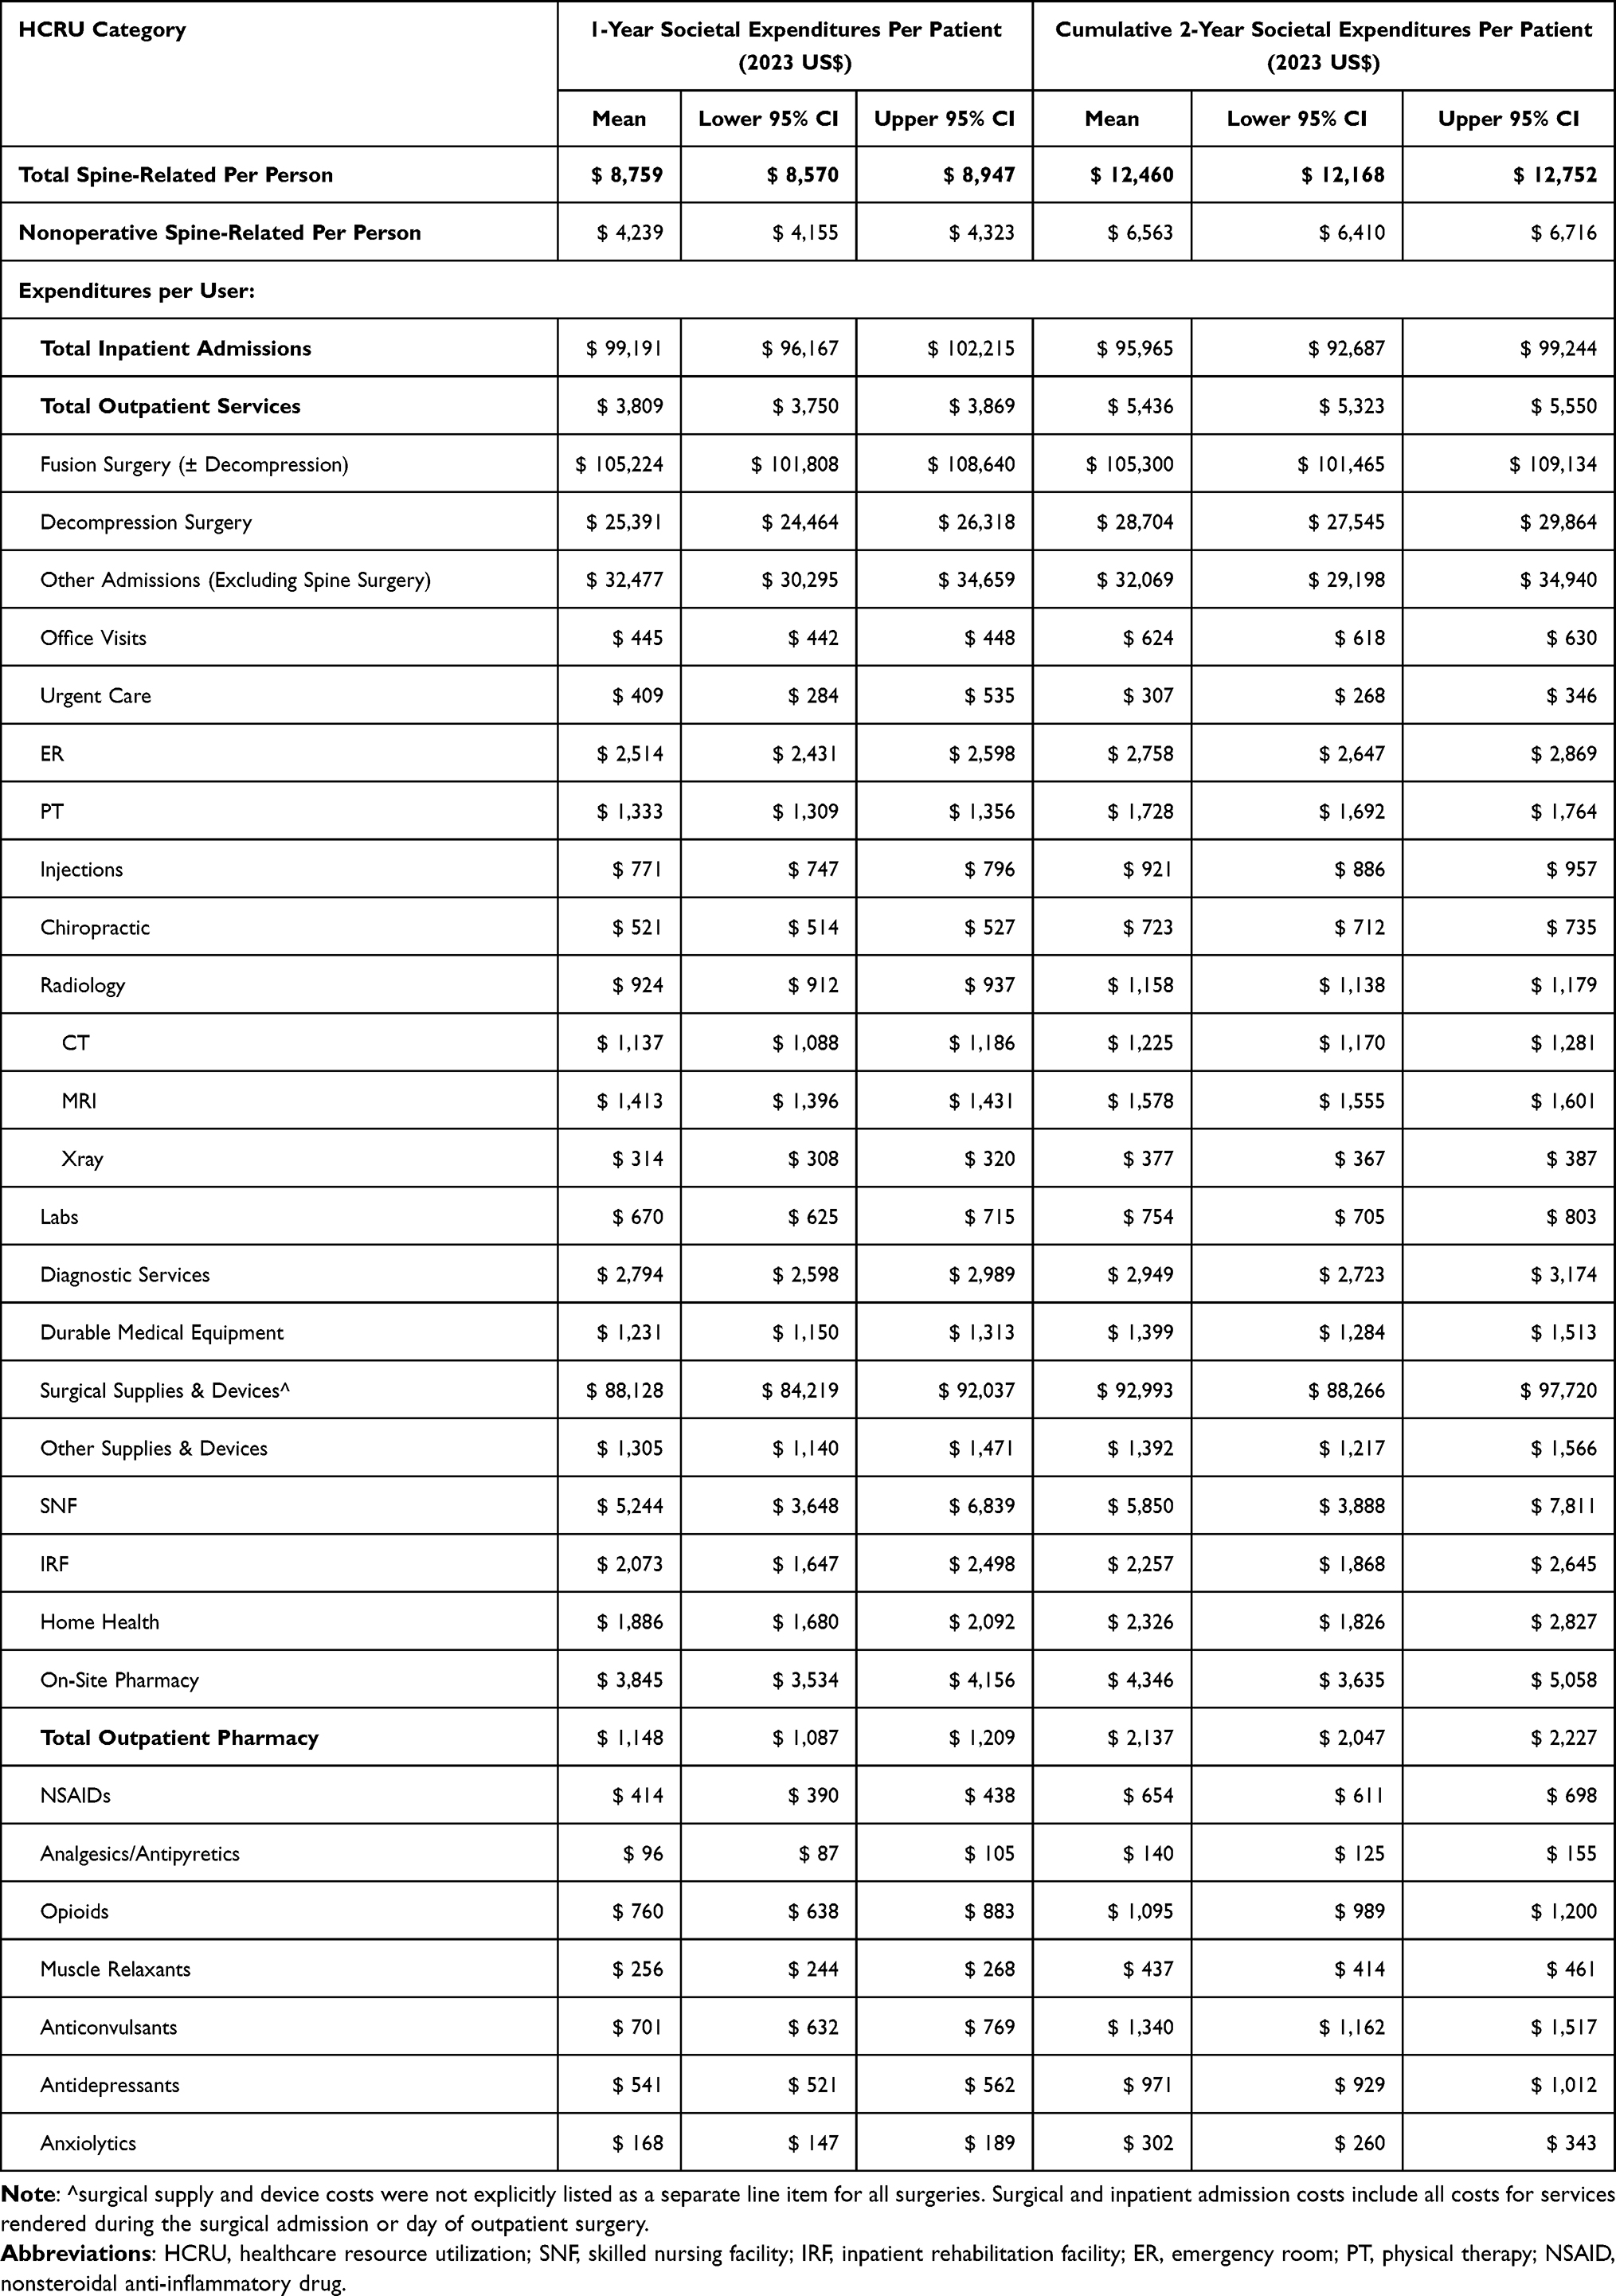 |
Table 4 Total Spine-Related Expenditures (2023 US $) per Patient Overall and per User for Each Service Category from the Societal Perspective. This Includes All Payments Made by the Payer and Patient. Not Included are Indirect Costs and Any Payments Not Processed Through the Payer Such as Those for Over-the-Counter Medication |
By subtracting payer from societal expenditures, the resulting average patient out-of-pocket expense for spine care totaled to $1,141 ($1,098, $1,184) within 1 year and $1,709 ($1,639, $1,779) within 2 years. The patient out of pocket for nonoperative spine care, alone, totaled to $901 ($883, $919) within 1 year and $1,388 ($1,353, $1,423) within 2 years. Among patients with spine surgery, average surgical out of pocket was $3,834 ($3,179, $4,488) within 1 year and $4,048 ($3,262 $4,833) within 2 years. The patient was responsible for 21.2% of the 1-year societal economic burden for nonsurgical spine care and, among those with spine surgery, 2.9% of the 1-year societal economic burden for operative spine care.
The total societal burden of spine-related care for ASD among the approximately 142 million US commercially-insured population aged 21 to 64 totaled over $6.2 billion in the 1st year following the index ASD encounter (Table 5). The burden of nonoperative spine care was $3.0 billion, 48.4% of societal expenditures. The burden of spinal fusion surgery, alone, was $2.6 billion in the 1st year following the index outpatient encounter, or roughly 42.2% of total expenditures (Figure 4). Other high-burden categories of service included pharmacy ($582 million outpatient, $178 million inpatient), decompression surgery ($522 million), radiology ($477 million), physical therapy ($452 million), hospital admissions other than those for spine surgery ($300 million), and office visits ($248 million). The burden of ER encounters, chiropractic care, and diagnostic services also totaled over $100 million each within the 1st year. Over 2 years, the societal burden of spine care increased to nearly $8.9 billion, $4.7 billion of which was for nonoperative care.
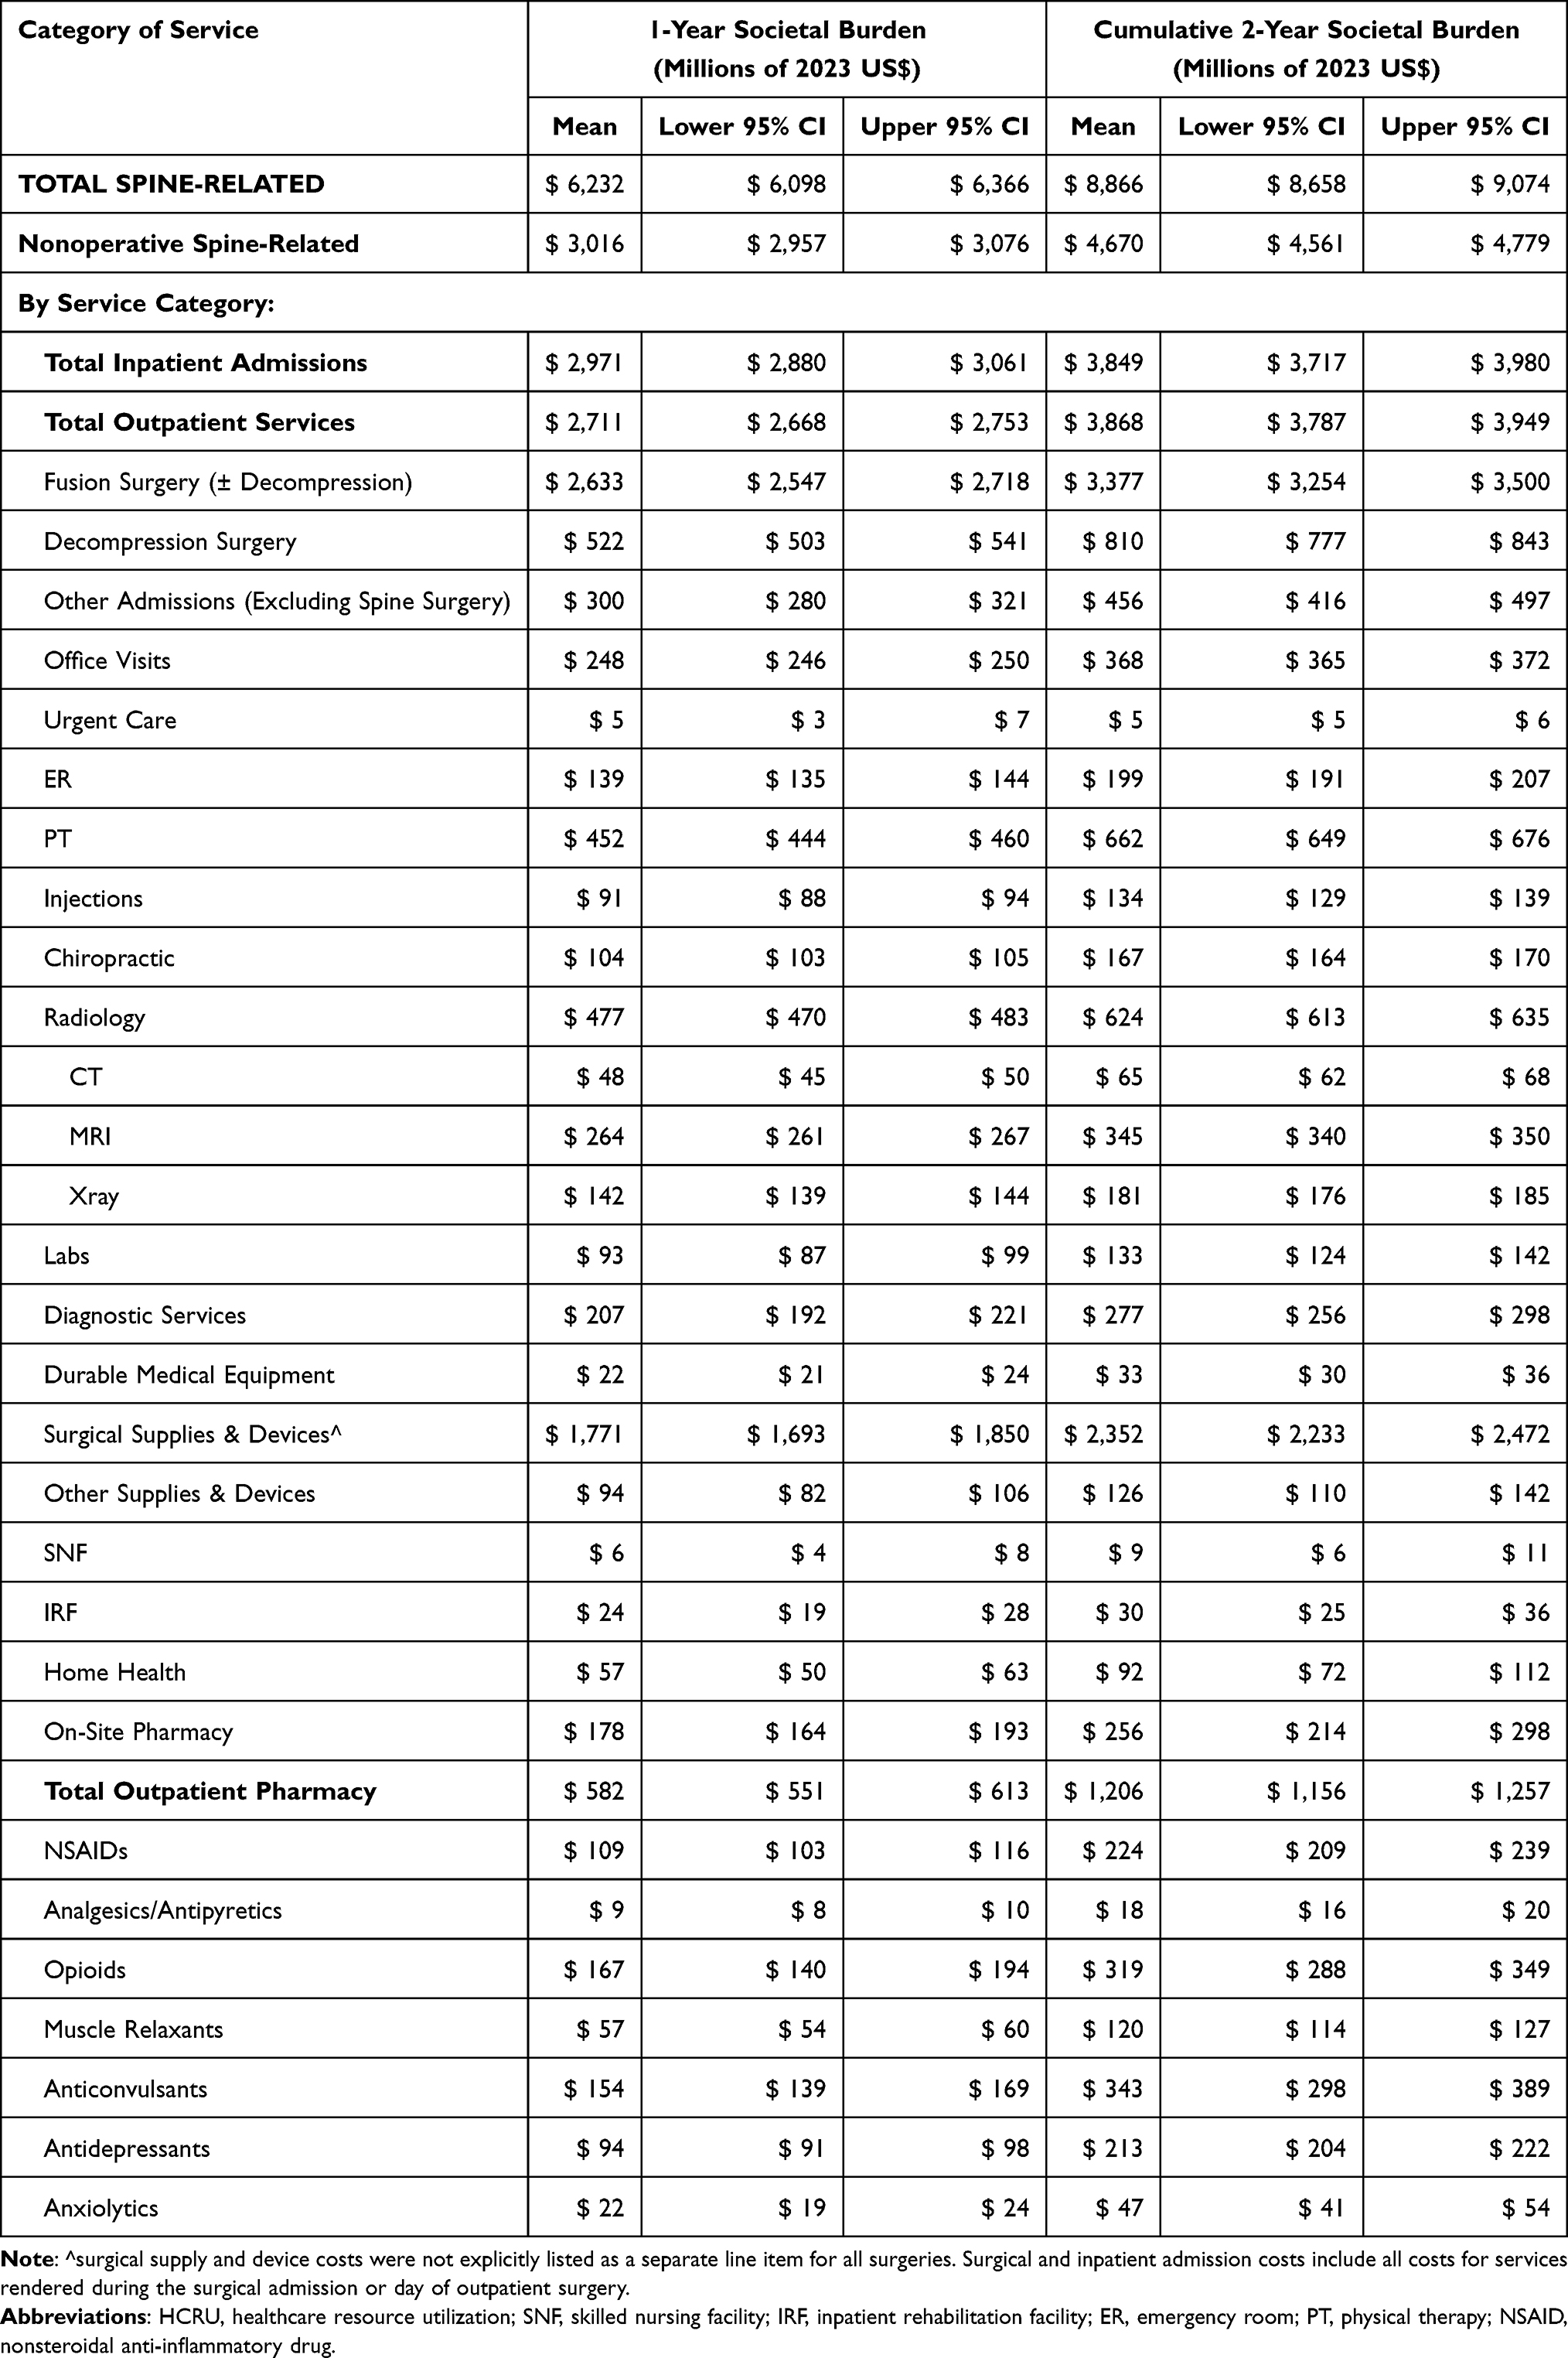 |
Table 5 Societal Economic Burden of ASD Within the US Commercial Payer Population Aged 21 to 64 Overall and by Category of Service in Millions of 2023 US Dollars |
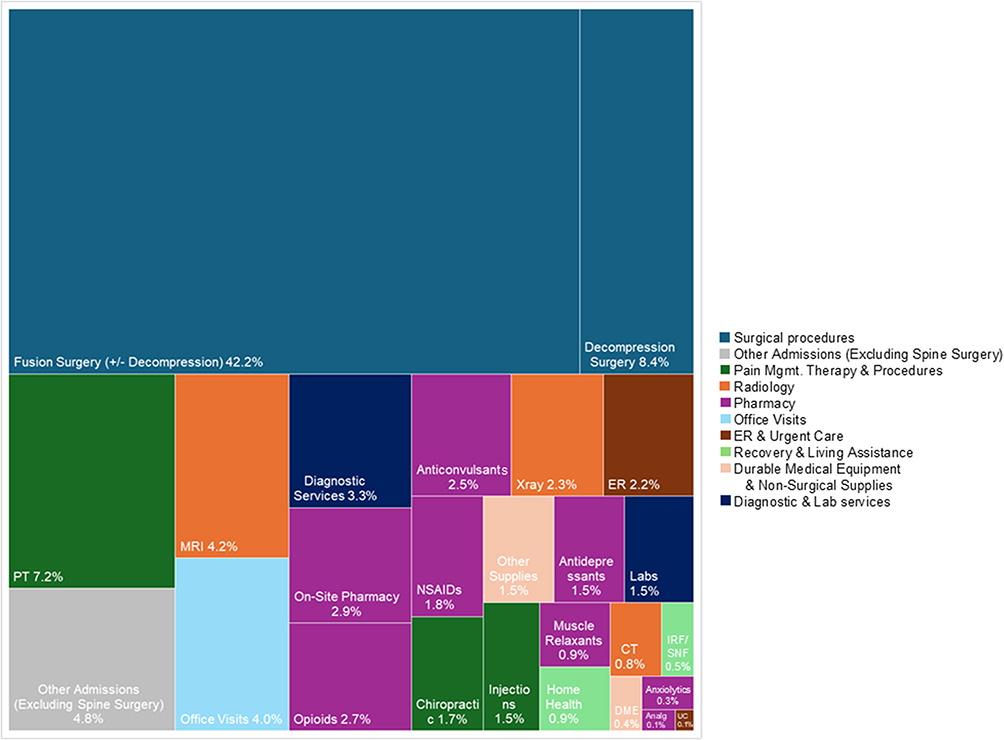 |
Figure 4 Visual representation showing the percent of 1-year spine-related societal expenditures projected for the US commercially-insured population aged 21–64 by category. Boxes are scaled to the percentage of total expenditures. Surgical cost categories include costs of surgical supplies and devices. Note that the surgical costs include all costs from the procedure and any associated admission, so there is some minor overlap with other categories. Abbreviations: PT, physical therapy; MRI, magnetic resonance imaging; NSAIDS, nonsteroidal antinflammatory inhibitors; On-site RX, onsite pharmacy; IRF/SNF, inpatient rehabilitation facility/skilled nursing facility; Analg, analgesics/antipyretics; UC, urgent care. |
Discussion
In a large, US national commercial payer cohort the prevalence of ASD in patients aged 21–64 was 0.50%. Extrapolating to the US commercially-insured population, this translates to 711,558 patients. During the 1st year following the index ASD encounter, the associated commercial payer burden of ASD per 100,000 beneficiaries was $3.8 million. An Accountable Care Organization with 500,000 adult beneficiaries can expect $19.0 million in spine-related expenditures from patients receiving an ASD diagnosis within the 1st year, alone, and $26.9 million within 2 years.
Our calculated 0.50% prevalence rate in the MarketScan® commercial population is slightly lower than the 0.74% reported previously from analyses of administrative data by the Orthopaedic Research Society US Bone & Joint Initiative who counted multiple ASD diagnoses per patient separately.22 Prior analyses showing higher prevalence rates have used a lower curve severity threshold (Cobb angle of ≥10 degrees versus ≥20 degrees) for defining scoliosis, included asymptomatic patients, and/or included older adults or those being referred to specialty clinics, among which prevalence rates are higher.4,23 Further, between 20% and 50% of adults with ASD seek treatment.22,24 Our claims-based prevalence calculations represent a national “community-based” cohort of adults who are symptomatic seeking medical services for ASD. This is likely an underestimation of the true burden of ASD in this population, as ASD is under-coded in claims data. In fusion surgery, claims coding of scoliosis demonstrated a sensitivity of 94% and a specificity of 97% when compared against the medical record.25 However, the sensitivity of ASD diagnoses is likely lower in the non-surgical and outpatient setting. Indeed, in the current study, summed payments for services with an ASD diagnosis listed on the claim were vastly lower than expected and, therefore, we opted to present spine-related payments for the defined ASD cohort, which are likely a more accurate reflection of the burden of ASD-associated treatment. An illustrative scenario is as follows: An ASD patient receives an injection for stenosis caused by their ASD. On the submitted claim, the stenosis diagnosis is most important to receiving reimbursement from the payer, while the ASD that caused the stenosis is not required for reimbursement and therefore is less likely to be coded. Despite limitations in sensitivity, the coding of spine diagnoses in claims data tends to be highly specific, meaning that when the ASD code is present, it is highly likely that the patient has ASD.25,26
Our study demonstrated that 3.5% of patients underwent fusion surgery and 2.9% underwent other decompressive surgery within one year of the index ASD encounter. By comparison, Passias et al reported a conversion rate of 12.7% (24/189) from nonoperative to operative treatment within one year among patients considering surgical correction depending on the success of nonoperative treatment.27 Compared to our community-based cohort that initially sought outpatient care, the Passias study included patients with more severe spinal deformity who sought initial treatment at a surgical clinic. As such, our results would be generalizable to commercially-insured ASD patients aged 21–64 years who sought care initially on an outpatient basis. Among these patients, from a payer perspective, fusion and other decompressive surgery costs totaled to $2.1 million per 100,000 commercially-insured beneficiaries in the 1st year, increasing to $2.8 million within 2 years. From the societal perspective, this equates to $3.2 billion in direct healthcare expenditures for the US commercially-insured population within 1 year and $4.2 billion within 2 years. In cases where the surgical supply and device costs were explicitly enumerated, more than half of the surgical expenditures were attributable to payments for surgical supplies and devices.
The management of ASD typically starts with nonoperative modalities. Nonoperative payer expenditures per patient averaged $3,338 ($3,259, $3,418) within the 1st year following the index outpatient ASD diagnosis, and the total societal nonoperative expenditures averaged $4,239 ($4,115, $4,323). This is in line with prior reports of nonoperative treatment ranging from $1,000-$7,000 annually.2,6,11 In the current study, nonoperative care constituted a payer burden of $1.7 million per 100,000 commercially-insured beneficiaries within 1 year and $2.6 million within 2 years. The US commercially-insured societal burden in patients aged 21–64 totaled to $3.0 billion within 1 year and $4.7 billion within 2 years. Patients were responsible for 21% of the nonoperative 1-year societal economic burden. Patients that had spine surgery incurred more than twice the payer and societal expenditures for nonoperative care in the year preceding and the year following surgery relative to those who did not undergo surgery. It is possible that the patients progressing to surgery have more severe deformity and/or symptoms, but surgical patients may also be required to try more nonoperative treatments as a prerequisite to surgery and have required PT during their surgical recovery. Further study is warranted to determine whether the increased expenditures for nonoperative care correlate with disease and symptom severity and whether we can use this information to better optimize these patients to surgery sooner rather than spending additional nonoperative resources with limited benefit. Despite the large amount of healthcare dollars being allocated to continued use of nonoperative therapies, the strength of evidence regarding the effectiveness of these interventions is limited.8–10 Much of the evidence regarding nonoperative modalities is derived from observational research. Randomized trials, when present, have produced disparate results attributable to highly variable patient populations, spinal regions, diagnoses, procedure types, and procedural techniques. In contrast, surgical intervention offers substantive improvements in several health-related quality of life HRQOL domains, including back pain, and can be highly cost-effective when successful.7,12–15 However, surgery is a costly intervention and the cost-effectiveness can be further compromised by the relatively high rates of complications and reoperations. Thus, there is a critical need for extensive research into appropriate patient indications and procedural approaches or nonoperative management. Furthermore, considerable opportunity exists for the development of new and improved nonoperative interventions to increase the value of nonoperative ASD management.
Claims data present inherent strengths and limitations. Of note, MarketScan® is one of few claims resources providing true payment rather than charge data. The Marketscan® financial data captures the vast majority of direct medical payments, including out of pocket costs paid by the patient (copayments, deductibles, and coordination of benefits fees) in addition to all payments made by the payer.16 Nonetheless, there are some out of pocket expenses that are not captured, such as those for over-the-counter pain medication and complementary/alternative medicine. Quality-of-life and indirect cost data will also be essential for examining the value derived from these ASD healthcare expenditures. The present study demonstrated that the total societal direct cost burden from the US commercially-insured population was $6.2 billion in the 1st year following the index ASD encounter, which does not consider indirect costs. Indirect costs related to absenteeism, loss of productivity, and caretaker time are substantial in commercially-insured, working-age ASD patients and are not well documented due to the considerable challenges in collecting this type of data.28–30 In the context of degenerative spine conditions, indirect costs over 1–2 years ranged from $3,540 to $8,852 (2023 US$) per patient.31
Claims data contain relatively limited clinical information. Our analysis is inclusive of multiple types of ASD, including kyphotic and hyper- and hypo-lordotic deformities, which are rare in comparison to scoliosis (Figure 2B). Future studies with more detailed information regarding deformity type and severity, and pain and symptom duration and severity will be important to understanding variations within the ASD population and how these factors influence costs. Additional study of variations in outcomes by the timing and type of surgical intervention are also warranted. With regards to the outpatient pharmacy data, Marketscan® includes no associated diagnosis information. While the omission of over-the-counter medications from claims data will cause an underestimation of total drug costs, the lack of associated diagnoses will conversely cause some overestimation of total drug costs. We opted to more inclusively capture all filled prescriptions falling into the 5 drug categories commonly used for spine-related pain relief; however, each of these categories of drugs may be used to treat other pain generators or physical/mental pathologies. Next, claims data are subject to coding inaccuracies and we have removed payments that were recorded as ≤ $0. Another limitation inherent to claims data is the constrained timeline available to scan pre and post the index encounter due to drop off in patient numbers resulting from the continuous enrollment window required for longitudinal tracking. An estimated 5–22% of patients change health plans annually.32–34 In our experience with spine cohorts derived from MarketScan®, patients meeting the continuous enrollment requirements did not differ in any of the available demographic (age, sex, region of the US, rural/urban) or comorbidity measures more than would be expected by chance (standardized differences <10%) relative to those without continuous enrollment.20,35 However, MarketScan® does not include information on race, ethnicity, or socio-demographics, and therefore we cannot rule out potential biases with regards to these factors. Nearly 70% of plan changes are involuntary due to changing employers or employers changing health plan offerings; however, near-elderly patients, blacks, Hispanics, and patients in fair or poor health are more likely to change health plans.32 These factors are known sources of cost variation and further study is warranted to identify their impact on healthcare costs and resource utilization.36,37
Conclusions
The prevalence of ASD in a large, US national commercial payer cohort aged 21–64 was 0.50%. The associated payer and societal economic burden of both operative and nonoperative care for ASD is substantial. There is considerable opportunity for the development of improved nonoperative treatment modalities to increase the value of ASD care by reducing the need for continued nonoperative interventions of limited benefit and reducing the use of costly operative care.
Abbreviations
ASD, adult spinal deformity; US, United States; US$, United States Dollars; HRQOL, health-related quality of life; ODI, Oswestry Disability Index; SF, Short Form; SRS, scoliosis research society; COBRA, Consolidated Omnibus Budget Reconciliation Act; ICD-10-CM, International Classification of Diseases-10th revision; HCRU, healthcare resource utilization; CI, confidence interval; SNF, skilled nursing facility; IRF, inpatient rehabilitation facility; ER, emergency room; PT, physical therapy; NSAID, nonsteroidal anti-inflammatory drug.
Funding
Data for this project were accessed using the Stanford Center for Population Health Sciences Data Core. The PHS Data Core is supported by a National Institutes of Health National Center for Advancing Translational Science Clinical and Translational Science Award (UL1TR003142) and from Internal Stanford funding. The content is solely the responsibility of the authors and does not necessarily represent the official views of the NIH. Certain data were supplied by MerativeTM as part of one or more MarketScanⓇ Research Databases. Any analysis, interpretation, or conclusion based on these data is solely that of the authors and not MerativeTM.
Disclosure
SJA declares consulting for NSite Medical, SI Bone, ATEC, Carlsmed, and Mainstay Medical. MB declares consulting for NSite Medical. MJG owns stock of NSite Medical. SSH declares consulting for Medtronic and Surgistep, speaker fees from Globus, scientific advisory board membership for Medcura, board membership for Scoliosis Research Society, journal review board for Spine Deformity and Global Spine Journal. DWP Jr declares consulting for SI Bone, Medtronic, and Globus, royalties from SI Bone and Springer, and institutional research support from Mizuho OSI, SI Bone, Medtronic and AO Spine. The authors report no other conflicts of interest in this work.
References
1. Schwab F, Dubey A, Gamez L, et al. Adult scoliosis: prevalence, SF-36, and nutritional parameters in an elderly volunteer population. Spine. 2005;30(9):1082–1085. doi:10.1097/01.brs.0000160842.43482.cd
2. Passias PG, Ahmad W, Dave P, et al. Economic burden of nonoperative treatment of adult spinal deformity. J Neurosurg Spine. 2023;39(6):751–756. doi:10.3171/2023.7.SPINE23195
3. Passias PG, Kummer N, Imbo B, et al. Improvements in outcomes and cost after adult spinal deformity corrective surgery between 2008 and 2019. Spine. 2023;48(3):189–195. doi:10.1097/BRS.0000000000004474
4. McAviney J, Roberts C, Sullivan B, Alevras AJ, Graham PL, Brown BT. The prevalence of adult de novo scoliosis: a systematic review and meta-analysis. Eur Spine J. 2020;29(12):2960–2969. doi:10.1007/s00586-020-06453-0
5. McCarthy I, O’Brien M, Ames C, et al. Incremental cost-effectiveness of adult spinal deformity surgery: observed quality-adjusted life years with surgery compared with predicted quality-adjusted life years without surgery. Neurosurg Focus. 2014;36(5):E3. doi:10.3171/2014.3.FOCUS1415
6. Glassman SD, Carreon LY, Shaffrey CI, et al. The costs and benefits of nonoperative management for adult scoliosis. Spine. 2010;35(5):578–582. doi:10.1097/BRS.0b013e3181b0f2f8
7. Gum JL, Hostin R, Robinson C, et al. Impact of cost valuation on cost-effectiveness in adult spine deformity surgery. Spine J. 2017;17(1):96–101. doi:10.1016/j.spinee.2016.08.020
8. Cashin AG, Furlong BM, Kamper SJ, et al. Analgesic effects of non-surgical and non-interventional treatments for low back pain: a systematic review and meta-analysis of placebo-controlled randomised trials. BMJ Evidence Based Med. 2025:bmjebm–2024–112974. doi:10.1136/bmjebm-2024-112974
9. Wang X, Martin G, Sadeghirad B, et al. Common interventional procedures for chronic non-cancer spine pain: a systematic review and network meta-analysis of randomised trials. BMJ. 2025:e079971. doi:10.1136/bmj-2024-079971
10. Schoenfeld AJ. Multisociety response to the BMJ publications on interventional spine procedures for chronic back and neck pain. Spine J. 2025. doi:10.1016/j.spinee.2025.03.030
11. Teles AR, Mattei TA, Righesso O, Falavigna A. Effectiveness of operative and nonoperative care for adult spinal deformity: systematic review of the literature. Global Spine J. 2017;7(2):170–178. doi:10.1177/2192568217699182
12. Passias PG, Mir JM, Dave P, et al. Factors associated with the maintenance of cost-effectiveness at five years in adult spinal deformity corrective surgery. Spine. 2024;49(20):1401–1409. doi:10.1097/BRS.0000000000004982
13. Choi SH, Son SM, Goh TS, Park W, Lee JS. Outcomes of operative and nonoperative treatment in patients with adult spinal deformity with a minimum 2-year follow-up: a meta-analysis. World Neurosurg. 2018;120:e870–e876. doi:10.1016/j.wneu.2018.08.179
14. Carreon LY, Glassman SD, Smith JS, et al. Cost-effectiveness improves for operative versus non-operative treatment of adult symptomatic lumbar scoliosis at eight-year follow-up. Spine. 2025;50(9):586. doi:10.1097/BRS.0000000000005186
15. Smith JS, Kelly MP, Yanik EL, et al. Operative vs nonoperative treatment for adult symptomatic lumbar scoliosis at 8-year follow-up: a nonrandomized clinical trial. JAMA Surgery. 2025;160(6):634. doi:10.1001/jamasurg.2025.0496
16. Merative US. Merative(TM) Marketscan(R) research databases commercial database & medicare database user guide data year 2022. 2023.
17. Dietz N, Sharma M, Kelly M, et al. Recombinant human bone morphogenetic protein–2 use in adult spinal deformity surgery: comparative analysis and healthcare utilization at 24 months’ follow-up. Glob Spine J. 2022;12(1):92–101. doi:10.1177/2192568220947377
18. Bureau of Labor Statistics. Consumer Price Index (CPI) databases. Bureau of Labor Statistics. Available from: https://www.bls.gov/cpi/data.htm.
19. Hyer JM, Ejaz A, Diaz A, et al. Characterizing and assessing the impact of surgery on healthcare spending among medicare enrolled preoperative super-utilizers. Ann Surg. 2019;270(3):554–563. doi:10.1097/SLA.0000000000003426
20. Koltsov J, Sambare T, Alamin T, Wood K, Cheng I, Hu S. Healthcare resource utilization and costs two years pre and post lumbar spine surgery for stenosis: a national claims cohort study of 22,182 cases. Spine J. 2022;22(6):965–974. doi:10.1016/j.spinee.2022.01.020
21. Bureau UC National population by characteristics: 2020-2023. Census.gov. Available from: https://www.census.gov/data/tables/time-series/demo/popest/2020s-national-detail.html.
22. Daubs MD, Watkins-Castillo SI. Orthopedics Research Society (ORS), United States bone & joint initiative, 2024. Available from: https://www.boneandjointburden.org/fourth-edition/iib0/spinal-deformity.
23. Carter OD, Haynes SG. Prevalence rates for scoliosis in US adults: results from the first national health and nutrition examination survey. Int J Epidemiol. 1987;16(4):537–544. doi:10.1093/ije/16.4.537
24. Jackson R, Simmons E, Stripinis D. Incidence and severity of back pain in adult idiopathic scoliosis. Spine. 1983;8(7):749–756. doi:10.1097/00007632-198310000-00011
25. Kazberouk A, Martin BI, Stevens JP, McGuire KJ. Validation of an administrative coding algorithm for classifying surgical indication and operative features of spine surgery. Spine. 2015;40(2):114–120. doi:10.1097/BRS.0000000000000682
26. Wang MC, Laud PW, Macias M, Nattinger AB. Strengths and limitations of international classification of disease ninth revision clinical modification codes in defining cervical spine surgery. Spine. 2011;36(1):E38–44. doi:10.1097/BRS.0b013e3181d273f6
27. Passias PG, Poorman GW, Bortz CA, et al. Predictors of adverse discharge disposition in adult spinal deformity and associated costs. Spine J. 2018;18(10):1845–1852. doi:10.1016/j.spinee.2018.03.022
28. Alvin MD, Miller JA, Lubelski D, et al. Variations in cost calculations in spine surgery cost-effectiveness research. Neurosurgical Focus. 2014;36(6):1–10. doi:10.3171/2014.3.FOCUS1447
29. Dagenais S, Caro J, Haldeman S. A systematic review of low back pain cost of illness studies in the United States and internationally. Spine J. 2008;8(1):8–20. doi:10.1016/j.spinee.2007.10.005
30. Yeramaneni S, Robinson C, Hostin R. Impact of spine surgery complications on costs associated with management of adult spinal deformity. Curr Rev Musculoskelet Med. 2016;9(3):327–332. doi:10.1007/s12178-016-9352-9
31. Tosteson ANA, Skinner JS, Tosteson TD, et al. The cost effectiveness of surgical versus non-operative treatment for lumbar disc herniation over two years: evidence from the Spine Patient Outcomes Research Trial (SPORT). Spine. 2008;33(19):2108–2115. doi:10.1109/ICITECH.2017.8080010
32. Cunningham PJ, Kohn L. Health plan switching: choice or circumstance? Health Affairs. 2000;19(3):158–164. doi:10.1377/hlthaff.19.3.158
33. Atherly A, Florence C, Thorpe KE. Health plan switching among members of the federal employees health benefits program. Inquiry. 2005;42(3):255–265. doi:10.5034/inquiryjrnl_42.3.255
34. Fang H, Frean M, Sylwestrzak G, Ukert B. Trends in disenrollment and reenrollment within US commercial health insurance plans, 2006-2018. JAMA Network Open. 2022;5(2):e220320. doi:10.1001/jamanetworkopen.2022.0320
35. Koltsov JCB, Sambare TD, Alamin TF, Wood KB, Cheng I, Hu SS. Patient-level payment patterns prior to single level lumbar decompression are associated with resource utilization, postoperative payments, and adverse events. Spine J. 2023;23(2):227–237. doi:10.1016/j.spinee.2022.10.002
36. Schoenfeld AJ, Harris MB, Liu H, Birkmeyer JD. Variations in Medicare payments for episodes of spine surgery. Spine J. 2014;14(12):2793–2798. doi:10.1016/j.spinee.2014.07.002
37. Kahn EN, Ellimoottil C, Dupree JM, Park P, Ryan AM. Variation in payments for spine surgery episodes of care: implications for episode-based bundled payment. J Neurosurg Spine. 2018;29(2):214–219. doi:10.3171/2017.12.SPINE17674
 © 2025 The Author(s). This work is published and licensed by Dove Medical Press Limited. The
full terms of this license are available at https://www.dovepress.com/terms
and incorporate the Creative Commons Attribution
- Non Commercial (unported, 4.0) License.
By accessing the work you hereby accept the Terms. Non-commercial uses of the work are permitted
without any further permission from Dove Medical Press Limited, provided the work is properly
attributed. For permission for commercial use of this work, please see paragraphs 4.2 and 5 of our Terms.
© 2025 The Author(s). This work is published and licensed by Dove Medical Press Limited. The
full terms of this license are available at https://www.dovepress.com/terms
and incorporate the Creative Commons Attribution
- Non Commercial (unported, 4.0) License.
By accessing the work you hereby accept the Terms. Non-commercial uses of the work are permitted
without any further permission from Dove Medical Press Limited, provided the work is properly
attributed. For permission for commercial use of this work, please see paragraphs 4.2 and 5 of our Terms.
Recommended articles
Healthcare Resource Utilization Associated with Intermittent Oral Corticosteroid Prescribing Patterns in Asthma
Tran TN, Heatley H, Bourdin A, Menzies-Gow A, Jackson DJ, Maslova E, Chapaneri J, Henley W, Carter V, Chan JSK, Ariti C, Haughney J, Price D
Journal of Asthma and Allergy 2024, 17:573-587
Published Date: 21 June 2024
How Does Disease Severity Affect Clinical Outcomes and Economic Burden of Patients with COPD —— A Retrospective Population-Based Cohort Study in Tianjin, China
Wang L, Huang K, He X, Zhang J, Yang T, Wu J
International Journal of Chronic Obstructive Pulmonary Disease 2025, 20:2061-2072
Published Date: 25 June 2025
A Systematic Literature Review of the Humanistic, Economic, Sociodemographic, and Environmental Burden Associated with Severe COPD
Vlachaki I, Donhauser S, Wise RA, Chen Y, Madoni A, Scaffidi Argentina U, Mir JN, Quint JK
International Journal of Chronic Obstructive Pulmonary Disease 2025, 20:2493-2523
Published Date: 17 July 2025
Clinical and Economic Burden of COPD in Patients on Inhaled Triple Therapy in Germany – A Retrospective Claims Data Analysis
Meyer AC, Azabdaftari D, Albrecht I, Schild M, Kossack N, Richter LM, Diesing J, Damm O, Greulich T, Vogelmeier CF, Buhl R
International Journal of Chronic Obstructive Pulmonary Disease 2025, 20:3893-3906
Published Date: 1 December 2025
Research Gaps and Priorities for aHUS in the Gulf Cooperation Countries (GCC): Findings from a Payer-Focused Expert Meeting
Abu Esba LC, AlMardawi GH, Alhenaidi A, Ahmed M, AlShehry AO, Al Naeem W, Alshara Q, Alkandari O, Al-Omar HA
ClinicoEconomics and Outcomes Research 2026, 18:595064
Published Date: 6 May 2026