")
Back to Journals » International Journal of Nanomedicine » Volume 18
Preparation, Characterization and ex vivo Skin Permeability Evaluation of Type I Collagen-Loaded Liposomes
Authors Li M, Li M, Li X, Shao W, Pei X, Dong R, Ren H, Jia L, Li S, Ma W, Zeng Y, Liu Y, Sun H, Yu P
Received 11 January 2023
Accepted for publication 14 March 2023
Published 6 April 2023 Volume 2023:18 Pages 1853—1871
DOI https://doi.org/10.2147/IJN.S404494
Checked for plagiarism Yes
Review by Single anonymous peer review
Peer reviewer comments 2
Editor who approved publication: Dr Yan Shen
Mingyuan Li,1 Meng Li,1 Xinyi Li,1 Wanhui Shao,1 Xiujuan Pei,2 Ruyue Dong,1 Hongmeng Ren,1 Lin Jia,1 Shiqin Li,1 Wenlin Ma,1 Yi Zeng,1 Yun Liu,1 Hua Sun,1 Peng Yu1
1College of Biotechnology/Tianjin Enterprise Key Laboratory for Application Research of Hyaluronic Acid, Tianjin University of Science & Technology, Tianjin, 300457, People’s Republic of China; 2Tianjin Shiji Kangtai Biomedical Engineering Co.,Ltd, Tianjin, 300462, People’s Republic of China
Correspondence: Hua Sun; Peng Yu, Email [email protected]; [email protected]
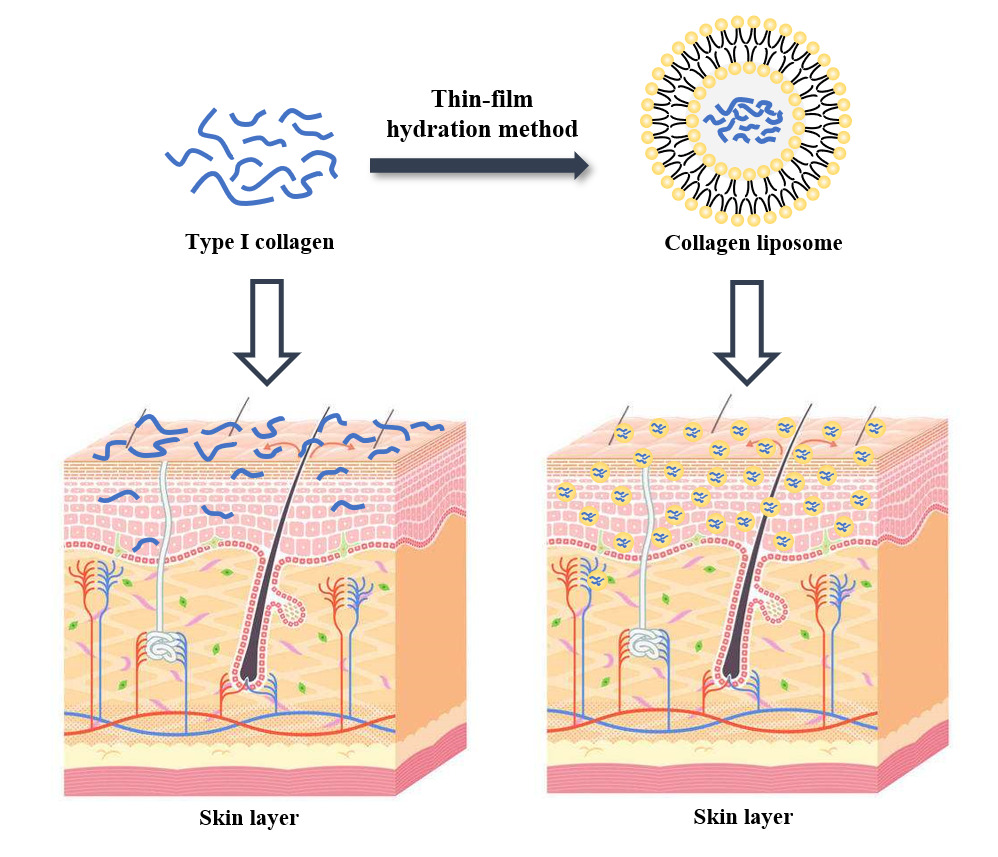
Purpose: In the present study, we prepared collagen liposomes with the addition of polyol, which is expected to not only increase the solubility of collagen but also improve skin penetration.
Methods: Collagen liposomes were prepared by the film dispersion method, and their characteristics, integrity and biosafety were evaluated by Fourier transform infrared spectroscopy (FTIR), UV-VIS spectroscopy, polyacrylamide gel electrophoresis (SDS-PAGE), dynamic light scattering (DLS) and transmission electron microscope (TEM). The transdermal absorption of collagen and collagen liposomes were tested by an ex vivo horizontal Valia-Chien diffusion cell system.
Results: We first demonstrated that collagen extracted from bovine Achilles tendon was type I collagen. The results of DLS measurement and TEM observation showed that the collagen liposomes were spherical in shape with average diameter (75.34± 0.93 nm) and maintained high stability at low temperature (4°C) for at least 42 days without toxicity. The encapsulation rate of collagen liposomes was 57.80 ± 0.51%, and SDS-PAGE analysis showed that collagen was intact in liposomes. Finally, permeability studies indicated that the collagen-loaded liposomes more easily penetrated the skin compared to collagen itself.
Conclusion: This study proposed a new method to improve the bioavailability and permeability of bovine type I collagen, which improves the applicability of collagen in biomedicine, cosmeceuticals and pharmaceutical industries.
Keywords: collagen, liposome, physicochemical properties of collagen, skin penetration, drug delivery
Graphical Abstract:
Introduction
Collagen is the major protein in human and animal connective tissues, accounting for approximately 25% of the total vertebrate protein,1 and it is essential for the mechanical protection of tissues and organs as well as the physiological regulation of the cellular environment.2 To date, among the 29 different types of collagen that have been identified,3 type I collagen is the most abundant and typical one, and it mainly plays a structural role.4 Type I collagen has a relative molecular mass of approximately 300 kDa, and it is mainly found in skin, lung, bone and connective tissue.5 Type I collagen is a three-stranded helical structural protein formed by two α1 peptide chains and one α2 peptide chain intertwined, and each peptide consists of (Gly-XY)n with X and Y representing mainly proline and hydroxyproline, respectively.6 Due to its many properties, such as low immunity, good biocompatibility and biodegradability,7–11 type I collagen has a wide range of applications in the bioindustry, such as tissue regeneration,12,13 pharmaceuticals,14 food15 and cosmetics.16 Although the cost of preparing collagen remains high, the market demand for collagen and its derivatives has been growing at a high rate in recent years.17
The increasing market demand has led to more aggressive attempts to extract and isolate type I collagen from different animal species. Currently, the best source of type I collagen is mammals18 due to its high sequence homology with human collagen,19 and bovine and porcine collagen dominate in terms of quality and quantity.20,21 In some countries, however, the use of pork-derived collagen has been banned,22 resulting in bovine collagen as the main raw material for pharmaceuticals and cosmetics. Despite the many advantages of type I collagen, its low bioavailability and low absorption efficiency still limit its use, suggesting that encapsulation may be an effective solution in this regard.
Using liposomes to encapsulate collagen improves its bioavailability and absorption efficiency.23 Liposomes are closed vesicles (usually 50–500 nm in diameter) consisting of a phospholipid bilayer24 with a biofilm-like structure,25 and they have been widely used to deliver various components, such as DNA,26,27 vaccines28,29 and drugs30,31 into the body, with contributions in the pharmaceutical and cosmetic fields.32 The use of liposomes loaded with fish-derived peptides improves antioxidant properties and skin penetration characteristics.33–35 Thus, the liposome encapsulation technique may improve the abovementioned problems. To be applied in the cosmetics industry, in addition to natural lecithin, a certain amount of permeability enhancers can also be added in the preparation of liposomes to enhance skin permeability, allowing the effective ingredients to play a better role, and propylene glycol is the most commonly used permeability enhancer.36
In the present study, we prepared collagen liposomes with the addition of polyol, which not only increases the solubility of collagen but also improves skin penetration to some extent. Although liposomes have been used as carriers to improve the absorption of protein, nanoliposomes encapsulating bovine-derived type I collagen have not been developed. Therefore, we used bovine-derived type I collagen to prepare collagen nanoliposomes with high molecular mass, resulting in better skin penetration ability compared to conventional bovine collagen.
Materials and Methods
Materials
The collagen lyophilized sponge was kindly provided by Tianjin Shiji Kangtai Biomedical Engineering Company, Ltd; BV2 cell line, fetal bovine serum and MEM medium were purchased from Wuhan Procell Life Science & Technology Company; Egg yolk lecithin PL-100M (Injection Grade, Phosphatidylcholine≥98%), purchased from AVT (Shanghai) Pharmaceutical Technology Company; 1,2-propanediol, 99%, AR, purchased from Shanghai Macklin Biochemical Technology Co.; Fluorescein Isothiocyanate (FITC), 97%, Biotech Grade, BR, purchased from Shanghai Macklin Biochemical Technology Co.; Coumarin-6, 98%, HPLC grade, purchased from Shanghai Aladdin Biochemical Technology Co. All other chemicals were of analytical grade and were purchased from the Shanghai Aladdin Biochemical Technology Company. Double distilled water, obtained from a water purification system (Nano-pure Infinity, Barnstead International. Dubuque. IA), was used to prepare all solutions.
Physical-Chemical Properties of Collagen
Measurement of Collagen Solubility
The solubility of collagen can be determined according to Lawal37 with slight modifications. 50 mg lyophilized collagen sponge was dissolved in 20 mL ultrapure water, and the pH value of collagen solution was adjusted with 1.0 mol/L HCl or 1.0 mol/L NaOH, pH=2.0–12.0, at 1.0 unit intervals. The above treated collagen solution was swirled at 25°C with a vortex oscillator until it was fully mixed, centrifuged at 8000 rpm for 10 min, and the supernatant was filtered. The amount of soluble collagen and total collagen in the supernatant were determined using the BCA kit, and the protein standard curve was obtained using bovine serum albumin (BSA). The protein concentration at each pH was determined by comparing it with the highest protein content calculated using the following formula.

UV-Vis Spectroscopy of Collagen
In brief, 10 mg of lyophilized collagen sponge was dissolved in 10 mL of 0.5 M acetic acid (1 mg/mL), and the UV-Vis spectra from 190 to 400 nm absorption light were recorded with a Shimadzu UV-2550 PC type UV-Vis spectrophotometer (Shimadzu, Japan).
Fourier Transform Infrared Spectroscopy of Collagen
The infrared spectra of collagen were measured in the range of 4000~400 cm−1 using Fourier transform infrared spectrometer (Thermo Fisher IS50, USA) according to the method of Hamdan.38
Preparation of Collagen Liposomes
Preparation of Collagen Liposome
Collagen-loaded liposomes were prepared by a combination of film dispersion method and ultrasonication. 240 mg egg yolk lecithin dissolved in anhydrous ethanol was formed into homogeneous lipid films by a rotary evaporator under vacuum at 55°C, and dried in a vacuum drying oven (−0.1 MPa) for 1 h. Then the lipid films were hydrated by 8 mL collagen solution (5% 1.2-propylene glycol, v/v) at 35°C. The newly formed multilayer lipid capsules were ultrasonically crushed (Power 5%, mode φ6, on 2 s, off 2 s) and squeezed through a 220 nm Millipore Express® PES membrane filter unit to form small liposomes (The concentration of egg yolk lecithin is 30 mg/mL) of uniform size. Blank liposomes were prepared in the same way as a control.
Preparation of Fluorescein-Labeled Collagen Liposomes
Fluorescein-labeled liposomes loaded with collagen were prepared by a combination of thin-film dispersion and ultrasonication. 240 mg egg yolk lecithin with coumarin-6 dissolved in anhydrous ethanol was formed into homogeneous lipid films by a rotary evaporator under vacuum at 55°C, and dried in a vacuum drying oven (−0.1 MPa) for 1 h. The lipid films were then hydrated by 8 mL collagen solution (5% 1.2-propylene glycol, v/v) at 35°C. The newly formed multilayer lipid capsules were crushed by ultrasonication (Power 5%, mode φ6, on 2 s, off 2 s) and squeezed through a 220 nm Millipore Express® PES membrane filter unit to form small liposomes (The concentration of egg yolk lecithin is 30 mg/mL) of uniform size.
Characterization of Liposomes
Size, Size Distribution and ζ-Potential Measurements
The average droplet size, size distribution and ζ-potential of liposomes were measured by a Malvern Zetasizer Nano ZS90 (Malvern Instruments, Malvern, UK). Size distributions were expressed as polydispersity index (PDI) and depicted graphically. Each sample was analyzed at least three times and the mean value was calculated.
Determination of Encapsulation Rate
Unencapsulated (free) collagen was separated from liposomes by a D-TUBETM Dialyzer Maxi with a molecular weight up to 300 kDa according to manufacturer’s instructions. Briefly, 3 mL of sample was placed in the D-TUBETM dialyzer and dialyzed in 300 mL of deionized water for 12 h to remove unencapsulated collagen retained in the continuous phase. Pure liposomes were then disrupted by Triton X-100 (5%, w/v) to release encapsulated collagen. The collagen concentration was determined using a BCA kit. For this purpose, 10 μL bovine serum albumin samples with different concentrations were added to 250 μL working solution, mixed, incubated at 37°C for 30 min, and then the absorbance was measured at 562 nm using a microplate reader (Biotek Synergy H1, USA). The encapsulation efficiency was calculated using bovine serum albumin (BSA) to obtain a protein standard curve. The encapsulation efficiency was then calculated as a percentage according to the following equation:

Morphological Analysis
The morphology of liposomes was evaluated using transmission electron microscopy (TEM, Talos G2 200x, Thermo Fisher, USA) operating at 200 kV. For TEM sample preparation, approximately 10 μL of liposomes was added dropwise on a carbon-coated grid for 30s, and the excess solution was aspirated using filter paper. The grids were stained with 2% phosphotungstic acid and dried overnight at room temperature.
Physical Stability Studies
The stability of collagen liposomes was compared under various storage conditions by assessing different variations of the mean particle size. They were stored at 25°C and 4°C for 56 days, and aliquots of the samples were collected at intervals and analyzed for stability. Each batch was analyzed in triplicate.
SDS-PAGE
SDS-PAGE was performed according to a previously reported method.39 Briefly, collagen was dissolved in ultrapure water (1 mg/mL), and collagen liposomes were dissociated by Triton X-100 (5%, w/v). Then, 40 μL of sample was mixed with 10 μL of SDS-PAGE protein loading buffer (bromophenol blue was added as an indicator). Samples were then heated to 100°C for 10 min, centrifuged at 9000 rpm for 10 min and electrophoresed using 8% SDS-PAGE gels, 1×Running Buffer and Novex X Cell II devices. The protein bands were visualized by coomassie brilliant blue R250 staining, and the molecular mass was identified using Benchmark pre-stained protein ladders.
Cell Viability Detection (MTT)
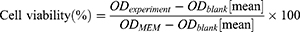
To assess the toxicity of collagen-loaded liposomes, we performed a cell viability test using the BV2 microglial cell line. Cells (2×10⁵ cells/well) were seeded into 96-well culture plates and cultured in MEM medium supplemented with 10% fetal bovine serum (FBS) for 24 h. The collagen-loaded liposomes were then mixed with the medium at different concentrations, and cells were cultured for 24 h before performing cell viability tests. In the 3-(4,5-dimethylthiazol-2-yl)-2,5-diphenyltetrazolium bromide (MTT) assay, 20 μL MTT solution was added to 100 μL medium containing collagen liposome. After an additional 4 h incubation, 100 μL of acidified isopropanol was added to dissolve the insoluble methanogenic crystals in the live cells. The absorbance was measured at 570 nm and 630 nm using a microplate reader. At the same time, the cell viability of blank liposomes was also measured according to the above method as a comparison. The effect of liposomes on cytotoxicity was assessed by cell viability, which was calculated using the following formula:
Ex vivo Skin Permeability Assessment of Collagen and Collagen Liposomes
The fresh tonguefish skin was provided by the College of Marine and Environmental Sciences at Tianjin University of Science and Technology. The BALB/c mouse skin and nude mouse skin were provided by Professor Yuou Teng in the College of Bioengineering at Tianjin University of Science and Technology. The BALB/c mouse (6~8 weeks/20~25 g) and nude mice (6~8 weeks/18~22 g) were purchased from Vital River Laboratories [Beijing, China; permit number SCXK (jing), 2017–0005], and were well housed and served as the control group in Professor Yuou Teng’s study without any drug or experimental treatment. After her experiment, the animals in the control group also needed to be sacrificed. In this study, the skin tissue was taken from animal carcasses provided by several professors. All procedures were carried in accordance with the Guidelines for Care and Use of Laboratory Animals of Tianjin University of Science and Technology and approved by the Animal Ethics Committee of Tianjin University of Science and Technology (Tianjin, China; protocol code: 2021.2.42.1, approval date: 5 March 2021).
Skin Preparation
The Skin of Tonguefishes
The fresh tonguefish skin scraped off the scales carefully, and the skin on the black side was taken, the subcutaneous tissue and fat were removed, rinsed with saline (The procedure for separating the skin of a tonguefish is shown in Figure S1). According to the requirements of the experiment, 2 cm × 2 cm skin in vitro was cut, soaked in saline, refrigerated, and used within 24 h. The integrity of the skin was checked by magnifier before the transdermal experiment and hydrated by soaking in saline for 1 h.
Nude Mouse Skin
The isolated back skin of nude mice was taken, remove the nude mouse hair, removing subcutaneous tissue and fat, rinsing with saline. According to the experimental requirements, 2 cm × 2 cm skin in vitro was cut, soaking in saline, refrigerating, and using within 24 h. Before the transdermal experiment, the skin integrity was checked with a magnifier and hydrated by soaking in saline for 1 h.
BALB/c Mouse Skin
The isolated back skin of BALB/c mice was taken, remove the BALB/c mouse hair, half of the mouse skin was treated with hair removal cream to remove the remaining hair to simulate normal skin, and the other half was immersed in 8% sodium sulfide solution to remove the remaining hair for 15 min to simulate damaged skin. Removing subcutaneous tissue and fat, rinsing with saline, according to the experimental requirements, 2 cm × 2 cm skin in vitro was cut, soaking in saline, refrigerating, and using within 24 hours. Before the transdermal experiment, the skin integrity was checked with a magnifier and hydrated by soaking in saline for 1 h.
Cumulative Penetration (Qn), Steady-State Permeation Rate (Jss) and Absorption Rate (W%) of Collagen
For this experiment, the TK-6H1 Valia-Chien double-chamber transdermal diffusion tester was used. The isolated cryopreserved skin was fixed in the combined part of the diffusion cell with the cuticle of the skin facing the supply cell. The pool was filled with collagen solution and collagen liposomes at a concentration of 1 mg/mL. The receiving pool was filled with receiving solution (saline). The diffusion cell water bath jacket was connected to a peristaltic pump and a thermostatically heated magnetic stirrer to maintain constant stirring, and the water bath temperature was set to 32.0±0.5°C and 36.0±0.5°C at 200 r/min.40 Samples were taken at 0.5, 1, 2, 4, 6, 8, 10 and 24 h time points, and 1 mL of the receiving medium was removed each time and then replenished with saline of equal temperature to the original volumetric amount. The total collagen concentration of the samples was determined by a BCA kit, and the Qn, Jss and absorption W% of collagen were calculated using the following respective equations:
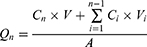


In the above equation, Qn is the cumulative transdermal volume per unit area (μg·cm−2), Cn is the concentration of collagen at the nth sampling (μg/mL), V is the volume of the receiving cell (5.0 mL), Ci is the concentration of collagen at the ith sampling (μg/mL), Vi is the sampling volume (1 mL), A is the effective contact area (1.13 cm2), Jss is the steady-state transmission rate (μg·cm−2·h−1), W is the cumulative permeation percentage (%), and S is the total amount of collagen (μg).
Using Qn as the vertical coordinate and sampling time t as the horizontal coordinate, the ex vivo transdermal permeation curves of collagen and collagen liposomes were plotted, and the slope of the straight line was the steady-state transdermal rate (Jss).
Skin Retention (Qs) and Retention Rate (As) of Collagen
After the ex vivo transdermal experiment, the isolated skin was removed, and the surface of the skin was washed repeatedly with saline until the protein on the skin surface was cleaned. Then the drug administration part was placed in a 10 mL centrifuge tube, cut into pieces with ophthalmic scissors, 4 mL of ultrapure water was added, sonicated it in the water bath for 30 min, left it stand for 10 min. The supernatant was taken and the BCA kit was used to determine the collagen concentration, calculation of collagen skin retention (Qs) and retention rates (As).

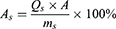
In the above equation, Qs is the skin retention volume (μg·cm−2), V0 is the ultra-pure water volume (4.0 mL), C is the measured collagen concentration (mg/mL), A is the effective contact area (1.13 cm2), As is the skin retention rate (%), and ms is the mouse skin weight (μg).
Microscopic Observation of Skin Permeation Phenomenon
Fluorescein-Labeled Collagen
Fluorescein isothiocyanate (FITC) was added to 20 mL of 1 mg/mL collagen carbonate buffer (0.1 M, pH 9.0), stirred at room temperature and crosslinked at 450 rpm for 18 h in the dark. The labeled collagen solution was centrifuged at 3000 rpm for 15 min, washed five times with carbonate buffer and stored at 4°C in the dark.
Fluorescence Microscope Observation of Skin Permeation
For this experiment, the TK-6H1 type Valia-Chien double chamber transdermal diffusion tester was used. The normal skin of an isolated cryopreserved BALB/c mouse was fixed in the combined part of the diffusion cell with the cuticle of the skin facing the supply pool, and the pool was filled with fluorescein-labeled collagen liposomes and fluorescein-labeled collagen solution at a concentration of 1 mg/mL. The receiving pool was filled with the receiving solution (saline). The diffusion cell outer water bath was connected to a peristaltic pump and a thermostatically heated magnetic stirrer to maintain constant stirring at a water bath temperature of 32.0±0.5°C with a speed of 200 r/min for 18 h. At the end of the experiment, the skin was treated and cut into slices for observation under a fluorescence microscope (Olympus BX51, Japan).
Statistical Analysis
One-way analysis of variance (ANOVA) was performed in Statistics Analysis System 9.2 (SAS Institute, NC, USA) statistical software version, and the means were analyzed by Duncan’s multiple polar difference test (p<0.05). Correlation between independent variables and measurements were calculated as Pearson correlation coefficients. All measurements were performed at least three treated samples and reported as mean ± standard deviation.
Results and Discussion
Physical-Chemical Properties of Collagen
Measurement of Collagen Solubility
Figure 1a shows the collagen solubility at different pH values. The solubility curves at different pH values showed higher collagen solubility in the acid pH range of 2 to 5. Collagen showed maximum solubility at pH 5 and minimum solubility in the pH range of 7 to 9, especially at pH = 8, which is the isoelectric point of collagen. However, collagen solubility slightly increased on the alkaline side of the isoelectric point (pI). The degree of protein solubility is the result of the interaction between electrostatic and hydrophobic protein molecules, and the high electrostatic repulsion of protein molecules increases the solubility of the protein. Due to the increase in the interaction of proteins and water, repulsion occurs, and the solubility in (pI) high or low (negative or positive net charge) pH value increases because the attraction and trend under the pI (zero net charge) reduce molecular aggregation.41 Thus, protein solubility as a function of pH provides an S-shaped curve and solubility minimum corresponding to pI.
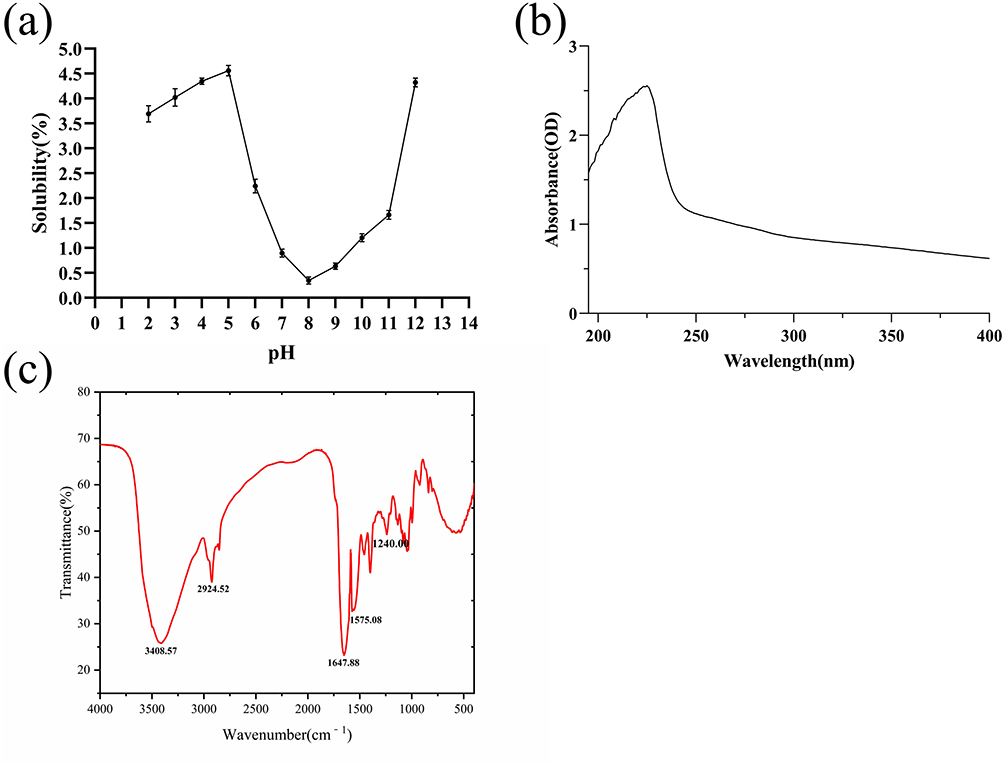 |
Figure 1 Physicochemical properties of collagen. (a) Solubility of collagen at different pH; (b) UV-VIS spectra of collagen; (c) infrared spectrum of collagen. |
UV-Vis Spectroscopy of Collagen
Collagen has COOH, CONH2 and C=O chromogenic groups, resulting in strong UV absorption properties. The UV absorption spectrum is the result of the summation of various UV chromophores of protein molecules and is an important marker for determining the type of collagen. Hydroxyproline (Hyp) and proline (Pro), which have a phenyl ring structure in type I collagen, cause the maximum UV absorption peaks to be mainly concentrated at 220–230 nm due to the n→π leap of the carbonyl group C=O. The UV spectrum of collagen is shown in Figure 1b, and its strongest absorption peak occurred at 225 nm, which is similar to the collagen of bullfrog (236 nm), Japanese schistosome (233 nm) and spotted forktail (232 nm).42 Because collagen contains few amino acids with aromatic rings, such as phenylalanine (Phe) and tyrosine (Tyr), there was no significant absorption peak near 280 nm, which indicated that the protein was type I collagen.43
FTIR Analysis of Collagen
The main characteristic absorption peaks of the collagen FTIR spectrum are shown in Figure 1c, which mainly include amide A, B, I, II, III belt,44 consistent with literature reports. In general, the N-H free-stretching vibration occurred in the range of 3400 to 3440 cm−1. However, when the N-H group combines with the hydrogen bond on the peptide chain, the position of amide A shifts to a lower frequency, approximately 3300 cm−1.45 Due to the N-H free-stretching vibrations, the position of the amide A band of collagen appeared at 3408.57 cm−1. The amide B band of collagen appeared at 2924.52 cm−1 and is associated with asymmetric stretching vibrations of =CH2 and NH3+,46 and the amide I band of collagen was at approximately 1647.88 cm−1. The amide I band is mainly associated with C=O stretching vibrations of the related peptide moiety, generally in the range of 1600–1700 cm−1.47 The amide II band of collagen had a wave number of 1575.08 cm−1 and is associated with CN-stretching vibrations and NH-bending vibrations (in the range of 1550 to 1600 cm−1).48 Amide III is generally in the range of 1200–1300 cm−1, representing the combined peak of NH deformation and NH stretching vibrations as well as the pendulum vibration absorption peaks of the CH2 group on the proline side chain and the glycine backbone. Furthermore, it involves the triple helix structure of collagen49,50 where the amide III absorption peak of collagen is located at 1240.00 cm−1, confirming the existence of the collagen helix structure. In conclusion, the triple helix structure of collagen was not damaged, and it belongs to type I collagen.
Characterization of Liposomes
Particle Size, Size Distribution and ζ-Potential Measurements
The blank liposomes and collagen liposome solutions prepared by a combination of the film dispersion method and ultrasonication showed a blue opalescence with a distinct Tyndall effect,51 indicating the unique nanoscale characteristics (Figure 2b). The average sizes of the prepared blank liposomes and collagen liposomes were 73.88±0.68 nm and 75.34±0.93 nm, respectively (Figure 2a and c) with ζ-potentials of −15.63±1.25 mV and −11.21±0.83 mV, respectively, and polydispersity indexes (PDI) of 0.287±0.043 and 0.238±0.012, respectively. This is similar to Liu et al52 particle size potential results for ferritin liposomes. The relatively small mean particle size and polydispersity index of collagen liposomes, with a surface charge of medium anionic (−11.21±0.83 mV), suggest that the liposome manufacturing method used in this study is feasible in the production of nanocarriers. Both blank liposomes and collagen liposomes showed good PDI (PDI < 0.3), which indicated that the liposomes had reasonable size homogeneity.
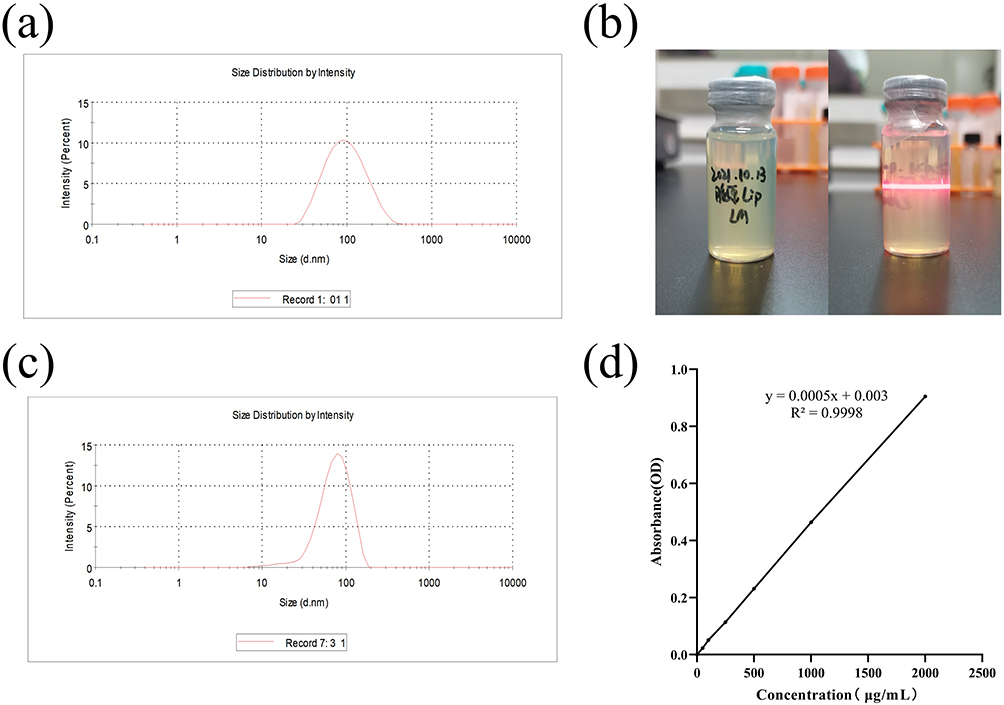 |
Figure 2 Characterization of liposomes. (a) Appearance of collagen liposomes; (b) size distribution of blank liposomes; (c) size distribution of collagen liposomes; (d) protein standard curve with bovine serum albumin (BSA) as standard. |
Measurement of Encapsulation Rate
In the case of applying liposomes as nanocarriers, the effectiveness of encapsulation is the ultimate issue. A protein standard curve with R2=0.9998 using BSA as a standard (Figure 2d) was constructed and used to calculate the encapsulation rate based on the collagen content. The encapsulation rate of collagen liposomes was 57.80 ± 0.51%, which was similar to the encapsulation rate of BSA liposomes determined by Liu et al.53
Morphological Analysis
TEM imaging is widely used to study the morphological characteristics of nanoparticles as well as their size characteristics. TEM images of blank liposomes and collagen liposomes are shown in Figure 3. TEM observations indicated the formation of nearly circular spherical nanovesicles with smooth outer surfaces (Figure 3) but diameters smaller than the measurements obtained from DLS, which may be attributed to the different degrees of vesicle shrinkage during TEM sample preparation (drying process).54 The particle size of collagen liposomes was significantly larger than that of blank liposomes as detected by TEM images, and bilayer vesicles were detected in collagen liposomes (Figure 3d), which was also similar to the results of Imam et al.55 Danaei et al56 reported that bilayer vesicles have higher stability and controlled release of active compounds compared to other types of vesicles, such as monolayer and multilayer vesicles. Thus, these findings provide a theoretical possibility for the future use of collagen liposomes as carriers of skin nutritional bioactive proteins.
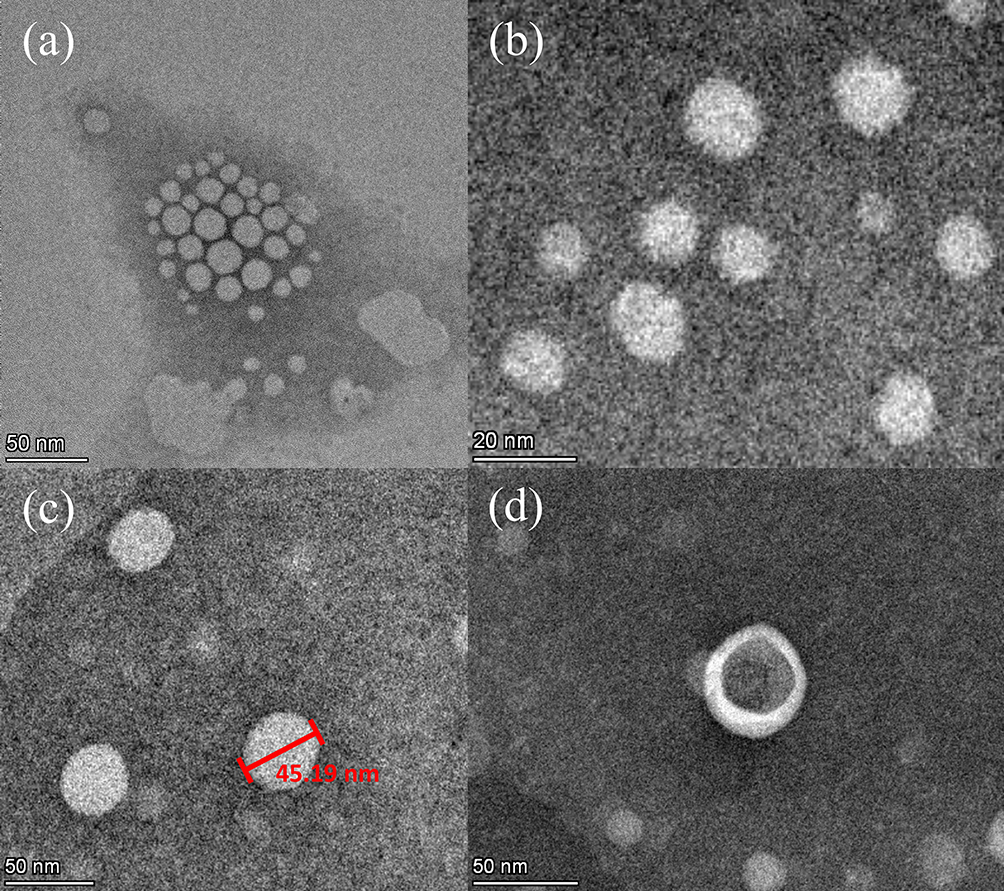 |
Figure 3 Transmission electron microscopy (TEM) images of blank liposomes (a and b) and collagen liposomes (c and d). |
Physical Stability Studies
Figure 4 depicts the size distribution of collagen liposomes during storage at 25°C and 4°C for 56 days. With the extension of storage time, the size of collagen liposomes showed an increasing trend (P<0.05). On day 0, the average size of the collagen liposomes was approximately 72 nm, and the solution was clear and transparent. On day 14, the size of the collagen liposomes stored at 25°C significantly increased, and some white precipitate was found at the bottom of the bottle, which may be related to the instability caused by the accumulation of the liposomes during storage. The size of collagen liposomes stored at 4°C did not increase significantly until day 56, indicating that low temperature may prolong the storage time of collagen liposomes.
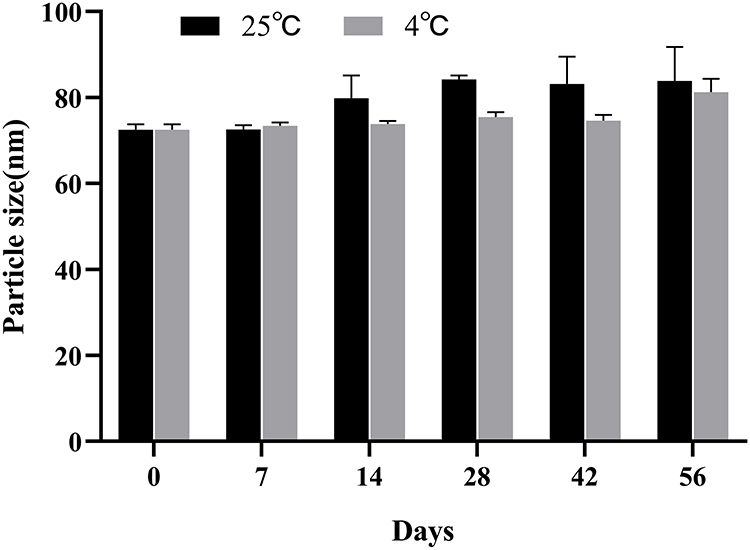 |
Figure 4 Size distribution of collagen liposomes stored at 25°C and 4°C for 56 days. |
SDS-PAGE
The structural integrity of collagen liposomes was determined by polyacrylamide gel electrophoresis. Figure 5 shows an image of the SDS-PAGE gel containing collagen and collagen liposomes. Collagen has α1 and α2 chains with a molecular weight of approximately 130,000, while the β chain has a molecular weight greater than 200,000, which is consistent with the characteristics of type I collagen. Figure 5 shows that no structural or conformational instability of the protein was observed during the preparation and that the protein was released from the liposomes. Regardless of whether the membrane was broken or not, the blank liposomes had no band, while the collagen-coated liposomes had a shallow band when the membrane was not broken because all of the collagen was not covered. There was no significant difference between the bands of collagen liposomes with broken membrane and those of collagen solution, and there were no other obvious bands, indicating that the collagen covered by liposomes was intact. Moreover, the band depth of collagen liposomes with broken membrane was shallower than that of collagen solution, which was consistent with the above results in Measurement of Encapsulation Rate.
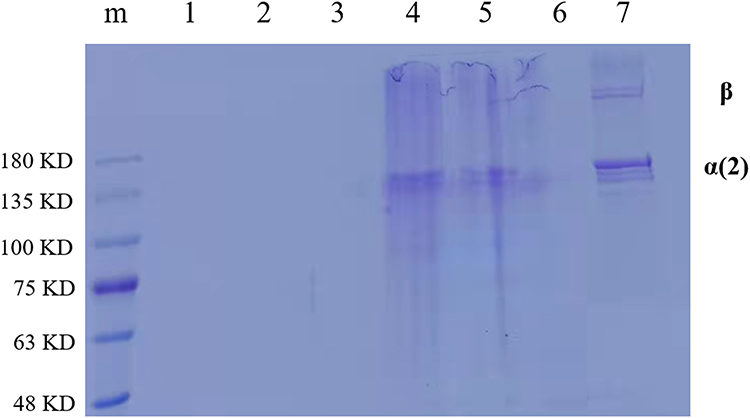 |
Figure 5 SDS-PAGE electrophoresis of collagen and its liposomes (M-protein Marker; 1- Blank liposomes with unbroken membranes; 2-membrane-breaking blank liposomes; 3- ultrapure water + Triton X-100; 4, 5- membrane-breaking collagen liposomes; 6- collagen liposomes without broken membranes; 7-collagen solution). |
Cell Viability Detection (MTT)
To test the biological safety of collagen liposomes, we used BV2 cells for the cell viability test. Figure 6 shows the effect of collagen liposomes on the BV2 cell survival rate, demonstrating that different concentrations of collagen liposomes resulted in BV2 cell survival rates greater than 95% with no significant differences among the cell survival rates. These results indicated that the prepared collagen liposomes are biologically safe, and the experimental results provided a certain reference for the application of collagen liposomes in cosmetics and pharmaceutical fields as a natural and safe raw material.57
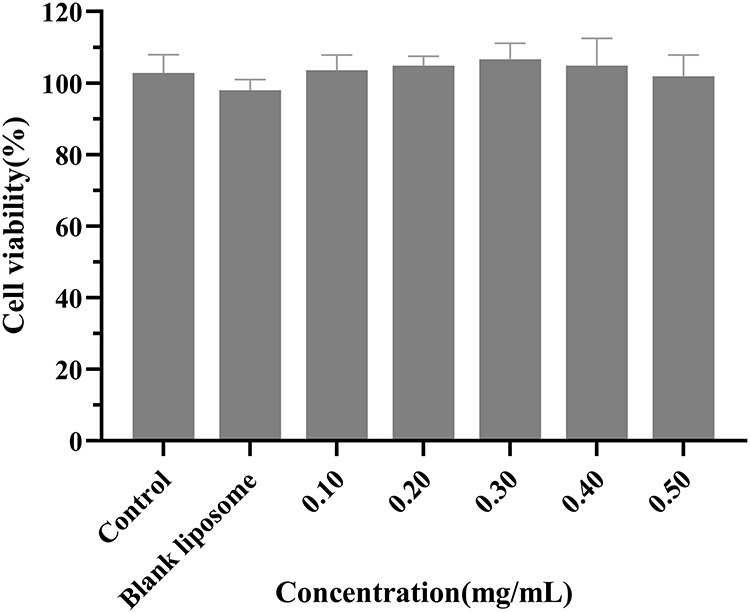 |
Figure 6 Effect of collagen liposomes on the viability of BV2 cells. |
Permeability of Collagen and Collagen Liposomes
Qn, Jss and W% of Collagen
Ex vivo skin permeation studies58 were performed to assess the permeation effect of collagen was encapsulated in liposome, and the isolated BALB/c mouse skin (divided into normal skin group and injury skin group) was utilized for the initial evaluation of collagen delivery because it has similar skin barrier properties to human and can simulate human skin ex vivo percutaneous research.59 In addition, the isolated skin of tonguefishes and nude mouse were also selected for preliminary evaluation of collagen delivery, and the results of the assessment were compared with the BALB/c mouse. In addition, the variability of skin penetration results was compared between different animals.
In this study, 32°C was set to simulate the temperature of human skin in the normal and stable external environment, and 36°C was set to simulate the temperature of human skin when the external environment temperature rise (for example, after taking a bath).60,61 Figure 7 shows the cumulative penetration of collagen and collagen liposomes through the skin of different animals within 24 h (expressed per cm2). At the same temperature (32°C), the cumulative transmission volume of collagen liposomes in the BALB/ c mouse normal skin group, the BALB/ c mouse injury skin group and the tonguefishes skin group were 1.3, 1.5 and 1.2 times more than the collagen solution, respectively. The cumulative transmission volume of collagen liposomes in nude mouse skin was 1.6 times more than the collagen solution. With the increase of temperature, the cumulative transmittance also proportionally increased. Figure 8 shows the skin absorption curves of collagen and collagen liposomes. At the same temperature (32°C), the skin absorption of collagen liposomes was higher than the collagen solution, and the results of multiple relation of absorbance and cumulative permeability of different animal skins were similar. As the temperature increased, the skin absorption rate proportionally increased. The results of ex vivo percutaneous permeation were fitted by the drug release kinetic equation (Table 1), and the results showed that the first-order kinetics equation of the collagen solution group and collagen liposomes group had a higher fitting degree. At the same temperature (32°C), the steady-state transmission rate of collagen liposomes was higher than the collagen solution. The steady state transmission rate increased proportionally with the increase of temperature. Comparison of the permeability results of the BALB/c mouse normal skin group to the BALB/c mouse injury skin group demonstrated that skin barrier damage under the condition, the permeability of collagen and its liposomes correspondingly increased and that the permeability of collagen liposomes significantly increased. These results demonstrated that liposomes loaded with collagen are more easily to penetrate the skin than collagen itself at the same temperature. Similarly, Lv et al62 conducted similar permeability experiments on vitamin C liposomes and obtained the same results. In addition, rising temperature also promoted the permeation of collagen and its liposomes to a certain extent.
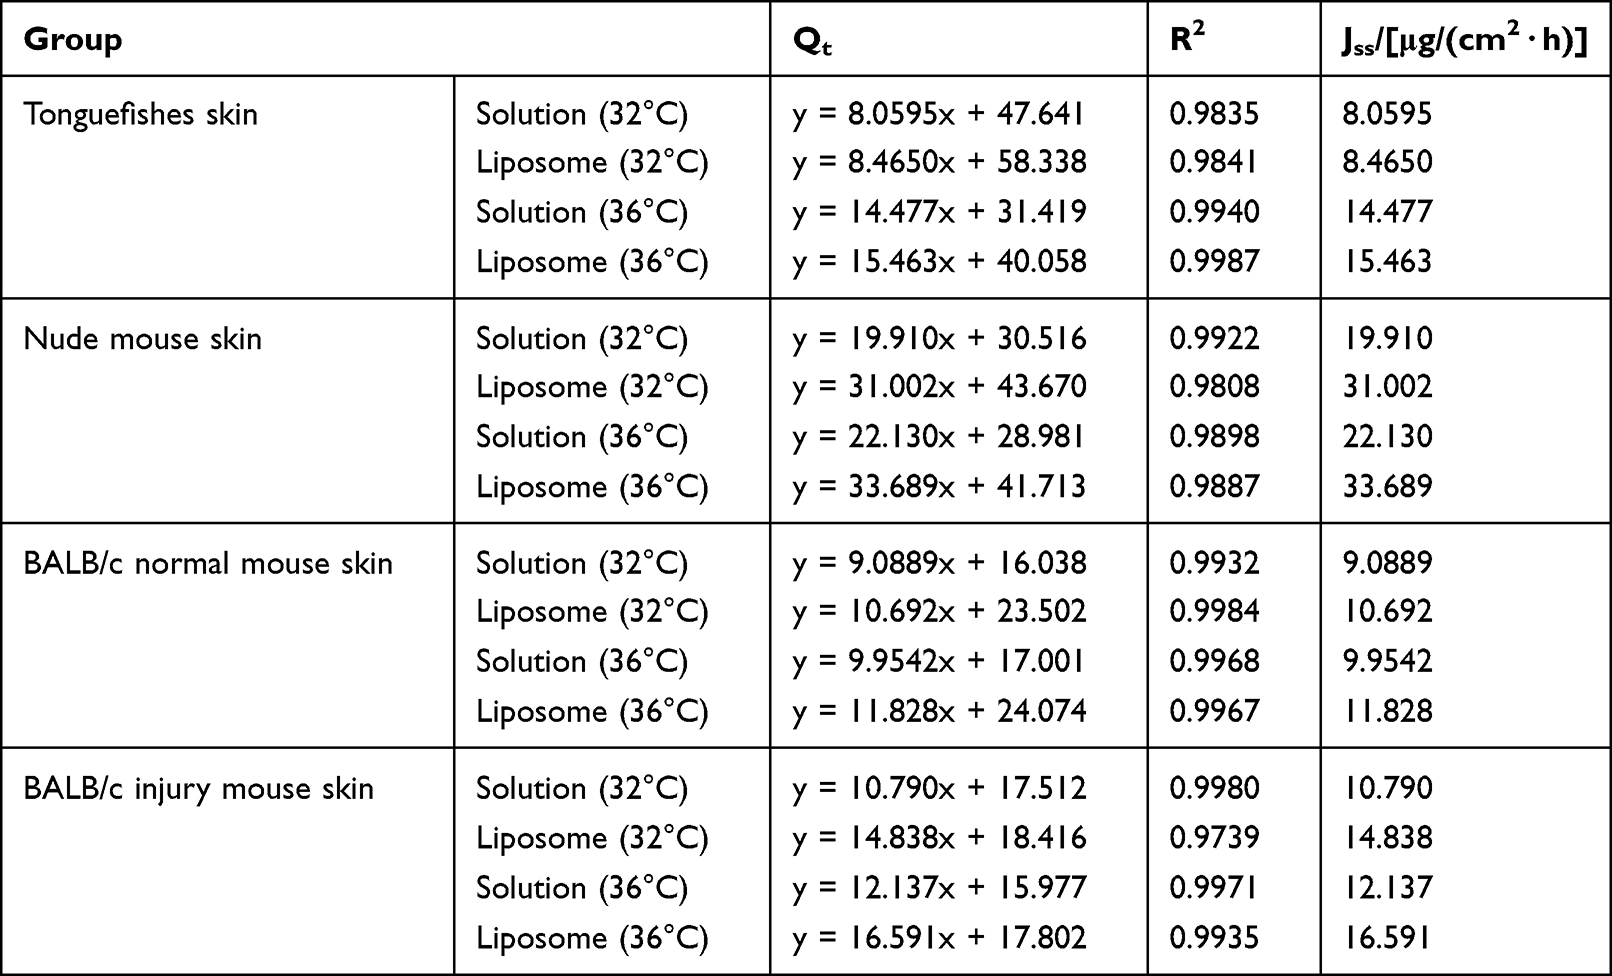 |
Table 1 Kinetic Parameters of Cumulative Release of Collagen and Its Liposomes |
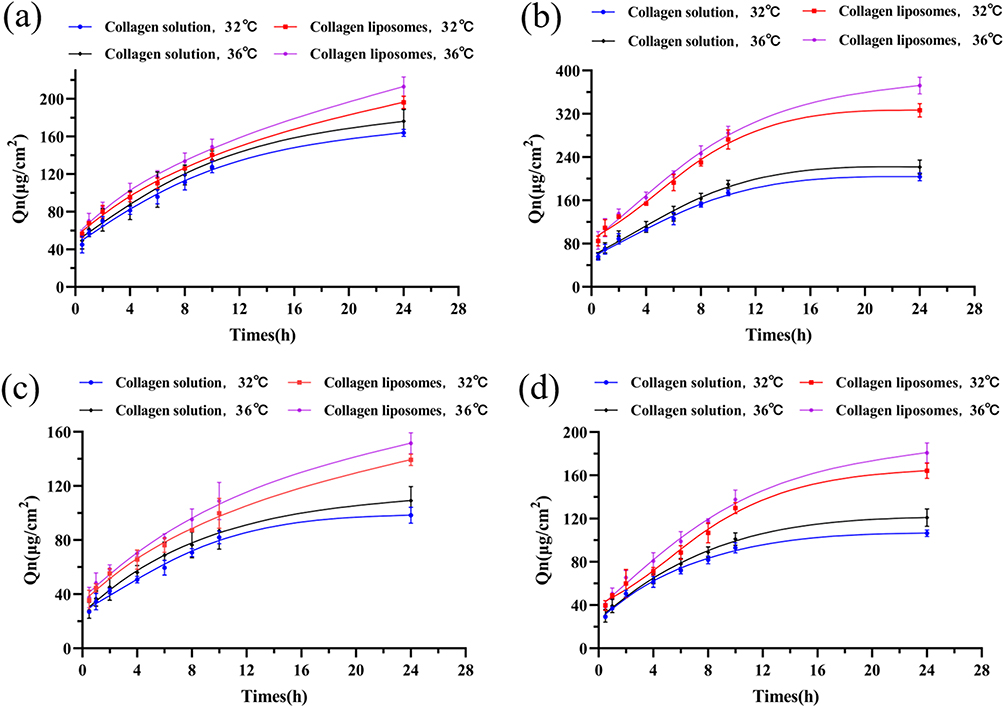 |
Figure 7 Cumulative transmission curves of collagen and its liposomes at different temperature; (a) tonguefishes skin; (b) nude mouse skin; (c) normal skin of BALB/c mice; (d) injury skin of BALB/c mouse. |
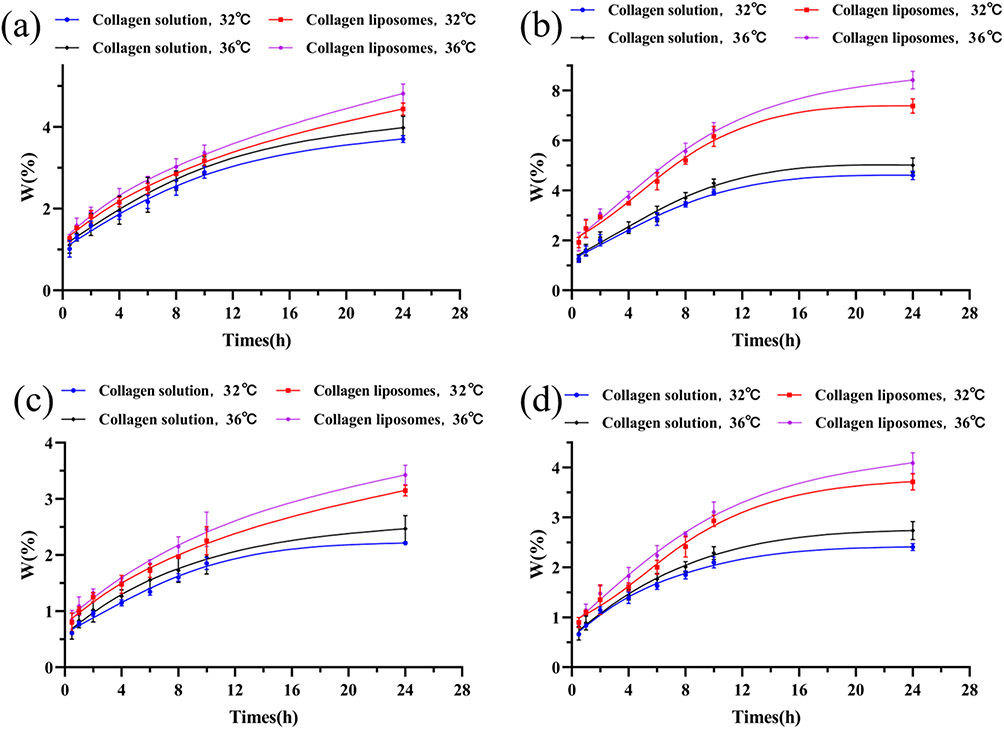 |
Figure 8 Skin absorption curves of collagen and its liposomes at different temperature; (a) tonguefishes skin; (b) nude mouse skin; (c) normal skin of BALB/c mice; (d) injury skin of BALB/c mouse. |
Skin Retention (Qs) and Retention Rate (As) of Collagen
The effect of collagen and collagen liposomes on the skin retention and retention rate of skin different animals after ex vivo infiltration was investigated (Table 2). At the same temperature (32°C), the skin accumulation volume and accumulation rate of collagen liposomes were significantly higher than the collagen solution. The skin accumulation volume and accumulation rate of collagen liposomes in BALB/ c normal mouse skin group, BALB/c injury mouse skin liposome group, tonguefishes skin group and nude mouse skin group were approximately 1.7, 1.8, 2.6 and 1.3 times more than the collagen solution, respectively, which indicated that more collagen were retained in the skin when encapsulated by liposomes. With the increase of temperature, the accumulation volume and accumulation rate of the skin slightly decreased because of the increase of temperature, the pores in the skin will open. Thereby accelerating the loss of the water and active ingredients,63 such as collagen. These results indicated that collagen liposomes with a small particle size not only increase the content of collagen in the skin and improve the concentration of collagen in the skin tissue but also increase the retention of collagen in the skin to delay the release of collagen.
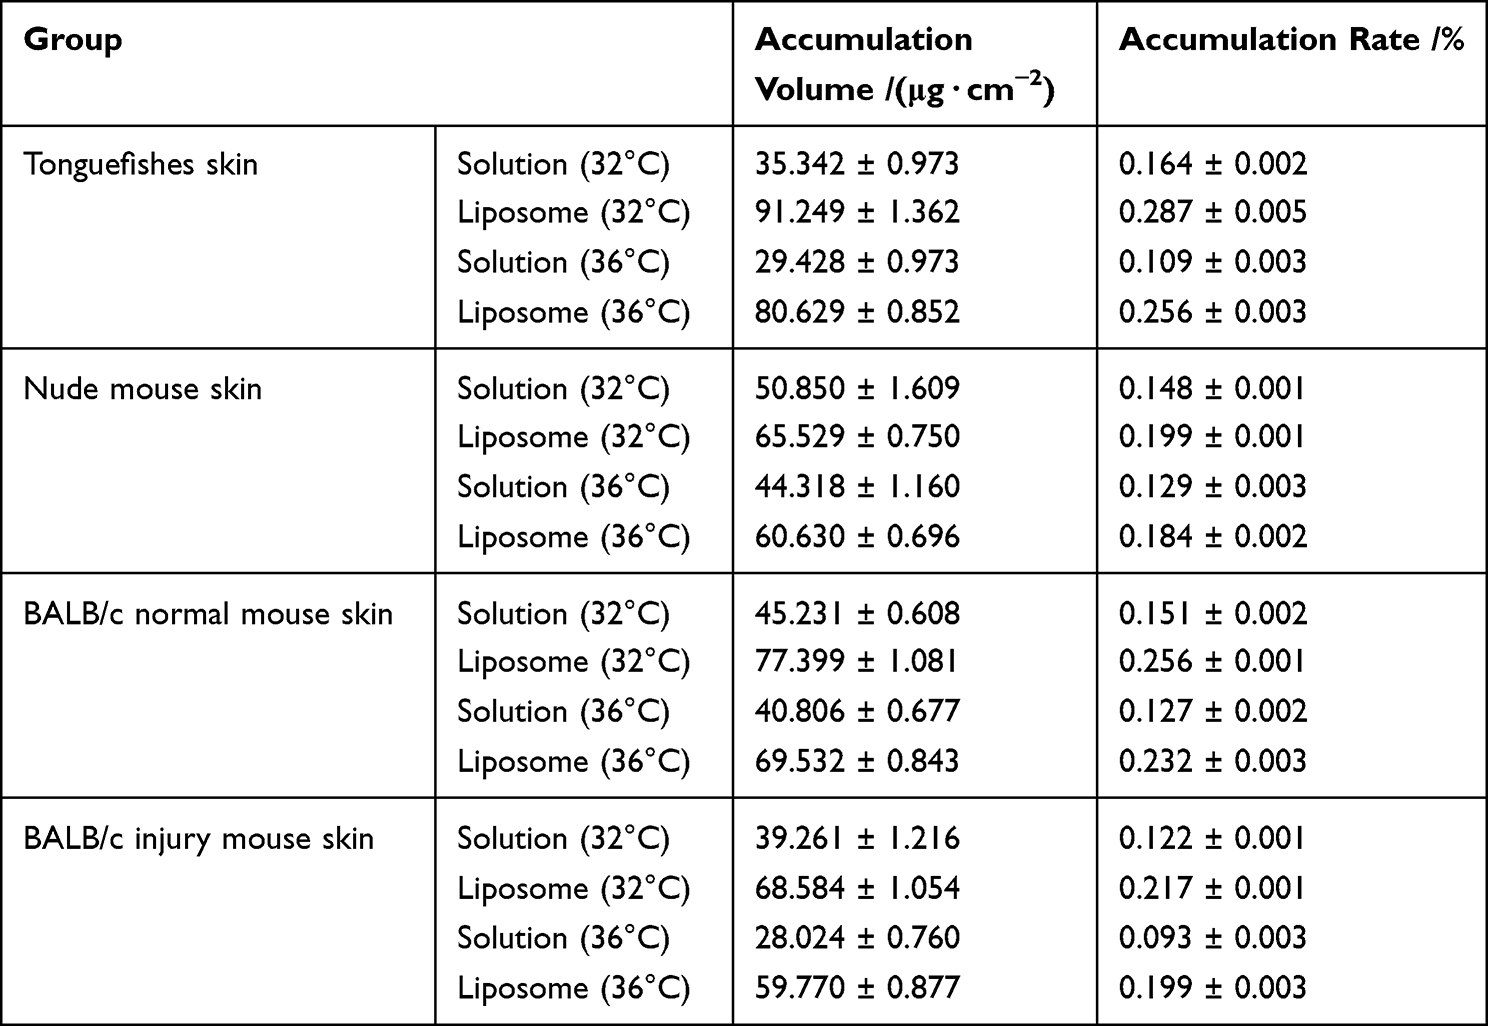 |
Table 2 Skin Accumulation and Accumulation Rate of Collagen and Liposomes |
Observation of Skin Permeation by Fluorescence Microscopy
The penetration of cross-sections of BALB/c normal mouse skin tissue was observed by fluorescence microscopy, and the qualitative penetration was evaluated by a multi-fluorescent compound technique. Figure 9 shows the fluorescence images of a cross-section of the BALB/c normal mouse skin after 18 h of infiltration of fluorescein-labeled collagen and collagen liposomes with the mouse skin and FITC/coumarin-6 represented by blue fluorescence and green fluorescence, respectively. After 18 h of infiltration, collagen liposomes gradually penetrated into the epidermis and dermis with high fluorescence intensity. There was a large number of liposomes in the hair follicle, and collagen was deposited in the cuticle. Collagen liposomes were attached to the hair follicle, and the embedded collagen was released and diffused. In contrast, the liposomes that did not penetrate the hair follicle may penetrate the skin through intercellular and transcellular pathways, similar to the results of Subongkot et al64 In addition, these results were confirmed by the skin retention results.
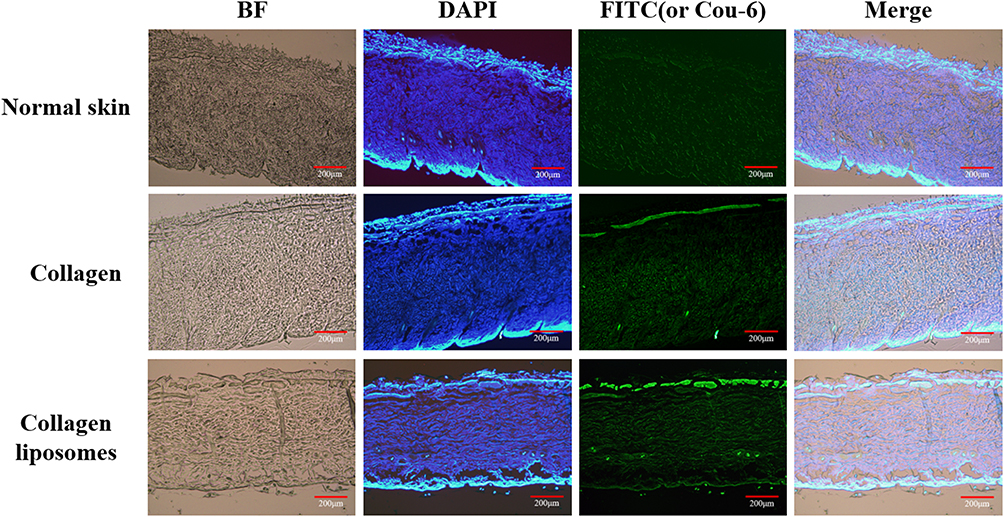 |
Figure 9 FM image of a cross section of BALB/c normal mouse skin cultured on a V-C diffusion tank containing fluorescein collagen and liposomes (scale bar is 200 μm). |
Conclusion
In the present study, we confirmed that collagen extracted from bovine Achilles tendon was type I and that its structure was not damaged during the extraction process according to FTIR, UV and SDS-PAGE analysis. We also evaluated the relative solubility of the extracted collagen. The results showed that the lowest solubility of collagen was at pH=8, which is the isoelectric point of collagen. Under the guidance of the above results, bovine type I collagen nanoliposomes were prepared for the first time. DLS measurement and TEM observation showed that the collagen liposomes were spherical with an average diameter and high stability. Physical stability studies showed that low temperature (4°C) prolonged the storage time of collagen liposomes, and SDS-PAGE analysis showed that collagen was completely encapsulated in liposomes. The MTT assay showed that collagen liposomes were biologically safe. Finally, permeability studies indicated that the collagen-loaded liposomes more easily penetrated the skin compared to collagen itself and that they increased the retention amount of collagen in the skin to delay the release of collagen.
In conclusion, the present study demonstrated the feasibility of encapsulating collagen by liposomes to improve its bioavailability and absorption efficiency, thereby providing a reference for the study of protein preparations that are unfavorable for external use due to poor water solubility and skin permeability, suggesting an optimal application for biomedicine, health products, cosmeceuticals and pharmaceutical industries.
Declaration of Transparency and Scientific Rigour
This Declaration acknowledges that this paper adheres to the principles for transparent reporting and scientific rigour of preclinical research as stated in the BJP guidelines for Design and Analysis and Animal Experimentation, and as recommended by funding agencies, publishers and other organisations engaged with supporting research.
Funding
The research was supported by Tianjin Excellent science and Technology Commissioner Project Fund [22YDTPJC00520] and Open Fund of Tianjin Enterprise Key Laboratory on Hyaluronic Acid Application Research [no. KTRDHA-Y201906] provided by Tianjin Kangting Bioengineering Group Corp. Ltd.
Disclosure
The authors report no conflicts of interest. The authors alone are responsible for the content and writing of this paper.
References
1. Lee JM, Suen SKQ, Ng WL, et al. Bioprinting of collagen: considerations, potentials, and applications. Macromol Biosci. 2021;21(1):e2000280. doi:10.1002/mabi.202000280
2. Tang C, Zhou K, Zhu YC, et al. Collagen and its derivatives: from structure and properties to their applications in food industry. Food Hydrocoll. 2022;131:107748. doi:10.1016/j.foodhyd.2022.107748
3. Hennet T. Collagen glycosylation. Curr Opin Struct Biol. 2019;56:131–138. doi:10.1016/j.sbi.2019.01.015
4. Salvatore L, Gallo N, Aiello D, et al. An insight on type I collagen from horse tendon for the manufacture of implantable devices. Int J Biol Macromol. 2020;154:291–306. doi:10.1016/j.ijbiomac.2020.03.082
5. Gisbert VG, Benaglia S, Uhlig MR, et al. High-speed nanomechanical mapping of the early stages of collagen growth by bimodal force microscopy. ACS Nano. 2021;15(1):1850–1857. doi:10.1021/acsnano.0c10159
6. Bhuimbar MV, Bhagwat PK, Dandge PB. Extraction and characterization of acid soluble collagen from fish waste: development of collagen-chitosan blend as food packaging film. J Environ Chem Eng. 2019;7(2):102983. doi:10.1016/j.jece.2019.102983
7. Huang X, Zhang Y, Zheng X, et al. Origin of critical nature and stability enhancement in collagen matrix based biomaterials: comprehensive modification technologies. Int J Biol Macromol. 2022;216:741–756. doi:10.1016/j.ijbiomac.2022.07.199
8. Hong H, Fan H, Chalamaiah M, et al. Preparation of low-molecular-weight, collagen hydrolysates (peptides): current progress, challenges, and future perspectives. Food Chem. 2019;301:125222. doi:10.1016/j.foodchem.2019.125222
9. Antoine EE, Vlachos PP, Rylander MN. Review of collagen I hydrogels for bioengineered tissue microenvironments: characterization of mechanics, structure, and transport. Tissue Eng Part B Rev. 2014;20(6):683–696. doi:10.1089/ten.teb.2014.0086
10. Zhang Y, Shen L, Cheng Y, et al. Stable and biocompatible fibrillar hydrogels based on the self-crosslinking between collagen and oxidized chondroitin sulfate. Polym Degrad Stab. 2021;193:109742. doi:10.1016/j.polymdegradstab.2021.109742
11. Ravichandran R, Martinez JG, Jager EWH, et al. Type I collagen-derived injectable conductive hydrogel scaffolds as glucose sensors. ACS Appl Mater Interfaces. 2018;10(19):16244–16249. doi:10.1021/acsami.8b04091
12. Kandhasamy S, Zeng Y. Fabrication of vitamin K3-carnosine peptide-loaded spun silk fibroin fibers/collagen bi-layered architecture for bronchopleural fistula tissue repair and regeneration applications. Biomater Adv. 2022;137:212817. doi:10.1016/j.bioadv.2022.212817
13. Ragothaman M, Villalan AK, Dhanasekaran A, et al. Bio-hybrid hydrogel comprising collagen-capped silver nanoparticles and melatonin for accelerated tissue regeneration in skin defects. Mater Sci Eng C Mater Biol Appl. 2021;128:112328. doi:10.1016/j.msec.2021.112328
14. Rohman A, Windarsih A, Erwanto Y, et al. Review on analytical methods for analysis of porcine gelatine in food and pharmaceutical products for halal authentication. Trends Food Sci Technol. 2020;101:122–132. doi:10.1016/j.tifs.2020.05.008
15. González-Noriega JA, Valenzuela-Melendres M, Hernandez-Mendoza A, et al. Hydrolysates and peptide fractions from pork and chicken skin collagen as pancreatic lipase inhibitors. Food Chem. 2022;13:100247.
16. Li C, Fu Y, Dai H, et al. Recent progress in preventive effect of collagen peptides on photoaging skin and action mechanism. Food Sci Hum Wellness. 2022;11(2):218–229. doi:10.1016/j.fshw.2021.11.003
17. Dong C, Lv Y. Application of collagen scaffold in tissue engineering: recent advances and new perspectives. Polymers. 2016;8(2):42.
18. Ogawa M, Moody MW, Portier RJ, et al. Biochemical properties of black drum and sheepshead seabream skin collagen. J Agric Food Chem. 2003;51(27):8088–8092. doi:10.1021/jf034350r
19. Stover DA, Verrelli BC. Comparative vertebrate evolutionary analyses of type I collagen: potential of COL1a1 gene structure and intron variation for common bone-related diseases. Mol Biol Evol. 2011;28(1):533–542. doi:10.1093/molbev/msq221
20. Davison-Kotler E, Marshall WS, García-Gareta E. Sources of collagen for biomaterials in skin wound healing. Bio-Engineering. 2019;6(3):56.
21. Fertala A. Three decades of research on recombinant collagens: reinventing the wheel or developing new biomedical products? Bioengineering. 2020;7(4):155. doi:10.3390/bioengineering7040155
22. Lassoued I, Jridi M, Nasri R, et al. Characteristics and functional properties of gelatin from thornback ray skin obtained by pepsin-aided process in comparison with commercial halal bovine gelatin. Food Hydrocoll. 2014;41:309–318. doi:10.1016/j.foodhyd.2014.04.029
23. Chotphruethipong L, Battino M, Benjakul S. Effect of stabilizing agents on characteristics, antioxidant activities and stability of liposome loaded with hydrolyzed collagen from defatted Asian sea bass skin. Food Chem. 2020;328:127127. doi:10.1016/j.foodchem.2020.127127
24. Sercombe L, Veerati T, Moheimani F, et al. Advances and challenges of liposome assisted drug delivery. Front Pharmacol. 2015;6:286. doi:10.3389/fphar.2015.00286
25. Andrade S, Ramalho MJ, Loureiro JA, et al. The biophysical interaction of ferulic acid with liposomes as biological membrane model: the effect of the lipid bilayer composition. J Mol Liq. 2021;324:114689. doi:10.1016/j.molliq.2020.114689
26. Garcia BBM, Martins O, Silva ER, et al. Arginine-modified chitosan complexed with liposome systems for plasmid DNA delivery. Biointerfaces. 2020;193:111131. doi:10.1016/j.colsurfb.2020.111131
27. Bellefroid C, Reusch C, Lechanteur A, et al. Systematic study of liposomes composition towards efficient delivery of plasmid DNA as potential application of dermal fibroblasts targeting. Int J Pharm. 2021;593:120122. doi:10.1016/j.ijpharm.2020.120122
28. Barati N, Nikpoor AR, Mosaffa F, et al. AE36 HER2/neu-derived peptide linked to positively charged liposomes with CpG-ODN as an effective therapeutic and prophylactic vaccine for breast cancer. J Drug Deliv Sci Technol. 2022;67:102904. doi:10.1016/j.jddst.2021.102904
29. Sriwidodo U, Wathoni N, Wathoni N, et al. Liposome-polymer complex for drug delivery system and vaccine stabilization. Heliyon. 2022;8(2):e08934. doi:10.1016/j.heliyon.2022.e08934
30. Ebrahimnejad P, Taleghani AS, Asare-Addo K, et al. An updated review of folate-functionalized nanocarriers: a promising ligand in cancer. Drug Discov Today. 2022;27(2):471–489. doi:10.1016/j.drudis.2021.11.011
31. Li M, Li S, Li Y, et al. Cationic liposomes co-deliver chemotherapeutics and siRNA for the treatment of breast cancer. Eur J Med Chem. 2022;233:114198. doi:10.1016/j.ejmech.2022.114198
32. Kim J, Kim TH, Lee JH, et al. Porous nanocomposite of layered double hydroxide nanosheet and chitosan biopolymer for cosmetic carrier application. Appl Clay Sci. 2021;205:106067. doi:10.1016/j.clay.2021.106067
33. Seo J, Kim M, Jeon S, et al. Enhanced topical delivery of fish scale collagen employing negatively surface-modified nanoliposome. J Pharm Investig. 2017;48(3):243–250. doi:10.1007/s40005-017-0303-2
34. Li Z, Paulson AT, Gill TA. Encapsulation of bioactive salmon protein hydrolysates with chitosan-coated liposomes. J Funct Foods. 2015;19:733–743. doi:10.1016/j.jff.2015.09.058
35. Malheiros PDS, Sant’Anna V, Micheletto YMS, et al. Nanovesicle encapsulation of antimicrobial peptide P34: physicochemical characterization and mode of action on Listeria monocytogenes. J Nanoparticle Res. 2011;13(8):3545–3552. doi:10.1007/s11051-011-0278-2
36. Li W, Hao X, Zhao N, et al. Propylene glycol-embodying deformable liposomes as a novel drug delivery carrier for vaginal fibrauretine delivery applications. J Control Release. 2016;226:107–114. doi:10.1016/j.jconrel.2016.02.024
37. Lawal OS. Functionality of African locust bean (Parkia biglobossa) protein isolate: effects of pH, ionic strength and various protein concentrations. Food Chem. 2004;86(3):345–355. doi:10.1016/j.foodchem.2003.09.036
38. Hamdan FS, Sarbon NM. Isolation and characterisation of collagen from fringescale sardinella (Sardinella fimbriata) waste materials. Int Food Res J. 2019;26(1):133–140.
39. Vate NK, Undeland I, Abdollahi M. Resource efficient collagen extraction from common starfish with the aid of high shear mechanical homogenization and ultrasound. Food Chem. 2022;393:133426. doi:10.1016/j.foodchem.2022.133426
40. Kriplani P, Guarve K, Singh Baghel U. Formulation optimization and characterization of transdermal film of curcumin by response surface methodology. Chin Herb Med. 2021;13(2):274–285. doi:10.1016/j.chmed.2020.12.001
41. Singh H. Methods of testing protein functionality. Trends Food Sci Technol. 1997;8(9):320. doi:10.1016/S0924-2244(97)80288-9
42. Zhang M, Liu W, Li G. Isolation and characterisation of collagens from the skin of largefin longbarbel catfish (Mystus macropterus). Food Chem. 2009;115(3):826–831. doi:10.1016/j.foodchem.2009.01.006
43. Kozlowska J, Sionkowska A, Skopinska-Wisniewska J, et al. Northern pike (Esox lucius) collagen: extraction, characterization and potential application. Int J Biol Macromol. 2015;81:220–227. doi:10.1016/j.ijbiomac.2015.08.002
44. Chen J, Li L, Yi R, et al. Extraction and characterization of acid-soluble collagen from scales and skin of tilapia (Oreochromis niloticus). LWT Food Sci Technol. 2016;66:453–459. doi:10.1016/j.lwt.2015.10.070
45. Yousefi M, Ariffin F, Huda N. An alternative source of type I collagen based on by-product with higher thermal stability. Food Hydrocoll. 2017;63:372–382. doi:10.1016/j.foodhyd.2016.09.029
46. Ahmad M, Benjakul S. Extraction and characterisation of pepsin-solubilised collagen from the skin of unicorn leatherjacket (Aluterus monocerous). Food Chem. 2010;120(3):817–824. doi:10.1016/j.foodchem.2009.11.019
47. Muyonga JH, Cole CGB, Duodu KG. Fourier transform infrared (FTIR) spectroscopic study of acid soluble collagen and gelatin from skins and bones of young and adult Nile perch (Lates niloticus). Food Chem. 2004;86(3):325–332. doi:10.1016/j.foodchem.2003.09.038
48. Barth A, Zscherp C. What vibrations tell us about proteins. Q Rev Biophys. 2002;35(4):369–430. doi:10.1017/S0033583502003815
49. Jackson M, Choo LP, Watson PH, et al. Beware of connective tissue proteins: assignment and implications of collagen absorptions in infrared spectra of human tissues. Biochim Biophys Acta. 1995;1270(1):1–6. doi:10.1016/0925-4439(94)00056-V
50. Tang Y, Jin S, Li X, et al. Physicochemical properties and biocompatibility evaluation of collagen from the skin of giant croaker (Nibea japonica). Mar Drugs. 2018;16(7):222. doi:10.3390/md16070222
51. Wang J, He W, Cheng L, et al. A modified thin film method for large scale production of dimeric artesunate phospholipid liposomes and comparison with conventional approaches. Int J Pharm. 2022;619:121714. doi:10.1016/j.ijpharm.2022.121714
52. Liu WL, Ye A, Liu W, et al. Stability during in vitro digestion of lactoferrin-loaded liposomes prepared from milk fat globule membrane-derived phospholipids. J Dairy Sci. 2013;96(4):2061–2070. doi:10.3168/jds.2012-6072
53. Liu W, Ye A, Liu W, et al. Behaviour of liposomes loaded with bovine serum albumin during in vitro digestion. Food Chem. 2015;175:16–24. doi:10.1016/j.foodchem.2014.11.108
54. Sarabandi K, Jafari SM. Effect of chitosan coating on the properties of nanoliposomes loaded with flaxseed-peptide fractions: stability during spray-drying. Food Chem. 2020;310:125951. doi:10.1016/j.foodchem.2019.125951
55. Imam SS, Aqil M, Akhtar M, et al. Formulation by design-based proniosome for accentuated transdermal delivery of risperidone: in vitro characterization and in vivo pharmacokinetic study. Drug Deliv. 2015;22(8):1059–1070. doi:10.3109/10717544.2013.870260
56. Danaei M, Dehghankhold M, Aaei S, et al. Impact of particle size and polydispersity index on the clinical applications of lipidic nanocarrier systems. Pharmaceutics. 2018;10:2. doi:10.3390/pharmaceutics10020057
57. Faria-Silva AC, Mota AL, Costa AM, et al. 7-Application of natural raw materials for development of cosmetics through nanotechnology. In: Nanotechnology for the Preparation of Cosmetics Using Plant-Based Extracts. Elsevier; 2022:157–201.
58. Abidin L, Mujeeb M, Imam SS, et al. Enhanced transdermal delivery of luteolin via non-ionic surfactant-based vesicle: quality evaluation and anti-arthritic assessment. Drug Deliv. 2016;23(3):1079–1084. doi:10.3109/10717544.2014.945130
59. Godin B, Touitou E. Transdermal skin delivery: predictions for humans from in vivo, ex vivo and animal models. Adv Drug Deliv Rev. 2007;59(11):1152–1161. doi:10.1016/j.addr.2007.07.004
60. Liu YF, Wang LJ, Liu JP, et al. A study of human skin and surface temperatures in stable and unstable thermal environments. J Therm Biol. 2013;38(7):440–448. doi:10.1016/j.jtherbio.2013.06.006
61. Agrawal M, Pardasani KR. Finite element model to study temperature distribution in skin and deep tissues of human limbs. J Therm Biol. 2016;62:98–105. doi:10.1016/j.jtherbio.2016.07.006
62. Lv XP, Wu ZH, Qi XL. High skin permeation, deposition and whitening activity achieved by xanthan gum string vitamin c flexible liposomes for external application. Int J Pharm. 2022;628:122290. doi:10.1016/j.ijpharm.2022.122290
63. Notman R, Anwar J, Briels WJ, et al. Simulations of skin barrier function: free energies of hydrophobic and hydrophilic transmembrane pores in ceramide bilayers. Biophys J. 2008;95(10):4763–4771.
64. Subongkot T, Wonglertnirant N, Songprakhon P, et al. Visualization of ultradeformable liposomes penetration pathways and their skin interaction by confocal laser scanning microscopy. Int J Pharm. 2013;441(1):151–161. doi:10.1016/j.ijpharm.2012.12.003
 © 2023 The Author(s). This work is published and licensed by Dove Medical Press Limited. The full terms of this license are available at https://www.dovepress.com/terms.php and incorporate the Creative Commons Attribution - Non Commercial (unported, v3.0) License.
By accessing the work you hereby accept the Terms. Non-commercial uses of the work are permitted without any further permission from Dove Medical Press Limited, provided the work is properly attributed. For permission for commercial use of this work, please see paragraphs 4.2 and 5 of our Terms.
© 2023 The Author(s). This work is published and licensed by Dove Medical Press Limited. The full terms of this license are available at https://www.dovepress.com/terms.php and incorporate the Creative Commons Attribution - Non Commercial (unported, v3.0) License.
By accessing the work you hereby accept the Terms. Non-commercial uses of the work are permitted without any further permission from Dove Medical Press Limited, provided the work is properly attributed. For permission for commercial use of this work, please see paragraphs 4.2 and 5 of our Terms.