")
Back to Journals » International Journal of Nanomedicine » Volume 19
Preparation, Characterization, and Anti-Lung Cancer Activity of Tetrandrine-Loaded Stealth Liposomes
Authors Fang Z , Lin P, Gao R, Yang W, Zhou A, Yu W
Received 20 July 2023
Accepted for publication 11 January 2024
Published 25 January 2024 Volume 2024:19 Pages 787—803
DOI https://doi.org/10.2147/IJN.S431599
Checked for plagiarism Yes
Review by Single anonymous peer review
Peer reviewer comments 4
Editor who approved publication: Professor R.D.K. Misra
Zhengyu Fang,1,* Peihong Lin,1,* Rui Gao,1,* Wenjing Yang,1 Aizhen Zhou,2 Wenying Yu1,3
1School of Pharmacy, Hangzhou Medical College, Hangzhou, 310013, People’s Republic of China; 2Department of Traditional Chinese Medicine, Zhejiang Pharmaceutical University, Ningbo, 315500, People’s Republic of China; 3Key Laboratory of Neuropsychiatric Drug Research of Zhejiang Province, Hangzhou Medical College, Hangzhou, 310013, People’s Republic of China
*These authors contributed equally to this work
Correspondence: Aizhen Zhou; Wenying Yu, Tel +86 571 88215623, Email [email protected]; [email protected]
Background: Tetrandrine (Tet), a bisbenzylisoquinoline alkaloid, is a potential candidate for cancer chemotherapy. However, Tet has poor aqueous solubility and a short half-life, which limits its bioavailability and efficacy. Liposomes have been widely utilized to enhance the bioavailability and efficacy of drugs.
Methods: In this study, Tet-loaded stealth liposomes (S-LPs@Tet) were prepared by ethanol injection method. Furthermore, physicochemical characterisation, biopharmaceutical behaviour, therapeutic efficacy, and biocompatibility of S-LPs@Tet were assessed.
Results: The prepared S-LPs@Tet had an average particle size of 65.57 ± 1.60 nm, a surface charge of − 0.61 ± 0.10 mV, and an encapsulation efficiency of 87.20% ± 1.30%. The S-LPs@Tet released Tet in a sustained manner, and the results demonstrated that the formulation remained stable for one month. More importantly, S-LPs significantly enhanced the inhibitory ability of Tet on the proliferation and migration of lung cancer cells, and enabled Tet to escape phagocytosis by immune cells. Furthermore, in vivo studies confirmed the potential for long-circulation and potent tumor-suppressive effects of S-LPs@Tet. Moreover, ex vivo and in vivo safety experiments demonstrated that the carrier material S-LPs exhibited superior biocompatibility.
Conclusion: Our research suggested that S-LPs@Tet has potential applications in lung cancer treatment.
Keywords: tetrandrine, S-LPs, lung cancer, immune escape, in vivo imaging
Introduction
Tetrandrine (Tet) is a natural product belonging to the bis-benzylisoquinoline alkaloid family (Figure 1) that was originally isolated and purified from the roots of the traditional Chinese medicinal herb Stephania tetrandra S. Moore.1 Multiple studies have shown that Tet has a wide range of diverse pharmacological effects. The antitumor effect of Tet is a widely investigated pharmacological activity, primarily achieved through direct inhibition of cell proliferation, induction of apoptosis and autophagy in cancer cells, inhibition of migration and invasion of tumor cells, and reversal of multidrug resistance in tumor cells, among other mechanisms.2–4
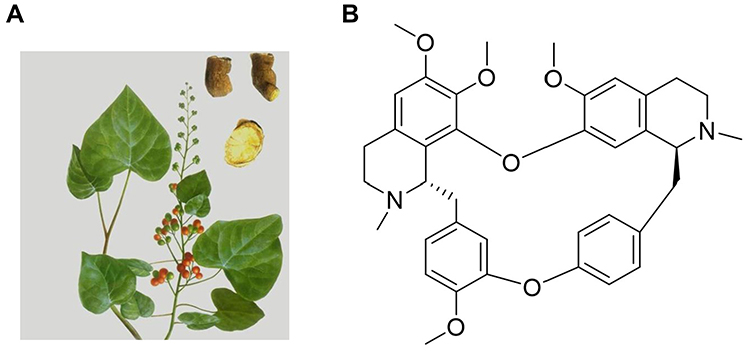 |
Figure 1 (A) The Stephania tetrandra S. Moore and (B) molecular structure of Tet. |
Tet tablets and injections are currently available on the market. However, due to the poor aqueous solubility of Tet, its tablets are not easily absorbed by the human body and have low bioavailability.5 Additionally, Tet Injection has the side effect of localized irritation and pain during clinical use.6,7 Free Tet has a short half-life of 7 hours in plasma8 and is easily cleared, resulting in poor efficacy.9,10 Therefore, there is an urgent need to develop a suitable drug delivery system to enhance the bioavailability and therapeutic efficacy of Tet.
In recent years, nanotechnology has shown promising applications in tumor treatment. Among these, liposomes (LPs) are the most widely used and stable biological nanoparticles in antitumor research due to their biocompatibility and high utility. Several LPs have been clinically approved as nanodrugs, such as Doxil®, Dauno Xome®, and Depocyt®. LPs have garnered significant attention as traditional drug delivery vehicles due to their relatively simple composition, capacity to effectively encapsulate a wide range of hydrophilic and hydrophobic drugs, and high clinical translational value.7 However, the main drawback of conventional LPs is that they are easily recognized by the reticuloendothelial system, leading to a short half-life and poor stability. Poly (ethylene glycol)–distearoylphosphatidylethanolamine (DSPE-PEG) is an amphiphilic polymer with a hydrophobic core (DSPE) and a hydrophilic shell (PEG).11 Therefore, incorporating DSPE-PEG into conventional LPs can not only enhance the solubility of drugs in water,12 but also facilitate the escape of LPs from immune clearance in the body, thereby improving drug efficacy.13,14 Gao et al15 prepared oridonin-loaded long-circulating LPs (LC-LPs@ORI), and found that the addition of DSPE-PEG2000 to the LPs enhanced the anti-colon cancer effect of ORI. The tumor volume in the LC-LPs@ORI treated group was approximately 56% smaller compared to the group treated with ORI solution.
In the present study, S-LPs@Tet were prepared using DSPE-PEG2000 and other biocompatible materials. The anti-lung cancer effects of S-LPs@Tet were investigated using in vitro and in vivo tests. Furthermore, the potential long-cycle ability and biocompatibility of S-LPs@Tet were also assessed. The aim of this study was to establish a practical foundation for the investigation and advancement of S-LPs@Tet.
Material
Reagents
Tet (purity > 99%) was obtained from Xi’an Haoxuan Biological Co. (lot number: HXHFJJS20181012-1). The Tet reference substance was obtained from China Institute for the Control of Pharmaceutical and Biological products (110711–201810). Soybean phospholipids (SPC, lot number: SY-SI-160101), Cholesterol (CHO, lot number: C10780), and DSPE-PEG2000 (lot number: C20128) was purchased from Shanghai AVT Pharmaceutical Technology Co. Acetonitrile (chromatographically pure) was obtained from Merck (Germany, lot number: AS1122-801). Triethylamine (chromatographically pure) and Fluorescein isothiocyanate isomer I (FITC) were purchased from Aladdin Industries (lot numbers T103287 and G1922072, respectively), and 4’, 6-diamidino-2-phenylindole (DAPI) was purchased from Solarbio Life Sciences (lot number C0065). Cyanine 5.5 (Cy5.5) was obtained from APE×BIO Inc., USA (lot number: A810381337769). The remaining reagents are analytically purity.
Cell Lines and Animals
The human non-small cell lung cancer cell line A549 and the human lung adenocarcinoma cell line H1975 were provided by the Key Laboratory of Experimental Animal and Safety Research of Zhejiang Province. The use of the cell lines was approved by the Ethics Committee of Zhejiang Academy Medical Sciences.
Shanghai SLAC Laboratory Animal Co. Ltd. (certificate number: SCXK [Hu] 2012–0002, Shanghai, China) supplied BALB/c nude mice of the male gender, with a weight ranging from 18 to 22 g. The Ethics Committee of Laboratory Animal Care and Welfare, Zhejiang Academy Medical Sciences (approval number 2018–265) granted approval for all animal-related procedures and their care. All vivo experiments were conducted in accordance with the NIH Guide for the care and use of laboratory animals.
Methods
Content Determination Method of Tet
The content of Tet was determined by reversed phase high-performance liquid chromatography (RP-HPLC).5 The column was a DiamonsilTMC18 analytical column (250 mm×4.6 mm, 5 μm) with the column temperature of 30 °C. The mobile phase consisted of 0.15% aqueous triethylamine (A) and acetonitrile (B), eluting at 15% and 85%, respectively. The flow rate was 1 mL/min. The detection wavelength was 280 nm, and the injection volume was 20 μL.
Preparation of S-LPs@Tet
S-LPs@Tet was prepared through ethanol injection.16 A mixture of SPC, CHO, DSPE-PEG2000, and Tet (in a ratio of 4:1:0.5, and a ratio of Tet to SPC of 1:10, w/w) was dissolved in 5 mL of ethanol. This solution was then added slowly, drop by drop, to 20 mL of preheated (55 °C) phosphate buffered saline (PBS, pH 7.4). After stirring at 150 rpm, all organic solvent was evaporating. Polycarbonate membranes with 450 and 200 nm pores were used to filter the final LPs. This procedure was followed to prepare blank carriers (S-LPs), but Tet was not added. Free Tet was dissolved in 10 mL PBS (pH 7.4) containing 20% propylene glycol. FITC and Cy5.5 were utilized as fluorescent dyes for alternative drugs and were prepared using the same way as the S-LPs@Tet described above.
Characterization of S-LPs@Tet
The particle size and zeta potential of S-LPs@Tet were determined by Malvern Zetasizer Nano ZS90 instrument (Malvern Instruments Ltd., UK). The morphology of S-LPs@Tet was observed using Transmission electron microscope (TEM, H7000, Hitachi, Japan).
The drug loading (DL) and encapsulation efficiency (EE) of S-LPs@Tet were measured through centrifugation ultrafiltration.17 An ultrafiltration device (MWCO = 30 k, Millipore, Belford, MA, USA) was equipped with 2 mL of S-LPs@Tet, a centrifuge at 6000 rpm was used for 30 minutes to centrifuge the unit. To determine the Free Tet content (Wfree), we subjected the filtrate to HPLC analysis. We calculated Tet content in S-LPs@Tet (Wtotal) by dissolving them in methanol and analyzing them by HPLC. The EE and DL of S-LPs@Tet were calculated as follows:
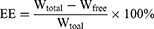
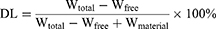
where Wfree represents the amount of Free Tet, Wtotal is the amount of total Tet presented in LPs, and Wmaterial represents the amounts of materials.
In vitro Drug Release Studies
The in vitro release of S-LPs@Tet were achieved using the dialysis method.18 A dialysis bag with a molecular weight cut-off (MWCO) of 12,000 Da was filled with 2 mL of Free Tet, LPs@Tet, and S-LPs@Tet. As the dialysis bags were sealed, they were immersed in beakers that contained 45 mL of PBS solution (pH 7.4). The beakers were sealed and kept at 37 °C with an oscillation speed of 100 rpm. We collected and replaced 0.5 mL of the release medium with fresh PBS at specific intervals. Afterward, HPLC was used to measure Tet concentrations in the release media.
Stability Evaluation
The stability of S-LPs@Tet was evaluated at different storage times in days, and changes in drug particle size (nm), EE (%), zeta potential and appearance were evaluated. S-LPs@Tet samples were stored in sealed tubes at room temperature (25 °C) and 4 °C for one month respectively. Within a month, samples were extracted at predetermined intervals (0, 15, and 30 days), and the particle size, EE, zeta potential, and appearance were evaluated. The average value was obtained from three parallel experiments.
In vitro Hemolysis of S-LPs@Tet
Red blood cells (RBCs) extracted from rat blood were washed two or three times and resuspended in PBS for the preparation of 2% (v/v) RBCs solutions. Thereafter, the RBCs solution was mixed with Free Tet, LPs@Tet, or S-LPs@Tet and immediately incubated in a constant temperature water bath for 30 min at 37 ± 0.5 °C. The negative control was NaCl solution (0.9%), and the positive control was distilled water. All samples were centrifuged at 1800 rpm for 10 min. Absorbance at 545 nm was measured, and hemolysis ratio was calculated via the following formula:

Immunological Evasion Capacity
To analyze the S-LPs@Tet accumulation efficiency in RAW264.7 cells, FITC was used as a fluorescence probe for the quantification and qualitative analysis of cellular uptake.
Qualitative determination method: Cells in the logarithmic growth phase were inoculated into confocal culture dishes, the cells were cultured for 24 hours. Then, the cells were treated with LPs-FITC, and S-LPs-FITC. A three-time gentle PBS wash was conducted after incubating the medium for 1, 2, and 4 h. The cells were fixed with paraformaldehyde (4%) for 30 min, stained with DAPI, and observed by fluorescent microscopy.
Quantification method: The cells were inoculated into 96-well plates and were plastered and treated with LPs-FITC, and S-LPs-FITC. The medium was incubated for 1, 2, and 4 hours, followed by three gentle washes with PBS. Subsequently, the fluorescence intensity was detected by the microplate reader.
Cytotoxicity Assay
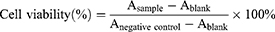
The cytotoxicity of S-LPs, Free Tet, and S-LPs@Tet was estimated by CCK-8 assay. A549 and H1975 cells were seeded on the 96-well plates. After 12 h, the cells were incubated with S-LPs, Free Tet, or S-LPs@Tet at different concentrations (1.25–20 μg/mL). After 24 h, the cells were incubated with a medium containing 10% (v/v) CCK-8 for another 2 h, the absorbance at 450 nm was detected and cell viability was calculated by the following formula:
Cell Scratching Assay
Cancer cell migration was evaluated using a cell wound healing assay.19 For wound healing assays, A549 cells were incubated in a 6-well plate at 37°C for 24 h to form a confluent cell monolayer. The wounds were then scratched with a 0.2 mL sterile pipette tip, washed twice with PBS after scratching, and photographed using an inverted microscope (Olympus, Tokyo, Japan). Medium containing 1% serum was added to the control group, S-LPs group, Free Tet, and S-LPs@Tet groups (with a Tet concentration of 2.5 μg/mL). Cells were cultured for 24 h and 48 h and photographs were taken again. The data were evaluated by ImageJ software, and the area percentage of wound healing was calculated by the following formula to reflect the cell mobility:

where A0 is the initial wound area, At is the wound area after t hours of the initial scratch, both in μm2.
Biodistribution in vivo
The armpit of each mouse was inoculated subcutaneously with A549 cells to establish a xenograft tumor model. Three groups of mice (n = 3) were randomly divided after the tumor volume reached approximately 100 mm3. Tumor volume was calculated by the following formula: Tumor volume = 0.5 × a × b2, where “a” represents tumor length and “b” represents tumor width. For biodistribution, the preparations were fluorescently labeled with Cy5.5 and grouped as follows: free Cy5.5, LPs-Cy5.5, and S-LPs-Cy5.5. Each group was then injected into nude mice via the tail vein. Mice in each group were imaged in vivo at 1, 6, 24, 30, and 48 h after injection. At 48 h post-injection, the mice were euthanized, and their tumors and major organs (heart, lungs, spleen, liver, and kidneys) were dissected for ex vivo imaging.
In vivo Antitumor Efficacy Study
To evaluate the therapeutic effects of various formulation groups in A549 xenograft nude mice, four groups of mice (n = 6) were randomly divided after tumor volume reached approximately 100 mm3. Normal saline (negative control), Free Tet (5 mg/kg),20 LPs@Tet (Tet of 5 mg/kg), and S-LPs@Tet (Tet of 5 mg/kg) were injected a total of six times through the tail vein every two days. Tumor volume in nude mice was measured before each treatment, and changes in body weight were monitored. At the end of the treatment, the tumor tissues from sacrificed nude mice were collected, fixed in paraformaldehyde, and embedded in paraffin. The tumor tissue sections were then analyzed using hematoxylin and eosin (H&E) and TUNEL staining to observe the necrosis and apoptosis of the tumor cells in different preparation groups.
After the treatment, the mice were euthanized, and major organs (heart, liver, spleen, lungs, and kidneys) were isolated from each group. The organs were then fixed with 4% formaldehyde, embedded in paraffin, and sectioned. Histological analysis was conducted after staining with H&E.
Statistical Analysis
All data were expressed as means ± SD. Statistical differences were evaluated using the one-way ANOVA with or without the Tukey-Kramer multiple comparison (post-hoc) tests. Multiple comparisons with homogeneity of variance were analyzed using the least significant difference method, while the Dunnett’s T3 method was used for multiple comparisons with heterogeneity of variance. Statistical significance was defined as *p < 0.05, **p < 0.01, ***p < 0.001, or ****p < 0.0001, and ns represented nonsignificant difference.
Results
Characterization of S-LPs@Tet
The peak area ratio showed a good linear relationship with the concentration of Tet in the samples over the concentration range of 0.39–50 μg/mL. The regression equation of the calibration curve was Y=12776 X-87771.2 and the linearity was excellent (R2 = 0.9991). The retention time of Tet was 12.2 min, and no interference of the preparation of S-LPs@Tet was found for the determination of Tet (Figure S1). The precision, reproducibility, stability, and sample recovery of the analysis method were strictly investigated and met the requirements of the quantitative analysis (Table S1).
The EE and DL of S-LPs@Tet were 87.20% ± 1.30% and 4.82% ± 0.06%, respectively. The average particle size was 65.57 ± 1.60 nm, the PDI was 0.14 ± 0.05, and the zeta potential was −0.61 ± 0.10 mV (Figure 2C). The particle size distribution of S-LPs@Tet is shown in Figure 2A, indicating that the prepared S-LPs@Tet had a narrow and uniform particle size distribution. S-LPs@Tet had a clarified and transparent appearance. TEM images showed that S-LPs@Tet were nearly spherical in shape and consistent in size (Figure 2B).
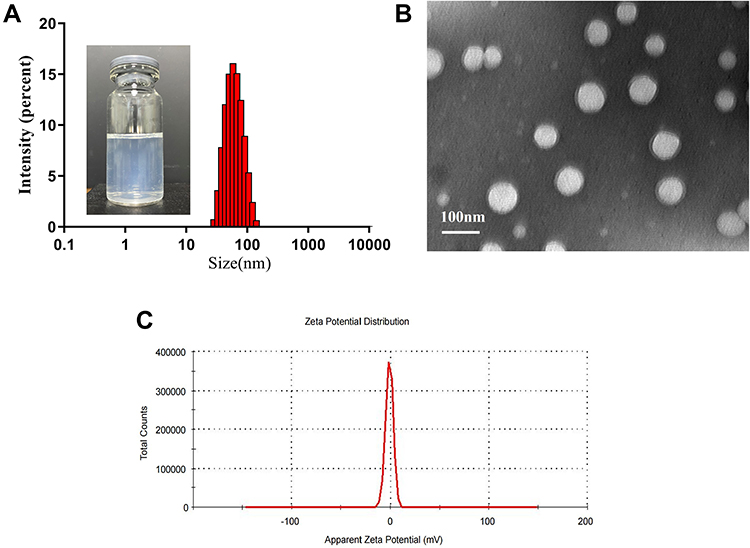 |
Figure 2 (A) Size distribution and appearance and (B) TEM images and (C) zeta potential of S-LPs@Tet. |
In vitro Release Profile
In accordance with the curves of release (Figure 3), drugs were released rapidly in the Free Tet group (84.43% within 4 h), whereas the drugs from the LPs@Tet and S-LPs@Tet groups were released relatively slowly (45.09% and 30.66% within 4 h, respectively). At 12 h, drug release was essentially complete in the Free Tet group and slowed down in the LPs@Tet and S-LPs@Tet groups, suggesting a smoother drug release after the LPs were modified by DSPE-PEG2000. This result suggested that S-LPs endowed Tet with an in vitro sustained-release effect. The phenomenon may be attributed to the embedding of DSPE-PEG2000 in the polar groups of liposomes in the form of covalent bonds during LPs preparation.21 This embedding can promote vesicle formation and prevent the leakage of insoluble drugs,22 thereby enabling the possibility of slow release of S-LPs in vitro.
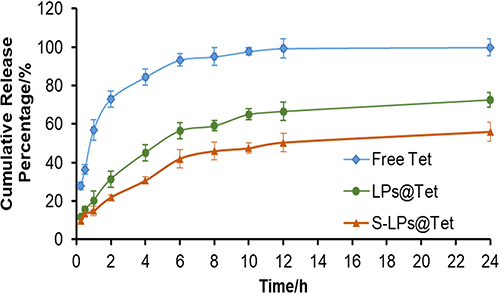 |
Figure 3 In vitro release of Tet from Free Tet, LPs@Tet and S-LPs@Tet in PBS (n = 3). |
The drug release profile for S-LPs@Tet was fitted to explore its release mechanism. Among the drug release profiles of S-LPs@Tet, the Weibull model showed the best fit. Table 1 illustrates the kinetics of Tet release from S-LPs@Tet, where Q represents the cumulative release rate and t represents the sampling interval.
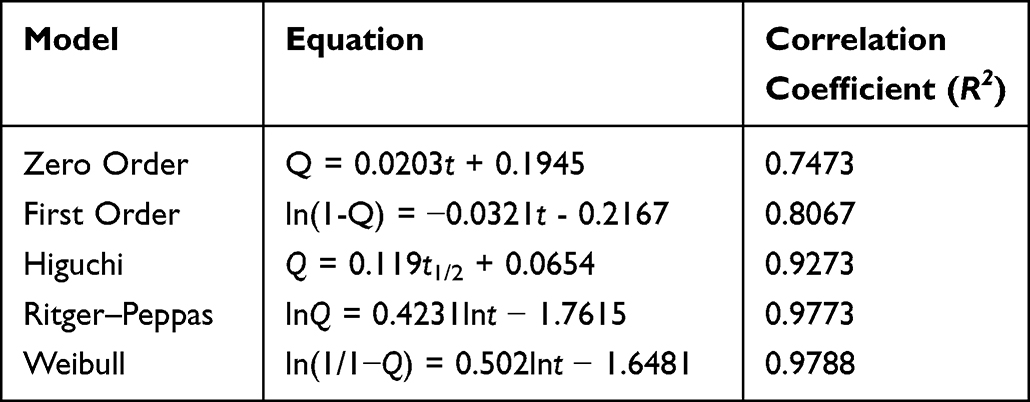 |
Table 1 S-LPs@Tet Release Curve Fitting Result |
Stability Studies
After storage at 4 °C and 25 °C for 30 days, no precipitation or stratification of S-LPs@Tet was observed (Figure 4A). At both temperatures, the EE% decreased slightly, and a small increase in particle size was observed within 30-day period (Figure 4B and C), and the changes were statistically nonsignificant. In addition, the potential (Figure 4D) of S-LPs@Tet did not change significantly in 30 days. These results suggested that the S-LPs demonstrated good stability and could thus be used as an ideal carrier of insoluble drugs.
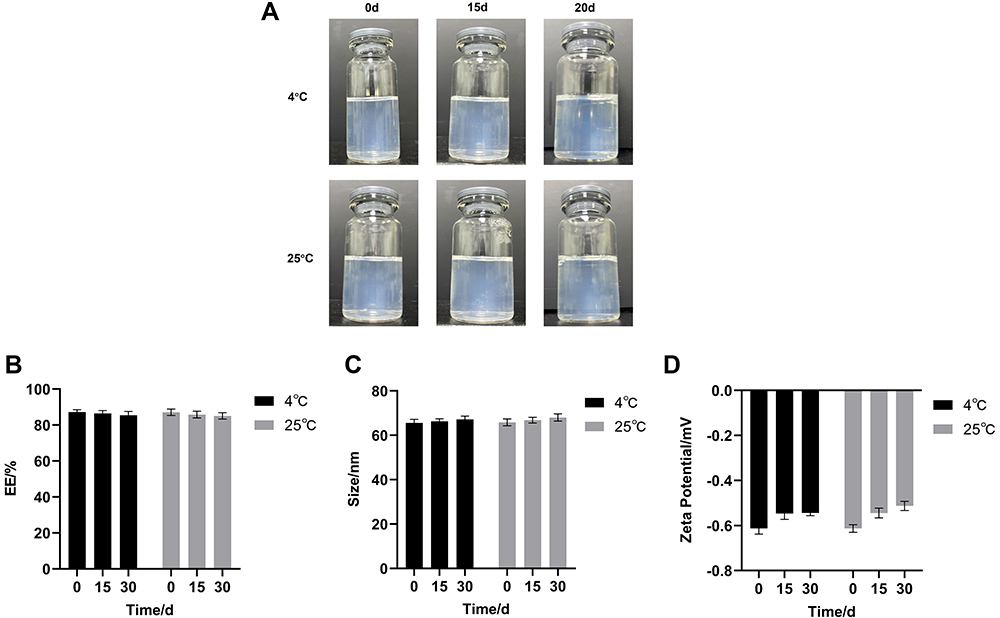 |
Figure 4 Stability results of S-LPs@Tet. (A) The appearance of S-LPs@Tet over time. (B) EE of S-LPs@Tet over time; (C) Particle size of S-LPs@Tet over time. (D) Zeta potential of S-LPs@Tet over time. |
In vitro Hemolysis
When incubated with RBCs (Figure 5), Free Tet showed hemolysis at 50 μg/mL, with a hemolysis rate of 10.96% ± 3.64% (> 5%), and the hemolytic effect improved when Tet was encapsulated by LPs, or when the Tet concentration was 200 μg/mL (hemolysis rate > 5%). By contrast, hemolytic reaction significantly improved after Tet was encapsulated by S-LPs even at a Tet concentration of up to 500 μg/mL, however, the hemolysis rate was still lower than 5% (Table 2).
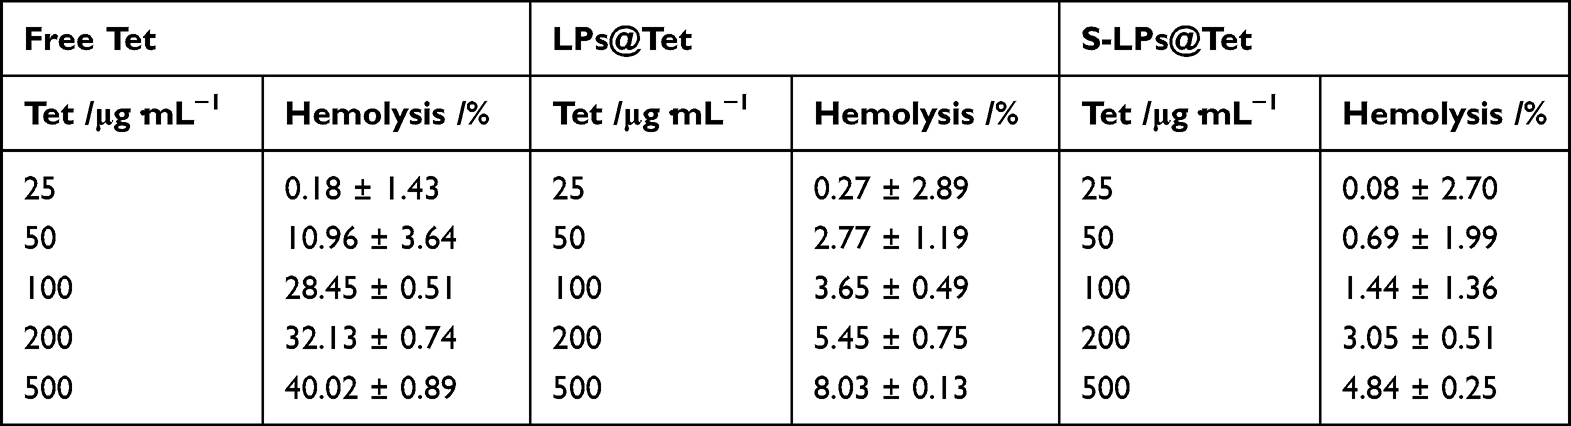 |
Table 2 In vitro Hemolysis Evaluation of Free Tet, LPs@Tet and S-LPs@Tet (n=3) |
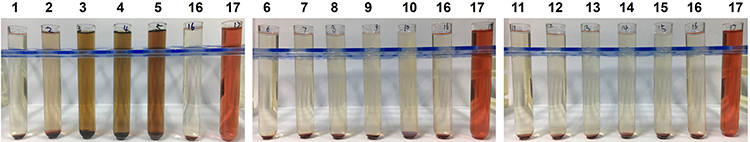 |
Figure 5 Hemolysis of Free Tet, LPs@Tet and S-LPs@Tet. 1–5 for Free Tet; 6–10 for LPs@Tet; 11–15 for S-LPs@Tet; 16: 0.9% NaCl solution (negative control); 17: distilled water (positive control). |
In vitro Cytotoxicity of S-LPs@Tet
As shown in Figure 6, Free Tet and S-LPs@Tet effectively inhibited the proliferation of the A549 and H1975 cells, and dose-dependent inhibition was observed with increasing drug concentration. In comparison with Free Tet, S-LPs@Tet was more effective in killing A549 and H1975 cells. At a concentration of 20 μg/mL, the inhibition rates of S-LPs@Tet on A549 and H1975 cells reached 82.67% and 91.34%, respectively. In addition, the survival rates of the blank vector S-LPs were all above 80%, indicating that the blank vector is almost nontoxic.
 |
Figure 6 Relative cell viability of (A) A549 cells and (B) H1975 cells at various drug concentrations.***p < 0.001, ****p < 0.0001, and ns represented nonsignificant difference. |
To further evaluate the antitumor efficacy of S-LPs@Tet, the IC50 values were analyzed. At 48 h, the IC50 value of the Free Tet was 4.87 ± 0.40 μg/mL, which was in general agreement with the results measured in the literature,23 whereas the IC50 value of the S-LPs@Tet group (2.21 ± 0.12 μg/mL) was significantly lower than that of the Free Tet group.
Immune Escape Ability of S-LPs@Tet
The immune escape ability of S-LPs@Tet was investigated by cellular uptake assay using RAW264.7 cells as a cellular model.24
The cell uptake of each group at 1, 2, and 4 h is shown in Figure 7B. As the incubation time between cells and preparations was prolonged, the fluorescence intensity in RAW264.7 cells gradually increased. Compared with the LPs-FITC group, the S-LPs-FITC group reduced the degree of particle phagocytosis by RAW264.7. After 4 h of incubation, the fluorescence intensity of cells in the LPs-FITC group was 1.65 times higher than that in the S-LPs-FITC group. The uptake of RAW264.7 into each formulation within 4 h of incubation was further observed by microscopic imaging (Figure 7A). The Cellular uptake of each formulation in the cells was found to be consistent with the quantitative analysis.
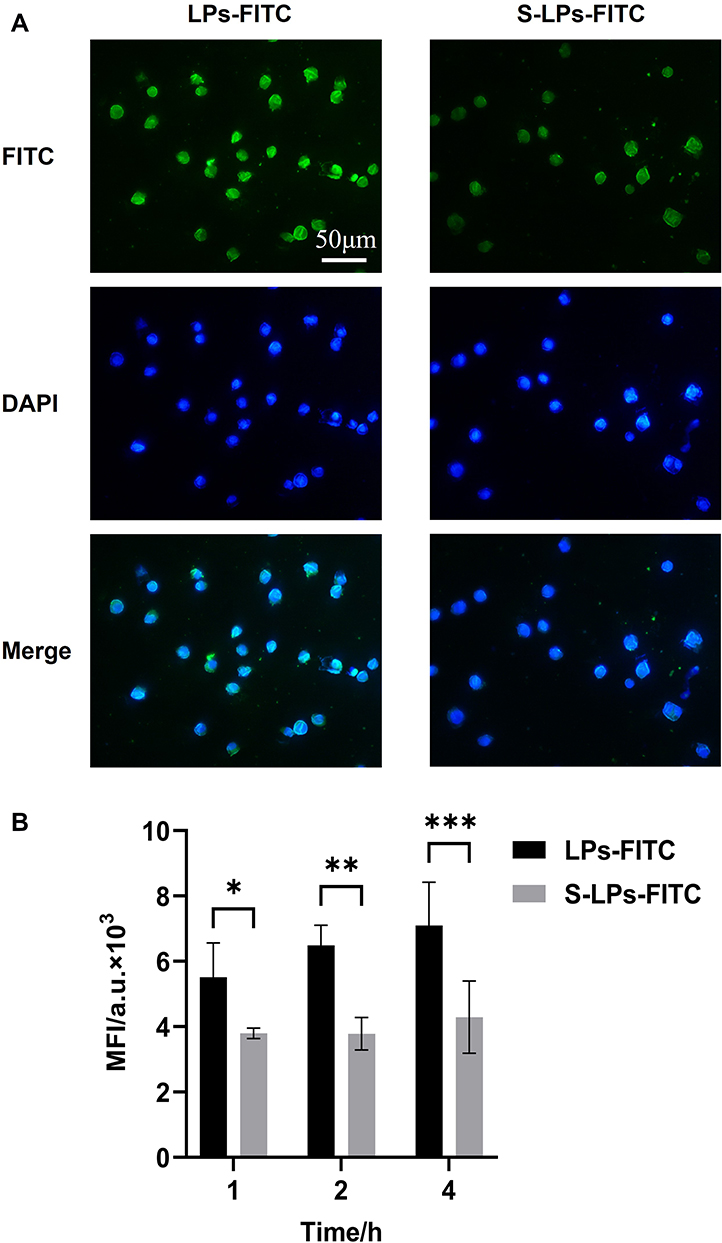 |
Figure 7 (A) Fluorescence micrographs of cellular uptake. (B) Mean fluorescence intensity of cellular uptake of LPs-FITC and S-LPs-FITC by RAW264.7 cells (n = 4),*p < 0.05, **p < 0.01, ***p < 0.001. |
The results of cellular uptake experiments showed that the formulation coated with DSPE-PEG2000 significantly reduced the phagocytosis of particles by macrophages compared to that in the uncoated formulation. This suggests that coating the nanoparticles with DSPE-PEG2000 may enable them to escape phagocytosis by macrophages and prolong the retention of the drugs, which was consistent with previously reported literature.25,26
Cell Scratching Assay
The ability to inhibit cell migration was assessed by examining the wound healing in the confluent A549 cells. Considering the variation in scratch thickness and the irregularity of cell growth and migration, the area method was chosen to reflect cell mobility.27
As shown in Figure 8A. After 24 and 48 h of administration, the wound area in the S-LPs group was significantly reduced, indicating that the carrier materials had no significant inhibitory effect on A549 cell migration. In contrast, the wound area of the S-LPs@Tet group was only slightly reduced, indicating that the migration ability of A549 cells was significantly impeded. Although the free Tet hindered the wound recovery to some extent within 24 h, the wound largely healed at 48 h. However, S-LPs@Tet still impaired the wound healing.
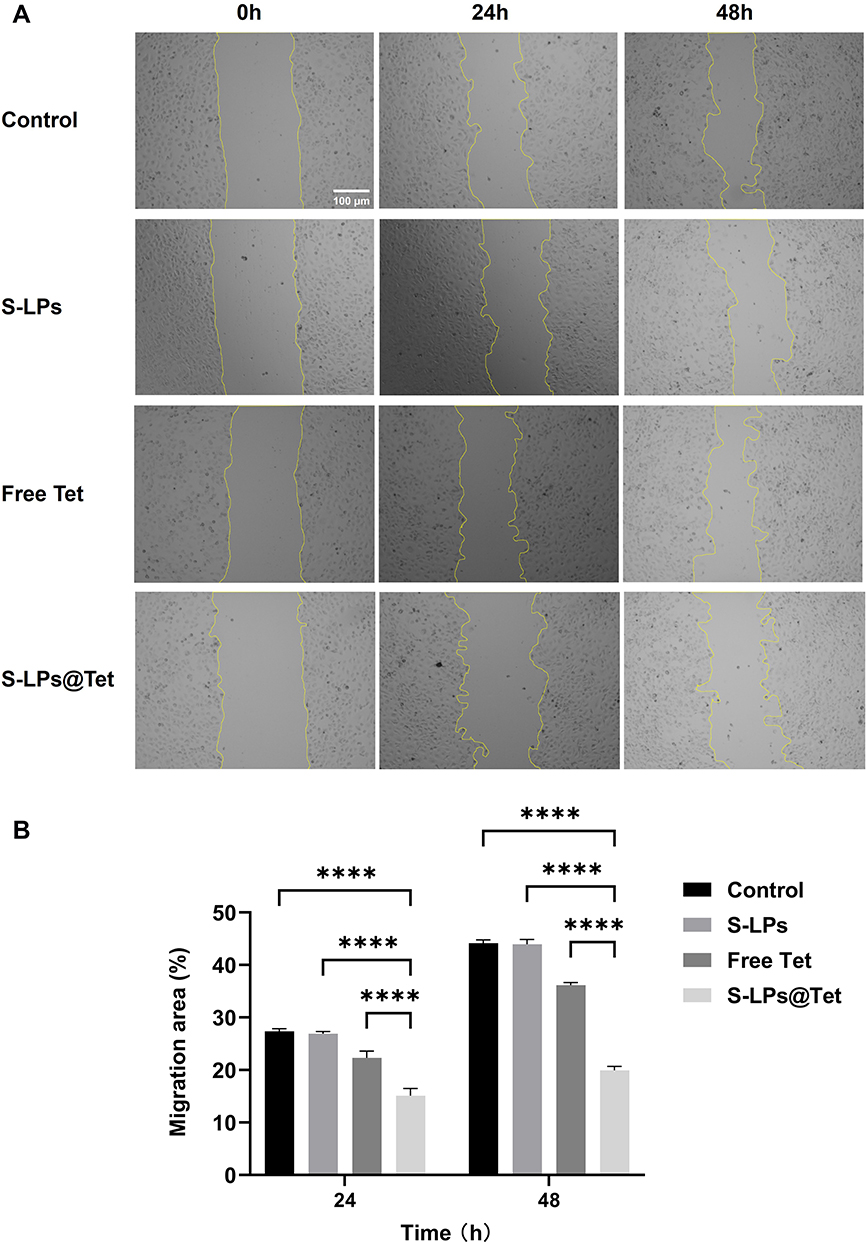 |
Figure 8 (A) Representative images of wound healing scratch assay in A549 cells (Scale bar, 100 μm). (B) Migration rate (%) of cell migration by wound healing assay,****p < 0.0001. |
It can be seen in Figure 8B, the cell migration rate of the Free Tet group was 1.8 times higher than that of the S-LPs@Tet group at 48 h. In addition, the cell migration rate in the S-LPs@Tet group finally stabilized at about 20%, while the remaining three groups all exceeded 35%. The Free Tet group was almost in a state of “misfire”, while the S-LPs@Tet group was still in a state of “fire”. The time-based difference reflects the inhibition of S-LPs@Tet on A549 cell migration.
Biodistribution in vivo
The in vivo distribution of Free-Cy5.5, LPs-Cy5.5, and S-LPs-Cy5.5 was monitored in real time using in vivo imaging in small animals after labeling with the fluorescent dye Cy5.5. Figure 9A showed the results of biodistribution. At 1 h post-injection, there was no significant difference in the fluorescence intensity among the mice treated with the above three groups of preparations. After 6 h of intravenous injection, it was observed that the fluorescence intensity of the free Cy5.5 group significantly decreased, whereas the fluorescence of the LPs-Cy5.5 and S-LPs-Cy5.5 groups was primarily localized in the liver and tumor lesion. After 24h, the fluorescence signals of all groups exhibited a decreasing trend. However, the fluorescence signal of the S-LPs-Cy5.5 group was relatively stronger and persisted longer than that of the other two groups. A small amount of fluorescence intensity was still detectable in the body of the S-LPs-Cy5.5 at 48 h, while there was no longer any fluorescence signal in the Free Cy5.5 and LPs-Cy5.5 groups. This finding indicated that the modification of DSPE-PEG2000 could prolong the circulation time in vivo, thereby increasing the distribution of the drugs carried to the lesion site.
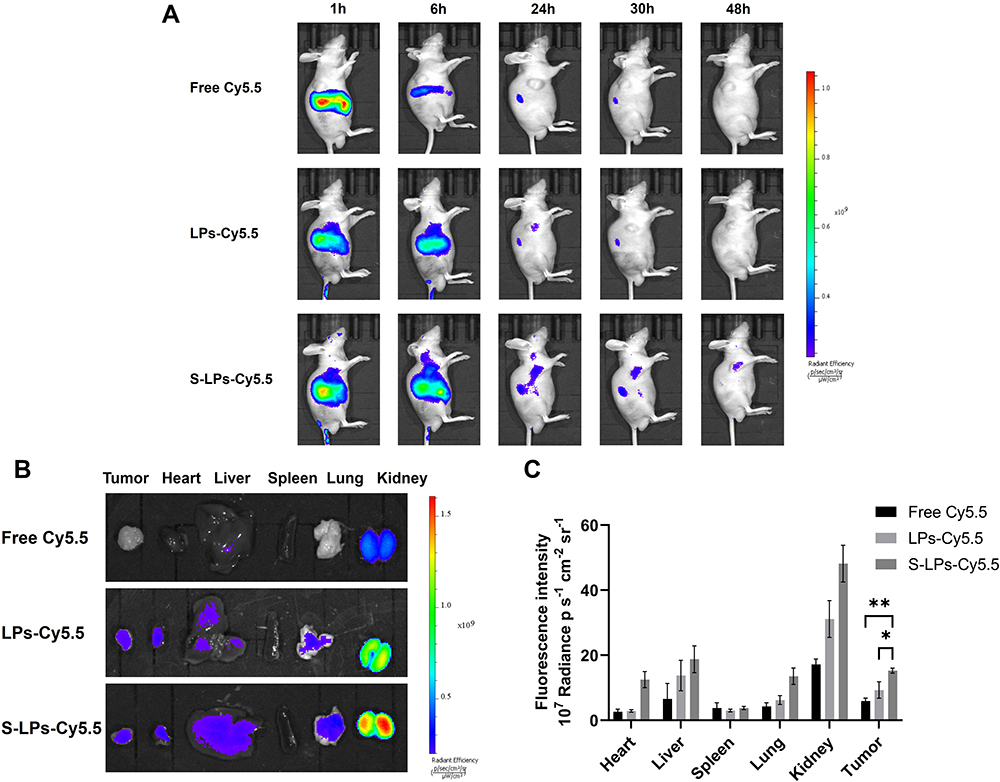 |
Figure 9 In vivo fluorescence imaging of tumor-bearing nude mice in each group (A), ex vivo fluorescence imaging (B) and quantitative analysis (C) of organs and tumors in each group,*p < 0.05, **p < 0.01. |
After 48 h of intravenous injection, the fluorescence distribution in the isolated organs and tissues was detected. As depicted in Figure 9B and C, the fluorescence signals from the Free Cy5.5 and LPs-Cy5.5 groups were predominantly observed in the kidney, while the fluorescence signals from the S-LPs-Cy5.5 group were primarily detected in the kidney and the liver. Additionally, S-LPs-Cy5.5 group exhibited a higher fluorescence intensity at the tumor site compared to the other two groups.
In vivo Antitumor Efficacy of S-LPs@Tet
Owing to the excellent in vitro anticancer effect of S-LPs@Tet, the in vivo tumor growth inhibition ability of S-LPs@Tet was further evaluated in A549 tumor-bearing mice. The scheme of the tumor model is displayed in Figure 10A. In the control group, tumor volume grew continuously over time and accelerated over time. As tumor volumes increased over time for both groups treated with LPs@Tet and S-LPs@Tet, they grew at a significantly slower rate than the control group, and S-LPs@Tet inhibited tumor growth the best (Figure 10B–D). As shown in Figure 10E, the tumor volume of the group treated with Free Tet was nearly 6.16 times that of the group treated with S-LPs@Tet.
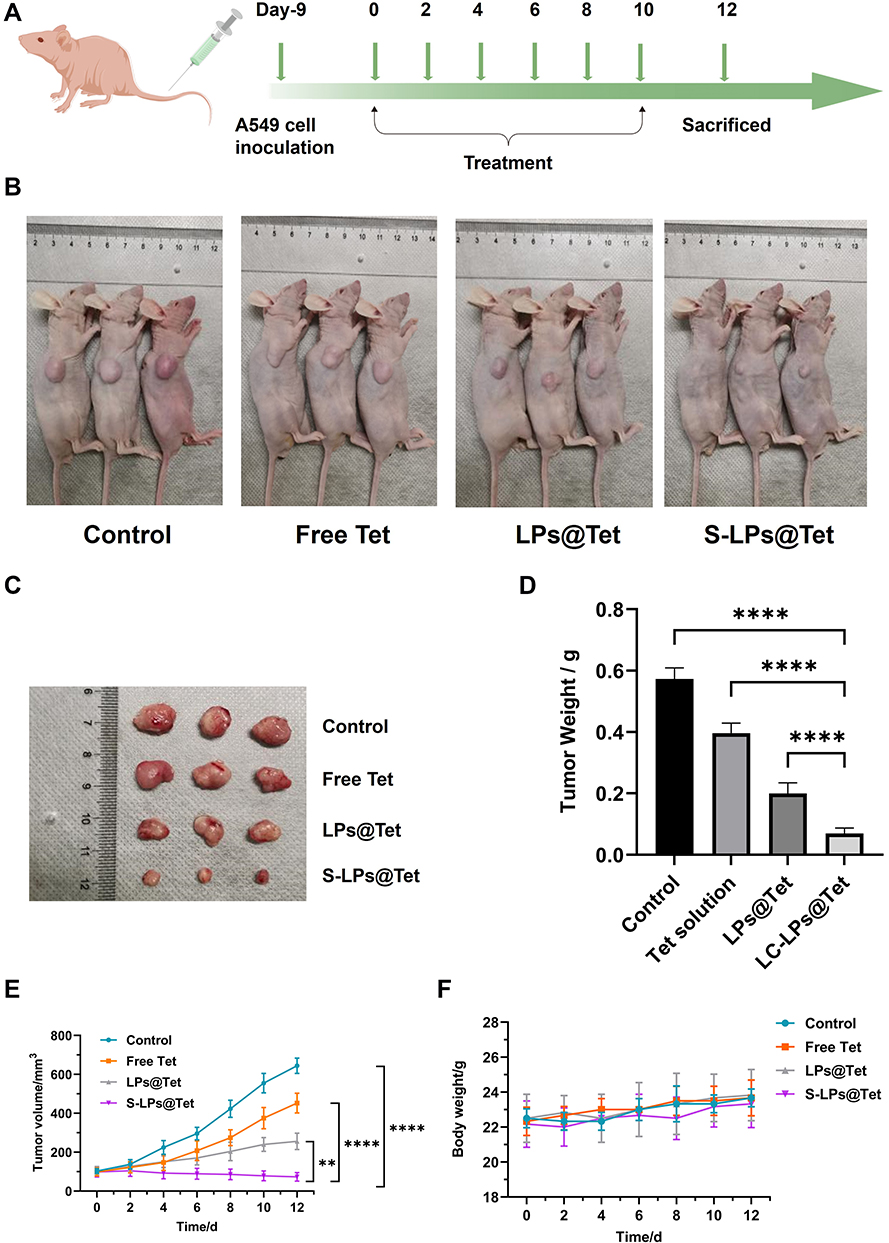 |
Figure 10 Antitumor efficacy of S-LPs@Tet. (A) The scheme of treatment plan; (B) Representative images of tumor-bearing nude mice in each group; (C) Images of isolated tumor; (D) Tumor weight in each group,****p < 0.0001; (E) Growth Curve of tumor volume, **p < 0.01, ****p < 0.0001; (F) Body weight changes of mice. |
Nude mice were monitored for changes in body weight during treatment to estimate potential toxicity of preparation. As illustrated in Figure 10F, the body weight of each treatment group remained stable, and the nude mice showed a better active status during treatment, indicating that treatment groups had a relatively small impact on the body weight of nude mice in this test state.
H&E staining results (Figure 11A) showed that the model control group exhibited dense tumor cells with thickened nuclear membranes. In contrast, necrosis of tumor cells was evident in all treatment groups, with the most pronounced effects observed in the S-LPs@Tet group, where the cells appeared wrinkled, the chromatin was condensed, and the nuclei were shrunken.
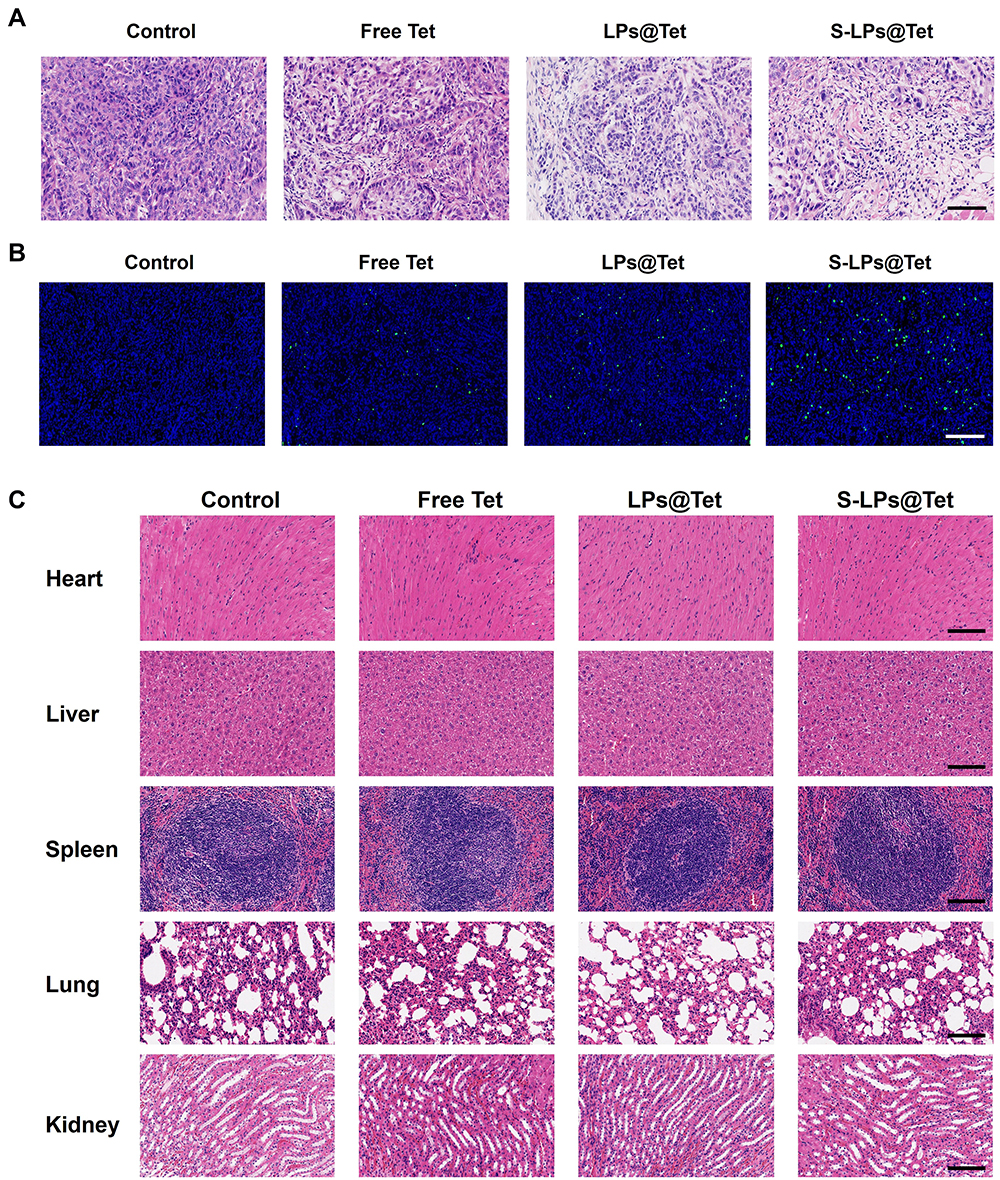 |
Figure 11 H&E (A) and TUNEL (B) staining results of tumor tissue. (C) H&E results of major organ. (Scale bar, 100 μm). |
The results of TUNEL staining (Figure 11B) revealed minimal green fluorescence in the model control group, indicating low apoptosis of tumor cells. In contrast, different levels of green fluorescence were observed in all treatment groups. The S-LPs@Tet group exhibited the strongest green fluorescence signals compared to the Free Tet and LPs@Tet groups, indicating the highest levels of tumor cell apoptosis. All of the aforementioned findings indicate that S-LPs@Tet could promote tumor cell necrosis and apoptosis to some extent.
The results of H&E staining of each major organ are shown in Figure 11C. It can be observed that the tissue structure of the samples from each group was intact, the cells were tightly arranged, and there was no obvious damage. This indicated that the intake of the preparations had almost no obvious toxic side effects on the normal organs of nude mice, and the preparations were deemed safe under the present experimental conditions.
Discussion
This study utilized ethanol injection to prepare S-LPs@Tet with a particle size distribution of approximately 65 nm. Due to the excessive growth of blood vessels in tumor tissues, which results in large gaps (tens or even hundreds of nanometers) between the cells of the vessel walls, making it easy for particles with sizes ranging from 30–70 nm to access.28 Moreover, S-LPs@Tet had a nearly zero absolute zeta potential, which facilitated the entry of LPs into cells and the exertion of therapeutic effects.29 Therefore, the S-LPs@Tet prepared in this study can essentially meet drug delivery requirements.
A two-stage release was observed for S-LPs@Tet in vitro: burst release and sustained release. During the burst stage, Tet was rapidly released within 6 h, accounting for approximately 40% of the total amount. As a result, the drug may have disintegrated on the surface of the LPs and diffused. Tet released slowly and sustainably during the sustained stage, possibly because LPs must diffuse across lipid bilayers to enter release mediums. The stability tests indicated that the S-LPs@Tet exhibited good stability.
Based on cytotoxicity study results, the inhibitory effect of S-LPs@Tet on tumor cells was higher than that of Free Tet. Furthermore, the S-LPs showed little toxicity to cells, indicating that excipients are generally safe. The cell scratching assay revealed that the wound area was only slightly reduced in the S-LPs@Tet group, and the migration ability of A549 cells was significantly impeded. This suggested that S-LPs@Tet strongly inhibited A549 cells migration. This may be due to S-LPs increased “phase solubility” between the drug and the bilayer of the target cell membrane, facilitated by S-LPs, which enhances the transport of nanoparticles to cells.30,31
The “passivated” surface created after the PEG chain modification has been demonstrated to inhibit the internalization of macrophages, enabling exogenous materials to bypass the body’s initial defenses against invading particles.32 In principle, these properties are thought to prevent macrophage activation and subsequent immune responses, thereby ensuring the safe use of exogenous nanomaterials.33 The in vitro immune escape assay showed that the phagocytosis of S-LPs by RAW264.7 cells was significantly diminished after modification with DSPE-PEG2000. It is suggested that the carrier S-LPS endows drugs with immune escape ability, which can potentially prolong the circulation time of the drugs in the body.
S-LPs enhanced Tet’s anti-lung cancer properties in in vivo tests. Modifying PEG prevents LPs from being recognized by the endothelial reticular system, potentially prolonging the circulation time of drugs in the body and thus promoting drugs accumulation at the tumor sites.
Conclusion
To summarize, S-LPs@Tet was successfully prepared with a potential therapeutic benefit. High EE and small size were characteristics of S-LPs@Tet. S-LPs@Tet released sustainably in vitro. Cytotoxicity assays showed higher inhibition rates in lung cancer cells by S-LPs@Tet. In vitro and in vivo experiments also demonstrated a higher safety profile and better efficacy. These unique properties indicated that S-LPs are promising delivery carriers for the clinical applications of Tet.
Due to advancements in modern technologies and related fields, formulation technologies are being innovated and optimized. A novel intelligent drug delivery system that integrates protection, targeting, and controlled release can be developed by combining the physicochemical properties of Tet with clinical needs. This approach aims to enhance the antitumor efficacy of Tet in clinical settings.
Acknowledgments
This work was supported by the Huadong MedicineJoint Funds of the Zhejiang Provincial Natural Science Foundation of China under Grant No. LHDMZ22H300009, Key research projects of Hangzhou Medical College under Grant No. KYZD202106, Education of Zhejiang Province under Grant No. Y202146052, and Key Laboratory of Neuropsychiatric Drug Research of Zhejiang Province under Grant No.2019E10021.
Disclosure
The authors declare no conflicts of interest.
References
1. Zou H, He T, Chen X. Tetrandrine inhibits differentiation of proinflammatory subsets of T helper cells but spares de novo differentiation of iTreg cells. Int Immunopharmacol. 2019;69:307–312. doi:10.1016/j.intimp.2019.01.040
2. Luan F, He X, Zeng N. Tetrandrine: a review of its anticancer potentials, clinical settings, pharmacokinetics and drug delivery systems. J Pharm Pharmacol. 2020;72(11):1491–1512. doi:10.1111/jphp.13339
3. Wang X, Yang Y, Yang D, et al. Tetrandrine prevents monocrotaline-induced pulmonary arterial hypertension in rats through regulation of the protein expression of inducible nitric oxide synthase and cyclic guanosine monophosphate-dependent protein kinase type 1. J Vasc Surg. 2016;64(5):1468–1477. doi:10.1016/j.jvs.2015.09.016
4. Bai XY, Liu YG, Song W, et al. Anticancer activity of tetrandrine by inducing pro-death apoptosis and autophagy in human gastric cancer cells. J Pharm Pharmacol. 2018;70(8):1048–1058. doi:10.1111/jphp.12935
5. Liu C, Lv L, Guo W, et al. Self-nanoemulsifying drug delivery system of tetrandrine for improved bioavailability: physicochemical characterization and pharmacokinetic study. Biomed Res Int. 2018;2018:6763057. doi:10.1155/2018/6763057
6. Shi C, Ahmad Khan S, Wang K, Schneider M. Improved delivery of the natural anticancer drug tetrandrine. Int J Pharm. 2015;479(1):41–51. doi:10.1016/j.ijpharm.2014.12.022
7. Fan C, Li X, Zhou Y, et al. Enhanced topical delivery of tetrandrine by ethosomes for treatment of arthritis. Biomed Res Int. 2013;2013:161943. doi:10.1155/2013/161943
8. Que X, Su J, Guo P, et al. Study on preparation, characterization and multidrug resistance reversal of red blood cell membrane-camouflaged tetrandrine-loaded PLGA nanoparticles. Drug Deliv. 2019;26(1):199–207. doi:10.1080/10717544.2019.1573861
9. Li X, Lu X, Xu H, et al. Paclitaxel/tetrandrine coloaded nanoparticles effectively promote the apoptosis of gastric cancer cells based on “oxidation therapy”. Mol Pharm. 2012;9(2):222–229. doi:10.1021/mp2002736
10. Guo L, Zhang H, Wang F, et al. Targeted multidrug-resistance reversal in tumor based on PEG-PLL-PLGA polymer nano drug delivery system. Int J Nanomed. 2015;10:4535–4547. doi:10.2147/IJN.S85587
11. Gao Y, Sun Y, Liao G, et al. DSPE-PEG polymers for improving pulmonary absorption of poorly absorbed macromolecules in rats and relative mechanism. Drug Dev Ind Pharm. 2021;47(2):337–346. doi:10.1080/03639045.2021.1879837
12. Wang R, Xiao R, Zeng Z, et al. Application of poly(ethylene glycol)-distearoylphosphatidylethanolamine (PEG-DSPE) block copolymers and their derivatives as nanomaterials in drug delivery. Int J Nanomed. 2012;7:4185–4198. doi:10.2147/IJN.S34489
13. Elsaid Z, Taylor KM, Puri S, et al. Mixed micelles of lipoic acid-chitosan-poly(ethylene glycol) and distearoylphosphatidylethanolamine-poly(ethylene glycol) for tumor delivery. Eur J Pharm Sci. 2017;101:228–242. doi:10.1016/j.ejps.2017.02.001
14. Gill KK, Kaddoumi A, Nazzal S. PEG-lipid micelles as drug carriers: physiochemical attributes, formulation principles and biological implication. J Drug Target. 2015;23(3):222–231. doi:10.3109/1061186X.2014.997735
15. Gao C, Zhang L, Tang Z, et al. Preparation, characterization, and anti-colon cancer activity of oridonin-loaded long-circulating liposomes. Pharm Dev Technol. 2021;26(10):1073–1078. doi:10.1080/10837450.2021.1982966
16. Marzban E, Alavizadeh SH, Ghiadi M, et al. Optimizing the therapeutic efficacy of cisplatin PEGylated liposomes via incorporation of different DPPG ratios: in vitro and in vivo studies. Colloids Surf B Biointerfaces. 2015;136:885–891. doi:10.1016/j.colsurfb.2015.10.046
17. Omar MM, Hasan OA, Zaki RM, et al. Externally triggered novel rapid-release sonosensitive folate-modified liposomes for gemcitabine: development and characteristics. Int J Nanomed. 2021;16:683–700. doi:10.2147/IJN.S266676
18. Wang K, Hu H, Zhang Q, et al. Synthesis, purification, and anticancer effect of magnetic Fe3O4-loaded poly (lactic-co-glycolic) nanoparticles of the natural drug tetrandrine. J Microencapsul. 2019;36(4):356–370. doi:10.1080/02652048.2019.1631403
19. Altube MJ, Caputo EN, Rivero MN, et al. Photodynamic therapy with nebulized nanocurcumin on A549 cells, model vessels, macrophages and beyond. Pharmaceutics. 2022;14(12):2637. doi:10.3390/pharmaceutics14122637
20. Zhang H, Xie B, Zhang Z, et al. Tetrandrine suppresses cervical cancer growth by inducing apoptosis in vitro and in vivo. Drug Des Devel Ther. 2018;13:119–127. doi:10.2147/DDDT.S187776
21. Klibanov AL, Maruyama K, Torchilin VP, et al. Amphipathic polyethyleneglycols effectively prolong the circulation time of liposomes. FEBS Lett. 1990;268(1):235–237. doi:10.1016/0014-5793(90)81016-h
22. Song JW, Liu YS, Guo YR, et al. Nano-Liposomes Double Loaded with Curcumin and Tetrandrine: preparation, Characterization, Hepatotoxicity and Anti-Tumor Effects. Int J Mol Sci. 2022;23(12):6858. doi:10.3390/ijms23126858
23. Guo J, Gu X, Mai Y, et al. Preparation and characterisation of tetrandrine nanosuspensions and in vitro estimate antitumour activity on A549 lung cancer cell line. J Microencapsul. 2020;37(5):384–393. doi:10.1080/02652048.2020.1761905
24. Zheng H, Li J, Luo X, et al. Murine RAW264.7 cells as cellular drug delivery carriers for tumor therapy: a good idea? Cancer Chemother Pharmacol. 2019;83(2):361–374. doi:10.1007/s00280-018-3735-0
25. Blume G, Cevc G. Molecular mechanism of the lipid vesicle longevity in vivo. Biochim Biophys Acta. 1993;1146(2):157–168. doi:10.1016/0005-2736(93)90351-y
26. Eue I. Differential uptake of conventional and polyethylene glycol modified-alkylphosphocholine-liposomes by J 774A.1 murine macrophages. Drug Deliv. 1998;5(4):265–273. doi:10.3109/10717549809065757
27. Dubey AK, Podia M, Raut S, Singh S, Pinnaka AK, Khatri N. Insight into the beneficial role of lactiplantibacillus plantarum supernatant against bacterial infections, oxidative stress, and wound healing in A549 cells and BALB/c mice. Front Pharmacol. 2021;12:728614. doi:10.3389/fphar.2021.728614
28. Cabral H, Matsumoto Y, Mizuno K, et al. Accumulation of sub-100 nm polymeric micelles in poorly permeable tumours depends on size. Nat Nanotechnol. 2011;6(12):815–823. doi:10.1038/nnano.2011.166
29. Pastore C. Size-dependent nano-bio interactions. Nat Nanotechnol. 2021;16(10):1052. doi:10.1038/s41565-021-00996-z
30. Hagiwara K, Kurihara K, Honma M, et al. PEG-modification on the endo-position of an antisense oligonucleotide increases tumor accumulation via the EPR effect. J Biomater Sci Polym Ed. 2018;29(4):448–459. doi:10.1080/09205063.2017.1422853
31. D’souza AA, Shegokar R. Polyethylene glycol (PEG): a versatile polymer for pharmaceutical applications. Expert Opin Drug Deliv. 2016;13(9):1257–1275. doi:10.1080/17425247.2016.1182485
32. Sacchetti C, Motamedchaboki K, Magrini A, et al. Surface polyethylene glycol conformation influences the protein Corona of polyethylene glycol-modified single-walled carbon nanotubes: potential implications on biological performance. ACS Nano. 2013;7(3):1974–1989. doi:10.1021/nn400409h
33. Luo N, Ni D, Yue H, et al. Surface-engineered graphene navigate divergent biological outcomes toward macrophages. ACS Appl Mater Interfaces. 2015;7(9):5239–5247. doi:10.1021/am5084607
 © 2024 The Author(s). This work is published and licensed by Dove Medical Press Limited. The full terms of this license are available at https://www.dovepress.com/terms.php and incorporate the Creative Commons Attribution - Non Commercial (unported, v3.0) License.
By accessing the work you hereby accept the Terms. Non-commercial uses of the work are permitted without any further permission from Dove Medical Press Limited, provided the work is properly attributed. For permission for commercial use of this work, please see paragraphs 4.2 and 5 of our Terms.
© 2024 The Author(s). This work is published and licensed by Dove Medical Press Limited. The full terms of this license are available at https://www.dovepress.com/terms.php and incorporate the Creative Commons Attribution - Non Commercial (unported, v3.0) License.
By accessing the work you hereby accept the Terms. Non-commercial uses of the work are permitted without any further permission from Dove Medical Press Limited, provided the work is properly attributed. For permission for commercial use of this work, please see paragraphs 4.2 and 5 of our Terms.