Back to Journals » OncoTargets and Therapy » Volume 14
Preparation, Biocompatibility and Antitumor Activity of Nanodelivery System Targeting Breast Cancer Base on a Silica Nanoparticle
Authors Liu J, Ren S, Zhang X ![]() , Feng Y, Qiu Z, Ma L, Huang J
, Feng Y, Qiu Z, Ma L, Huang J
Received 9 November 2020
Accepted for publication 22 April 2021
Published 25 May 2021 Volume 2021:14 Pages 3429—3442
DOI https://doi.org/10.2147/OTT.S291142
Checked for plagiarism Yes
Review by Single anonymous peer review
Peer reviewer comments 2
Editor who approved publication: Dr William C. Cho
Jiuzhou Liu,1,* Shasha Ren,2,* Xiangyu Zhang,3 Yun Feng,2 Zhenglun Qiu,2 Li Ma,4 Jingwen Huang4
1Department of Breast and Thyroid Surgery, The First Affiliated Hospital of Henan University of Science and Technology, Luoyang, 471003, People’s Republic of China; 2Department of Breast and Thyroid Surgery, Luoyang Central Hospital Affiliated to Zhengzhou University, Luoyang, 471009, People’s Republic of China; 3Department of Pathology, Jining First People’s Hospital, Jining Medical University, Jining, 272000, People’s Republic of China; 4The First Affiliated Hospital of Bengbu Medical College, Bengbu, 233004, People’s Republic of China
*These authors contributed equally to this work
Correspondence: Jingwen Huang; Jiuzhou Liu Email [email protected]; [email protected]
Background: Breast cancer (BC) is the most common type of cancer among women worldwide, and about 30% of males will have recurrent disease.
Methods: In order to treat recurrent BC, we designed a type of silica nanodelivery system loaded with epirubicin and curcumin (composite nanoparticles, CNPs). To promote CNPs clinical application, the stability, the blood, immune and cell compatibility, skin stimulation experiments, anti-tumor activity in vivo and in vitro were studied.
Results: In our study, the CNPs had a particle size of 73.9 nm and a uniform size and morphology; moreover, they maintained physical and chemical stability in the blood protein environment. Additionally, results showed that nanoparticles had good blood and immune compatibility, and they did not affect intracellular superoxide dismutase (SOD) and intracellular catalase (CAT). Skin stimulation experiments showed that CNPs did not cause any obvious irritative damage to the intact skin of rabbits. In the cytotoxicity study, CNPs showed strongest antitumor activity. The results of cell cycle and apoptosis studies showed that CNPs could mainly induce apoptosis of S and G2/M phase cells. In vivo, CNPs showed strongest aggregation in the tumor after 6 h of tail vein administration, and a large amount of CNPs continued to accumulate in the blood after 12 h of administration, indicating that CNPs had long circulation ability. The in vivo antitumor activities showed that CNPs had the strongest antitumor activity and tumor targeting ability, and hematoxylin-eosin staining of internal organs showed no obvious difference between treatment groups and negative control.
Conclusion: CNPs have an ideal biosafety and therapeutic effect for recurrent BC, and they have potential clinical application value.
Keywords: nanoparticles, breast cancer, chemotherapy, targeting, biocompatibility
Introduction
Breast cancer (BC) is often called “the pink killer”. BC is the most common type of cancer among women worldwide, and 24.2% of males with newly diagnosed cancer were diagnosed as having BC.1,2 Thus, the incidence rate is the highest in women. In the United States, 1 in 8 women develop BC; in China, more than 300,000 women are diagnosed with BC every year.1–3 The 5-year survival rate is 89% in the United States and about 80% in China.4,5 But the recurrence rate of BC is very high, about 30%. In addition, the incidence of BC is high; thus, BC is still the main killer among females (15%), followed by lung cancer (13.8%) and colon cancer (9.5%).1–6 After BC recurrence in patients, first-line chemotherapy drugs, such as anthracycline drugs, have obvious advantages.7 But they cannot be used again because of cardiac toxicity.3
Anti-cancer drugs using natural compounds, such as paclitaxel, curcumin and doxorubicin, are of importance because of the multitargeting capability and outstanding therapeutic activity. However, poor solubility and bioavailability have limited their efficacy.8,9 But nanocarriers can be used to improve the anticancer activity of the natural compounds.
In view of this situation, the development of nanotechnology has brought new opportunities for the treatment of recurrent BC.10 Nanocarriers can prevent direct contact between drugs and normal tissue cells, such as heart cells, by wrapping chemotherapy drugs, thus providing high efficacy and low toxicity in recurrent BC.3,11,12 However, most of the currently developed nanodrugs for recurrent BC have some disadvantages, such as poor targeting ability or poor biological safety, which limits their clinical development and application.13 The αvβ3 receptor in some BC had high expression. In MCF-7 breast cancer, although the expression of αvβ3 receptor is relatively low, it is still highly expressed compared with other receptors, so we use this as a target. Accordingly, our research team prepared a kind of composite nanoparticles (CNPs) based on mesoporous silicon encapsulating cationic polymers epirubicin (EPI) and curcumin (Cur) to improve the anti-tumor activity and cyclo (Arg-Gly-Asp-d-Phe-Cys) (c(RGDfC), cRGD) for targeting BC by binding to the αvβ3 receptor in the tumor tissue.3,14 In this paper, we report on our studies of the biocompatibility and anti-BC activity of CNPs.
Materials and Methods
Materials
3.9-Bis(3-aminopropyl)-2,4,8,10-tetraoxaspiro [5.5] undecane (BATU) and β-cyclodextrin (β-CD) were purchased from Aladdin Reagent Co., Ltd (Shanghai, China). N-hydroxysuccinimide (NHS), N,N-dimethylformamide (DMF) and N-(3-dimethylaminopropyl)-N′-ethylcarbodiimide hydrochloride (EDC) were obtained from Meloney Biotechnology Co., Ltd (Dalian, China). Further, 3-chloropropyl trimethoxysilane (CPTS) was purchased from West Asia Reagent Co., Ltd (Chengdu, China). Sodium citrate was obtained from Meryer Chemical Technology Co., Ltd (Shanghai, China). EPI, Cur, Dulbecco’s Modified Eagle Medium (DMEM), fetal bovine serum (FBS), cell counting kit-8 (CCK-8), cell cycle analysis kit (PI/RNase Staining), annexin V-FITC apoptosis detection kit, phorbol 12-myristate 13-acetate (PMA), IL-1β, TGF-β1, bovine serum albumin (BSA), superoxide dismutase (SOD) and catalase (CAT) kits were purchased from Anhui Muweixing Technology Co., Ltd (Hefei, China). Cetyltrimethylammonium bromide (CTAB) and mPEG (2000 Da) were obtained from Sigma-Aldrich (China) Co., Ltd (Shanghai, China). Other solvents and reagents were purchased from Sinopharm Chemical Reagent Co., Ltd (Shanghai, China).
Cell Culture
MCF-7 cell line (human BC cell) was purchased from the Stem Cell Bank, Chinese Academy of Sciences, and cultured in DMEM with 10% FBS and 1% penicillin-streptomycin.15
Animal Study
All animals were purchased from the Experimental Animal Center of Zhengzhou University; all animal studies protocol were approved by the Ethical Committee of Zhengzhou University, and all operations accorded with guidelines and regulations of Zhengzhou University. National Institutes of Health guide for the care and use of laboratory animals was strictly complied with by us.
Methods
Preparation of CNPs
First, 0.5 g of CTAB was dissolved in 240 mL of ultrapure water. Then, 1.75 mL of NaOH (2.0 M) was added to the solution and adjusted to 60 °C. Tetraethyl orthosilicate (TEOS) was then added, and the solution was stirred for 2–4 h. The precipitate was collected by centrifugation and washed with ethanol to prepare mesoporous silica nanoparticles (MSN). Further, 0.3 mL of CPTS was added to 50 mL of anhydrous toluene (containing 0.2 g MSN) and stirred at 70–75 °C for 20 h. The precipitate was collected by centrifugation and washed with ethanol to obtain carboxylated MSN (MSN-COOH). Then, a total of 20 mg of MSN-COOH was dissolved in 1 mL of DMF containing 12 mg of EDC, 5 mg of NHS and 65 mg of BATU, and this solution was vacuum-shocked for 8 h to collect the suspended MSN-COOH-BATU particles without drugs. Further, 4.0 mg of EPI was dissolved in 0.3 mL of DMSO containing 20% Tween-20, and it was mixed to prepare the EPI@MSN-COOH-BATU nanoparticles (NPs). A pellet was added to 2 mL of ethanol containing 5 mg Cur and stirred at room temperature overnight to allow Cur to penetrate the pores, and this was followed by centrifugation to remove the unincorporated drug. In order to avoid drug release from the well, NPs were dissolved in 1 mL DMF and 5 mg β-CD, reacted at room temperature for 8 h and then washed with DMF, ethanol and water. Vacuum drying yielded the β-CD-blocked drug-loaded MSN. Subsequently, a total of 15 mg of the prepared β-CD-blocked NPs in 2 mL of DEPC water was added to 5 nmol carboxylated modified mPEG (2000 Da) and stirred at room temperature for 8 h, and then EDC and NHS were added in sequence. Finally, cRGD was then added to the solution, stirred at room temperature for 8 h and then centrifuged and washed to obtain the cRGD-modified loaded NPs (EPI/Cur@MSN-BATU-β-CD-mPEG-cRGD; CNPs) (Scheme 1).
 |
Scheme 1 Preparation of CNPs. |
Characterization of the CNPs
The CNP solution was diluted to 100 μg/mL, and the zeta potential was detected using a ZetaSizer Nano ZS system. The particle size and size distribution were measured using dynamic light scattering (DLS). Zeta potential detection conditions consisted of a He-Ne laser with a wavelength of 633.8 nm and 25 °C.16–19 For transmission electron microscopy (TEM) characterization, the CNP solution was applied to a 200-mesh copper net and then dried at room temperature prior to TEM detection (JEM-1400, JEOL, Japan).19–21
Drug Loading Content (DLC), Encapsulation Efficiency (EE) and in vitro Release of EPI and Cur
After freshly prepared NPs were centrifuged, the absorbance of EPI and Cur in the supernatant was detected by UV spectrophotometer. DLC and EE were calculated according to the standard curve and formula (1) and (2).22
DLC = loaded drug weight/NPs weight × 100% (1)
EE = loaded drug weight/input drug weight × 100% (2)
The release profile of CNPs in PBS (pH 7.4) was evaluated using the dialysis method. Briefly, 10 mg of CNPs was kept in a dialysis bag (MWCO 8000–14,000 Da, Greenbird Inc., Shanghai, China) and gently shaken in 20 mL PBS at 37 °C. Then, 2 mL aliquots were taken and replaced with an equal volume of fresh PBS. The concentration of EPI or Cur was measured using UV-vis spectrophotometry at a wavelength of 480 nm or 260 nm, respectively.
Stability Study of the NPs
The DLS method was used to detect the diameter of NPs at different stages using 5% FBS or 2% BSA at 37 °C for 4 h and 12 h. Samples (MSN, MSN-BATU-β-CD and CNPs) were evaluated by DLS to determine protein adsorption indirectly.23
Hemolysis Rates in the CNPs
Fresh blood from healthy volunteers was mixed with 3.8% sodium citrate (anticoagulant) at a volume ratio of 4:1 and then diluted with physiological saline (8 mL anticoagulant blood plus 10 mL of physiological saline).23 The prepared CNPs were added to the diluted blood at final CNP concentrations of 1, 2, 4 and 8 mg/mL, and then incubated at 37 °C for 1 h. The mixed blood was then centrifuged at 2500 rpm for 5 min. The supernatant was collected, and the absorbance at a wavelength of 540 nm was measured using an ultraviolet spectrophotometer. Hemolysis rate (%) = (Dt-Dnc)/(Dpc-Dnc) × 100%. Dt, Dpc and Dnc were the absorbance values of the experimental group, positive control and negative control, respectively. The hemolysis rate in the negative control (physiological saline) was 0%, and the hemolysis rate in the positive control (distilled water) was 100%. A hemolysis rate < 5% indicates that the nanomaterial meets the clinical requirements, and a hemolysis rate > 5% indicates that the nanomaterial promotes hemolysis and does not meet the clinical requirements.24 All studies on human samples were approved by the Ethical Committee of Zhengzhou University, and all operations accorded with guidelines and regulations of China and the Declaration of Helsinki. All volunteers were informed and signed informed consent.
Immunocompatibility Test of the CNPs
PMA was added to RPMI 1640 medium (containing 10% FBS, 1% penicillin and streptomycin) with THP-1 cells in the logarithmic growth phase, and the final concentration of PMA was 25 ng/mL. Then, the PMA solution was added into the kit 96-well plate at 200 μL/per well. After incubation for 72 h, THP-1 cells were induced and differentiated into macrophages. According to the instructions of the quantitative enzyme-linked detection kit for transforming growth factor beta-1 (TGF-β1) and interleukin (IL)-1β, the cell medium containing PMA was carefully aspirated in each well, and 200 μL of RPMI 1640 medium containing CNP carrier was added. Further, 200 μL of RPMI 1640 medium was added to the negative control, and 200 μL of RPMI 1640 containing 6% phenol was added to the positive control. It was then cultured in a cell incubator for 24 h. The supernatant was processed and added into the antibody-coated plate, and the optical density (OD) value at 450 nm was detected. In the meantime, the standard curve was obtained according to the kit instructions. The contents of TGF-β1 and IL-1β were obtained according to the OD value and the standard curve.20,25–27
SOD and CAT Assays of the CNPs
BC cells were cultured in 6-well plates. After adherence, the culture medium was aspirated, and 2.5 mL of DMEM medium (containing NP carrier concentration of 1, 2, 4 or 8 mg/mL) was added and co-incubated with the cells. DMEM medium (without NPs) was used as a negative control. After incubation for 24 h, the SOD and CAT concentrations were determined according to the manufacturer’s instructions.28
Single Skin Irritation Tests of the CNPs
Healthy female New Zealand rabbits with a 2.0–2.5 kg body weight were selected. The two sides of the rabbit spine were depilated (2×2 cm), and one side was injected subcutaneously with 0.2 mL of normal saline (negative control), and the other side was injected with 0.2 mL of CNP carrier (8 mg/mL), with four injection points per side. Before and after injection, the injection sites were sterilized with 75% alcohol. After injection, the injection site was covered with sterile gauze. At 1, 24, 48 and 72 h after injection, skin reaction at the injection point was visually observed under natural light. The average value of the skin reaction scores at each time point was calculated for each group, and the stimulation intensity was evaluated according to Table 1. The outcome evaluation consisted of the average daily score for each animal in each group, which was calculated as (∑ (erythema and edema score))/number of animals/observation days, and the skin irritation intensity was determined as shown in Table 2. Finally, the skin over the injection sites was observed via hematoxylin and eosin (H&E) staining.29,30
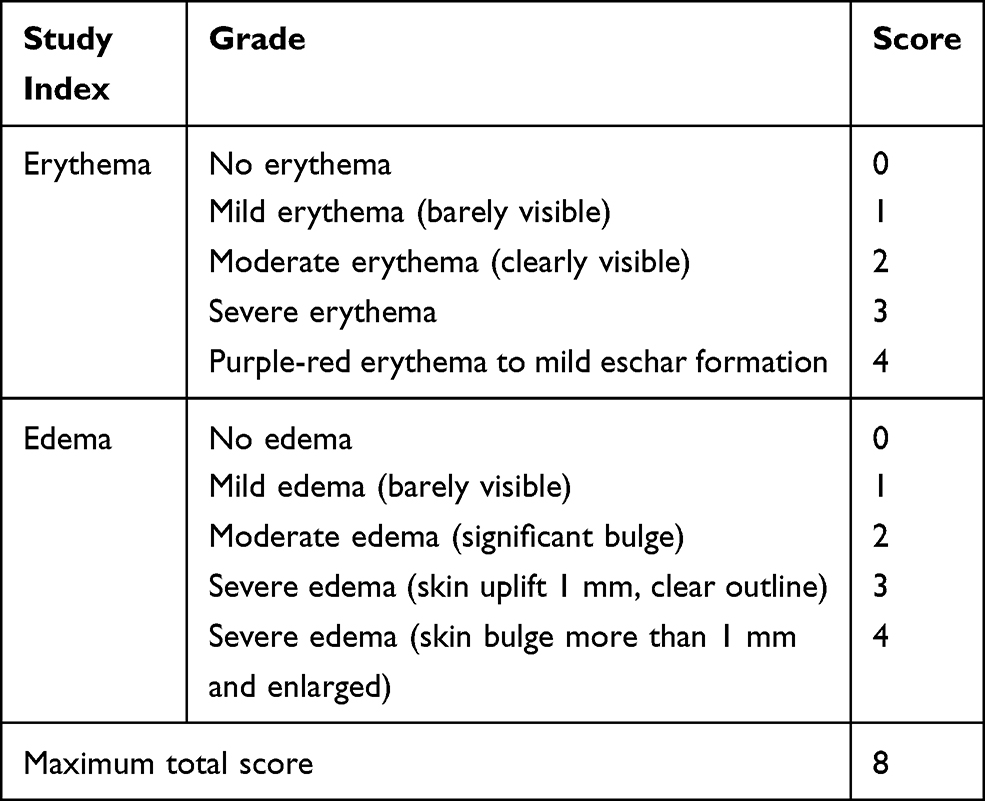 |
Table 1 Indicators and Scoring Criteria for the Skin Irritation Test |
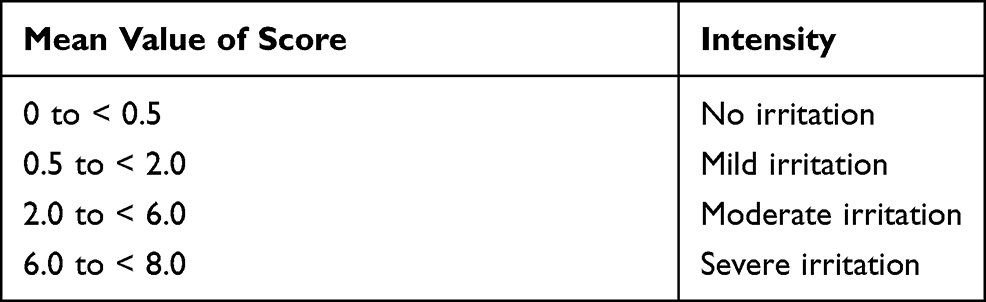 |
Table 2 Skin Irritation Intensity Grading |
Cytotoxicity Tests (CCK-8 Test)
MCF-7 BC cells were cultured in 96-well plates with DMEM medium for 24 h. The culture solution was aspirated, and then 200 μL of culture medium (containing NPs: 10, 20, 50, 100 and 200 μg/mL) was added. PBS was used as a negative control, and 2 μg/mL of doxorubicin was used as a positive control. After incubation for 24 h or 48 h, the culture medium was aspirated and the cells were washed twice with PBS. Then, 100 μL of serum-free medium and 10 μL of CCK-8 reagent were added in turn to each well. After 2 h, the OD value was measured using a microplate reader at a wavelength of 450 nm, and the cell viability of the cells was calculated according to the following formula: viability = (OD value of the experimental group/OD value of the control) × 100% (3).31,32
Cell Cycle and Apoptosis
Cells in the logarithmic growth phase were inoculated into a 24-well plate at 1×10⁶ cells/well. After cell adhesion, 100 μg/mL of different NPs was added and cultured. After 24 h, the cells were digested with trypsin, centrifuged and collected. Then operation was performed according to the Cell Cycle Analysis Kit (PI/RNase Staining) and Annexin V-FITC Apoptosis Detection Kit instructions to analyze the effect of NPs on cell cycle and apoptosis.10
Establishment of a Xenograft Tumor Model
MCF-7 cells were subcutaneously injected into the right forelimb of 4-week-old specific pathogen-free (SPF) nude mice (20–25 g). When the tumor volume was 50–100 mm3, the in vivo distribution and antitumor activity were studied. The calculation formula for tumor volume was as follows: V = a×b2/2 (a = the minimum diameter, b = the maximum diameter) (4).22
In vivo Distribution Study
After intravenous injection of NPs for 3, 6 and 12 h (4 mg/kg), the tumor-bearing mice were sacrificed, and spleen, lung, heart, kidney, liver, tumor and blood were collected. After rinsing with normal saline and drying with a filter paper, the weight of the organs was recorded. Then the organ was placed into a tissue grinder, normal saline (1 mL/100 mg tissue) was added, the mixture was ground and a homogenate was prepared. After centrifugation at 2500 rpm for 10 min, EPI (wavelength: 485 nm) in the supernatant was detected by UV spectrophotometer. The percentage of injected dose per gram of tissue (%ID/g) was used, and it assayed the in vivo biodistribution of NPs.11,31
In vivo Antitumor Activity
The tumor-bearing mice were intravenously injected with CNPs (4 mg/kg weight) once every 3 days. In the meantime, every 3 days, the tumor size was also measured with a vernier caliper. The EPI weight in the EPI@NPs group and the Cur weight in the Cur@NPs group were equal to those in the CNPs group. The tumor volume was calculated and plotted according to the tumor volume formula (4).31
Statistical Analyses
All analyses were performed using the SPSS 22.0 software (IBM Corporation, Chicago, USA), and the results were expressed as mean ± standard deviation, with at least three replicates per group. Statistical significance was assessed using one-way analysis of variance (ANOVA) and Tukey’s post hoc test. All experiments were considered to show statistically significant differences at P < 0.05.
Results and Discussion
Characterization of the CNPs
The morphology study of CNPs showed that they were smooth and round, had a uniform size and narrow particle size distribution and did not form any aggregated clusters. The average particle size was 73.9 ± 10.2 nm, the zeta potential was −23.1 ± 3.7 mV, and the particle distribution index (PDI) was 0.12 ± 0.02 (Figure 1).
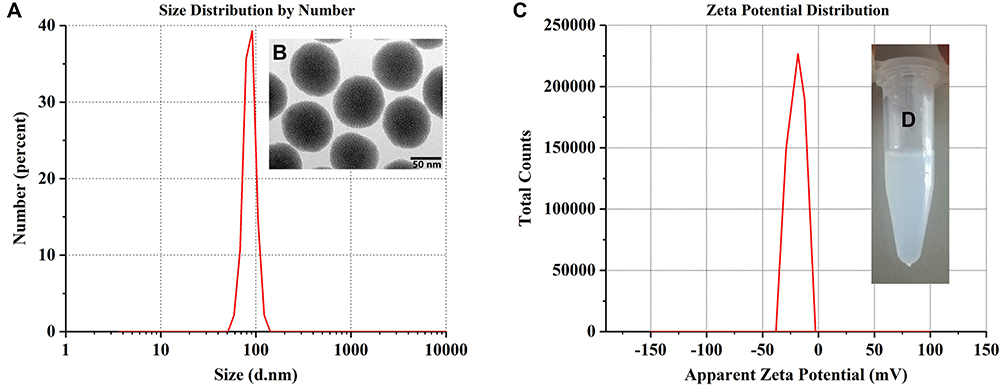 |
Figure 1 Physical and chemical characterization of the CNPs. (A) The size characterization of CNPs shows that the particle size was approximately 70 nm, the distribution range was narrow and the particle size was uniform. (B) The TEM image of the CNPs shows that the NPs were spherical, uniform in size, showed no aggregates and indicated good stability. (C) Zeta potential of CNPs; (D) Appearance of 10 mg/mL CNPs in physiological saline. |
In vitro Release of EPI and Cur
Figure 2A shows that the EEs of EPI and Cur in the CNPs were 72.45% and 83.14%, respectively. The DLCs of EPI and Cur in the CNPs were 2.76% and 3.78%, respectively. The EPI and Cur had ideal EE and DLC, and the EE was more than 70%. In the release study, at 10 min, the release rates of Cur and EPI were 15.8% and 6.4%, respectively (Figure 2B). At 1 h, the release rates of Cur and EPI were 32.4% and 14.9%, respectively. At 72 h, the release rates of Cur and EPI were 98.4% and 59.8%, respectively. It can be seen that the drug release was slow and there was no burst release. The release rate of Cur was more than that of EPI; this was beneficial for the chemotherapy-enhancing effect exerted by Cur, followed by the chemotherapy effect exerted by EPI.
 |
Figure 2 (A) The EE and DLC of EPI and Cur in the CNPs. (B) The release curve of Cur and EPI from CNPs in 0.9% NaCl. |
Stability Study of the NPs
When the NPs enter the blood, plasma proteins are adsorbed onto their surface and the proteins adsorbed on the NPs can be recognized by macrophage surface-related receptors, which subsequently undergo binding and phagocytosis. This process further affects the stability and distribution of the particles in the body.23 Therefore, it is important to use DLS to investigate plasma protein adsorption onto the surface of the NPs. Before incubation, the average size of the three types of NPs (MSN, MSN-BATU-β-CD and CNPs) was between 60 nm and 95 nm, with CNPs having an average size of 73.9 nm. After the three types of NPs were incubated for 4 h or 12 h in distilled water, the average particle size remained essentially the same (Figure 3A and Figure 3A). After incubation with 5% FBS or 2% BSA for 4 h, the average sizes of the three types of NPs were increased, but P was > 0.05. In addition, the increase in particle size of the NPs in BSA was slightly less than that in FBS, probably because BSA is a smaller protein. Thus, in the human body, the influence of albumin on the particle size of NPs will be dominant because the main protein in human serum is albumin.
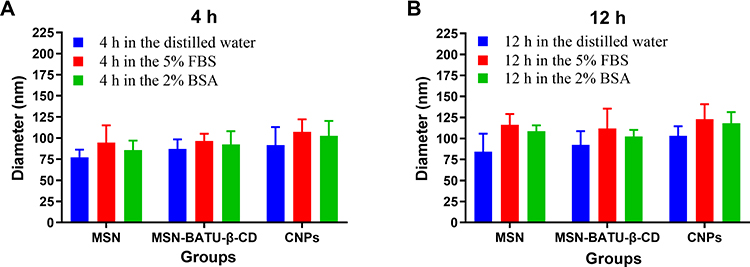 |
Figure 3 Changes in NP diameter after the NPs at different preparation stages were incubated with distilled water, 5% FBS or 2% BSA for (A) 4 h or (B) 12 h at 37 °C. |
Hemolysis Test of the CNPs
Hemolysis tests performed in vitro are considered an important and reliable method for evaluating the blood compatibility of drugs. The results of our hemolysis test showed that the newly prepared CNPs produced a hemolysis rate of red blood cells of less than 2% (Table 3). According to the standards, results of this assay are interpreted as non-hemolysis (hemolysis rate 0–5%) and hemolysis (hemolytic rate > 5%). Linear fitting of the CNP concentration and hemolysis rate yielded the following equation: y = 0.009957 + 0.001218x (R2 = 0.83). It can be seen that when the hemolysis rate reached 5%, the concentration of CNPs was 32.88 mg/mL, far exceeding the normally used concentration (0.05–2 mg/mL). Therefore, the CNPs were determined to be non-hemolytic at these concentrations.
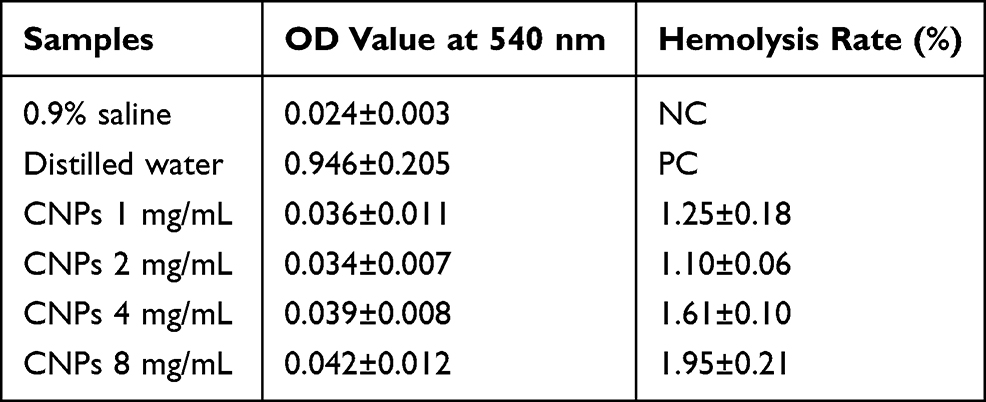 |
Table 3 Hemolysis Rates Produced by the Test materials |
Immunocompatibility Test of CNPs
Before induction, THP-1 cells appeared suspended, and they were round and smooth (Figure 4A); after PMA induction for 24 h, some THP-1 cells began to differentiate into adherent macrophages, and the cell morphology also began to change from circular to fusiform or irregular (Figure 4B); after 48 h of PMA induction, most of the THP-1 cells differentiated into spindle-like or oval-shaped giant cells that could adhere to the wall (Figure 4C). Figure 4D shows that the TGF-β1 contents in the negative control and CNP groups (1, 2, 4 and 8 mg/mL) were 31.4 pg/mL, 28.7 pg/mL, 32.1 pg/mL, 27.9 pg/mL and 34.1 pg/mL, respectively; and the TNF-α contents were 41.2 pg/mL, 42.4 pg/mL, 33.8 pg/mL, 37.4 pg/mL and 36.3 pg/mL, respectively, which were significantly lower than the TGF-β1 (69.5 pg/mL) (P < 0.01) and TNF-α (76.9 pg/mL) contents (P < 0.01) in the positive control. The content of TGF-β1 and TNF-α showed no significant difference between the CNP groups and the negative control (P > 0.05). This indicated that CNPs had no significant effect on the body’s immune function.
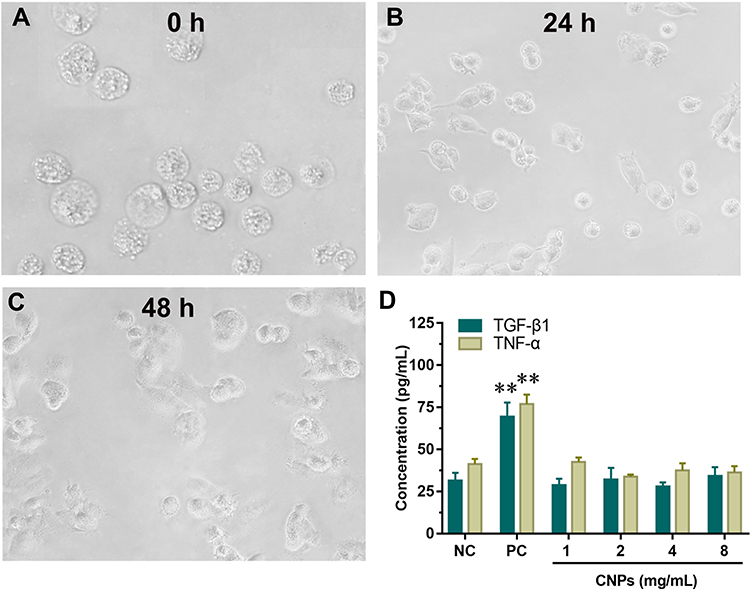 |
Figure 4 The status of THP-1 cells after PMA induction for (A) 0 h, (B) 24 h, (C) 48 h. (D) The cells were incubated with the RPMI 1640 medium containing 6% phenol (positive control), the cells were incubated with the RPMI 1640 medium (negative control) and the cells were incubated with 1, 2, 4 and 8 mg/mL of CNPs (experimental group). ** P < 0.01, compared with negative control. |
SOD and CAT Assays of CNPs
SOD is a metalloenzyme widely present in living organisms, and it is an important oxygen radical scavenger that catalyzes the superoxide anion (O2-) to produce H2O2 and O2, which play an important role in the biological antioxidant system. CAT is widely found in animals and cultured cells. It is the most important H2O2 scavenging enzyme in many organisms and plays an important role in the active oxygen-scavenging system.33,34
In this study, the effects of CNPs on intracellular SOD and CAT levels were studied via the nitroblue tetrazolium (NBT) chromogenic method and the ammonium molybdate colorimetric method. The results showed that the SOD concentrations of the CNP groups (1, 2, 4 and 8 mg/mL) were 8.56 U/mg protein, 10.87 U/mg protein, 9.75 U/mg protein and 11.31 U/mg protein, respectively (Figure 5A), and there was no significant difference when compared with the SOD concentration of 9.69 U/mg protein in the negative control. The CAT concentrations were 15.23 U/mg protein, 16.37 U/mg protein, 16.58 U/mg protein and 18.16 U/mg protein, respectively, and there was no significant difference when compared with the CAT concentration of 17.61 U/mg protein in the negative control (Figure 5B). In addition, the concentration of CNPs had no significant effect on the intracellular SOD and CAT levels, supporting their good biocompatibility.
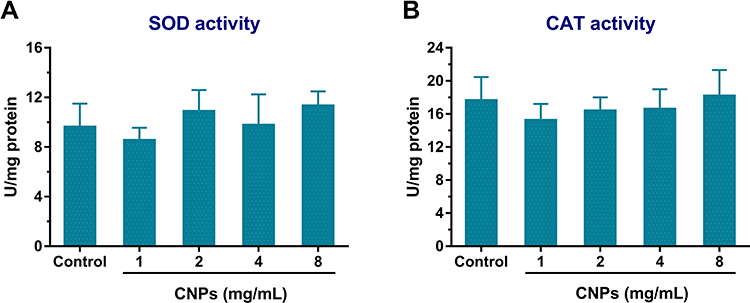 |
Figure 5 (A) SOD activity and (B) CAT activity in MCF-7 BC cells. There was no significant difference between the CNP groups and the negative control in terms of SOD activity or CAT activity. |
Skin Irritation Tests of CNPs
At 1 h, the results of a single skin irritation test showed that the stimulation response of the CNPs for normal rabbit skin had a low average score (0.31 ± 0.12), which was the same as that in the 0.9% NaCl group (negative control) (0.25 ± 0.11) (Table 4), with no statistical difference between the two groups. After 24 h, the average scores in the CNPs group and 0.9% NaCl group were zero for a single normal skin irritation test. In addition, the average daily score was 0.42 in the CNP groups and 0.33 in the 0.9% NaCl group, indicating that no stimulation was conferred by the CNPs according to the rating criteria (Table 2). The H&E staining of the injection sites at 72 h is presented in Figure 6, and the H&E staining in the two groups was similar with no abnormalities, including edema, necrosis or apoptosis. These results indicated that a single administration of CNPs produced little to no irritation of the intact skin.
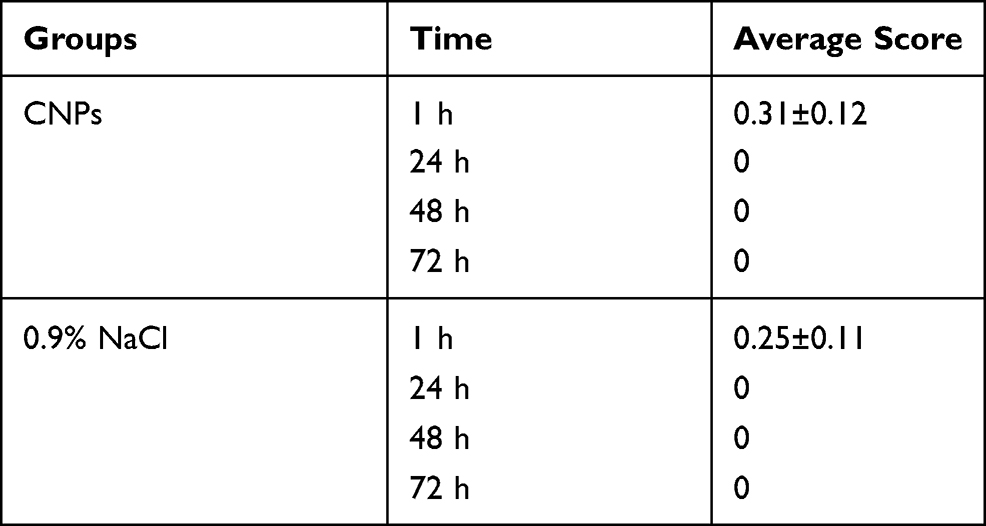 |
Table 4 Average Scores of a Single Skin Irritation Test Performed Using CNPs and 0.9% NaCl |
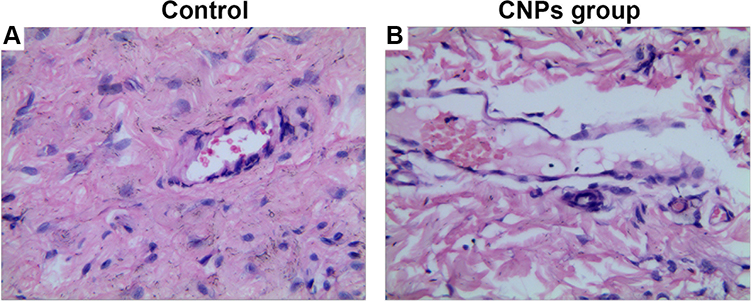 |
Figure 6 At 72 h after injection, H&E staining of the injection sites in the (A) 0.9% NaCl group and (B) 8 mg/mL CNPs group. (A) and (B) presented no abnormalities, such as edema, necrosis or apoptosis. |
Cytotoxicity Tests
The cytotoxicity of the CNPs was assessed via CCK-8 analysis in the MCF-7 cell line. When CNPs at different concentrations were incubated with the cell line, cell viability was concentration-dependent (Figure 7). When the concentration of CNPs was higher, the cell viability was lower. When the cell viability rate was lower than 75%, the concentrations of Cur@NPs, EPI@NPs and CNPs were approximately 200 μg/mL, 50 μg/mL and 20 μg/mL for 24 h; and 200 μg/mL, 20 μg/mL and 10 μg/mL for 48 h, respectively. Among all NPs, the cytotoxicity of CNPs was the highest and the cytotoxicity of Cur was the lowest. With an increase in the NP concentration, there was an increase in the cytotoxicity. Chemotherapy sensitization increased with an increase in the Cur concentration. The cell viability of all positive control cells was significantly lower than that in the negative control (P < 0.05).
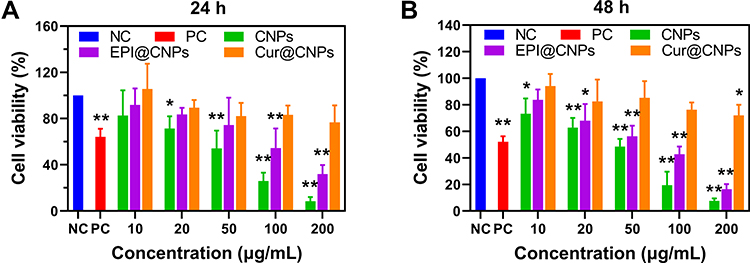 |
Figure 7 CNPs at different concentrations were incubated with the MCF-7 cell line for (A) 24 h and (B) 48 h, and their effect on the cytotoxicity was assessed. * and ** Indicate P < 0.05 and P < 0.01, respectively, compared with the negative control. |
Cell Cycle and Apoptosis
EPI acts via direct entry into the nucleus base pairs of DNA to interfere with the transcription process and prevent mRNA formation, thus inhibiting DNA and RNA synthesis. As a cell cycle nonspecific drug, it is effective in many types of transplanted tumors.35 In order to determine whether growth inhibition of MCF-7 cells is related to cell cycle and apoptosis, we evaluated the effects of CNPs on cell cycle and apoptosis after exposure of MCF-7 cells to CNPs (Figure 8). The G0/G1 phase cell percentages in NC, PC, CNPs, EPI@NPs and Cur@NPs were 68.7%, 55.9%, 75.9%, 82.1% and 79.8%, respectively. The corresponding S phase cell percentages were 14.8%, 7.9%, 4.95%, 6.01% and 7.82%, respectively. The corresponding G2/M phase cell percentages were 4.73%, 5.41%, 9.2%, 11.94% and 14.82%, respectively. The total apoptotic rate in the corresponding groups was 3.7%, 75.2%, 62.1%, 46.3% and 19.7%, respectively. It can be seen that the CNPs group had the lowest proportion of S phase and G2/M phase cells among all NPs, and the apoptotic rate in the CNPs group was the highest, suggesting that CNPs can exert an inhibitory effect by inducing S phase and G2/M phase cell apoptosis.
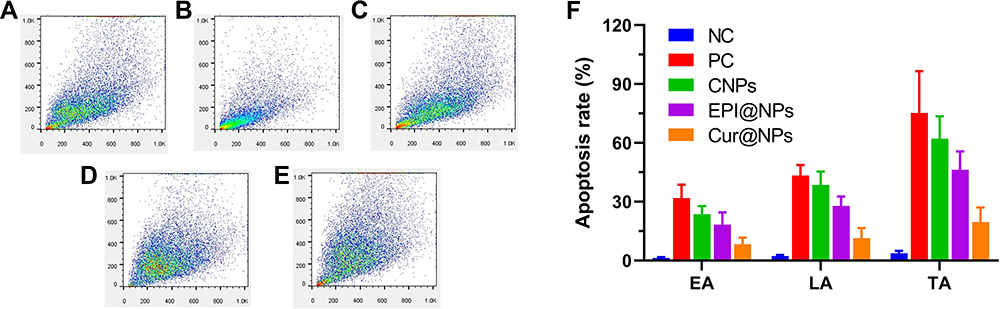 |
Figure 8 The effects of (A) NC, (B) PC, (C) CNPs, (D) EPI@NPs and (E) Cur@NPs on cell cycle in MCF-7 cells. (F) The effects of different NPs on MCF-7 cell apoptosis. |
In vivo Biodistribution
After CNPs were injected into tumor-bearing mice via the tail vein, the drug distribution in organs and tissues was evaluated as %ID/g at 3, 6 and 12 h (Figure 9). At 3 h after administration, the %ID/g values in kidney, heart, lung, liver, spleen, tumor, blood and small intestine were 1.67%, 2.06%, 1.76%, 0.71%, 1.09%, 0.79%, 3.48% and 0.34%, respectively. At 6 h after administration, the %ID/g values in the corresponding organs were 1.94%, 2.56%, 2.44%, 0.84%, 1.54%, 2.08%, 2.79% and 0.58%, respectively. After 12 h after administration, the %ID/g values in the corresponding organs were 0.89%, 1.71%, 1.21%, 0.32%, 1.36% and 1.76%, respectively. It can be seen from 3 h to 6 h after administration, the %ID/g value in tumor increased from 0.79% to 2.08%, and the value was 1.76% at 12 h after administration, which showed that maximum aggregation of NPs in tumor was observed at 6 h after administration. From 3 h to 6 h after administration, the %ID/g values in the phagocytic systems, such as liver, spleen and kidney, were increased, which was related to the phagocytosis of the phagocytic system; from 6 h to 12 h after administration, the %ID/g showed a decreasing trend, which was related to the metabolism of NPs. From 3 h to 6 h after administration, the %ID/g value in the small intestine showed an increasing trend, which may be because liver is a pathway of NP metabolism. In the biodistribution study, the %ID/g value in the blood showed a decreasing trend; but at 12 h after administration, there were high concentrations of NPs in the blood, which indicated that CNPs had long circulation ability.
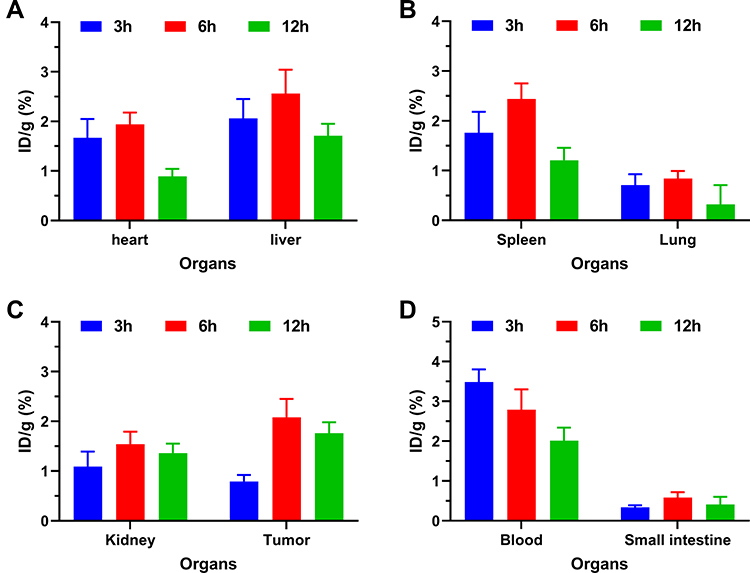 |
Figure 9 The in vivo biodistribution of CNPs in (A) heart and liver; (B) spleen and lung; (C) kidney and tumor; (D) blood and small intestine at 3, 6 and 12 hours after tail vein injection into tumor-bearing mice. |
In vivo Antitumor Activity Study
Fifteen days after different NPs were injected via the tail vein, tumor volumes in the PBS group, CNPs group, CNPs without cRGD group, EPI@NPs and Cur@NPs were 285.6 mm3, 108.9 mm3, 152.5 mm3, 198.9 mm3 and 238.9 mm3, respectively (Figure 10). Among all study groups, the PBS group showed the highest growth rate. Comparison of the PBS group with the EPI@NPs group had P < 0.05. Comparison of the EPI@NPs with the CNPs without cRGD group had P < 0.05. These findings suggested that the synergistic antitumor effect of Cur was stronger than that of cRGD. Comparison of the CNPs group with the CNPs without cRGD group had P < 0.05. It indicates that cRGD had a clear targeting ability. During the whole treatment process, the weight of mice was not significantly changed, suggesting that CNPs had no obvious toxic effects and side effects on organisms during the treatment. Pathological staining of spleen, lung, heart, kidney, liver and other internal tissues showed that the cells in each treatment group were similar to those in the negative control, with no obvious cell apoptosis and necrosis and no obvious nucleus pyknosis and fragmentation (Figure 11).
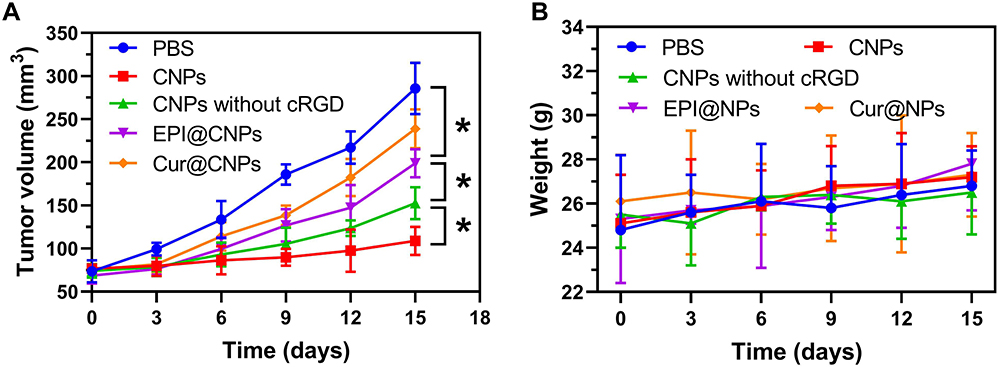 |
Figure 10 (A) Volume change of xenograft tumor in tumor-bearing mice treated with different NPs. (B) Weight change in mice from different treatment groups. * P < 0.05. |
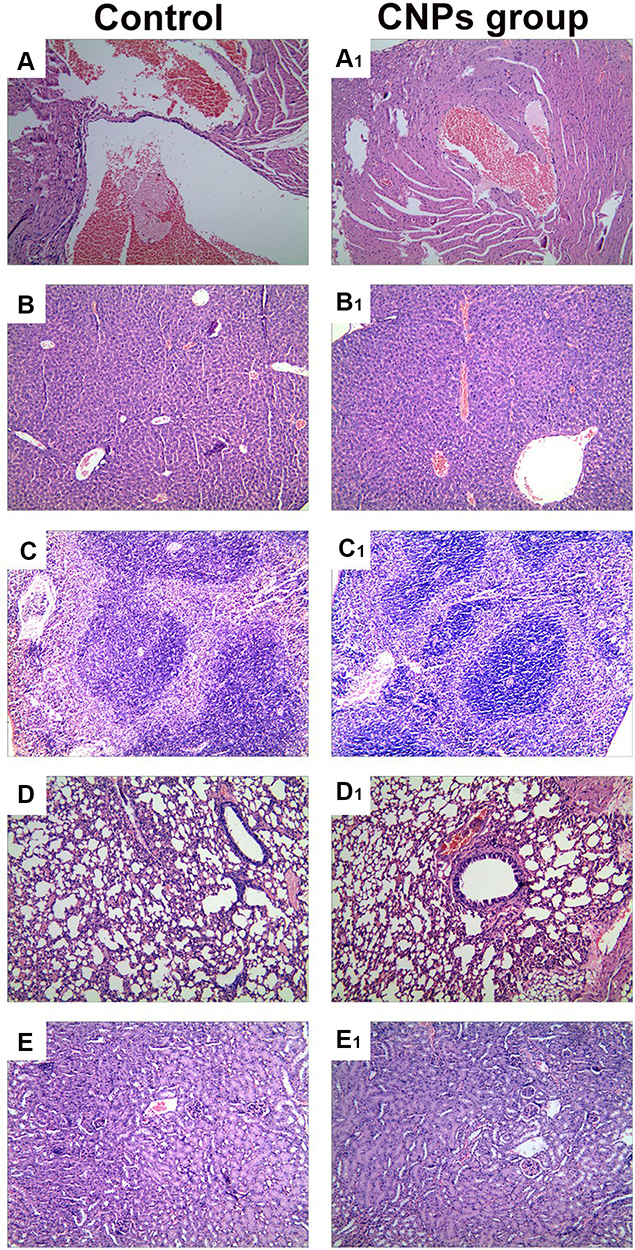 |
Figure 11 H&E staining of heart (A and A1), kidney (B and B1), spleen (C and C1), lung (D and D1) and liver (E and E1) from mice receiving CNPs group and control. |
Conclusions
In the present study, CNPs were successfully prepared; they had a relatively small and uniform particle size, and stable physical and chemical properties. CNPs can increase the Cur solubility, and β-CD block the drugs in mesoporous silicon channels and graft cRGD as targeting groups recognized by academia. And combined with EPR effect, we can achieve better tumor targeting. Moreover, CNP carriers demonstrated a low hemolysis rate and ideal cell compatibility, and they did not cause any obvious irritative damage to the intact skin. CNPs played an anti-cancer role by inducing apoptosis of S phase and G2/M phase cells. In vitro and in vivo experiments also showed that CNPs had good tumor-targeting ability and anti-tumor activity. In conclusion, CNPs have an ideal biosafety and therapeutic effect for recurrent BC.
Data Sharing Statement
All data can be obtained from correspondence author Jiuzhou Liu, when needed.
Acknowledgments
The authors gratefully acknowledge the financial support from the Natural Science Research Project of Anhui Educational Committee (No. KJ2019A0313), the Natural Science Foundation of Shandong Province (No. ZR2017QH005) and the National Natural Science Foundation of China (No. 81803097).
Disclosure
The authors declare no conflicts of interest. The authors are responsible for the content of this article.
References
1. DeSantis CE, Ma J, Gaudet MM, et al. Breast cancer statistics, 2019. CA Cancer J Clin. 2019;69(6):438–451. doi:10.3322/caac.21583
2. Siegel RL, Miller KD, Jemal A. Cancer statistics, 2020. CA Cancer J Clin. 2020;70(1):7–30. doi:10.3322/caac.21590
3. He Z, Zhang X, Zhang H, et al. Nano-delivery vehicle based on chlorin e6, photodynamic therapy, doxorubicin chemotherapy provides targeted treatment of HER-2, negative, ανβ3-positive Breast Cancer. Pharmacol Res. 2020;160:105184. doi:10.1016/j.phrs.2020.105184
4. Miller KD, Nogueira L, Mariotto AB, et al. Cancer treatment and survivorship statistics, 2019. CA Cancer J Clin. 2019;69(5):363–385. doi:10.3322/caac.21565
5. Siegel RL, Miller KD, Jemal A. Cancer statistics, 2019. CA Cancer J Clin. 2019;69(1):7–34. doi:10.3322/caac.21551
6. Yang Y, Tian Z, Guo R, Ren F. Nrf 2 inhibitor, brusatol in combination with trastuzumab exerts synergistic antitumor activity in HER2-positive cancers by inhibiting Nrf2/HO-1 and HER2-AKT/ERK1/2 pathways. Oxid Med Cell Longev. 2020;9867595. doi:10.1155/2020/9867595
7. Hung YC, Wang PW, Lin TY, Yang PM, You JS, Pan TL. Functional Redox Proteomics Reveal That Salvia miltiorrhiza Aqueous Extract Alleviates Adriamycin-Induced Cardiomyopathy via Inhibiting ROS-Dependent Apoptosis. Oxid Med Cell Longev. 2020;2020:5136934. doi:10.1155/2020/5136934
8. Ashrafizadeh M, Zarrabi A, Hushmandi K, et al. Progress in natural compounds/siRNA co-delivery employing nanovehicles for cancer therapy. ACS Comb Sci. 2020;22(12):669–700. doi:10.1021/acscombsci.0c00099
9. Ashrafizadeh M, Ahmadi Z, Mohammadinejad R, Farkhondeh T, Samarghandian S. Nano-soldiers ameliorate silibinin delivery: a Review Study. Curr Drug Deliv. 2020;17(1):15–22. doi:10.2174/1567201816666191112113031
10. Zhang X, He Z, Xiang L, et al. Codelivery of GRP78 siRNA and docetaxel via RGD-PEG-DSPE/DOPA/CaP nanoparticles for the treatment of castration-resistant prostate cancer. Drug Des Dev Ther. 2019;13:1357–1372. doi:10.2147/dddt.S198400
11. Norouzi M. Gold nanoparticles in glioma theranostics. Pharmacol Res. 2020;156:104753. doi:10.1016/j.phrs.2020.104753
12. Ashrafizadeh M, Hushmandi K, Rahmani Moghadam E, et al. Progress in delivery of siRNA-based therapeutics employing nano-vehicles for treatment of prostate cancer. Bioengineering (Basel). 2020;7(3). doi:10.3390/bioengineering7030091
13. Pinheiro WO, Fascineli ML, Ramos KLV, et al. Synergistic antitumor efficacy of magnetohyperthermia and poly(lactic-co-glycolic acid)-encapsulated selol in ehrlich breast adenocarcinoma treatment in elderly swiss mice. J Biomed Nanotechnol. 2020;16(2):179–192. doi:10.1166/jbn.2020.2890
14. Mohammadinejad R, Dehshahri A, Sagar Madamsetty V, et al. In vivo gene delivery mediated by non-viral vectors for cancer therapy. J Control Release. 2020;325:249–275. doi:10.1016/j.jconrel.2020.06.038
15. Liu J, Guo N, Gao C, et al. Effective gene silencing mediated by polypeptide nanoparticles LAH4-L1-siMDR1 in multi-drug resistant human breast cancer. J Biomed Nanotechnol. 2019;15(3):531–543. doi:10.1166/jbn.2019.2705
16. Faisal S, Shah SA, Shah S, et al. In vitro biomedical and photo-catalytic application of bio-inspired zingiber officinale mediated silver nanoparticles. J Biomed Nanotechnol. 2020;16(4):492–504. doi:10.1166/jbn.2020.2918
17. Mosiniewicz-Szablewska E, Tedesco AC, Suchocki P, Morais PC. Magnetic studies of polylactic-co-glicolic acid nanocapsules loaded with selol and γ-Fe(2)O(3) nanoparticles. Phys Chem Chem Phys. 2020;22(37):21042–21058. doi:10.1039/d0cp02706e
18. Madzharova F, Heiner Z, Kneipp J. Surface-enhanced hyper raman spectra of aromatic thiols on gold and silver nanoparticles. J Phys Chem C Nanomater Interfaces. 2020;124(11):6233–6241. doi:10.1021/acs.jpcc.0c00294
19. Boakye-Ansah S, Khan MA, Haase MF. Controlling surfactant adsorption on highly charged nanoparticles to stabilize bijels. J Phys Chem C Nanomater Interfaces. 2020;124(23):12417–12423. doi:10.1021/acs.jpcc.0c01440
20. Chen Z, Zhang Q, Zeng L, et al. Light-triggered OVA release based on CuS@poly(lactide-co-glycolide acid) nanoparticles for synergistic photothermal-immunotherapy of tumor. Pharmacol Res. 2020;158:104902. doi:10.1016/j.phrs.2020.104902
21. Huang JH, Sun DD, Lu RX, Zhang H, Khan RAA. Simulation on diffusivity and statistical size of polymer chains in polymer nanocomposites. Phys Chem Chem Phys. 2020;22(38):21919–21927. doi:10.1039/d0cp04390g
22. Jiménez-López J, El-Hammadi MM, Ortiz R, et al. A novel nanoformulation of PLGA with high non-ionic surfactant content improves in vitro and in vivo PTX activity against lung cancer. Pharmacol Res. 2019;141:451–465. doi:10.1016/j.phrs.2019.01.013
23. He Z, Wang Q, Sun Y, et al. The biocompatibility evaluation of mPEG-PLGA-PLL copolymer and different LA/GA ratio effects for biocompatibility. J Biomater Sci Polym Ed. 2014;25(9):943–964. doi:10.1080/09205063.2014.914705
24. He Z, Shi Z, Sun W, et al. Hemocompatibility of folic-acid-conjugated amphiphilic PEG-PLGA copolymer nanoparticles for co-delivery of cisplatin and paclitaxel: treatment effects for non-small-cell lung cancer. Tumour Biol. 2016;37(6):7809–7821. doi:10.1007/s13277-015-4634-1
25. Yuan P, Hu X, Zhou Q. The nanomaterial-induced bystander effects reprogrammed macrophage immune function and metabolic profile. Nanotoxicology. 2020;1–19. doi:10.1080/17435390.2020.1817598
26. Jamir K, Ganguly R, Seshagirirao K. ZCPG, a cysteine protease from Zingiber montanum rhizome exhibits enhanced anti-inflammatory and acetylcholinesterase inhibition potential. Int J Biol Macromol. 2020;163:2429–2438. doi:10.1016/j.ijbiomac.2020.09.097
27. He Z, Sun Y, Wang Q, et al. Degradation and bio-safety evaluation of mPEG-PLGA-PLL copolymer-prepared nanoparticles. J Phys Chem C. 2015;119(6):150203133733009. doi:10.1021/jp510183s
28. Moskvin M, Marková I, Malínská H, et al. Cerium oxide-decorated γ-Fe(2)O(3) nanoparticles: design, synthesis and in vivo effects on parameters of oxidative stress. Front Chem. 2020;8:682. doi:10.3389/fchem.2020.00682
29. Cefali LC, Ataide JA, Fernandes AR, et al. Flavonoid-enriched plant-extract-loaded emulsion: a novel phytocosmetic sunscreen formulation with antioxidant properties. Antioxidants (Basel). 2019;8(10):443. doi:10.3390/antiox8100443
30. Gupta S, Wairkar S, Bhatt LK. Isotretinoin and α-tocopherol acetate-loaded solid lipid nanoparticle topical gel for the treatment of acne. J Microencapsul. 2020;1–9. doi:10.1080/02652048.2020.1823499
31. Song S, Jin X, Zhang L, et al. PEGylated and CD47-conjugated nanoellipsoidal artificial antigen-presenting cells minimize phagocytosis and augment anti-tumor T-cell responses. Int J Nanomedicine. 2019;14:2465–2483. doi:10.2147/ijn.S195828
32. Busipalli DL, Lin KY, Nachimuthu S, Jiang JC. Enhanced moisture stability of cesium lead iodide perovskite solar cells – a first-principles molecular dynamics study. Phys Chem Chem Phys. 2020;22(10):5693–5701. doi:10.1039/C9CP06341B
33. Su G, Sun G, Liu H, Shu L, Zhang W, Liang Z. Prokineticin 2 relieves hypoxia/reoxygenation-induced injury through activation of Akt/mTOR pathway in H9c2 cardiomyocytes. Artif Cells, Nanomed Biotechnol. 2020;48(1):345–352. doi:10.1080/21691401.2019.1709850
34. Liao S, Zhang Y, Pan X, et al. Antibacterial activity and mechanism of silver nanoparticles against multidrug-resistant Pseudomonas aeruginosa. Int J Nanomedicine. 2019;14:1469–1487. doi:10.2147/ijn.S191340
35. Buhl ASK, Christensen TD, Christensen IJ, et al. Predicting efficacy of epirubicin by a multigene assay in advanced breast cancer within a Danish Breast Cancer Cooperative Group (DBCG) cohort: a retrospective-prospective blinded study. Breast Cancer Res Treat. 2018;172(2):391–400. doi:10.1007/s10549-018-4918-4
 © 2021 The Author(s). This work is published and licensed by Dove Medical Press Limited. The
full terms of this license are available at https://www.dovepress.com/terms
and incorporate the Creative Commons Attribution
- Non Commercial (unported, 3.0) License.
By accessing the work you hereby accept the Terms. Non-commercial uses of the work are permitted
without any further permission from Dove Medical Press Limited, provided the work is properly
attributed. For permission for commercial use of this work, please see paragraphs 4.2 and 5 of our Terms.
© 2021 The Author(s). This work is published and licensed by Dove Medical Press Limited. The
full terms of this license are available at https://www.dovepress.com/terms
and incorporate the Creative Commons Attribution
- Non Commercial (unported, 3.0) License.
By accessing the work you hereby accept the Terms. Non-commercial uses of the work are permitted
without any further permission from Dove Medical Press Limited, provided the work is properly
attributed. For permission for commercial use of this work, please see paragraphs 4.2 and 5 of our Terms.