Back to Journals » Journal of Inflammation Research » Volume 17
Predictive Value of a Diagnostic Five-Gene Biomarker for Pediatric Sepsis
Received 18 January 2024
Accepted for publication 26 March 2024
Published 4 April 2024 Volume 2024:17 Pages 2063—2071
DOI https://doi.org/10.2147/JIR.S447588
Checked for plagiarism Yes
Review by Single anonymous peer review
Peer reviewer comments 2
Editor who approved publication: Professor Ning Quan
Yulong Xiao,1 Genhao Zhang2
1Department of Medical Laboratory, The Fifth Affiliated Hospital of Zhengzhou University, Zhengzhou, Henan, People’s Republic of China; 2Department of Blood Transfusion, The First Affiliated Hospital of Zhengzhou University, Zhengzhou, Henan, People’s Republic of China
Correspondence: Genhao Zhang, Email [email protected]
Background: Pediatric sepsis has a very high morbidity and mortality rate. The purpose of this study was to evaluate diagnostic biomarkers and immune cell infiltration in pediatric sepsis.
Methods: Three datasets (GSE13904, GSE26378, and GSE26440) were downloaded from the gene expression omnibus (GEO) database. After identifying overlapping genes in differentially expressed genes (DEGs) and modular sepsis genes selected via a weighted gene co-expression network (WGCNA) in the GSE26378 dataset, pivotal genes were further identified by using LASSO regression and random forest analysis to construct a diagnostic model. Receiver operating characteristic curve (ROC) analysis was used to validate the efficacy of the diagnostic model for pediatric sepsis. Furthermore, we used qRT-PCR to detect the expression levels of pivotal genes and validate the diagnostic model’s ability to diagnose pediatric sepsis in 65 actual clinical samples.
Results: Among 294 overlapping genes of DEGs and modular sepsis genes, five pivotal genes (STOM, MS4A4A, CD177, MMP8, and MCEMP1) were screened to construct a diagnostic model of pediatric sepsis. The expression of the five pivotal genes was higher in the sepsis group than in the normal group. The diagnostic model showed good diagnostic ability with AUCs of 1, 0.986, and 0.968. More importantly, the diagnostic model showed good diagnostic ability with AUCs of 0.937 in the 65 clinical samples and showed better efficacy compared to conventional inflammatory indicators such as procalcitonin (PCT), white blood cell (WBC) count, C-reactive protein (CRP), and neutrophil percentage (NEU%).
Conclusion: We developed and tested a five-gene diagnostic model that can reliably identify pediatric sepsis and also suggest prospective candidate genes for peripheral blood diagnostic testing in pediatric sepsis patients.
Keywords: pediatric sepsis, diagnostic model, ROC curves, WGCNA
Introduction
Pediatric sepsis is a systemic inflammatory disease in children caused by pathogenic infections that result in defense disorders, with high morbidity and mortality, often accompanied by multiple organ dysfunction in severe cases.1–4 Following current guidelines for the treatment of sepsis, early detection of sepsis and prompt administration of antibiotics are key principles to improve outcomes.5 Because the specificity of abnormal vital signs such as fever, tachycardia, and shortness of breath in early pediatric sepsis is not significant, however, clinicians are unable to apply early and timely antibiotic therapy to reduce adverse outcomes.6 Therefore, finding highly sensitive biomarkers that can accurately detect pediatric sepsis is critical for clinical teams to treat and manage children with pediatric sepsis.7
In the present work, by combining numerous high-throughput sequencing data on pediatric sepsis and correlating immune cell infiltration, we created a diagnostic model that can precisely screen for pediatric sepsis. The validity of this diagnostic model was subsequently confirmed in a cohort of peripheral blood samples from 30 healthy individuals and 35 children with sepsis. It is envisaged that the diagnostic model would provide professionals with fresh perspectives on the diagnosis and therapy of pediatric sepsis.
Materials and Methods
Public Pediatric Sepsis Cohorts Downloading and Differentially Expressed Genes (DEGs) Obtainment
Whole blood gene expression profiles of pediatric sepsis and normal controls in three datasets (GSE13904, GSE26378, and GSE26440) based on the GPL570 platform, were downloaded from the gene expression omnibus (GEO) database (http://www.ncbi.nlm.nih.gov/geo/). Each dataset was normalized using the normalizeBetweenArrays function of the R “Limma” package. The batch effects between the three datasets were corrected using the Combat function from the “SVA” R package. In the subsequent analysis, GSE26378 (21 Normal vs 82 Pediatric sepsis) was performed as the training set, while GSE26440 (32 Normal vs 98 Pediatric sepsis) and GSE13904 (18 Normal vs 106 Pediatric sepsis) served as the validation sets. Using adjusted P-values less than 0.05 and |logFC| > 1 as criteria, DEGs were subsequently found in the GSE26378 dataset between the pediatric sepsis and healthy samples. Finally, signaling pathways where DEGs were enriched were found using gene set enrichment analysis (GSEA).8
Identification of Key Genes in Pediatric Sepsis by the Weighted Gene Co-Expression Network Analysis (WGCNA)
The WGCNA-related expression matrix was created using 103 samples and 16,799 genes from the GSE26378 dataset.9 To build gene networks, determine co-expression similarity and adjacency, and translate them into topological overlap matrices (TOM), a soft threshold power at R2=0.8 was used. The modules were grouped using a hierarchical clustering technique based on TOM. Finally, modules with a strong connection to pediatric sepsis were found. The correlation between genes and pediatric sepsis is known as genetic significance (GS), and the correlation between module eigengene and gene expression profile is known as module membership (MM). Key genes were found in modules with high GS and MM in the intra-module analysis.
Diagnostic Markers Construction by the Least Absolute Shrink and Selection Operator (LASSO) Regression and Random Forests (RF) Algorithms
Overlapping genes of DEGs and key genes in pediatric sepsis were used for further analysis in the GSE26378 dataset. A LASSO regression analysis using the R package “glmnet” was first performed to select the optimization parameters by 10-fold cross-validation. A random forest analysis was then performed using the R “randomForest” package to filter the optimal parameters. Furthermore, the overlapping genes in the two classification models were chosen for logistic regression analysis to construct a diagnostic model for pediatric sepsis. Finally, the receiver operating characteristic curve (ROC) analysis in both the training and testing sets was used to assess the validity of the diagnostic model, and the area under the curve (AUC) was generated to assess the algorithm’s prediction capability.
Clinical Specimens and Quantitative Real-Time PCR (qRT-PCR) Analysis
Thirty-five pediatric sepsis cases meeting diagnostic criteria for sepsis10 and 30 normal children between January 1, 2023, and May 30, 2023, were included in this study. All pediatric sepsis samples were confirmed by blood culture results. The basic clinical characteristics of the samples in both groups are shown in Table 1. The sepsis group had higher levels of procalcitonin (PCT) and neutrophil percentage (NEU%) compared to the normal group, while there were no significant differences in age, gender, white blood cell (WBC), and C-reactive protein (CRP) level. Three milliliters of whole blood was collected from each child during fasting, followed by isolation of peripheral blood mononuclear cells (PBMCs) using Ficoll-Paque isolate. After total RNA was extracted from PBMCs, mRNA levels of diagnostic markers were detected by qRT-PCR and normalized using β-ACTIN.11 The primer sequences are shown in Table 2.
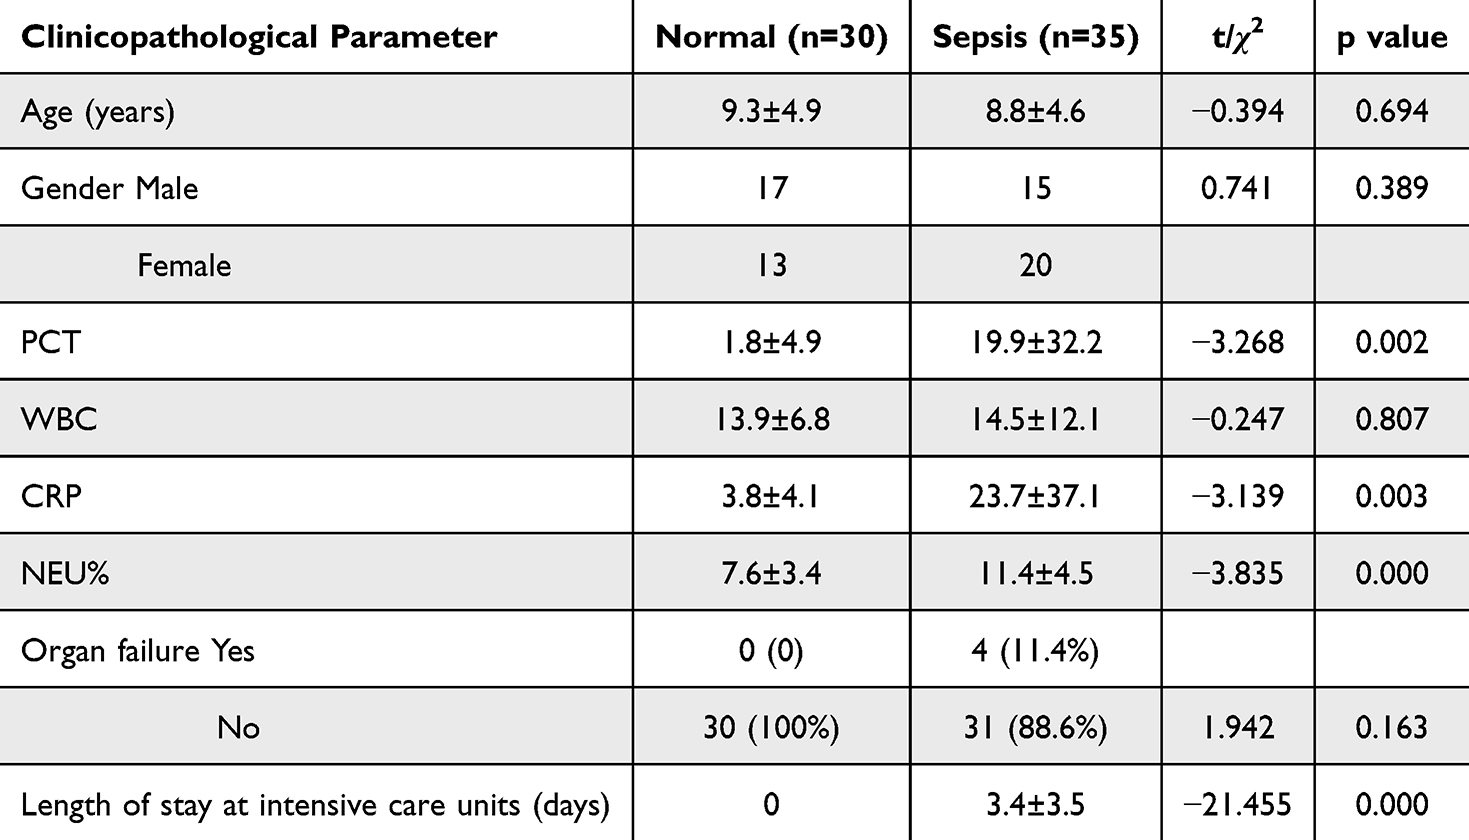 |
Table 1 Clinical Pathological Features |
 |
Table 2 The Sequences of the qRT-PCR Primers |
Statistical Analysis
Categorical data were compared as necessary using the Fisher exact test or the chi-square test, and quantitative variables were examined using the independent samples t-test. All p-values were two-tailed and judged statistically significant at P<0.05.
Results
Identification of DEGs in the GSE26378 Cohort
The flow chart of this study is shown in Figure 1. A total of 739 DEGs were identified in the GSE26378 dataset, including 468 upregulated DEGs and 271 downregulated DEGs (Figure 2A). The heatmap of the top 20 genes with the greatest degree of variation is shown in Figure 2B. GSEA analysis findings revealed that these DEGs were primarily linked to immune-related pathways, including infection and T-cell activation (Figure 2C).
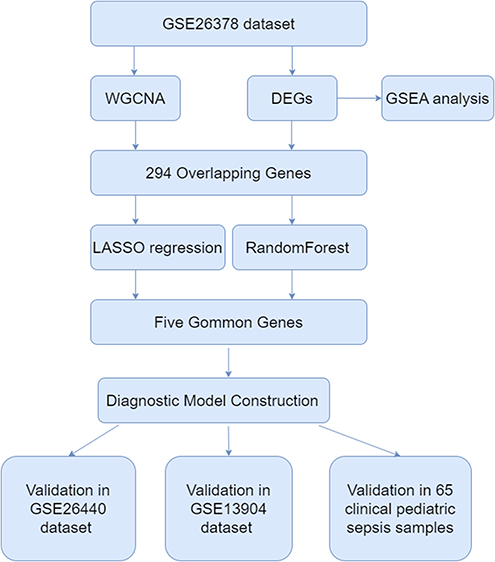 |
Figure 1 The complete flow chart of this study. |
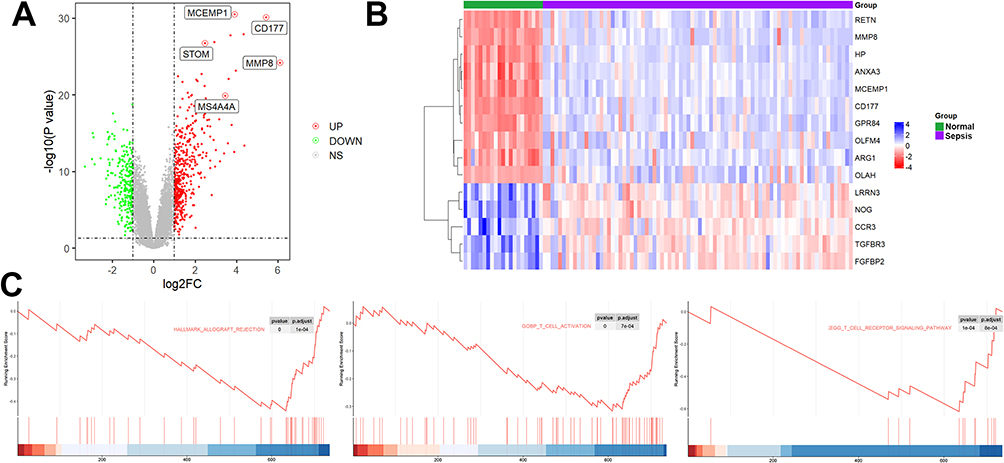 |
Figure 2 Identification of DEGs in the GSE26378 cohort. (A) A total of 739 DEGs were identified in the GSE26378 dataset, including 468 upregulated DEGs and 271 downregulated DEGs. (B) The heatmap of the top 20 genes with the greatest degree of variation. (C) GSEA analysis. |
Identification of Key Genes in Pediatric Sepsis by the WGCNA
To create a scale-free network with biological importance, we choose 9 as a soft threshold (Figure 3A). By using dynamic branching cut techniques and hierarchical clustering analysis of gene dendrograms, genes were divided into 26 non-gray modules (Figure 3B). Salmon and black modules were chosen for additional research because they were strongly linked with pediatric sepsis (Figure 3C). The importance and module membership of 588 genes were strongly related to pediatric sepsis (Figure 3D). The results of GSEA in the Metascape12 database revealed that these genes were mainly enriched in neutrophil dysregulation and lymphocyte-associated immune regulatory pathways (Figure 3E).
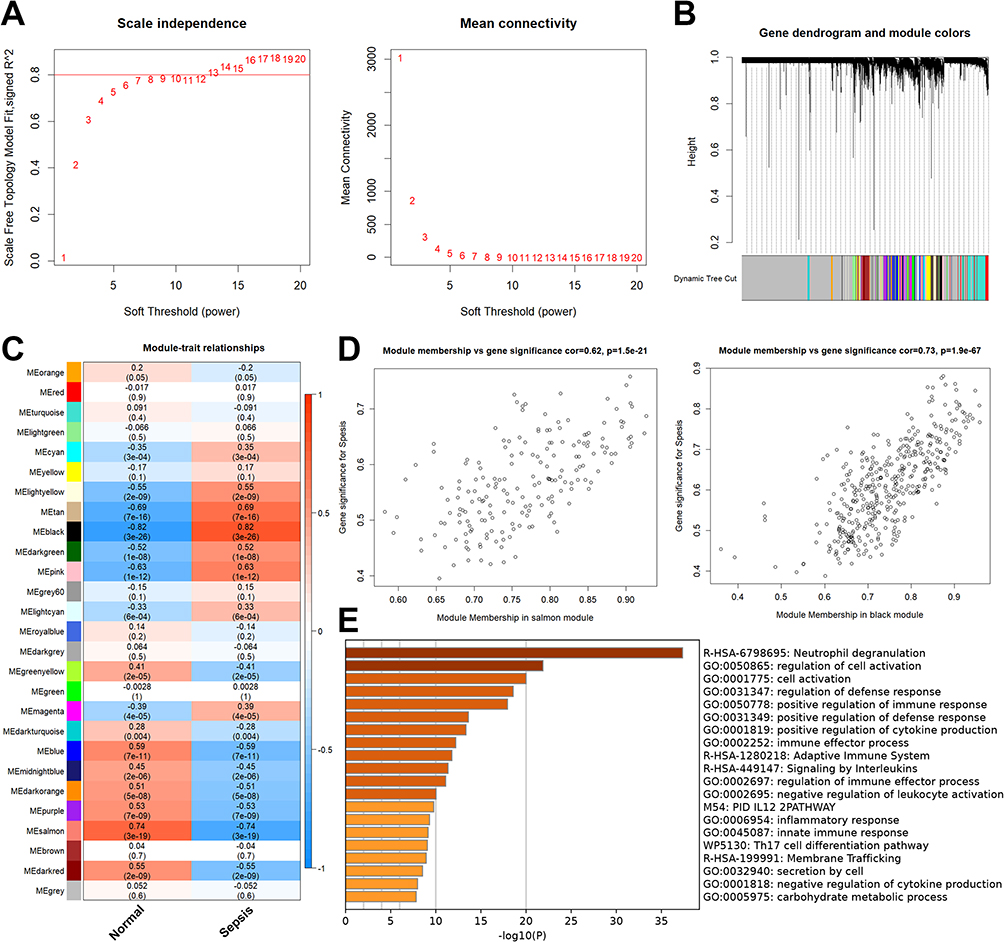 |
Figure 3 Identification of key genes in pediatric sepsis by the WGCNA. (A) To create a scale-free network with biological importance, we choose 9 as a soft threshold. (B) By using dynamic branching cut techniques and hierarchical clustering analysis of gene dendrograms, genes were divided into 26 non-gray modules. (C) Green and brown modules were chosen for additional research because they were strongly linked with pediatric sepsis. (D) The importance and module membership of 588 genes were strongly related to pediatric sepsis. (E) The results of GSEA in the Metascape database. |
Diagnostic Markers Construction in Pediatric Sepsis
294 overlapping genes of DEGs and key genes in pediatric sepsis were used for further analysis (Figure 4A). Based on the results of the LASSO regression analysis, the 10 best parameters were screened (Figure 4B). Based on the results of random forest analysis, 35 optimal parameters were screened (Figure 4C). Among them, five genes that overlapped between the two were used to construct a diagnostic model for pediatric sepsis (Figure 4D). The coefficients of each of the five genes in the diagnostic model are shown in Figure 3E.  . We then perform ROC analysis on the training and validation cohorts to assess the effectiveness of the diagnostic model. As shown in Figure 5A, the expression of all five genes involved in the diagnostic model was higher in the sepsis group than in the normal group in all three cohorts. The same is true for the diagnostic model scores (Figure 5B). More importantly, the diagnostic model showed good diagnostic ability with AUCs of 1 in the GSE26378 cohort, 0.986 in the GSE26440 cohort, and 0.968 in the GSE13904 cohort, respectively (Figure 5C).
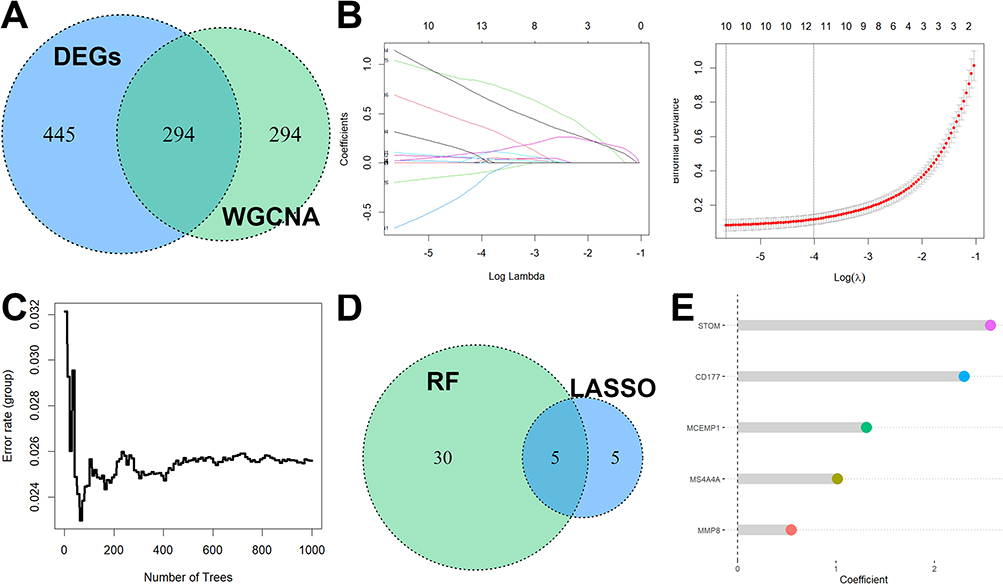 |
Figure 4 Diagnostic markers construction in pediatric sepsis. (A) 294 overlapping genes of DEGs and key genes in pediatric sepsis were used for further analysis. (B) Based on the results of the LASSO regression analysis, the 10 best parameters were screened. (C) Based on the results of random forest analysis, 35 optimal parameters were screened. (D) Among them, five genes that overlapped between the two were used to construct a diagnostic model for pediatric sepsis. (E) The coefficients of each of the five genes in the diagnostic model. |
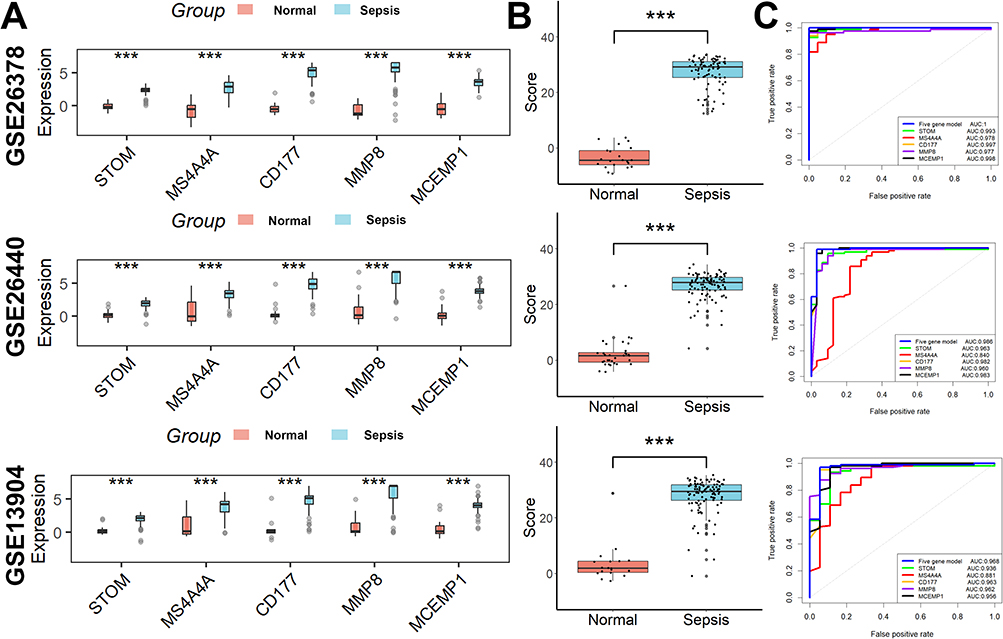 |
Figure 5 The effectiveness of the diagnostic model in the training and validation cohorts. (A) The expression of all five genes involved in the diagnostic model was higher in the sepsis group than in the normal group in all three cohorts. (B) The same is true for the diagnostic model scores. (C) The diagnostic model showed good diagnostic ability. ***p < 0.001. |
Performance Analysis of the Diagnostic Markers in a Clinical Cohort
The types of bacteria infecting children with sepsis are shown in Figure 6A. Consistent with the results of the above bioinformatics analysis, the expression of all five genes involved in the diagnostic model was higher in the sepsis group than in the normal group (Figure 6B), as well as the diagnostic model scores (Figure 6C). The diagnostic model showed good diagnostic ability with AUCs of 0.937 in the 65 clinical samples (Figure 6D). Moreover, the diagnostic model showed better efficacy compared to conventional inflammatory indicators such as PCT, CRP, WBC, and NEU% (Figure 6E, Table 3). Finally, we also evaluated the value of this diagnostic model in distinguishing bacterial from non-bacterial sepsis and found it to be moderately competent (Figure 6F).
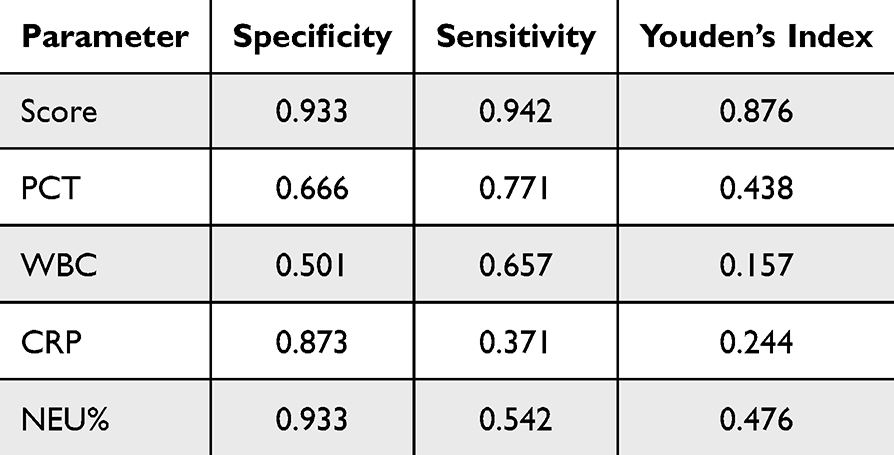 |
Table 3 Diagnostic Efficacy of the Diagnostic Model and Routine Biomarkers for Pediatric Sepsis |
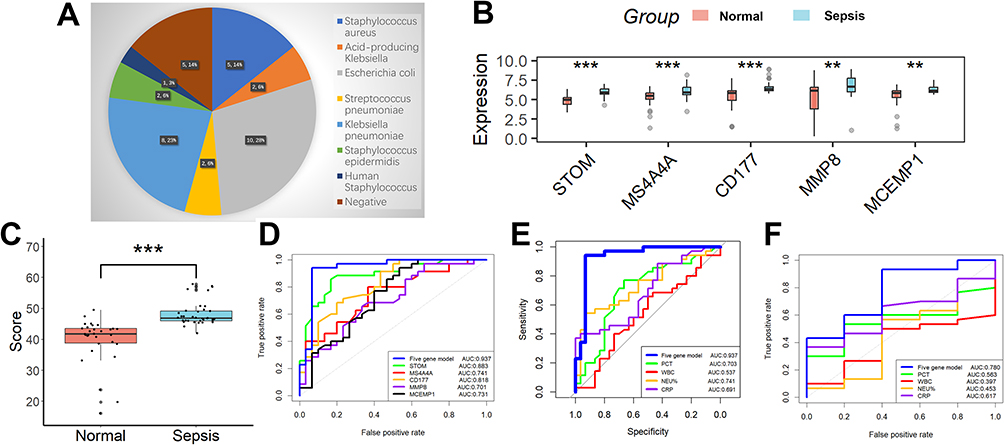 |
Figure 6 Performance analysis of the diagnostic markers in a clinical cohort. (A) The types of bacteria infecting children with sepsis. (B) The expression of all five genes involved in the diagnostic model was higher in the sepsis group than in the normal group. (C) The same is true for the diagnostic model scores. (D) The diagnostic model showed good diagnostic ability with AUCs of 0.937 in the 65 clinical samples. (E) The diagnostic model showed better efficacy compared to conventional inflammatory indicators such as PCT, CRP, WBC, and NEU%. (F) We also evaluated the value of this diagnostic model in distinguishing bacterial from non-bacterial sepsis and found it to be moderately competent. **p <0.01; ***p < 0.001. |
Discussion
Assessing fever due to bacterial infectious fever and fever due to non-bacterial infectious systemic inflammation is a common challenge for pediatricians, especially in the early stages of pediatric sepsis, as it will influence clinicians’ judgment on antibiotic use. Some of the currently widely used biomarkers, such as PCT and CRP, present several challenges in both outpatient and inpatient settings due to their low specificity and sensitivity.13 The five-gene diagnostic model developed in our current work has a lot of potential for overcoming these clinical difficulties. This diagnostic methodology is superior to traditional biomarker diagnostics and more accurate at capturing the nuanced human immune system.
Big data combined with machine learning and artificial intelligence holds the promise of better sepsis identification tools that will aid in the decision-making process for children who have sepsis and pave the way for precision-based therapies.10 With the use of machine learning to identify critical genes and a thorough examination of high-throughput sequencing data from several pediatric sepsis cases, we were able to effectively build a diagnostic model in the current study that can successfully screen for pediatric sepsis. Both in the cohort of clinical peripheral blood samples we gathered and in public datasets about pediatric sepsis, the diagnostic model successfully distinguishes between normal and pediatric sepsis. We also looked at the connection between this diagnostic model and immune cell infiltration and discovered that the two were closely related. This is because cellular immune regulation involving immune cells plays a significant role in the development of pediatric sepsis. These could provide us with a clearer understanding of the molecular immunological processes that lead to the onset of pediatric sepsis.
There is an undeniable similarity between our study and the earlier ones14–17 in that both used various high-throughput sequencing data from pediatric sepsis, both used machine learning to find diagnostic genes and finally screened for two common genes (CD177 and MMP8) that can accurately diagnose pediatric sepsis. However, our study still has several strengths. Firstly, our created diagnostic model has improved diagnostic effectiveness. Secondly, our created diagnostic model was demonstrated in the gathered clinical samples in addition to being validated in the three public datasets. Finally, the diagnostic model we developed was successful in separating pediatric sepsis caused by bacteria from pediatric sepsis caused by non-bacteria.
Our study has several drawbacks. First, none of the three pediatric sepsis datasets that were made publicly accessible included mortality data that could be used to assess the predictive value of the model we developed. Second, our study lacked non-sepsis infection samples. A more meaningful clinical value would be achieved by analysing our model in non-sepsis infection samples compared to sepsis samples. Third, the presence of co-morbid conditions in the pediatric sepsis patients included in our research might affect how well our model predicts outcomes. Finally, even though the model we developed did well in the 65 clinical samples we gathered, the sample size was too little and it was a single-center research, therefore more multicenter studies with sizable sample sizes are required to further confirm the diagnostic performance of the model.
Conclusions
We have identified a neutrophil-associated five-gene diagnostic model that can reliably identify pediatric sepsis, which can suggest prospective candidate genes for peripheral blood diagnostic testing in pediatric sepsis patients and provide new insights for optimizing immunomodulatory therapy in pediatric sepsis patients.
Abbreviation
WGCNA, weighted gene co-expression network; GEO, gene expression omnibus; ROC, Receiver operating characteristic curve; DEGs, differentially expressed genes; GSEA, gene set enrichment analysis; TOM, topological overlap matrices; GS, genetic significance; MM, module membership; LASSO, Least absolute shrink and selection operator; RF, random forests; AUC, area under the curve; qRT-PCR, quantitative real-time PCR; PCT, procalcitonin; NEU%, neutrophil percentage; WBC, white blood cell; CRP, C-reactive protein; PBMCs, peripheral blood mononuclear cells.
Data Sharing Statement
The datasets used and/or analyzed during the current study are available from the corresponding author upon reasonable request.
Ethics Approval and Consent to Participate
This study was supported by the Ethics Committees of The First Affiliated Hospital of Zhengzhou University (2023-KY-0932-002). Written informed consent was obtained from parents or legal guardians of all patients and healthy controls. All methods were performed following the relevant guidelines and regulations. The manuscript is consistent with the Declaration of Helsinki.
Funding
This study was supported by the Henan Provincial Health and Health Commission Joint Construction Project (LHGJ20230209).
Disclosure
All authors declare no conflict of interest.
References
1. Evans L, Rhodes A, Alhazzani W, et al. Executive summary: surviving sepsis Campaign: international guidelines for the management of sepsis and septic shock 2021. Crit Care Med. 2021;49(11):1974–1982. doi:10.1097/CCM.0000000000005357
2. Fleischmann-Struzek C, Goldfarb DM, Schlattmann P, Schlapbach LJ, Reinhart K, Kissoon N. The global burden of paediatric and neonatal sepsis: a systematic review. Lancet Respir Med. 2018;6(3):223–230. doi:10.1016/S2213-2600(18)30063-8
3. Tan B, Wong JJ, Sultana R, et al. Global case-fatality rates in pediatric severe sepsis and septic shock: a systematic review and meta-analysis. JAMA Pediatr. 2019;173(4):352–362. doi:10.1001/jamapediatrics.2018.4839
4. Menon K, Schlapbach LJ, Akech S, et al. Criteria for pediatric sepsis-a systematic review and meta-analysis by the pediatric sepsis definition taskforce. Crit Care Med. 2022;50(1):21–36. doi:10.1097/CCM.0000000000005294
5. Weiss SL, Peters MJ, Alhazzani W, et al. Surviving sepsis Campaign international guidelines for the management of septic shock and sepsis-associated organ dysfunction in children. Pediatr Crit Care Med. 2020;21(2):e52–e106. doi:10.1097/PCC.0000000000002198
6. Evans IVR, Phillips GS, Alpern ER, et al. Association between the New York sepsis care mandate and in-hospital mortality for pediatric sepsis. JAMA. 2018;320(4):358–367. doi:10.1001/jama.2018.9071
7. Eisenberg MA, Balamuth F. Pediatric sepsis screening in US hospitals. Pediatr Res. 2022;91(2):351–358. doi:10.1038/s41390-021-01708-y
8. Subramanian A, Tamayo P, Mootha VK, et al. Gene set enrichment analysis: a knowledge-based approach for interpreting genome-wide expression profiles. Proc Natl Acad Sci USA. 2005;102(43):15545–15550. doi:10.1073/pnas.0506580102
9. Langfelder P, Horvath S. WGCNA: an R package for weighted correlation network analysis. BMC Bioinf. 2008;9:559. doi:10.1186/1471-2105-9-559
10. Singer M, Deutschman CS, Seymour CW, et al. The third international consensus definitions for sepsis and septic shock (sepsis-3). JAMA. 2016;315(8):801–810. doi:10.1001/jama.2016.0287
11. Zhang G. Regulatory T-cells-related signature for identifying a prognostic subtype of hepatocellular carcinoma with an exhausted tumor microenvironment. Front Immunol. 2022;13:975762. doi:10.3389/fimmu.2022.975762
12. Zhou Y, Zhou B, Pache L, et al. Metascape provides a biologist-oriented resource for the analysis of systems-level datasets. Nat Commun. 2019;10(1):1523. doi:10.1038/s41467-019-09234-6
13. Leticia Fernandez-Carballo B, Escadafal C, MacLean E, Kapasi AJ, Dittrich S. Distinguishing bacterial versus non-bacterial causes of febrile illness - a systematic review of host biomarkers. J Infect. 2021;82(4):1–10. doi:10.1016/j.jinf.2021.01.028
14. Fan J, Shi S, Qiu Y, Liu M, Shu Q. Analysis of signature genes and association with immune cells infiltration in pediatric septic shock. Front Immunol. 2022;13:1056750. doi:10.3389/fimmu.2022.1056750
15. Wang X, Guo Z, Wang Z, et al. Diagnostic and predictive values of pyroptosis-related genes in sepsis. Front Immunol. 2023;14:1105399. doi:10.3389/fimmu.2023.1105399
16. Zhang WY, Chen ZH, An XX, et al. Analysis and validation of diagnostic biomarkers and immune cell infiltration characteristics in pediatric sepsis by integrating bioinformatics and machine learning. World J Psychiatry. 2023;19(11):1094–1103. doi:10.1007/s12519-023-00717-7
17. Yang Y, Zhang G. Lysosome-related diagnostic biomarkers for pediatric sepsis integrated by machine learning. J Inflamm Res. 2023;16:5575–5583. doi:10.2147/JIR.S437110
 © 2024 The Author(s). This work is published and licensed by Dove Medical Press Limited. The
full terms of this license are available at https://www.dovepress.com/terms
and incorporate the Creative Commons Attribution
- Non Commercial (unported, 3.0) License.
By accessing the work you hereby accept the Terms. Non-commercial uses of the work are permitted
without any further permission from Dove Medical Press Limited, provided the work is properly
attributed. For permission for commercial use of this work, please see paragraphs 4.2 and 5 of our Terms.
© 2024 The Author(s). This work is published and licensed by Dove Medical Press Limited. The
full terms of this license are available at https://www.dovepress.com/terms
and incorporate the Creative Commons Attribution
- Non Commercial (unported, 3.0) License.
By accessing the work you hereby accept the Terms. Non-commercial uses of the work are permitted
without any further permission from Dove Medical Press Limited, provided the work is properly
attributed. For permission for commercial use of this work, please see paragraphs 4.2 and 5 of our Terms.
Recommended articles
Lysosome-Related Diagnostic Biomarkers for Pediatric Sepsis Integrated by Machine Learning
Yang Y, Zhang G
Journal of Inflammation Research 2023, 16:5575-5583
Published Date: 24 November 2023