")
Back to Journals » International Journal of General Medicine » Volume 15
Prediction of VEGF and EGFR Expression in Peripheral Lung Cancer Based on the Radiomics Model of Spectral CT Enhanced Images
Authors Wu L, Li J, Ruan X, Ren J, Ping X, Chen B
Received 20 May 2022
Accepted for publication 3 August 2022
Published 22 August 2022 Volume 2022:15 Pages 6725—6738
DOI https://doi.org/10.2147/IJGM.S374002
Checked for plagiarism Yes
Review by Single anonymous peer review
Peer reviewer comments 2
Editor who approved publication: Dr Scott Fraser
Linhua Wu,1 Jian Li,1 Xiaowei Ruan,2 Jialiang Ren,3 Xuejun Ping,4 Bing Chen1
1Department of Radiology, General Hosipital of Ningxia Medical University, YinChuan, Ningxia Hui Autonomous Region, People’s Republic of China; 2Department of Radiology, People’s Hospital of Ningxia Hui Autonomous Region, Yinchuan, Ningxia Hui Autonomous Region, People’s Republic of China; 3Department of Pharmaceuticals Diagnosis, GE Healthcare, Beijing, People’s Republic of China; 4Department of Clinical Medical Faculty, Medical University of Ningxia, Yinchuan, Ningxia Hui Autonomous Region, People’s Republic of China
Correspondence: Xuejun Ping, Department of Clinical Medical Faculty, Medical University of Ningxia, No. 1160 Shengli Street, Xingqing District, Yinchuan, Ningxia Hui Autonomous Region, People’s Republic of China, Tel +8613709516402, Email [email protected]
Background: Energy spectrum CT is an effective method to evaluate the biological behavior of lung cancer. Radiomics is a non-invasive technology to obtain histological information related to lung cancer.
Purpose: To investigate the value of the radiomics models on the bases of enhanced spectral CT images of peripheral lung cancer to predict the expression of the vascular endothelial growth factor (VEGF) and epidermal growth factor receptor (EGFR).
Material and Methods: This study retrospectively analyzed 73 patients with peripheral lung cancer confirmed by postoperative pathology. All patients underwent dual-phase enhanced spectral CT scans before surgery. Regions of interest (ROI) were delineated in the arterial phase and venous phase. Key radiomics features were extracted and models were established to predict the expression of VEGF and EGFR, respectively. All models were established based on the expression levels of VEGF and EGFR in tissues detected by immunohistochemical staining as reference standards. Receiver operating characteristic (ROC) curve and calibration curve were used to evaluate the predictive performance of each model, and decision curve analysis (DCA) was used to evaluate the clinical utility of the models.
Results: In predicting the expression level of VEGF, the combined (COMB) model composed of one spectral feature and two radiomics features achieved the best performance with area under ROC (AUC) 0.867 (95% CI: 0.767– 0.966), accuracy of 0.812, sensitivity of 0.879, and specificity of 0.667. According to the expression level of EGFR, three importance radiomics features were retained in the arterial and venous phases to establish the multiphase phase model which has the best performance with AUC of 0.950 (95% confidence interval: 0.89– 1.00), accuracy of 0.896, sensitivity of 0.868, and specificity of 1.
Conclusion: The radiomics model of enhanced spectral CT images of peripheral lung cancer can predict the expression of EGFR and VEGF.
Keywords: peripheral lung cancer, radiomics, energy spectrum CT, VEGF, EGFR
Introduction
Lung cancer is the leading cause of cancer-related deaths worldwide, with 5-year survival rates of 15% for men and 21% for women.1 Diagnosing central lung cancer is relatively easy because of its large volume, obvious morphological features, and bronchial invasion. However, detecting peripheral lung cancer with less obvious morphological features remains difficult. Therefore, on the bases of conventional imaging images, other auxiliary means are needed to help diagnosis and treatment, such as immunohistochemistry. In the past 20 years, people have made progress in understanding the molecular basis of lung cancer, hoping to provide helpful information for the diagnosis and treatment of lung cancer through immunohistochemical indicators. Among them, the epidermal growth factor receptor (EGFR) and vascular endothelial growth factor (VEGF) have been confirmed to be closely related to the biological behavior of lung cancer.2,3 VEGF is a pro-angiogenic factor, which can stimulate the differentiation of endothelial cells and produce new blood vessels.4 According to studies at home and abroad, the expression level of EGFR in normal tissues, precancerous lesions, and lung cancer tissues increased step by step, indicating that tumor growth is significantly correlated with EGFR.5,6 Studies7–11 have shown that molecular targeted drugs can inhibit the expression of VEGF and EGFR, making EGFR and VEGF the common targets of molecular targeted therapy for lung cancer; the secretion of VEGF can promote the production of malignant serous effusion; for non-small cell lung cancer (NSCLC), dual inhibition of EGFR and VEGF pathways may delay therapeutic resistance in advanced NSCLC;for the lung adenocarcinoma spectrum, peripheral lung cancer (especially those with sub solid nodules) in Asian population is mostly manifesting with it, EGFR molecular changes have been shown to be associated with the development and treatment strategies of lung adenocarcinoma.If the expression of VEGF and EGFR in lung cancer can be effectively predicted before surgery, molecular targeted drugs can be used, reduce the occurrence of malignant pleural effusion, delay the drug resistance of lung cancer treatment, and affect clinical treatment decisions. However, the detection of these factors can only be obtained by invasive sampling in vivo, which has the disadvantages of high technical difficulty, high risk of infection, and long analysis time.
Energy spectrum CT imaging can evaluate the physiological and metabolic changes of tissues in vivo. It is a CT functional imaging mode with multi-parameter quantitative diagnosis. This imaging mode not only has the characteristics of traditional CT but can also reflect the blood flow of the tumor through the iodine base map and reflect the attenuation characteristics of material energy through the energy spectrum curve to make a more comprehensive evaluation of the biological behavior of the tumor.12,13
Radiomics is a new technology that uses high-throughput quantitative image features for diagnosis and prognosis,14–18 and it is also a non-invasive technology to obtain histological and mutation information related to lung cancer.19 The heterogeneity of tissue structure is the basic feature of malignant tumor, and the imaging features can quantitatively analyze the heterogeneity of tissue structure within the lesion and explore the potential information within the lesion. In addition, radiomics features not only can quantify the image parameters but also analyze the heterogeneity of tissue structure through non-invasive methods, which can provide further information about the lesions for clinicians. Recent studies on radiomics have emphasized its role in various malignant tumors, including lung cancer.20–23 Radiomics includes histogram-based analysis of the distribution and spatial variation of pixel values in the region of interest (ROI) to obtain information about tumor heterogeneity. Several studies have demonstrated that different applications of radiomics in lung cancer diagnosis, the most common are classification of lung nodules as being malignant/benign; determining the degree of invasiveness of the lung adenocarcinoma; histopathologic subtyping; and prognostication in lung cancer prediction models.24–26 To our best knowledge, no research studies the added value of radiomics combined with clinical history and spectral correlation characteristics.27
We hypothesized that the model established by combining clinical history, energy spectrum and radiomics features has higher value in predicting the expression of VEGF and EGFR in peripheral lung cancer. Therefore, the purpose of this study was to explore the value of the radiomics model based on spectral CT enhanced images in predicting the expression of VEGF and EGFR in peripheral lung cancer, and whether it could provide a non-invasive, accurate, and reliable method for predicting the biological behavior of peripheral lung cancer.
Materials and Methods
Ethics Statement
The study was approved by the Research Ethics Committee of General Hosipital of Ningxia Medical University and all patients signed informed consent. And the study followed the guidelines outlined in the Declaration of Helsinki.
Patients
From January 2019 to January 2021, a retrospective analysis was conducted in 116 patients with pulmonary space occupying lesions found through a dual phase enhanced energy spectrum CT imaging in the Department of Radiology, General Hospital of Ningxia Medical University, and finally included 73 patients (45 males and 28 females; mean age, 60 years ± 10), all of whom were pathologically confirmed as peripheral lung cancer (36 adenocarcinoma, 25 squamous cell carcinoma, and 12 small cell lung cancer). The inclusion criteria are as follows: ①Lung cancer was confirmed by pathology, ② Preoperative CT images, and ③ the image quality meets the requirements of diagnosis and post-processing. Meanwhile, the following are the exclusion criteria: ① Patients with preoperative chemotherapy and ② History of other tumors (Figure 1).
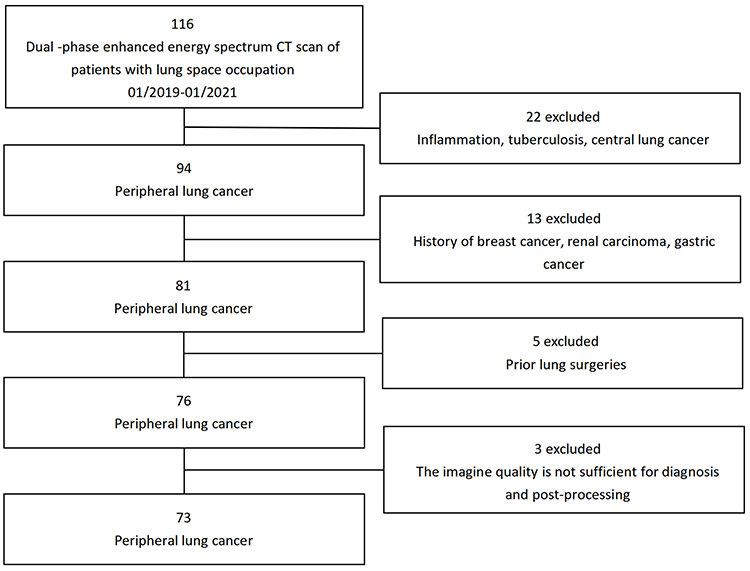 |
Figure 1 CONSORT diagram of patient selection. |
CT Scanning
GE gem energy spectrum CT machine (GE discovery ct750hd, GE Healthcare) was used for scanning, and the supine position was taken. The scanning range was from the pulmonary apex to the diaphragmatic surface of the pulmonary floor. Conventional chest CT plain scanning was followed by energy spectrum CT dual phase enhanced scanning. Iodixanol (270mg I/mL) was injected via the forearm vein with a high-pressure syringe. The contrast dose was 1.2mL/kg, and the injection flow rate was 3.5mL/s. The images were collected after 30s and 60s of contrast injection. Energy spectrum scanning parameters: tube voltage 80 and 140 kvp instantaneous (0.5 ms) switching, tube current 630 ma, pitch ratio 1.375:1, collimation 64×625 mm, and the scanning thickness was 5.0 mm. After scanning, the reconstructed image was transferred to the workstation. The interval and thickness of the reconstructed image were 0.625 mm. The iodine concentrations (IC) of the lesions in the arterial phase (AP) were measured at the workstation, and the iodine content of the lesions/ aortic iodine content was the normalized iodine concentration (NIC) value, NIC = IC lesions/ IC artery. The water concentrations (WC) of AP were measured. The normalized water concentrations (NWC) of AP/ aorta was defined as NWC = WC lesion/ WC artery. The CT value (HU) corresponding to 40 keV was measured. The slope of energy spectrum curve from 40 to 100 keV is calculated λ HU = (CT100 keV-CT40 keV)/60. All images are stored in the PACS system.
Pathology
The resected specimens were fixed in 10% neutral buffer formalin (pH = 7.0), treated with tissue, and embedded in paraffin. The expression of VEGF and EGFR was detected by instant PV9000 immunohistochemical staining. The results were determined in a blinded manner, and each section was counted by 2 pathologists. The determination of VEGF and EGFR is based on the cytoplasm and (or) cell membrane with clear brown-yellow particles. The Samples were classified into positive and negative groups, with a cut-off value based on the findings of previous reports.28 When ≥10% of the carcinoma cells in a given specimen were positively stained for VEGF, the sample was classified as VEGF positive. When <10% of the carcinoma cells were positively stained, the sample was classified as VEGF negative. EGFR is also based on the same principle. As is shown in Figure 2.
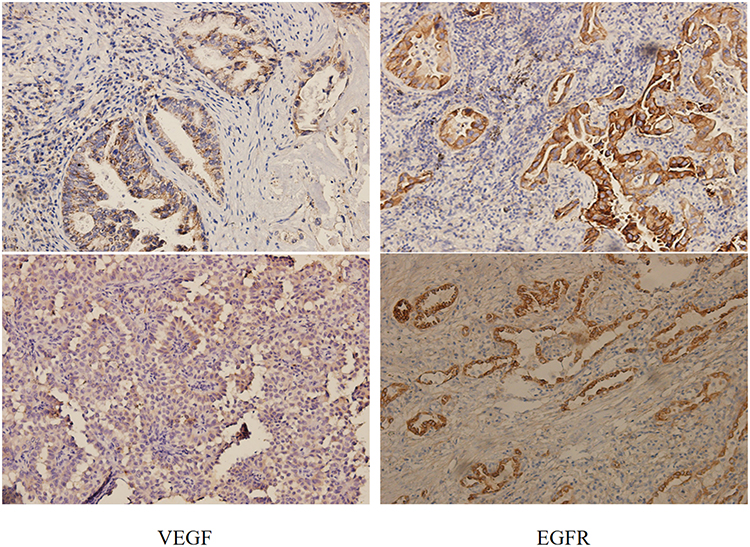 |
Figure 2 On the left is the expression of VEGF in poorly differentiated adenocarcinoma tissue (PV9000 ×200), and on the right is the expression of EGFR in situ adenocarcinoma tissue (PV9000 ×200). |
Radiomics and Clinical Data Collection
The clinical data including age, gender, pathological type, degree of differentiation, lesion diameter; and energy spectrum data including iodine content, standardized iodine content, water content, standardized water content, CT value corresponding to 40 keV, and the slope of energy spectrum curve were selected as predictive factors for the construction of the s model. At the same time, the enhanced CT images of all patients were imported into the ITK-SNAP (version 3.8.0, https://www.itksnap.org) software in DICOM format for manual ROI segmentation. Under the supervision of two radiologists with more than 10 years of experience, the tumor boundaries were manually delineated on the consecutive layers of the axial images in the arterial and venous phases, resulting in a 3D stereoscopic ROI (Figure 3). The original and ROI images were imported into the LK (version: 3.0, GE Healthcare, China) software for radiomics features extraction. The software used in this study can generate image features such as tumor intensity, shape, texture, and transform image features. Univariate and multivariate stepwise analyses were used to select the clinical and spectral characteristics. Univariate rank sum test, correlation analysis, and multivariate stepwise logistic regression were used to select the radiomics features.
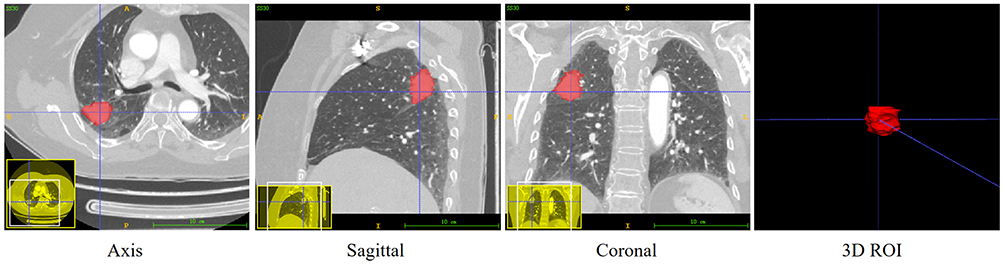 |
Figure 3 Sketch diagram of ROI drawing and segmentation was manually drawn on the horizontal axis, and the sagittal and coronal ROI were obtained for correction and supplement. The 3D ROI image was obtained by update. |
Statistics Analysis
Using R software (version 3.6.3, https://www.rproject.org), the counting data were expressed as mean ± standard deviation, and the counting data were expressed as frequency. Pearson Chi-squared test was used for gender, pathological type, and degree of differentiation. The inter-class correlation coefficient (ICC) was used to evaluate the inter-observer consistency, and ICC > 0.75 was considered a good consistency. Mann–Whitney rank sum test was used for correlation analysis of age, lesion diameter, and spectral parameters. Multivariate logistic regression analysis was used to establish various models, and the “pROC” package was used to measure the ROC curve. The AUC was used to evaluate the performance of VEGF and EGFR prediction model, and the optimal cut-off point of ROC curve was obtained by the Youden-index to determine the model and evaluate the sensitivity and specificity. Decision curve analysis (DCA) was used to evaluate the clinical value of the difference models. Two sides P < 0.05 were considered statistically significant. Moreover, the Radiomics Quality Score (RQS) was used to evaluate the quality of the study design.24 The total score of RQS was 20 (55.6%) (For details, see Supplementary Material RQS-Radiomics.world.PDF).
Results
Feature Extraction and Model Construction
According to the expression of VEGF, the slope difference was statistically significant, and the other clinical or spectrum features have no statistical difference. Arterial phases retain the wavelet LHH filter glszm Small Area Low Gray Level Emphasis feature, venous phase retain wavelet HHL first-order Median feature, as shown in Figure 4. Multi-phase combination of the above two key features was done to establish a model and combined with the selected energy spectrum features to establish a combination (COMB) model. According to the expression level of EGFR, no clinical and energy spectrum data existed. The Laplace of Gaussian filter glszm Small Area Low Gray Level Emphasis feature and wavelet HHL glcm MCC feature were extracted in the arterial phase, and wavelet LHL first-order root mean square features in the venous phase (Figure 5) were extracted to establish single phase model. The three key features of the multi-phase phase were combined to establish a multi-phase model. The ICC among observers was 0.94 [95% (0.85–0.98)], implying good consistency.
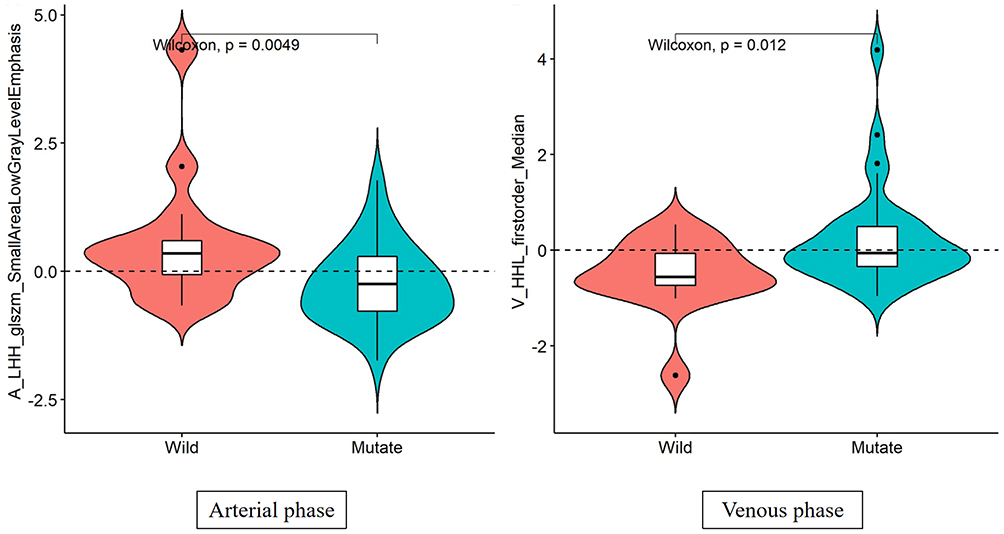 |
Figure 4 Distribution of the final imaging features predicting VEGF expression. The preserved feature of arterial phase is the low gray emphasized feature of wavelet LHH filter glszm small area. The vein retention feature is the first-order median feature of wavelet HHL. |
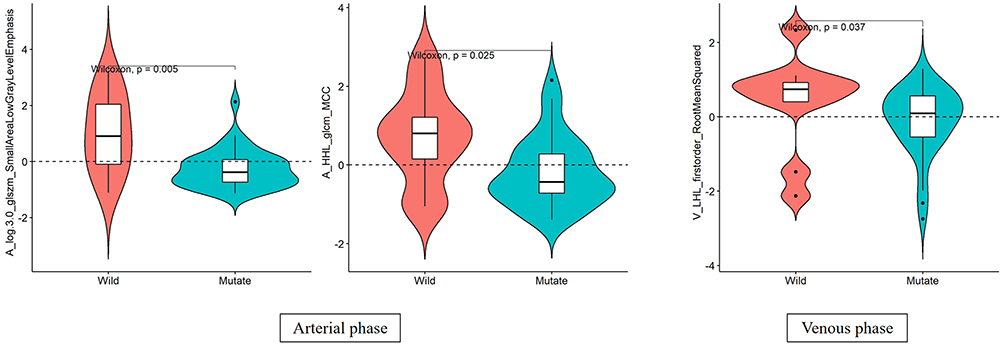 |
Figure 5 The final distribution of imaging features of EGFR expression was predicted. The features retained in the arterial phase are Laplace of Gaussian filter glszm Small Area Low Gray Level Emphasis feature and wavelet HHL glcm MCC feature. In addition, the variability feature of venous retention is the first-order root mean square feature of wavelet LHL. |
Performance of Prediction Models
The efficiency of ROC curve was calculated in line with the model established according to the expression of VEGF. The AUC value, accuracy, sensitivity, and specificity of each model were determined by the ROC curve threshold analysis (Table 1). According to the ROC curve of VEGF prediction model (Figure 6), the multi-phase radiomics model can predict the expression of VEGF immunohistochemical indexes in peripheral lung cancer, and the prediction efficiency of VEGF energy spectrum characteristics combined with the model is the best. The calibration curve of the radiomics model for predicting VEGF expression shows that the predicted results are in good agreement with the actual results (Figure 7). According to the DCA, the clinical value of the VEGF energy spectrum characteristic combination model is better than the single-phase model, multi-phase combination model, and VEGF energy spectrum characteristic model (Figure 8).
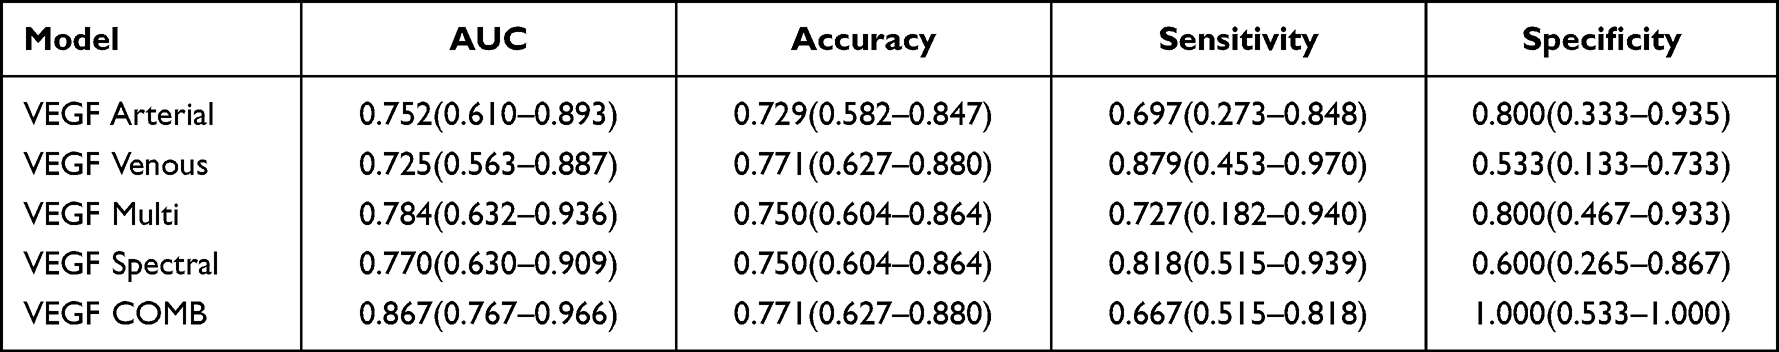 |
Table 1 AUC Value, Accuracy, Sensitivity, and Specificity of Each Model for Predicting VEGF Expression are Expressed in 95% Confidence Interval |
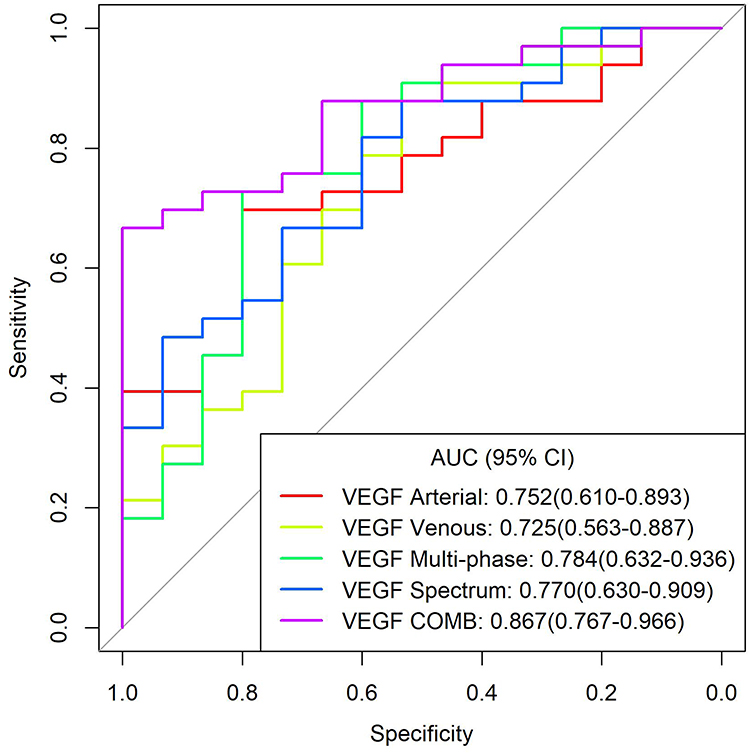 |
Figure 6 ROC curves of all models predicting VEGF expression. Abbreviations: VEGF Arterial, arterial phase model; VEGF Venous, venous phase model; VEGF Multi-phase, multiphase (arterial and venous feature fusion) combined model; VEGF Spectral, energy spectrum characteristic model; VEGF COMB, a model combining multiphase characteristics and energy spectrum characteristics. |
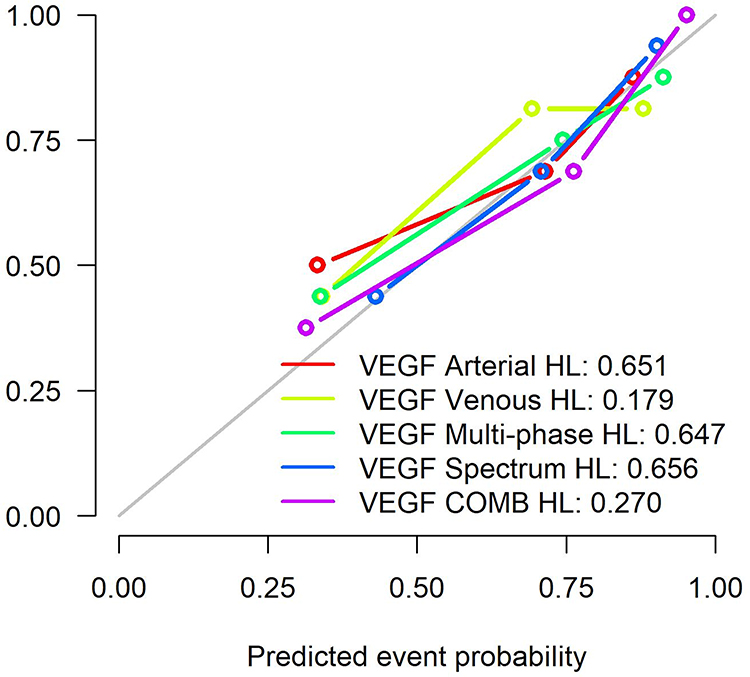 |
Figure 7 Calibration curves of all models. The HL results of all models showed that P > 0.05. Abbreviations: VEGF Arterial, arterial phase model; VEGF venous, Venous phase model; VEGF Multi, multiphase (arterial and venous feature fusion) combined model; VEGF Spectral, energy spectrum characteristic model; VEGF COMB, a model combining multiphase characteristics and energy spectrum characteristics; HL, Hosmer-Lemeshow test. |
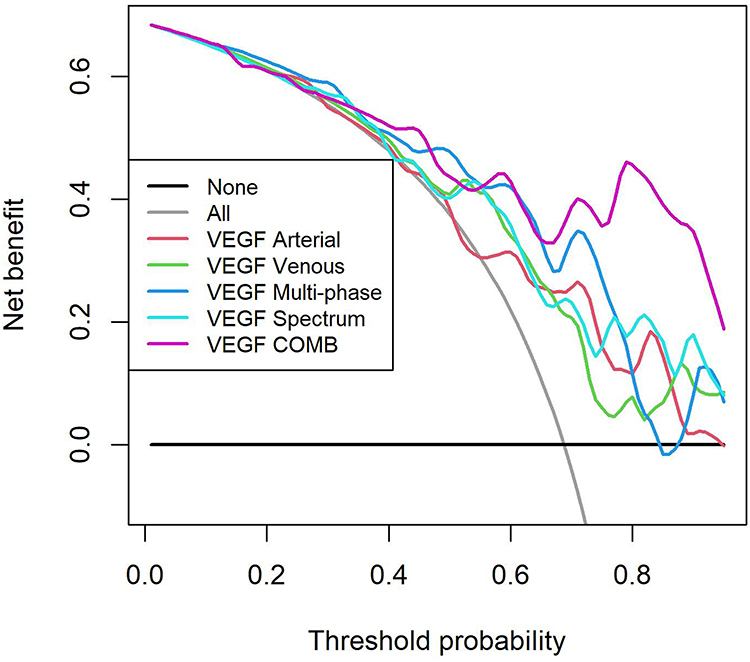 |
Figure 8 Decision curves of all models. In the probability range of 0.69–0.96, the VEGF energy spectrum characteristic combination model has the greatest clinical utility value. |
The efficiency of ROC curve was calculated in line with the model established according to the expression of EGFR. The AUC value, accuracy, sensitivity, and specificity of each model were determined (Table 2). According to the ROC curve of EGFR prediction model (Figure 9), the prediction efficiency of the EGFR multi-phase model is the best. The calibration curve of difference models for predicting the expression of EGFR shows that the predicted results are in good agreement with the actual results (Figure 10). According to the DCA, the clinical value of the EGFR multi-phase model is better than that of the single-phase model (Figure 11).
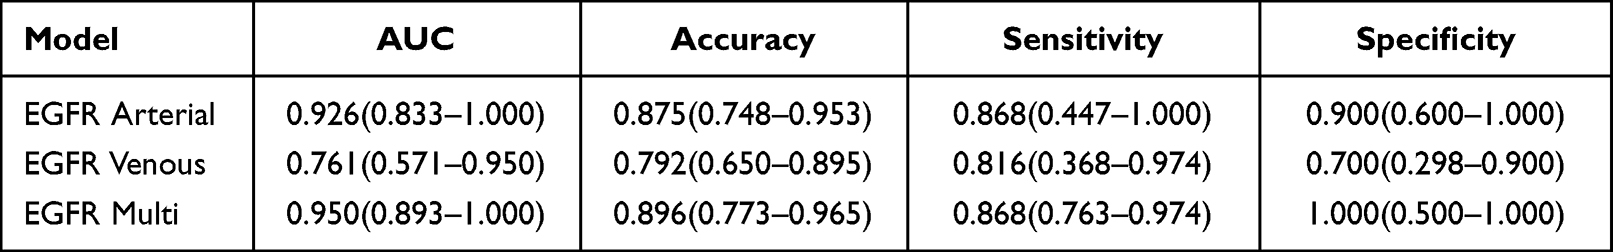 |
Table 2 AUC Value, Accuracy, Sensitivity, and Specificity of Each Model for Predicting EGFR Expression are Expressed in 95% Confidence Interval |
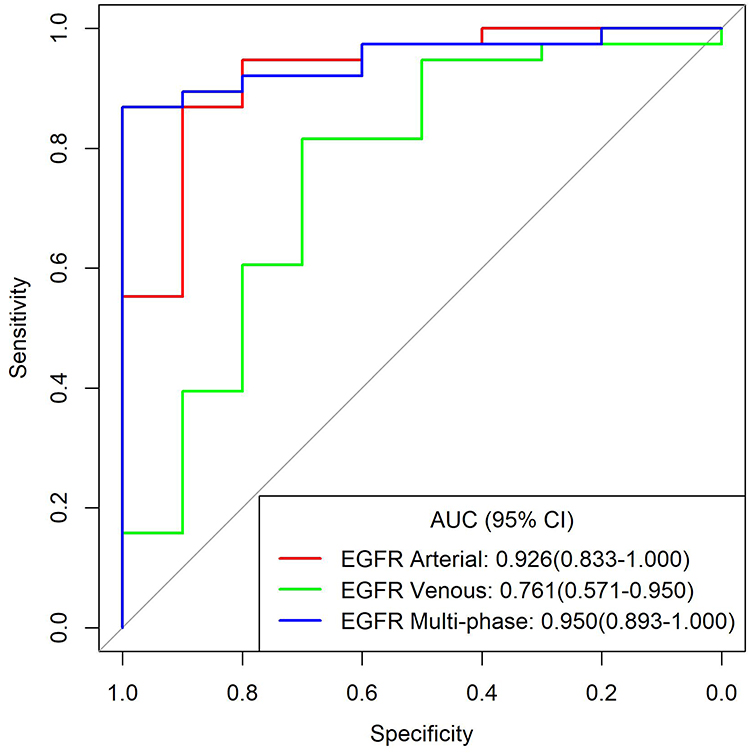 |
Figure 9 ROC curves of all models predicting EGFR expression. Abbreviations: EGFR Arterial, arterial phase model; EGFR Venous, venous phase model; EGFR Multi, multi-phase (arterial and venous feature fusion) combined model. |
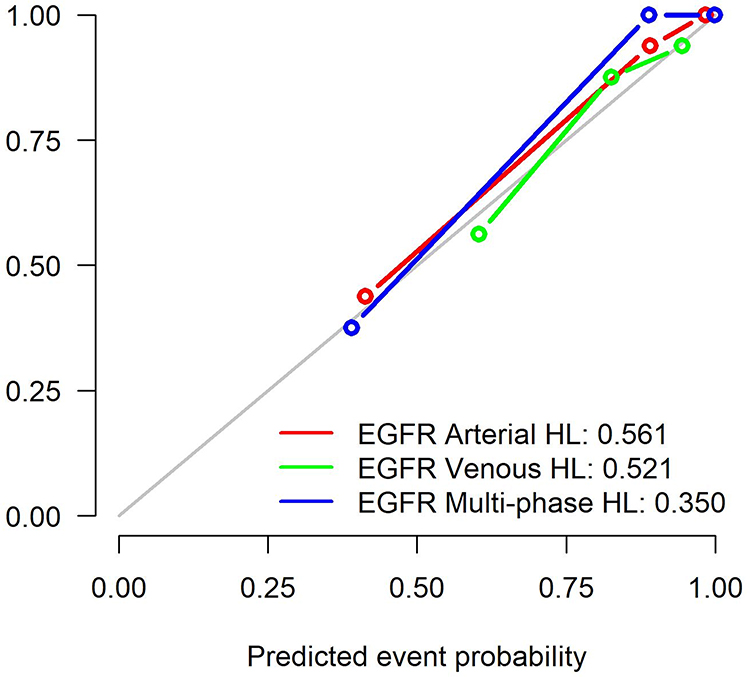 |
Figure 10 Calibration curves of all models. EGFR The HL results of all models showed that P > 0.05. Abbreviations: Arterial, arterial phase model; EGFR Venous, venous phase model; EGFR Multi, multiphase (arterial and venous feature fusion) combined model; HL, Hosmer-Lemeshow test. |
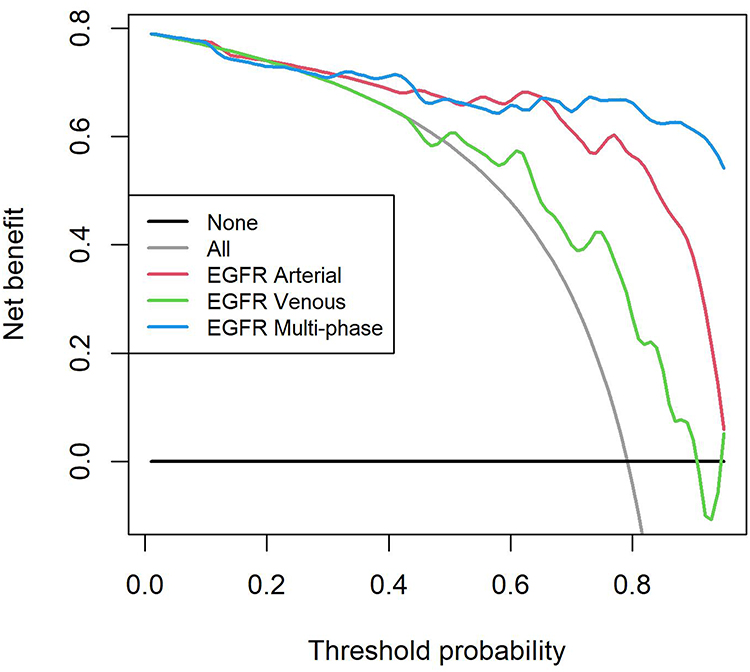 |
Figure 11 Decision curves of all models. In the probability range of 0.69–0.96, the clinical utility value of the EGFR multiphase combination model is the largest. |
Discussion
Immunohistochemical studies have proven that micro-vessel density, cancer cell proliferation, a variety of cytokines, and receptors in tumor tissue are closely related to the biological behavior of lung cancer.5,29 VEGF promotes the metastasis and infiltration of tumor cells by promoting vascular growth, autocrine, and paracrine mechanisms; and promotes the growth, metastasis, and infiltration of malignant tumors.30 EGFR is a receptor tyrosine kinase. Its high expression can lead to tissue carcinogenesis and promote tumor cell growth, invasion, neovascularization, and distant metastasis.31,32 Although medical images provide valuable information for the diagnosis and treatment of cancer patients, extracting some basic information from these images is common as prognostic factors or evaluation of the treatment effect.33 These methods cannot obtain further information about tumor pathological types and gene expression. According to relevant studies, the energy spectrum parameters are correlated with the expression of VEGF and EGFR; additionally, the energy spectrum curve can reflect the characteristics of material and energy attenuation to indirectly reflect the tumor tissue structure and pathological type,29,34 which is helpful to predict the expression of immunohistochemical indexes VEGF and EGFR. Using radiomics to study angiogenesis and tumor proliferation in lung cancer can provide a non-invasive method for preoperative evaluation of tumor biological behavior.
Previous studies have shown that energy spectrum-related parameters are related to the expression of VEGF and EGFR. However, recent studies on the predictive value of radiomics for histopathology have not considered the significance of multi-phase combination or the value of combined clinical history and energy spectrum-related parameters, which may overemphasize the significance of radiomics.
We found that the accuracy of the combined radiomics model (AUC 0.867) was higher than that of the single-phase model (AUC 0.752, 0.725), multiphase model (AUC 0.784), and simple energy spectrum feature model (AUC 0.770). In predicting the expression of EGFR, the accuracy of multiphase radiomics model (AUC 0.950) was higher than that of monophasic model (AUC 0.926, 0.761). This is similar to the results obtained by Liang et al,35 the combined model of arterial phase combined with venous phase showed better performance. At the same time, this study also added some clinical features and energy spectrum features compared with this study, which optimized the model performance and make up for some deficiencies. The accuracy of the models predicting EGFR expression was higher than that of the models predicting VEGF. The accuracy of these models combined with multi-phase radiomics features and energy spectrum characteristics has been improved. It also shows that the model for predicting EGFR expression is more effective. In our study, none of the clinical characteristics (patient gender and age) was a predictor of expression.
On the bases of energy spectrum enhanced CT images, a radiomics model was established by image quantitative analysis to predict the expression of EGFR and VEGF. The experimental results show that the established models are effective in predicting the expression of EGFR and VEGF. According to different prediction indexes, the models based on single phase or characteristics are the combined models with the highest prediction efficiency and the best clinical value than the combined models, indicating that the reliability of combining various data to jointly predict immunohistochemical indexes is higher, which is consistent with our work in image diagnosis. The same reason exists as to why the diagnostic accuracy of a disease will be higher in combination with clinical history, laboratory examination, and imaging data, which is similar to the previous relevant research results.27 According to the comparison of the prediction models of the two indicators, the models that predict the expression of EGFR are more effective. Among the models based on single-Phase Images, the prediction efficiency of the EGFR arterial phase model is better. Among all kinds of models, the AUC value of EGFR multi-phase model and the prediction efficiency are the highest. The features extracted according to the expression of VEGF include wavelet LHH filter glszm small area low gray emphasis feature and wavelet HHL first-order median feature; and the features extracted according to the expression of EGFR include Gaussian filter glszm wavelet Laplace wavelet small area low gray emphasis feature, wavelet HHL GLCM MCC feature, wavelet LHL first-order root mean square feature, and wavelet transform feature. Therefore, the radiomics model can predict the expression of VEGF and EGFR, which is similar to previous studies.36 The difference between the best models for predicting the expression of VEGF and EGFR is that, firstly, their prediction objects are different, this study is based on the levels of these two immunohistochemical indicators for modeling. The working goals of the model itself are different. Secondly, the key features extracted by two models are different, and the image information that the model obtained based on this modeling focuses on when analyzing the image is also different. Thirdly, the predictive performance of the combined model is better than that of the single-phase model or the individual energy spectral feature model, probably because the combined model combines the different perfusion of the lesions in the arteriovenous phase as image evidence as support, and the VEGF model also combines spectral features, prediction performance may be better with more reliable evidence. The accuracy of the models for predicting EGFR expression is higher than that for predicting VEGF. It may be that the static image information reflects the characteristics of the lesion itself, and the expression of EGFR promotes tumor growth and invasion through receptor binding. The mechanisms of promoting angiogenesis, autocrine, and paracrine are dynamic processes, and image information is not easy to capture.
The significance of our study is that the combination of clinical and energy spectrum features with imaging features can improve the ability of the radiomics model to predict the expression of VEGF and EGFR. At present, gene detection guidelines exist for EGFR mutation and ALK rearrangement in patients with lung adenocarcinoma, but the problems related to cost, invasiveness, and post-processing of genetic map are notable In addition to the radiomics analysis based on imaging to predict the research related to the biological behavior of tumors, there are other methods to detect the biological behavior of tumors, such as PET/CT, as one of the most mature multimodal images. PET reflects the functional metabolic characteristics and the advantages of high spatial resolution of CT, and its application value in disease diagnosis has been recognized, which is the advantage of FDG-PET in the evaluation of peripheral malignant nodules.37 In the past, the diagnosis of diseases by PET/CT mainly relied on the standard uptake value (SUV) parameters. At present, there are many studies at home and abroad to establish prediction models based on image texture parameters to differentially diagnose pulmonary nodules, and some studies have found that combining SUVmax with age has a better predictive effect.38 This method is similar to the method used in this study, both of which are based on image analysis. The difference is that FDG-PET itself can reflect the functional and metabolic characteristics of lesions, but the quality of CT images is not as large as that of gemstone energy spectrum CT. The nuclear medicine is used in nuclear medicine imaging, and the radiation dose to the patient is relatively large. There is also a new approach, using liquid biopsies to examine circulating tumor cells (CTCs) in the blood for studies of tumor-associated proteins and genes, which are said to inform cancer, prognosis and treatment effectiveness, potentially providing early evidence of drug resistance.39 Both are currently popular emerging methods, both of which aim to detect tumor biological behavior information through in vitro analysis technology, so as to achieve the effect of predicting tumor development and prognosis, and provide help for patients to formulate individualized treatment and shared decision-making. However, the former is based on image information. The advantage is that it does not require invasive examination to obtain body fluids, tissues, etc. for detection. At the same time, high-throughput information can be obtained, and modern advanced computer technology, artificial intelligence and other methods can be used for in vitro prediction, and the research obtained is also more. It will contribute to the development of the whole era of artificial intelligence-assisted medical care in the future. The disadvantage is that it is only based on image information and does not pay attention to the physiological and biochemical changes of the living body itself, which has limitations. The latter is based on the biological information in the blood, which is more convincing for detecting protein and gene changes, but it is an invasive test, the samples obtained are limited, the sample preservation and detection methods are complicated and expensive, and the detection of peripheral blood tumor cells, The accuracy of obtaining information is limited, and the lesions themselves cannot be accurately analyzed. Therefore, various detection methods in the future hope to provide patients with the benefits of early diagnosis, optimized treatment and improved prognosis, but all methods are not omnipotent and have limitations. No matter which method, it must be combined with the lesion itself. We should assist each other with patients as a whole, from clinical characteristics, patient preferences, and disease course development, etc., to provide more powerful evidence and serve patients. In this context, our study shows that non-invasive techniques based on histological differentiation of lung cancer and/ or positive EGFR expression, such as radiomics, can help multidisciplinary teams make decisions in the treatment of lung cancer. This finding may affect the treatment options of cancer patients and allow pathologists to conduct standardized gene analysis, give priority to testing, save tissue from biopsy samples, use time more rationally, and save labor-related costs of available tissue samples. Although unlikely in developed countries, tools such as radiomics may be useful in countries with limited resources. In fact, this low-cost imaging based model has been reported for colorectal cancer monitoring and chemotherapy selection in patients with NSCLC.40,41 Current research suggests42 that shared decision-making (SDM) for lung cancer screening promotes patient-centered clinician communication to be more beneficial for patients, so in clinical decision-making for treatment selection and management based on individualized medicine and shared decision-making, prediction of lung cancer risk is an important factor for low-dose CT screening of lung cancer. Therefore, if the expression of VEGF and EGFR can be predicted early, the risk of lung cancer can be predicted and evaluated for patients at an early stage, so as to formulate personalized medicine for patients and clinicians. and help with shared decision-making.
Our study has some limitations. First, the sample size is small. The small sample size and single center cohort limit the generalization of the development model. In the future research, multi-center with large dataset should be recruited for verification. Second, in this study, manual and semi-automatic segmentation were used to delineate the ROI on the continuous slices of the axial images in the arterial and venous phases, respectively, and the coronal and sagittal planes were obtained by software calculation to obtain a complete 3D ROI. Manual segmentation is time-consuming and prone to inter-observer and intra-observer variation, but it is a convenient and feasible method at present, so in the future, accurate, reliable, and fast automatic segmentation software for pulmonary nodules should be developed and clinically validated. Third, we did not assess the impact of different treatment forms on radiomics, due to all post-treatment CT examinations were excluded from the study.
Conclusion
We developed radiomics models based on CT-enhanced images of peripheral lung cancer that can effectively predict the expression of immunohistochemical markers VEGF and EGFR. We envision that future implementation of this type of model in the clinic could impact three distinct aspects: for radiologists, lung cancer risk prediction by early prediction of VEGF, EGFR expression can be reflected in imaging reports, to improve the diagnostic accuracy; for clinicians, the model can reflect tumor angiogenesis and cell proliferation by predicting the expression of VEGF and EGFR. The prediction model constructed by combining multi-phase and energy spectrum features has the highest predictive performance and has better clinical value than single-phase phase. It is expected to provide valuable information for the preoperative and prognostic evaluation of the biological behavior of lung cancer, thereby helping doctors to make clinical diagnosis and treatment prognosis; for lung cancer patients, invasive examinations can be reduced, expenses can be saved, and some psychological stress can be relieved.
Disclosure
This work does not have any relationships with business related issues, and no conflict of interest exits in the submission of this manuscript.
References
1. Viale PH. The American cancer society’s facts & figures: 2020. J Adv Pract Oncol. 2020;11:135–136.
2. Clay R, Kipp BR, Jenkins S, et al. Computer-Aided Nodule Assessment and Risk Yield (CANARY) may facilitate non-invasive prediction of EGFR mutation status in lung adenocarcinomas. Sci Rep. 2017;7:17620.
3. Zhou F, Du J, Wang J. Albendazole inhibits HIF-1α-dependent glycolysis and VEGF expression in non-small cell lung cancer cells. Mol Cell Biochem. 2017;428:171–178.
4. Frezzetti D, Gallo M, Maiello MR, et al. VEGF as a potential target in lung cancer. Expert Opin Ther Targets. 2017;21:959–966.
5. Piyathilake CJ, Frost AR, Manne U, et al. Differential expression of growth factors in squamous cell carcinoma and precancerous lesions of the lung. Clin Cancer Res. 2002;8:734–744.
6. Kobayashi Y, Mitsudomi T, Sakao Y, et al. Genetic features of pulmonary adenocarcinoma presenting with ground-glass nodules: the differences between nodules with and without growth. Ann Oncol. 2015;26:156–161.
7. Zhou Q, Xu CR, Cheng Y, et al. Bevacizumab plus erlotinib in Chinese patients with untreated, EGFR-mutated, advanced NSCLC (ARTEMIS-CTONG1509): a multicenter Phase 3 study. Cancer Cell. 2021;39(9):1279–1291.e3.
8. Vermorken JB, Peyrade F, Krauss J, et al. Cisplatin, 5-fluorouracil, and cetuximab (PFE) with or without cilengitide in recurrent/metastatic squamous cell carcinoma of the head and neck: results of the randomized phase I/II ADVANTAGE trial (phase II part). Ann Oncol. 2014;25(3):682–688.
9. Zhou Z, Li H, Hu D, et al. Clinical efficacy of bevacizumab combined with cisplatin in the treatment of malignant pleural effusion and ascites caused by lung cancer: a randomized trial. Ann Palliat Med. 2021;10(10):10575–10583.
10. Tang EK, Chen CS, Wu CC, et al. Natural history of persistent pulmonary subsolid nodules: long-term observation of different interval growth. Heart Lung Circ. 2019;28(11):1747–1754.
11. Succony L, Rassl DM, Barker AP, McCaughan FM, Rintoul RC. Adenocarcinoma spectrum lesions of the lung: detection, pathology and treatment strategies. Cancer Treat Rev. 2021;99:102237.
12. Chen X, Feng B, Chen Y, et al. A CT-based radiomics nomogram for prediction of lung adenocarcinomas and granulomatous lesions in patient with solitary sub-centimeter solid nodules. Cancer Imaging. 2020;20:45.
13. Wu J, Zhang Q, Zhao Y, et al. Radiomics analysis of iodine-based material decomposition images with dual-energy computed tomography imaging for preoperatively predicting microsatellite instability status in colorectal cancer. Front Oncol. 2019;9:1250.
14. Lambin P, Rios-Velazquez E, Leijenaar R, et al. Radiomics: extracting more information from medical images using advanced feature analysis. Eur J Cancer. 2012;48:441–446.
15. Kumar V, Gu Y, Basu S, et al. Radiomics: the process and the challenges. Magn Reson Imaging. 2012;30:1234–1248.
16. Choi ER, Lee HY, Jeong JY, et al. Quantitative image variables reflect the intratumoral pathologic heterogeneity of lung adenocarcinoma. Oncotarget. 2016;7:67302–67313.
17. Gillies RJ, Kinahan PE, Hricak H. Radiomics: images are more than pictures, they are data. Radiology. 2016;278:563–577.
18. Aerts HJ, Velazquez ER, Leijenaar RT, et al. Decoding tumour phenotype by noninvasive imaging using a quantitative radiomics approach. Nat Commun. 2014;5:4006.
19. Anagnostopoulos AK, Gaitanis A, Gkiozos I, et al. Radiomics/radiogenomics in lung cancer: basic principles and initial clinical results. Cancers. 2022;14(7):1657.
20. Hassani C, Varghese BA, Nieva J, et al. Radiomics in pulmonary lesion imaging. AJR Am J Roentgenol. 2019;212:497–504.
21. Lee G, Park H, Bak SH, et al. Radiomics in lung cancer from basic to advanced: current status and future directions. Korean J Radiol. 2020;21:159–171.
22. Cameron A, Khalvati F, Haider MA, et al. MAPS: a quantitative radiomics approach for prostate cancer detection. IEEE Trans Biomed Eng. 2016;63:1145–1156.
23. Wang J, Kato F, Oyama-Manabe N, et al. Identifying triple-negative breast cancer using background parenchymal enhancement heterogeneity on dynamic contrast-enhanced MRI: a pilot radiomics study. PLoS One. 2015;10:e0143308.
24. Wu YJ, Wu FZ, Yang SC, et al. Radiomics in early lung cancer diagnosis: from diagnosis to clinical decision support and education. Diagnostics. 2022;12(5):1064.
25. Wu YJ, Liu YC, Liao CY, et al. A comparative study to evaluate CT-based semantic and radiomic features in preoperative diagnosis of invasive pulmonary adenocarcinomas manifesting as subsolid nodules. Sci Rep. 2021;11(1):66.
26. Shi L, Zhao J, Peng X, et al. CT-based radiomics for differentiating invasive adenocarcinomas from indolent lung adenocarcinomas appearing as ground-glass nodules: asystematic review. Eur J Radiol. 2021;144:109956.
27. Digumarthy SR, Padole AM, Gullo RL, et al. Can CT radiomic analysis in NSCLC predict histology and EGFR mutation status? Medicine. 2019;98:e13963.
28. Ko YH, Jung CK, Lee MA, et al. Clinical significance of vascular endothelial growth factors (VEGF)-C and -D in resected non-small cell lung cancer. Cancer Res Treat. 2008;40(3):133–140.
29. Li GJ, Gao J, Wang GL, et al. Correlation between vascular endothelial growth factor and quantitative dual-energy spectral CT in non-small-cell lung cancer. Clin Radiol. 2016;71:363–368.
30. Holzer TR, Fulford AD, Reising LO, et al. Profiling of vascular endothelial growth factor receptor heterogeneity identifies protein expression-defined subclasses of human non-small cell lung carcinoma. Anticancer Res. 2016;36:3277–3288.
31. Thunnissen E, Allen TC, Adam J, et al. Immunohistochemistry of pulmonary biomarkers: a perspective from members of the pulmonary pathology society. Arch Pathol Lab Med. 2018;142:408–419.
32. Pirker R. EGFR monoclonal antibody biomarkers in advanced NSCLC: from translational research to clinical implementation. Lancet Oncol. 2018;19:10–12.
33. Ball DL, Fisher RJ, Burmeister BH, et al. The complex relationship between lung tumor volume and survival in patients with non-small cell lung cancer treated by definitive radiotherapy: a prospective, observational prognostic factor study of the Trans-Tasman Radiation Oncology Group (TROG 99.05). Radiother Oncol. 2013;106:305–311.
34. Zhang G, Cao Y, Zhang J, et al. Epidermal growth factor receptor mutations in lung adenocarcinoma: associations between dual-energy spectral CT measurements and histologic results. J Cancer Res Clin Oncol. 2021;147:1169–1178.
35. Liang G, Yu W, Liu SQ, et al. The value of radiomics based on dual-energy CT for differentiating benign from malignant solitary pulmonary nodules. BMC Med Imaging. 2022;22(1):95.
36. Liu Y, Kim J, Balagurunathan Y, et al. Radiomic features are associated with egfr mutation status in lung adenocarcinomas. Clin Lung Cancer. 2016;17:441–448.
37. Carvalho S, Leijenaar RTH, Troost EGC, et al. 18F-fluorodeoxyglucose positron-emission tomography (FDG-PET)-Radiomics of metastatic lymph nodes and primary tumor in non-small cell lung cancer (NSCLC) - A prospective externally validated study. PLoS One. 2018;13(3):e0192859.
38. van Gómez López O, García Vicente AM, Honguero Martínez AF, et al. (18)F-FDG-PET/CT in the assessment of pulmonary solitary nodules: comparison of different analysis methods and risk variables in the prediction of malignancy. Transl Lung Cancer Res. 2015;4(3):228–235.
39. Rossi E, Aieta M, Tartarone A, et al. A fully automated assay to detect the expression of pan-cytokeratins and of EML4-ALK fusion protein in circulating tumour cells (CTCs) predicts outcome of non-small cell lung cancer (NSCLC) patients. Transl Lung Cancer Res. 2021;10(1):80–92.
40. Miles KA, Ganeshan B. Potential for texture analysis of hepatic CT to cost-effectively modify post-operative surveillance of patients with colorectal cancer. Vienna, Austria: Presented at the European Congress of Radiology; 2011. Available from: http://posterng.netkey.at/esr/viewing/index.php?module=viewing_poster&doi=10.1594/ecr2011/C-.
41. Miles KA, Ganeshan B. Selection of patients with advanced non small cell lung cancer for chemotherapy: potential cost-effectiveness of CT texture analysis. Vienna, Austria: Presented at European Congress of Radiology; 2012. Available From: http://posterng.netkey.at/esr/viewing/index.php?module=viewing_poster&task=viewsection&ti=352155.
42. Wu FZ, Kuo PL, Wu CC, et al. The impact of patients’ preferences on the decision of low-dose computed tomography lung cancer screening. Transl Lung Cancer Res. 2018;7(Suppl 3):S236–S238.
 © 2022 The Author(s). This work is published and licensed by Dove Medical Press Limited. The full terms of this license are available at https://www.dovepress.com/terms.php and incorporate the Creative Commons Attribution - Non Commercial (unported, v3.0) License.
By accessing the work you hereby accept the Terms. Non-commercial uses of the work are permitted without any further permission from Dove Medical Press Limited, provided the work is properly attributed. For permission for commercial use of this work, please see paragraphs 4.2 and 5 of our Terms.
© 2022 The Author(s). This work is published and licensed by Dove Medical Press Limited. The full terms of this license are available at https://www.dovepress.com/terms.php and incorporate the Creative Commons Attribution - Non Commercial (unported, v3.0) License.
By accessing the work you hereby accept the Terms. Non-commercial uses of the work are permitted without any further permission from Dove Medical Press Limited, provided the work is properly attributed. For permission for commercial use of this work, please see paragraphs 4.2 and 5 of our Terms.