Back to Journals » International Journal of Chronic Obstructive Pulmonary Disease » Volume 15
Prediction of Spirometric Indices Using Forced Oscillometric Indices in Patients with Asthma, COPD, and Interstitial Lung Disease
Authors Miyoshi S ![]() , Katayama H, Matsubara M, Kato T, Hamaguchi N
, Katayama H, Matsubara M, Kato T, Hamaguchi N ![]() , Yamaguchi O
, Yamaguchi O
Received 16 February 2020
Accepted for publication 12 June 2020
Published 1 July 2020 Volume 2020:15 Pages 1565—1575
DOI https://doi.org/10.2147/COPD.S250080
Checked for plagiarism Yes
Review by Single anonymous peer review
Peer reviewer comments 2
Editor who approved publication: Prof. Dr. Richard Russell
Seigo Miyoshi,1 Hitoshi Katayama,1 Minoru Matsubara,2 Takahide Kato,1 Naohiko Hamaguchi,1 Osamu Yamaguchi1
1Department of Cardiology, Pulmonology, Hypertension and Nephrology, Ehime University Graduate School of Medicine, Toon, Ehime 791-0295, Japan; 2Department of Internal Medicine, Sumitomo Besshi Hospital, Niihama, Ehime 792-8543, Japan
Correspondence: Seigo Miyoshi
Department of Cardiology, Pulmonology, Hypertension and Nephrology, Ehime University Graduate School of Medicine, Shitsukawa, Toon, Ehime 791-0295, Japan
Tel +81-89-960-5303
Fax +81-89-960-5306
Email [email protected]
Background and Objective: Spirometry is sometimes difficult to perform in elderly patients and patients with cognitive impairment. Forced oscillometry (FOT) is a simple, noninvasive technique used for measuring respiratory impedance. The aim of this study was to develop regression equations to estimate vital capacity (VC), forced vital capacity (FVC), and forced expiratory volume in 1 s (FEV1.0) on the basis of FOT indices and to evaluate the accuracy of these equations in patients with asthma, chronic obstructive pulmonary disease (COPD), and interstitial lung disease (ILD).
Materials and Methods: We retrospectively included data on 683 consecutive patients with asthma (388), COPD (128), or ILD (167) in this study. We generated regression equations for VC, FVC, and FEV1.0 by multivariate linear regression analysis and used them to estimate the corresponding values. We determined whether the estimated data reflected spirometric indices.
Results: Actual and estimated VC, FVC, and FEV1.0 values showed significant correlations (all r > 0.8 and P < 0.001) in all groups. Biases between the actual data and estimated data for VC, FVC, and FEV1.0 in the asthma group were − 0.073 L, − 0.069 L, and 0.017 L, respectively. The corresponding values were − 0.064 L, 0.027 L, and 0.069 L, respectively, in the COPD group and − 0.040 L, − 0.071 L, and − 0.002 L, respectively, in the ILD group. The estimated data in the present study did not completely correspond to the actual data. In addition, sensitivity for an FEV1.0/FVC ratio of < 0.7 and the diagnostic accuracy for the classification of COPD grade using estimated data were low.
Conclusion: These results suggest that our method is not highly accurate. Further studies are needed to generate more accurate regression equations for estimating spirometric indices based on FOT measurements.
Keywords: forced expiratory volume in 1 second, forced oscillation technique, forced vital capacity, spirometry, vital capacity
Plain Language Summary
Spirometry is the most commonly used pulmonary function test. However, the forceful expiratory and inspiratory maneuvers in spirometry require good patient cooperation. Elderly patients and patients with cognitive impairment sometimes face difficulties in undergoing spirometry. The forced oscillometry (FOT) is a simple, noninvasive technique used for measuring the resistance and reactance of the respiratory system. However, it is difficult to interpret the data obtained, because reference values of FOT data at a global level have not been established yet. We aimed to determine whether forced oscillometry (FOT) data reflect spirometric indices in patients with asthma, chronic obstructive pulmonary disease (COPD), and interstitial lung disease. We generated regression equations for vital capacity (VC), forced vital capacity (FVC), and forced expiratory volume in 1 s (FEV1.0) on the basis of FOT indices and used them to estimate the corresponding values. We determined whether the estimated data reflected spirometric indices. Actual and estimated spirometric indices showed significant correlations, and the root mean squared errors in the present study were smaller than those in our previous study. However, the estimated data in the present study did not completely correspond to the actual data. In addition, sensitivity for an FEV1.0/FVC ratio of <0.7 and diagnostic accuracy for COPD grade using estimated data were low. Further studies are needed to generate more accurate regression equations for estimating spirometric indices based on FOT measurements.
Introduction
Spirometry is widely used to assess indices of lung function, including vital capacity (VC), forced vital capacity (FVC), and forced expiratory volume in 1 s (FEV1.0), to diagnose respiratory diseases and to quantify the severity of respiratory impairment. However, its use may be sometimes difficult in elderly patients, patients with cognitive impairment, and those with severe respiratory distress, because maximum effort is required during forced expiratory maneuvers.1 Therefore, alternative methods for measuring lung function are needed for these populations.
The forced oscillometry (FOT) is a simple, noninvasive technique used for measuring the resistance and reactance of the respiratory system.2 It can be performed easily in pediatric patients3,4 and in adults who are unable to undergo spirometry.2,5 However, it is difficult to interpret the data obtained, because reference values of FOT data at a global level have not been established yet. Although several studies have reported the reference values of FOT data,6 it was also reported that the normal values of resistance (Rrs) and reactance (Xrs) differ depending on ethnicity, sex, standing height, age, body weight, oscillometric devices, and measuring techniques.7 In Japan, reference values for FOT measurements in middle-aged and elderly Japanese individuals have been published.8 However, 44.8% of the population included in that study had abnormal spirometric findings, and it is unclear how many subjects had abnormal chest radiography findings. Therefore, the reliability of these reference values is debatable.
To solve this problem, we previously generated regression equations to estimate VC, FVC, and FEV1.0 on the basis of FOT indices reported in our previous study.9 We demonstrated that estimated VC, FVC, and FEV1.0 correlated significantly with the actual data in both development and validation studies. However, the estimated data in the validation study did not show high accuracy. We hypothesized that this was a result of including heterogeneous subjects (healthy populations and patients with various respiratory diseases).
To verify the above hypothesis, we separately generated regression equations for VC, FVC and FEV1.0 in patients with asthma, chronic obstructive pulmonary disease (COPD), or interstitial lung disease (ILD) and estimated the corresponding values. Furthermore, we determined whether the estimated data reflected spirometric indices in each patient group.
Materials and Methods
Study Population
This retrospective study included data on consecutive patients who simultaneously underwent FOT and spirometry at Ehime University Hospital (n = 2294) between January 1, 2010 and December 31, 2017 and at Sumitomo Besshi Hospital (n = 1287) between April 1, 2013 and March 31, 2016 (In addition to patients included in the previous study,9 we included patients of Ehime University Hospital [January 1, 2016 to December 31, 2017] in this study). FOT was performed routinely in patients who visited the respiratory division of each of the participating institutions.
Subjects who were diagnosed with asthma, COPD, or ILD were included in this study. Subjects were excluded if they were unable to undergo spirometry simultaneously with FOT, were aged <17 years, were not Japanese, did not have asthma, COPD or ILD, or had overlapping respiratory diseases. Subjects whose spirometric performance did not meet the spirometry criteria of the American Thoracic Society (ATS)/European Respiratory Society (ERS)10 were also excluded.
Forced Oscillometry
Respiratory impedance was measured using a commercially available multifrequency impulse FOT device (MostGraph-01; Chest MI, Tokyo, Japan) as reported previously.11–13 The measurements were made in accordance with recent guidelines.6 Impulse oscillometry signals generated by a loudspeaker at intervals of 0.25 s were applied to the respiratory system through the mouthpiece during tidal breathing at rest. The mouth pressure and flow signals were recorded, which were used to calculate Rrs and Xrs against oscillatory frequency ranging from 4 Hz to 36 Hz. Coherence values of <0.9 and variability coefficients of Rrs of >10% were excluded. During measurements, patients were breathing in a relaxed and stable manner and seated in an upright posture with correct head position, cheek support, mouthpiece seal, and tongue position. Each patient took at least 60 s for the examination. The artefacts such as leaks, cough, glottis closure, or unusually large breaths were excluded. The acquisition was repeated until a minimum of three tidal breaths that met these requirements were obtained. Oscillatory index was expressed as the mean value during a respiratory (whole-breath) cycle, inspiratory and expiratory phases. The oscillatory index in the whole-breath phase was used. FOT was performed prior to spirometry.
Spirometry
Spirometry was performed according to the method described in the ATS/ERS guidelines.10 Pulmonary function indices, including VC, FVC, and FEV1.0, were measured by spirometry. Predicted normal values for VC, FVC, and FEV1.0 were calculated using the equation devised by the Japanese Respiratory Society, as reported previously.14 Pulmonary function indices were calculated as percentages of predicted normal values (described as %VC, %FVC and %FEV1.0).
Definitions
Diagnosis of asthma was based on the clinical history of characteristic symptom patterns (wheeze, shortness of breath, chest tightness, and cough that vary over time) and evidence of reversible airway obstruction. COPD was diagnosed using a post-bronchodilator ratio (FEV1.0/FVC) of <0.7 according to the Global Initiative for Obstructive Lung Disease criteria.15 In addition, a smoking history of more than 10 pack-years or long-term biomass exposure were included as eligibility criteria for COPD in this study. ILD was diagnosed in accordance with the clinical criteria established by the current ATS/ERS guidelines.16 Multidisciplinary diagnosis was made using clinical data such as presentation, exposures, smoking status, associated diseases, lung function, laboratory findings, and radiologic findings.
Calculation of Estimated VC, FVC, and FEV1.0
Previously, we identified parameters predictive of VC, FVC, and FEV1.0 using anthropometric variables (age, sex, height, and body weight) and FOT indices.9 According to the previously described method, we newly generated separate regression equations for VC, FVC and FEV1.0 for patients with asthma, COPD, and ILD and evaluated the degree of coincidence between actual and estimated data.
Statistical Analysis
The results are reported as mean ± standard deviation (SD). Differences between the groups were evaluated using Student’s t-test. Correlations between variables were determined using Pearson’s correlation coefficient. The correlation statistics were interpreted as slight (<0.2), fair (0.2–0.4), moderate (0.4–0.6), substantial (0.6–0.8), or almost perfect (>0.8) agreement.17 Multivariate linear regression analysis was performed to identify parameters predictive of VC, FVC, and FEV1.0 using age, sex, height, body weight, resistance of 5 Hz (R5), resistance of 20 Hz (R20), reactance of 5 Hz (X5), resonant frequency (Fres), and reactance area (ALX) as independent variables. The bias of the equations was expressed as the mean difference between the estimated data and the actual data (sum of [estimated data − actual data]/[N]). The root mean squared error (RMSE) was calculated as the square root of (sum of squared errors of the estimate/[N]). Agreement between the equations was evaluated with Bland-Altman plots using the 95% limits of agreement (LOA), which were calculated as the average difference ± 1.96 SDs. The 95% confidence intervals were computed for all variables. All tests were two-tailed, and a P-value of <0.05 was considered to be statistically significant. A kappa value of >0.6 was interpreted to be within a permissive range. All statistical analyses were performed using SPSS version 22 for Windows (IBM, Tokyo, Japan).
Results
Clinical Characteristics of Patients in the Study
Among the 3581 subjects identified, 3113 underwent spirometry simultaneously with FOT. The subjects who did not meet inclusion criteria (n = 2015) and those with suboptimal spirometry data (n = 415) were excluded; finally, data from 683 subjects (378 men, 305 women) were included in the final analysis (Figure 1). Among them, 388 subjects had asthma, 128 subjects had COPD, and 167 subjects had ILD.
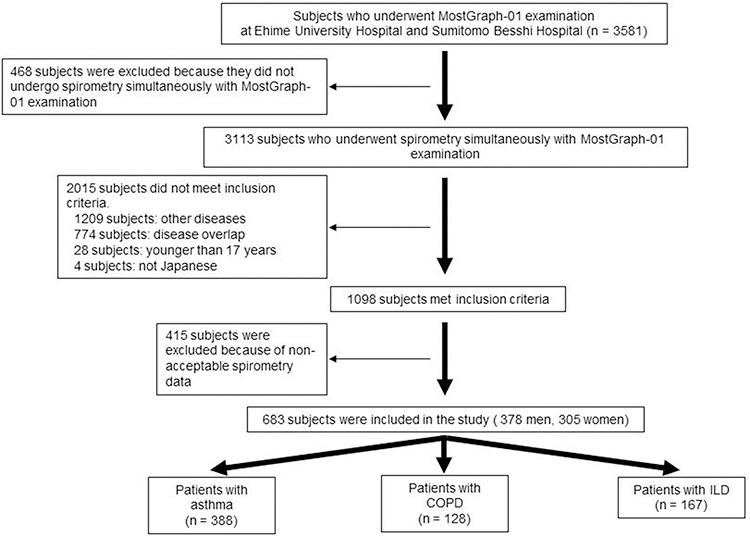 |
Figure 1 Flow chart showing recruitment of study participants. Abbreviations: COPD, chronic obstructive pulmonary disease; ILD, interstitial lung disease. |
The characteristics of each patients group are presented in Table 1. Patients of the asthma group were younger than those of the other groups, and spirometry data of most patients were within the normal limits. FEV1.0/FVC and %FEV1.0 were significantly lower in the COPD group than in the other groups. %VC was significantly lower in the ILD group than in the other groups. With regard to FOT data, R20 values were significantly higher in the asthma group than in the other groups. X5 values were significantly lower and Fres and ALX values were significantly higher in the COPD group than in the other groups.
 |
Table 1 Characteristics of Study Subjects |
Correlations Between Spirometry and FOT Data
Statistically significant correlations were observed between most spirometric and FOT parameters in all the groups (Table 2). R5 and R20 showed slight to moderate correlations with all spirometric data in all the groups. X5, Fres, and ALX demonstrated moderate or substantial correlations with VC, %VC, FVC, %FVC, FEV1.0, and %FEV1.0 in all the groups. FEV1.0/FVC showed a relatively lower degree of correlation with all the FOT parameters than did the other spirometric parameters.
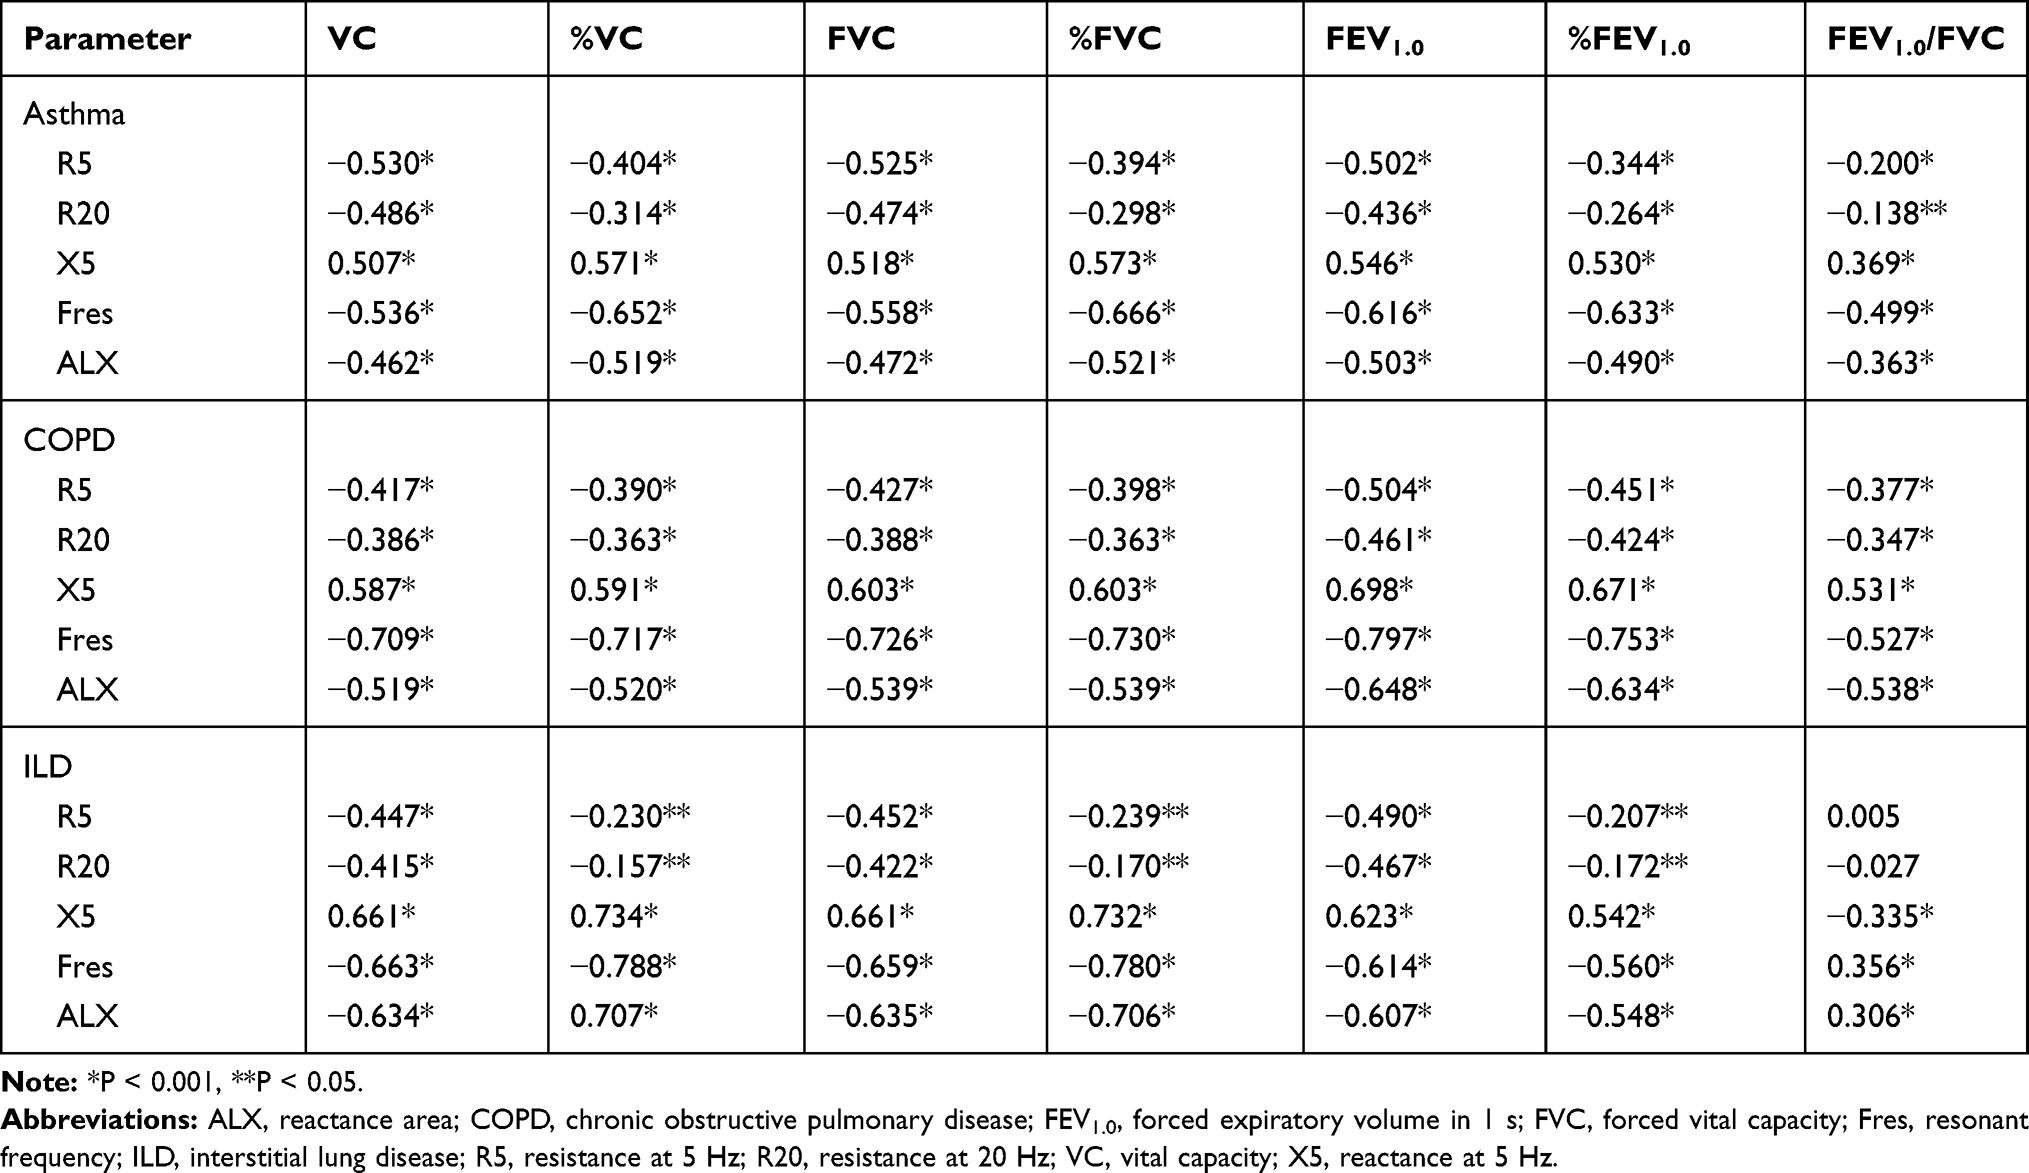 |
Table 2 Correlations Between Spirometric and MostGraph-01 Data |
Calculation of Estimated VC, FVC, and FEV1.0
We identified the parameters predictive of VC, FVC, or FEV1.0, using age, sex, height, and body weight, along with FOT parameters, as independent variables. The results of multivariate linear regression analysis are shown in Table 3–5. On the basis of these results, we generated regression equations for VC, FVC, and FEV1.0 in each patient with asthma, COPD, and ILD (Table 6).
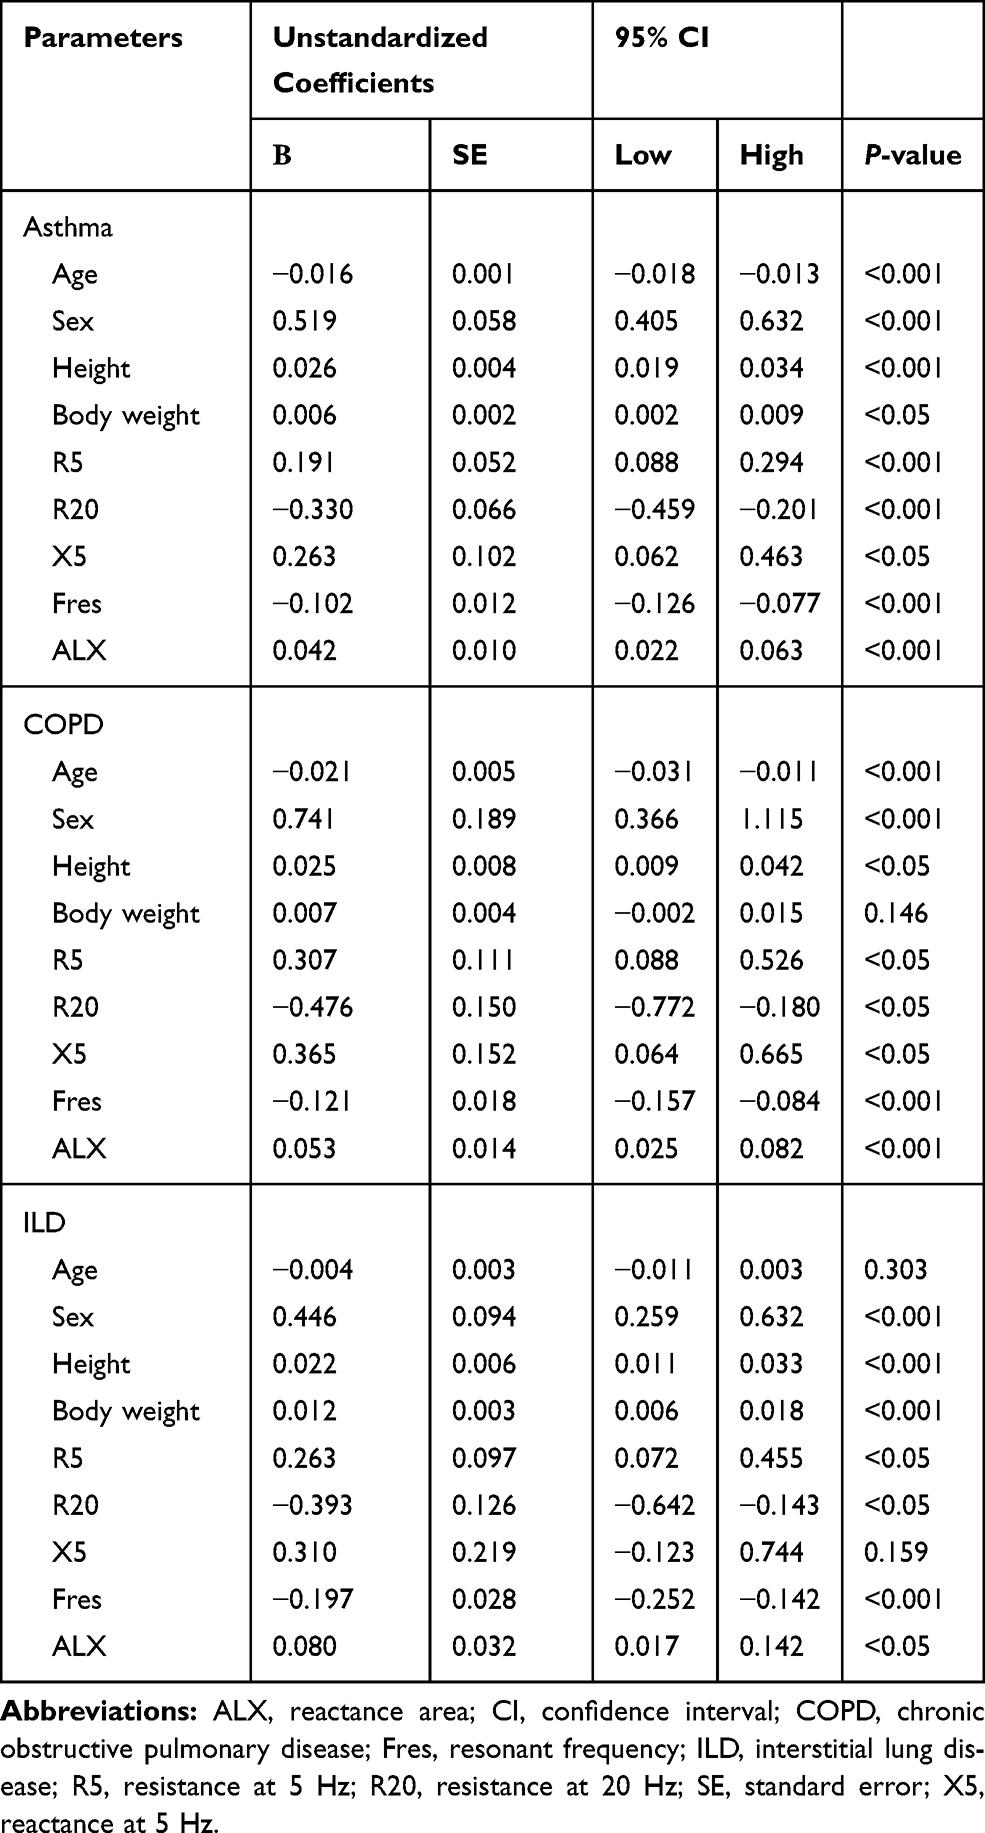 |
Table 3 Regression Coefficients for Parameters Predictive of Vital Capacity |
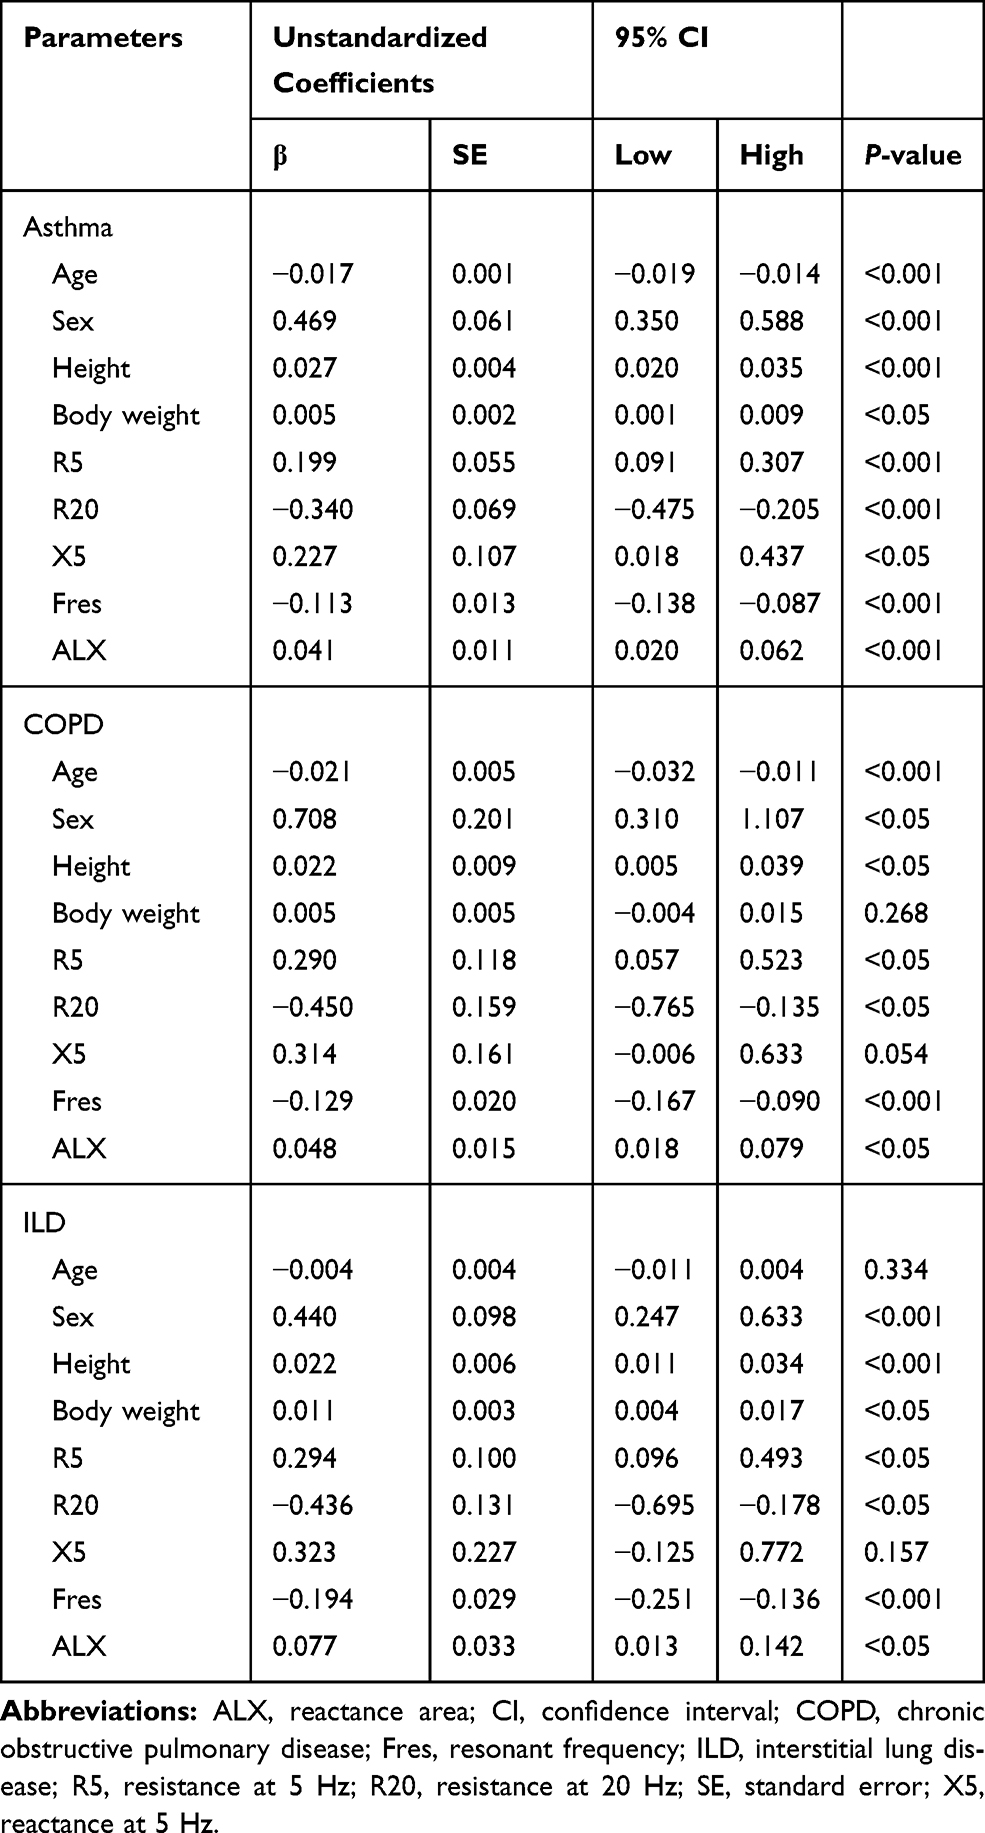 |
Table 4 Regression Coefficients for Parameters Predictive of Forced Vital Capacity |
 |
Table 5 Regression Coefficients for Parameters Predictive of Forced Expiratory Volume in 1 s |
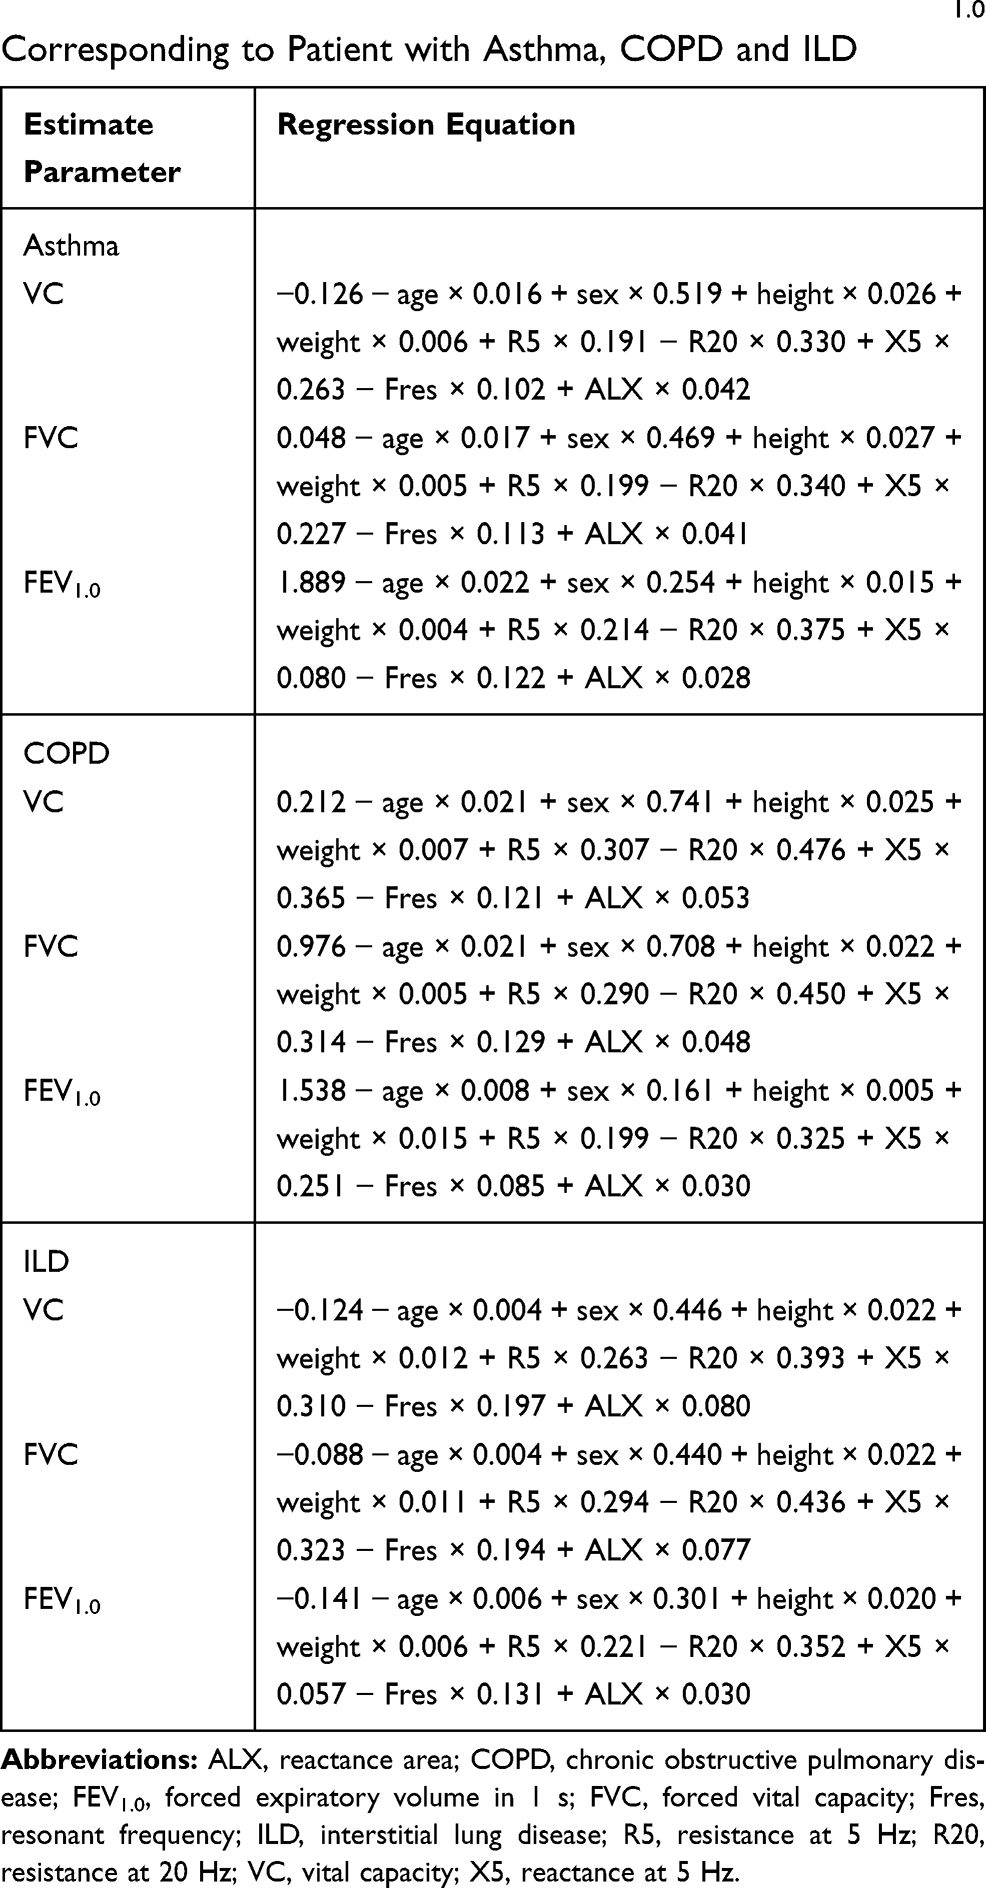 |
Table 6 Regression Equations for VC, FVC, and FEV1.0 Corresponding to Patient with Asthma, COPD and ILD |
Correlations Between Actual and Estimated VC, FVC, and FEV1.0
We observed statistically significant correlations between the actual and estimated VC, FVC, and FEV1.0 (all P <0.001; Figure 2, Table 7). The estimated VC, FVC, and FEV1.0 demonstrated an almost perfect correlation with the actual VC, FVC, and FEV1.0 in all the groups. In addition, differences between actual and estimated VC, FVC, and FEV1.0 were relatively small in all the groups. However, the estimated data in the present study are still not identical to the actual data. The Bland-Altman plots are shown in Figure 3. The 95% LOA values are shown in Table 7.
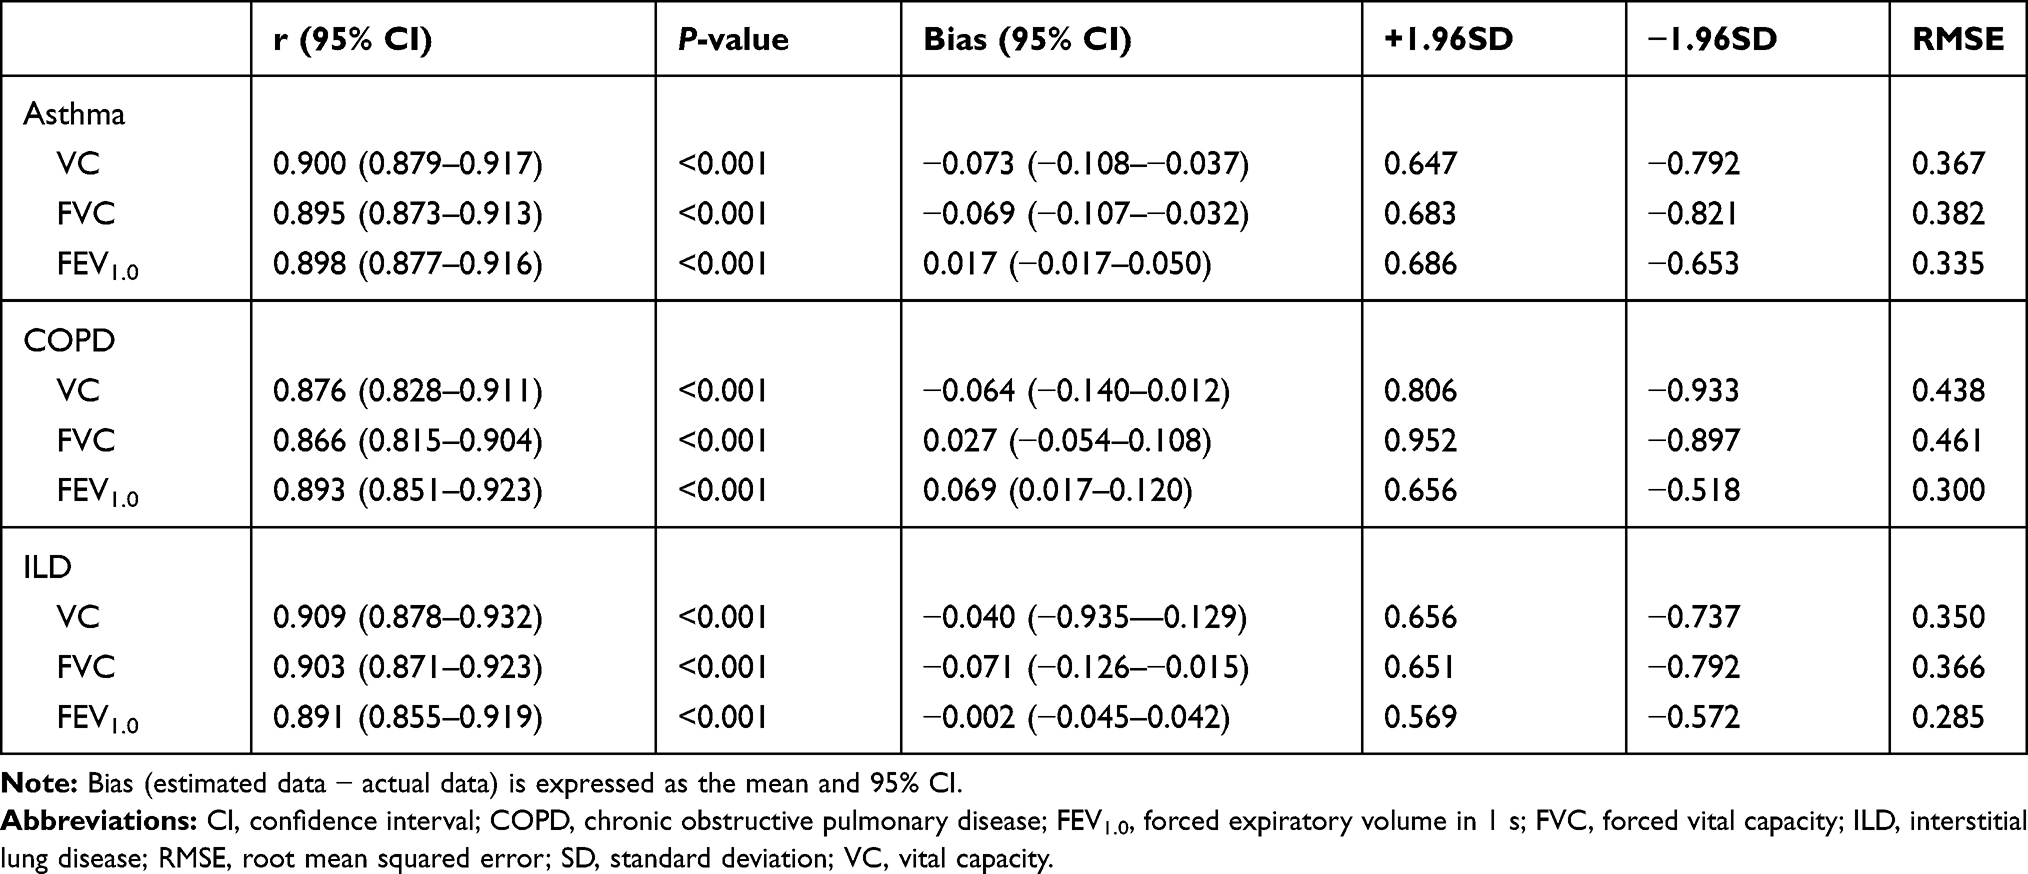 |
Table 7 Correlation Between Actual and Estimated Data and Performance of Estimation Equations |
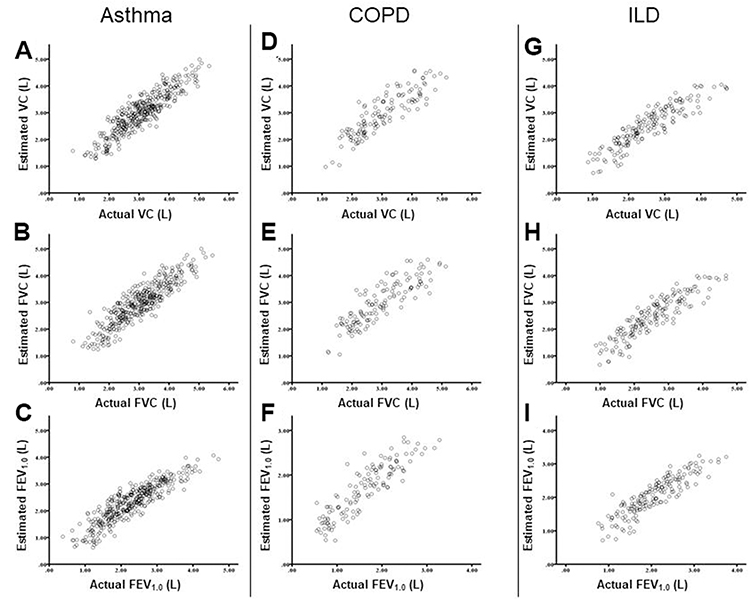 |
Figure 2 Correlations between actual and estimated VC, FVC, and FEV1.0 in patients with asthma (A–C), COPD (D–F) and ILD (G–I). Abbreviations: COPD, chronic obstructive pulmonary disease; FEV1.0, forced expiratory volume in 1 s; FVC, forced vital capacity; ILD, interstitial lung disease; VC, vital capacity. |
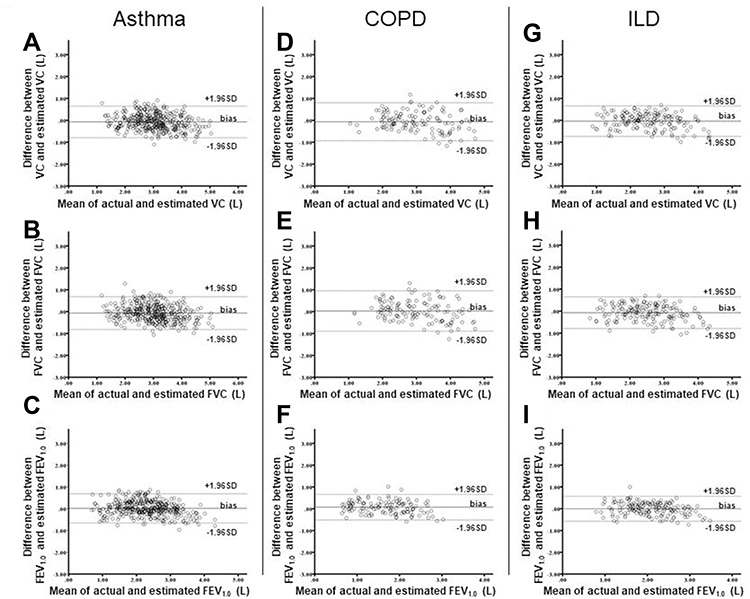 |
Figure 3 Bland-Altman plots comparing actual and estimated VC, FVC, and FEV1.0 in patients with asthma (A–C), COPD (D–F) and ILD (G–I). The bias of the equations is expressed as the mean difference between the estimated data and the actual data (sum of [estimated data − actual data]/[N]). Abbreviations: COPD, chronic obstructive pulmonary disease; FEV1.0, forced expiratory volume in 1 s; FVC, forced vital capacity; ILD, interstitial lung disease; SD, standard deviation; VC, vital capacity. |
Diagnostic Accuracy of Estimated Data for an FEV1.0/FVC Ratio of <0.7 and Classification of COPD Grade
We evaluated the diagnostic accuracy of an FEV1.0/FVC ratio of <0.7 and percentage error for the classification of severity of COPD. As shown in Table 8, kappa value for an FEV1.0/FVC ratio of <0.7 was within a permissible range. However, the sensitivity of an FEV1.0/FVC ratio of <0.7 was relatively low. In addition, the diagnostic accuracy and kappa value for the classification of COPD grade were low.
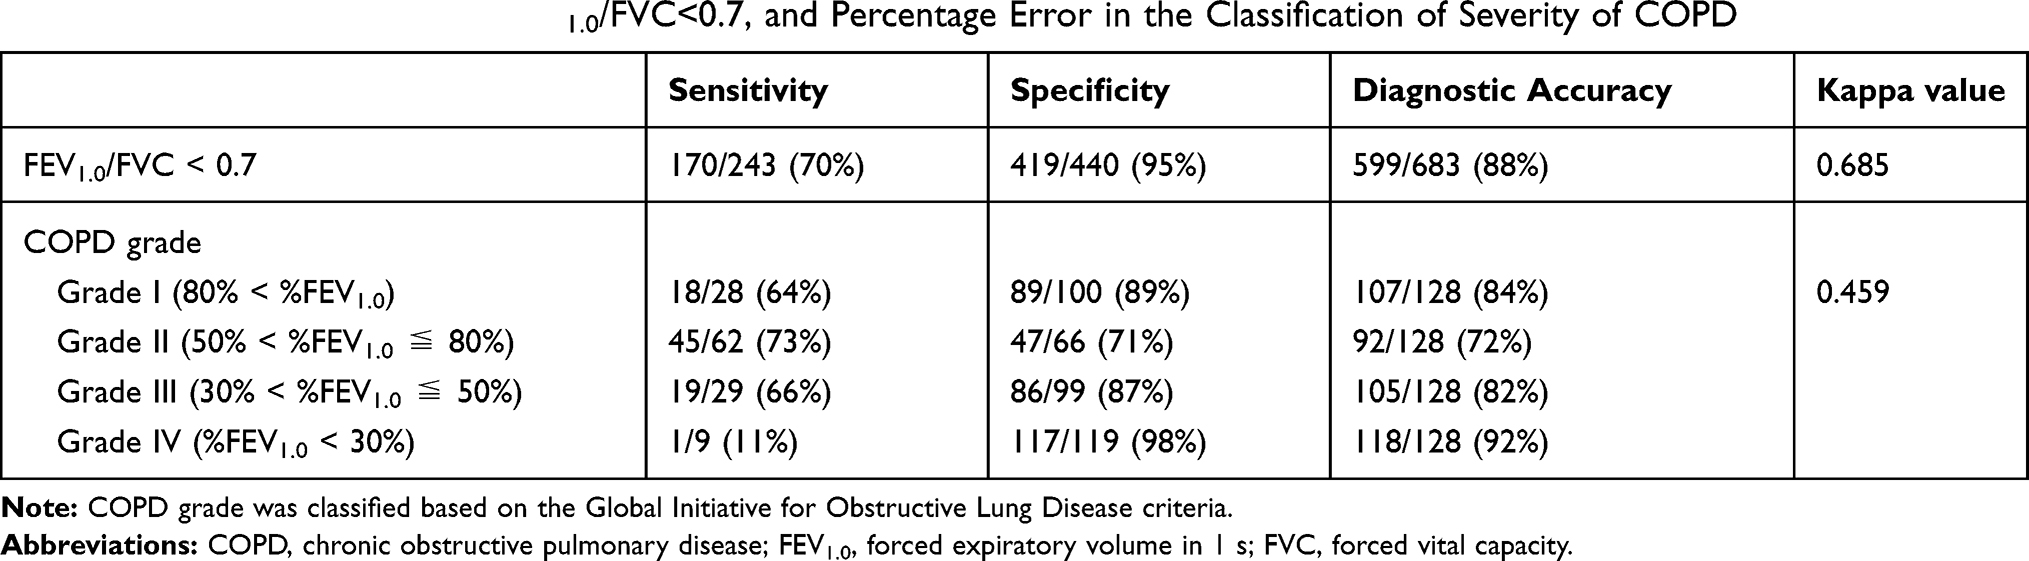 |
Table 8 Diagnostic Accuracy of FEV1.0/FVC<0.7, and Percentage Error in the Classification of Severity of COPD |
Discussion
In the present study, separate regression equations for patients with asthma, COPD, and ILD were newly generated and the degree of coincidence between the actual and estimated data was evaluated. The estimated data showed significant correlations with the actual data in all the groups, and the mean differences between the actual and estimated data were relatively small in all the groups. However, the estimated data in the present study are still not identical to the actual data.
The present study demonstrated that most of the FOT indices were significantly correlated with spirometric indices in the asthma, COPD, and ILD groups. Previous studies have reported significant correlations between R5 and FEV1.0 and between Xrs and FEV1.0 in patients with asthma and COPD.18,19 Correlations between R20 and FEV1.0 in patients with asthma were also reported.18 In addition, X5, Fres, and ALX are reportedly correlated with %FVC and %FEV1.0 in patients with ILD.13 Similar to the results of these previous reports, the results of our study showed significant correlations between most FOT indices and spirometric indices in patients with asthma, COPD, and ILD.
In our previous report, the estimated data in the validation study did not show high accuracy.9 The previous study had included healthy subjects and patients with various respiratory diseases, which is possibly the reason behind this low accuracy. FOT measures the impedance of the respiratory system, which includes the resistance and reactance of the respiratory system. Rrs reflects the dissipative mechanical property of the lung (viscous resistance). Rrs increases with an increase in airway obstruction, implying that Rrs is supposed to be a measure of airway caliber.20 Xrs is supposed to reflect the elastic and inertial properties of the lung. Previous reports showed that Fres may be a measure of both large and small airway function in COPD and a measure of increased lung elastic recoil resulting from fibrosis in ILD.13 In addition, it was reported that X5 is a numerically negative value that is thought to be inversely related to the lung compliance.21 FOT can sensitively detect increased airway resistance. Therefore, FOT has been used primarily for patients with obstructive lung diseases such as asthma and COPD.1,3,4,11,12 On the contrary, Sugiyama et al reported that breath change in X5 may be a distinguishable characteristic of ILD rather than that in asthma or COPD.22 It was also reported that Fres and ALX were significantly higher in patients with COPD than in those with asthma.22 R5 and R20 were significantly lower in patients with ILD than in those with asthma, and Fres and ALX were significantly lower in patients with ILD than in those with COPD. The present study also showed significant differences in several FOT parameters between the asthma, COPD, and ILD groups (Table 1). Hence, we think that FOT data may indicate several features associated with each disease, and the data estimated using the generated regression equations may be more accurate in each disease.
We separately generated regression equations for asthma, COPD, and ILD and evaluated the degree of coincidence between the actual and estimated data. The VC, FVC, and FEV1.0 values estimated in this study showed a higher correlation with the actual values than those estimated using equation 2 in our previous study. The VC, FVC, and FEV1.0 values estimated in the present study had a lower RMSE than did those obtained using equation 2 in our previous study, except for estimated FVC in patients with COPD. However, the estimated data in the present study are still not identical to the actual data. In addition, the sensitivity of an FEV1.0/FVC ratio of <0.7 and the diagnostic accuracy for the classification of the COPD grade using estimated data were low. Further studies are needed to generate more accurate regression equations for spirometric indices based on FOT measurements.
Spirometry is the most commonly used pulmonary function test. Diagnosis of COPD requires spirometry. Spirometry can be used to evaluate other obstructive pulmonary diseases, including asthma, and restrictive pulmonary diseases, such as ILD. However, the forceful expiratory and inspiratory maneuvers in spirometry require good patient cooperation. Elderly patients and patients with cognitive impairment sometimes face difficulties in undergoing spirometry. Actually, studies concerning the quality of spirometry showed that only 33.4% of the elderly patients were able to undergo spirometry such that all the quality criteria defined by ATS/ERS guidelines are fulfilled23 and that this proportion was even lower in the advanced elderly patients.24–26 Our methods may have a potential clinical usability for evaluating lung function indices in such patients.
There are several limitations to this study. First, the present study was retrospective in nature. Second, the number of patients in each group was small. Third, no children were evaluated. Fourth, we used the MostGraph-01 to measure respiratory impedance, but not the MasterScreen IOS-J (CareFusion, San Diego, CA, USA). A previous report showed that these devices do not necessarily generate identical impedance values.27 Fifth, this study included only Japanese subjects. Sixth, our analysis used the oscillatory index in the whole-breath phase, but not the inspiratory or expiratory phases. Reportedly, breath-dependent changes in FOT data may be useful in assessing respiratory diseases.12,22 Seventh, the number of excluded subjects based on non-acceptability of spirometric data was relatively high (38% of population). The present study had included data on many patients who came to the participating institutions at first visit and had symptoms such as cough, sputum, and dyspnea. In such patients, it was difficult to perform adequate spirometry. In addition, some elderly patients were not able to perform adequate spirometry-related maneuvers because of asynesis. Eighth, we did not evaluate the validity of regression equations using a separate data set.
Conclusion
The VC, FVC, and FEV1.0 values estimated in this study showed a higher correlation with the actual values than those estimated in our previous study. However, the estimated data in the present study did not completely correspond to the actual data. Further studies are needed to generate more accurate regression equations for spirometric indices based on FOT measurements.
Abbreviations
95% LOA, 95% limits of agreement; ATS, American Thoracic Society; COPD, chronic obstructive pulmonary disease; ERS, European Respiratory Society; FEV1.0, forced expiratory volume in 1 s; FOT, forced oscillometry; FVC, forced vital capacity; ILD, interstitial lung disease; Rrs, resistance; SD, standard deviation; VC, vital capacity; Xrs, reactance.
Ethics Approval and Informed Consent
The study protocol was approved by the ethical committees of Ehime University Hospital (Institutional Review Board number; 1,907,004) and Sumitomo Besshi Hospital (Institutional Review Board number; 155). The need for patient consent was waived because this was a noninterventional and retrospective study. However, participants were allowed to opt out of the study. We confirm that patient confidentiality was maintained.
Disclosure
All authors declare no potential conflicts of interest with regard to this work.
References
1. Kubota M, Shirai G, Nakamori T, Kokubo K, Masuda N, Kobayashi H. Low frequency oscillometry parameters in COPD patients are less variable during inspiration than during expiration. Respir Physiol Neurobiol. 2009;166(2):73–79. doi:10.1016/j.resp.2009.01.007
2. Bickel S, Popler J, Lesnick B, Eid N. Impulse oscillometry: interpretation and practical applications. Chest. 2014;146(3):841–847. doi:10.1378/chest.13-1875
3. Komarow HD, Skinner J, Young M, et al. A study of the use of impulse oscillometry in the evaluation of children with asthma: analysis of lung parameters, order effect, and utility compared with spirometry. Pediatr Pulmonol. 2012;47(1):18–26. doi:10.1002/ppul.21507
4. Takeda T, Oga T, Niimi A, et al. Relationship between small airway function and health status, dyspnea and disease control in asthma. Respiration. 2010;80(2):120–126. doi:10.1159/000242113
5. Tomalak W, Czajkowska-Malinowska M, Radliński J. Application of impulse oscillometry in respiratory system evaluation in elderly patients. Pneumonol Alergol Pol. 2014;82(4):330–335. doi:10.5603/PiAP.2014.0041
6. King GG, Bates J, Berger KI, et al. Technical standards for respiratory oscillometry. Eur Respir J. 2020;55(2):1900753. doi:10.1183/13993003.00753-2019
7. Gupta S, Kabra SK. Indigenous regression equations for forced oscillation technique—a much needed affair. Indian J Pediatr. 2020;87(3):173–174. doi:10.1007/s12098-020-03194-2
8. Abe Y, Shibata Y, Igarashi A, et al. Reference values of MostGraph measures for middle-aged and elderly Japanese individuals who participated in annual health checkups. Respir Investig. 2016;54(3):148–155. doi:10.1016/j.resinv.2015.12.004
9. Yamamoto S, Miyoshi S, Katayama H, et al. Use of the forced-oscillation technique to estimate spirometry values. Int J Chron Obstruct Pulmon Dis. 2017;12:2859–2868. doi:10.2147/COPD.S143721
10. Miller MR, Hankinson J, Brusasco V, et al. ATS/ERS task force. standardisation of spirometry. Eur Respir J. 2005;26(2):319–338. doi:10.1183/09031936.05.00034805
11. Shirai T, Mori K, Mikamo M, et al. Respiratory mechanics and peripheral airway inflammation and dysfunction in asthma. Clin Exp Allergy. 2013;43(5):521–526. doi:10.1111/cea.12083
12. Mikamo M, Shirai T, Mori K, et al. Predictors of expiratory flow limitation measured by forced oscillation technique in COPD. BMC Pulm Med. 2014;14(1):23. doi:10.1186/1471-2466-14-23
13. Fujii M, Shirai T, Mori K, et al. Inspiratory resonant frequency of forced oscillation technique as a predictor of the composite physiologic index in interstitial lung disease. Respir Physiol Neurobiol. 2015;207:22–27. doi:10.1016/j.resp.2014.12.009
14. Kubota M, Kobayashi H, Quanjer PH, et al. Reference values for spirometry, including vital capacity, in Japanese adults calculated with the LMS method and compared with previous values. Respir Investig. 2014;52(4):242–250. doi:10.1016/j.resinv.2014.03.003
15. Global Initiative for Chronic Obstructive Lung Disease. Global strategy for prevention, diagnosis and management of COPD. Available from: http://www.goldcopd.org/.
16. American Thoracic Society; European Respiratory Society. American Thoracic Society/European Respiratory Society International multidisciplinary consensus classification of the idiopathic interstitial pneumonias. This joint statement of the American Thoracic Society (ATS), and the European Respiratory Society (ERS) was adopted by the ATS board of directors, June 2001 and by the ERS Executive Committee, June 2001. Am J Respir Crit Care Med. 2002;165(2):277–304. doi:10.1164/ajrccm.165.2.ats01
17. Landis JR, Koch GG. The measurement of observer agreement for categorical data. Biometrics. 1977;33(1):159–174. doi:10.2307/2529310
18. Shirai T, Kurosawa H. Clinical application of the forced oscillation technique. Intern Med. 2016;55(6):559–566. doi:10.2169/internalmedicine.55.5876
19. Mori K, Shirai T, Mikamo M, et al. Colored 3-dimensional analyses of respiratory resistance and reactance in COPD and asthma. COPD. 2011;8(6):456–463. doi:10.3109/15412555.2011.626818
20. Di Mango AM, Lopes AJ, Jansen JM, Melo PL. Changes in respiratory mechanics with increasing degrees of airway obstruction in COPD: detection by forced oscillation technique. Respir Med. 2006;100(3):399–410. doi:10.1016/j.rmed.2005.07.005
21. Kolsum U, Borrill Z, Roy K, et al. Impulse oscillometry in COPD: identification of measurements related to airway obstruction, airway conductance and lung volumes. Respir Med. 2009;103(1):136–143. doi:10.1016/j.rmed.2008.07.014
22. Sugiyama A, Hattori N, Haruta Y, et al. Characteristics of inspiratory and expiratory reactance in interstitial lung disease. Respir Med. 2013;107(6):875–882. doi:10.1016/j.rmed.2013.03.005
23. Czajkowska-Malinowska M, Tomalak W, Radliński J. Quality of spirometry in the elderly. Pneumonol Alergol Pol. 2013;81(6):511–517.
24. Pezzoli L, Giardini G, Consonni S, et al. Quality of spirometric performance in older people. Age Ageing. 2003;32(1):43–46. doi:10.1093/ageing/32.1.43
25. Vaes B, Pasquet A, Wallemacq P, et al. The BELFRAIL (BFC80+) study: a population-based prospective cohort study of the very elderly in Belgium. BMC Geriatr. 2010;10(1):39. doi:10.1186/1471-2318-10-39
26. Gurina NA, Frolova EV, Degryse JM. A roadmap of aging in Russia: the prevalence of frailty in community-dwelling older adults in the St. Petersburg district–the “Crystal” study. J Am Geriatr Soc. 2011;59(6):980–988. doi:10.1111/j.1532-5415.2011.03448.x
27. Tanimura K, Hirai T, Sato S, et al. Comparison of two devices for respiratory impedance measurement using a forced oscillation technique: basic study using phantom models. J Physiol Sci. 2014;64(5):377–382. doi:10.1007/s12576-014-0329-4
 © 2020 The Author(s). This work is published and licensed by Dove Medical Press Limited. The
full terms of this license are available at https://www.dovepress.com/terms
and incorporate the Creative Commons Attribution
- Non Commercial (unported, 3.0) License.
By accessing the work you hereby accept the Terms. Non-commercial uses of the work are permitted
without any further permission from Dove Medical Press Limited, provided the work is properly
attributed. For permission for commercial use of this work, please see paragraphs 4.2 and 5 of our Terms.
© 2020 The Author(s). This work is published and licensed by Dove Medical Press Limited. The
full terms of this license are available at https://www.dovepress.com/terms
and incorporate the Creative Commons Attribution
- Non Commercial (unported, 3.0) License.
By accessing the work you hereby accept the Terms. Non-commercial uses of the work are permitted
without any further permission from Dove Medical Press Limited, provided the work is properly
attributed. For permission for commercial use of this work, please see paragraphs 4.2 and 5 of our Terms.