
Back to Journals » Cancer Management and Research » Volume 18

Prediction of Prostate Adenocarcinoma Recurrence Prognosis and Immune Status Through 6-Acetoxy-Anopterine Resistance-Associated Programmed Cell Death Genes
Received 8 July 2025
Accepted for publication 2 December 2025
Published 31 January 2026 Volume 2026:18 552328
DOI https://doi.org/10.2147/CMAR.S552328
Checked for plagiarism Yes
Review by Single anonymous peer review
Peer reviewer comments 2
Editor who approved publication: Professor Seema Singh
Jie Cheng,1 Dongdong Mao2
1Department of Anesthesiology, Affiliated Hospital of Shandong Second Medical University, Weifang, Shandong, People’s Republic of China; 2Department of Urology, Affiliated Hospital of Shandong Second Medical University, Weifang, Shandong, People’s Republic of China
Correspondence: Dongdong Mao, Email [email protected]
Purpose: This study aims to reveal the potential mechanism and potential prognostic markers of programmed cell death (PCD) genes associated with 6-acetoxy-anopterine (6-AA) resistance in prostate adenocarcinoma (PRAD).
Patients and Methods: The differentially expressed programmed cell death genes (DEPGs) associated with 6-AA resistance were revealed based on the The Cancer Genome Atlas (TCGA)-PRAD database. Then, a prognostic risk prediction model was established. Moreover, the relationship between the risk model and the immune microenvironment of PRAD samples was revealed, followed by the characteristics and mechanisms investigation of immune cell infiltration in different risk groups. Furthermore, the application prospects of the risk model in predicting drug response sensitivity were explored. Finally, the verification analysis was performed on signature genes using qPCR analysis.
Results: A total of totally 57 DEPGs were screened, and these genes mainly assembled in cysteine-type endopeptidase activity functions. The nomogram and survival analysis proved the prognostic value of signatures. Immune infiltration analysis revealed the dyregulation of memory CD4+ T cells between different risk groups. Moreover, 3 clusters were revealed in current study. Finally, the mRNA expression levels of six signatures (TOP2A, PABPN1, BCL2L12, TRIM14, PIK3R1 and LAPTM4B) in the verification analysis were consistent with the findings of our current bioinformatic study.
Conclusion: TOP2A, PABPN1, BCL2L12, TRIM14, PIK3R1 and LAPTM4B were novel PCD-related prognostic markers for PRAD. BCL2L12 might take part in the resistance of 6-AA in PRAD via the cysteine-type endopeptidase activity pathway.
Keywords: prostate adenocarcinoma, programmed cell death, 6-acetoxy-anopterine resistance, prognostic gene, qPCR
Introduction
Prostate adenocarcinoma (PRAD) is a common cancer among men, with its incidence and mortality rates steadily increasing worldwide.1 Despite significant advancements in the early diagnosis and treatment of PRAD, recurrence and metastasis remain critical clinical challenges.2 Especially for patients with advanced or metastatic prostate cancer, traditional treatment methods such as androgen deprivation therapy and chemotherapy often fail due to tumor cell resistance, leading to poor prognosis.3 Thus, revealing the detail molecular mechanism and key gene associated with drug resistance are critical for the clinical intervention of PRAD.
In recent years, with the development of molecular biology techniques, many researchers focused on programmed cell death (PCD) in tumor cells and its role in anticancer drug resistance, since recent studies have indicated that chemoresistance is facilitated by disrupting or circumventing apoptotic cell death mechanisms.4 PCD is an important mechanism for cellular self-regulation, playing a crucial role in maintaining tissue homeostasis and resisting tumor development.5 Recent studies discovered that YAP signaling plays an important role in the regulation of PCD in cancer, and it is reported that YAP signaling regulates PCD and drug resistance in cancer.6 Also, the abnormal regulation of PCD-related genes (DRGs) or pathways are closely associated with occurrence, development and molecular drug resistance.7 It has been proved that PCD contributes to the progression of PRAD via participating in the necroptosis and pyroptosis process.8 Li et al have highlighted that PLAG1 interacts with GPX4 to conquer vulnerability to sorafenib induced ferroptosis through a PVT1/miR-195-5p axis-dependent manner in hepatocellular carcinoma.9 Wang et al have revealed that inhibition of TPI1 sensitizes cisplatin-resistant oral cancer to ferroptosis.10 Guo et al developed an immune-based prognostic model utilizing four identified DRGs, which were subsequently chosen as predictors for the robust prognostic model of PRAD.11 Actually, during the biological function of PCD, the DRGs are commonly associated with inflammation-related pathway, which further participating in the immune therapy and drug resistance of cancer.12 For instance, Liu et al have found that CPLX1 is a novel prognostic biomarker in colorectal cancer correlating with immunotherapy resistance and ferroptosis.13 NOXA is a BCL2 family protein, and it is reported that NOXA as a pivotal regulator of resistance to CAR T-cell therapy by impairing apoptosis of tumor cells, and low NOXA expression in tumor samples is correlated with worse survival in a tandem CD19/20 CAR T clinical trial in relapsed/refractory B-cell lymphoma.14 As a novel anticancer drug, 6-acetoxy-anopterine (6-AA) is a natural product belonging to the organic compound family. Extracted from a plant called anopterus macleayanus, 6-AA shows promising potential as an anti-cancer compound. Studies have revealed its efficacy in inhibiting various cancer cells, suggesting its role as a potent anticancer agent in PRAD.15 However, its detailed pharmacology and clinical applications are still under research. Although 6-AA is not widely used in clinical currently, the development of drug resistance might greatly limit its clinical efficacy. Therefore, exploring the role of DRGs in PRAD, especially those related to drug resistance of 6-AA, has important clinical significance.
In this study, we screened differentially expressed programmed cell death genes (DEPGs) associated with 6-AA resistance based on the TCGA-PRAD database. Then, a prognostic risk prediction model was established to evaluate the potential role of these genes in the survival outcomes of PRAD. Moreover, the relationship between the risk model and the immune microenvironment of PRAD samples was revealed, followed by the characteristics and mechanisms investigation of immune cell infiltration in different risk groups. Finally, the application prospects of the risk model in predicting drug response sensitivity were explored. We aim to reveal the key roles of 6-AA resistance-related PCD genes in the prognosis and immune status of disease recurrence, thereby providing new insights and targets for clinical treatment strategies for patients with PRAD.
Materials and Methods
Microarray Data and Pre-Processing
RNA-seq data (log2(fpkm+1)) from The Cancer Genome Atlas (TCGA)-PRAD, along with related clinical information, were retrieved from the TCGA database. The samples were included in this study with the following exclusion criteria: (a) Samples with missing or zero recurrence-free survival (RFS) times; (b) Deletion of missing values and unexpressed genes exceeding 50% of the total sequenced number; (c) Samples with over 50% missing values or unexpressed genes; (d) All expression values are log2 logarithmic processed. Finally, a total of 52 normal samples and 490 tumor samples were enrolled in current TCGA dataset. Meanwhile, the microarray datasets GSE54460 (including 106 PRAD samples with complete RFS prognostic information)16 in Gene Expression Omnibus (GEO) database were enrolled in current study. The platform for GSE54460 was GPL11154 Illumina HiSeq 2000 (Homo sapiens). In addition, GSE8127715 (platform: GPL16604 Agilent-032034 VPC Human 180K v3) including 3 6-AA-sensitive samples and 4 6-AA-resistant samples were obtained from GEO database.
DEPGs Investigation
The classic Bayesian approach from the limma package (version 3.10.3) in R17 was employed to identify the DEGs between tumor and normal samples in the TCGA dataset. in R was used to reveal the DEGs in tumor samples vs normal samples in TCGA dataset. The Benjamini & Hochber (BH) adjusted P-value < 0.05 and |log2FC| > 0.5 were selected as the thresholds for DEGs investigation. The results were visualized by volcano plot. Then, DEGs between 6-AA-resistant samples and 6-AA-sensitive samples in GSE81277, identified using the Wilcoxon test with P < 0.05, were considered as 6-AA-specific genes. Finally, based on a review of previous literature,18,19 the genes related to PCD were investigated. Based on the online tool Venny, we intersected the PCD genes with DEGs and 6-AA-specific genes to identify DEPGs for further analysis.
Enrichment Analysis on DEPGs
GO function and KEGG pathway analysis were performed on DEPGs using clusterProfiler package (version: 4.0.5) in R.20 The GO functions including biological process (BP), cellular components (CC), and molecular function (MF). The Benjamini & Hochberg method was used for multiple test corrections, and the corrected P-value (adj. P value) was obtained. The adj. P < 0.05 and Count ≥ 2 were used as the cut-off value. The top 10 result of GO and KEGG enrichment was visualized using bar chart.
Prognostic Signature Investigation
The univariate Cox regression investigation was applied on DEPGs genes to reveal prognostic genes using a cut-off value of P < 0.05. Then, we utilized Least absolute shrinkage and selection operator (LASSO) Cox regression within R (version: 3.6.1)21 to explore the most advantageous gene collection among prognostic genes within TCGA samples with a 10-fold cross-validation. Then, the following formula was utilized to establish Riskscore (RS) model:

In the formula, β denoted the regression coefficient, h0(t) represented the baseline hazard rate, and h (t, X) was the hazard rate at time t associated with X (the covariates). Then, the RS for each sample in TCGA and GEO dataset were computed using the risk score calculation formula, and samples were divided into two risk groups (high and low) based on the RS median value for survival analysis comparison. Subsequently, the kaplan-Meier (KM) curve in survival package of R was used to assess the association between risk grouping and the actual survival prognosis information.
The Prognostic Evaluation for Signature
By integrating clinical data of prostate cancer, the association among the RS and clinical information including T stage and Gleason score were investigated. To further explore the prognostic independence of clinical factors and RS, the clinical factors and RS from the PRAD data were analyzed by using both univariate and multivariate Cox regression. Independent prognostic factors were identified using a threshold of P < 0.05, followed by visualized by forest plot. Then, a nomogram was constructed by the value nomoScore of signatures by using rms package (version: 6.3-0)22 in R. We assessed group differences and used ROC analysis to compute the survival AUC.
Immune Infiltration and Correlation Analysis
The CIBERSORT methodology23 was applied to estimate the levels of infiltration of 22 types of immune cells within the tumor samples with the cutoff value of P < 0.05, and the parameters were set as “perm = 50, QN = TRUE”. To reveal disparities in immune cell compositions between two different risk groups, ESTIMATE analysis was utilized.24 Additionally, we examined the correlation between genes and immune cells, as well as among different cell types, using the Wilcoxon test.
Gene Set Enrichment Analysis (GSEA) Between Subtypes
Enrichment analysis comparing subtypes utilized the h.all.v7.4.symbols.gmt background from MSigDB v7.1.25 Enrichment scores for each Hallmark gene set in periodontitis samples were computed and ranked using the GSVA algorithm in R,26 applying a BH adjusted P (FDR) < 0.05 and Normalized Enrichment Score (NES) >1.
Drug Sensitivity Analysis of 6-AA
The GDSC database was utilized to evaluate the responsiveness to chemotherapy drugs. The difference of sensitivity (IC50 value difference) for 138 chemotherapy drugs were quantify by using the pRRophic algorithm.27 Then, the Spearman correlation coefficient and corresponding P < 0.05 were used to reveal whether the difference in IC50 value of each drug associated with 6-AA. The result was visualized using box plot.
Immunotherapeutic Responses Prediction
TIDE analysis predicts immunotherapeutic responses by assessing two primary mechanisms of tumor immune escape.28 In this study, the Wilcoxon test was employed to uncover differences in TIDE scores between the two risk groups. Moreover, the cytolytic activity (CYT) score is defined as the average expression value of Granzyme A (GZMA) and Perforin 1 (PRF1). The tertiary lymphoid structure (TLS) score is calculated using the GSVA algorithm from the GSVA package in R, based on the expression of TLS signature genes. Subsequently, the Wilcoxon test was used to compare the differences in CYT and TLS scores between different risk groups. Furthermore, the Wilcoxon test was used to revealed the difference of immune checkpoint genes between two risk groups.
Single-Cell Analysis
The GSE176031 single-cell dataset includes precise cell type annotations at the individual cell level, enabling detailed analysis of gene expression across various cell types. In this study, the differential gene expression across various cell types elucidates the heterogeneity of the TME in different PRAD patients, thereby contributing to our understanding of cancer heterogeneity.
Clustering Analysis for DEPGs
To investigate different clusters of PRAD associated with PCD, the ConsensusClusterPlus package29 in R software (version: 4.3.2) was used for analysis by improving the clustering variable (k) from 2 to 9. KM survival analysis was then performed using the Survival package (version 2.41-1) to assess survival among different clusters. Following this, the t-test was employed to examine the relationship between clusters and clinical data, such as age and stage.
The qRT-PCR Analysis
To further investigate the expression of biomarkers (TOP2A, PABPN1, BCL2L12, TRIM14, PIK3R1, and LAPTM4B) revealed in the current study, a verification study using qRT-PCR was performed using cell lines and clinical samples, respectively. For cell experiment, the expression of all six genes in cultured LNCaP cells (ATCC® CRL-1740™, 6-AA sensitive group) and DU145 cells (ATCC® HTB-81™, 6-AA resistant group) were investigated. In addition, the expression of all six genes was revealed based on the clinical samples from 6-AA resistant (n = 20) and 6-AA sensitive (n = 20) PRAD patients. The clinical samples were obtained from our hospital. All procedures involving human participants were conducted in accordance with the ethical standards of our committee. This study protocol was complied with the Declaration of Helsinki and was approved by the Ethics Committee of the Affiliated Hospital of Shandong Second Medical University. Informed consent was obtained from all individual participants included in the study. Briefly, total RNAs were extracted using TRIZOL reagent (Invitrogen, USA) and reverse transcripted using RevertAidTM First Strand cDNA Synthesis Kit (Thermo Fisher Scientific) in accordance with manufacturers’ instructions. The PCR was performed on ABI7500 (Applied Biosystems, U.S.A.). The detailed information for all primers used in current study were listed in Table 1. The PCR program included 95°C for 5 min, 35 cycles of 95°C for 30 s and 52°C for 30 s. The relative expression was calculated using the 2−ΔΔCt method.30
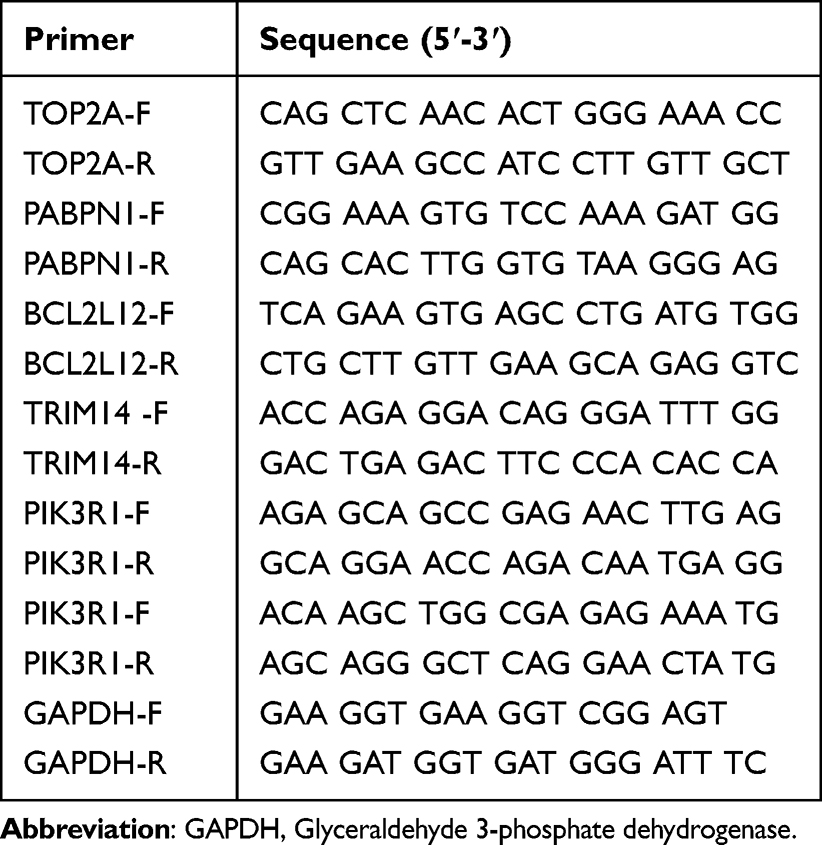 |
Table 1 The Detail Information for All Primers Used in Current Study |
Results
DEPGs Investigation
A total of 2585 DEGs were explored between tumor samples and normal samples (Supplementary Figure 1A). Then, based on GSE81277, totally 2198 6-AA-specific genes were further revealed (Supplementary Figure 1B). Finally, the PCD genes with DEGs and 6-AA-specific genes were used to identify DEPGs. The VENN plot analysis showed that there were 57 DEPGs enrolled for subsequent analysis (Supplementary Figure 1C).
The Enrichment Analysis on DEPGs
The GO enrichment analysis performed on DEPGs showed that these genes were predominantly assembled in functions like regulation of cysteine-type endopeptidase activity (BP, GO:2000116, Genes: BCL2L12, MYC, LTF, etc) (Figure 1A), ErbB-3 class receptor binding (MF, GO:0043125, Genes: PIK3R1 and ERBB3) (Figure 1B) and late endosome membrane (CC, GO:0031902, Genes: MCOLN2, LAPTM4B and TMEM106B, etc) (Figure 1C). Meanwhile, these genes were primarily enriched in p53 signaling pathway (hsa04115) (Figure 1D).
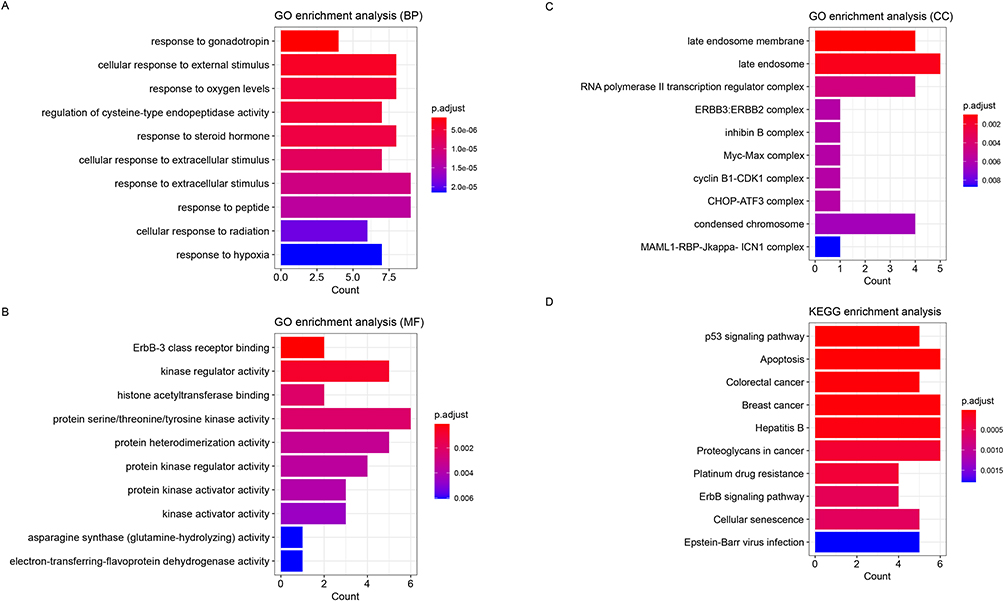 |
Figure 1 The enrichment analysis performed on the differentially expressed 6-acetoxy-anopterine (6-AA) resistant programmed cell death-related genes (DEPGs). (A) The Top 10 GO-BP function that significantly assembled by DEPGs. (B) The Top 10 GO-MF function that significantly assembled by DEPGs. (C) The Top 10 GO-CC function that significantly assembled by DEPGs. (D) The Top 10 GO-BP function that significantly assembled by DEPGs. The X-axis represented the number of genes enriched in certain function or pathway, while the Y-axis represented the name of function or pathway. |
Prognostic Signatures Investigation and Validation
Totally 18 prognostic genes were revealed by using univariate Cox regression (Supplementary Figure 2). LASSO regression pinpointed 11 significant genes (Figure 2A and B). Then, multivariate COX regression identified six signature genes including TOP2A, PABPN1, BCL2L12, TRIM14, PIK3R1 and LAPTM4B (Figure 2C). Moreover, based on the RS of each patient, we separated the sample into two risk groups. For TCGA training dataset, the expression of all six signature genes was noticeable divergence between these two risk groups (all P < 0.05) (Figure 2D). Meanwhile, there was a significant different in survival probability between two risk groups (Figure 2E). The ROC analysis for signatures showed that the AUC value of 1-year, 3-years and 5-years were larger than 0.717, which showed a well diagnostic value for these signature genes (Figure 2F). The trend of the results in the GEO validation dataset was basically consistent with that in the TCGA training dataset (Figure 2G–I).
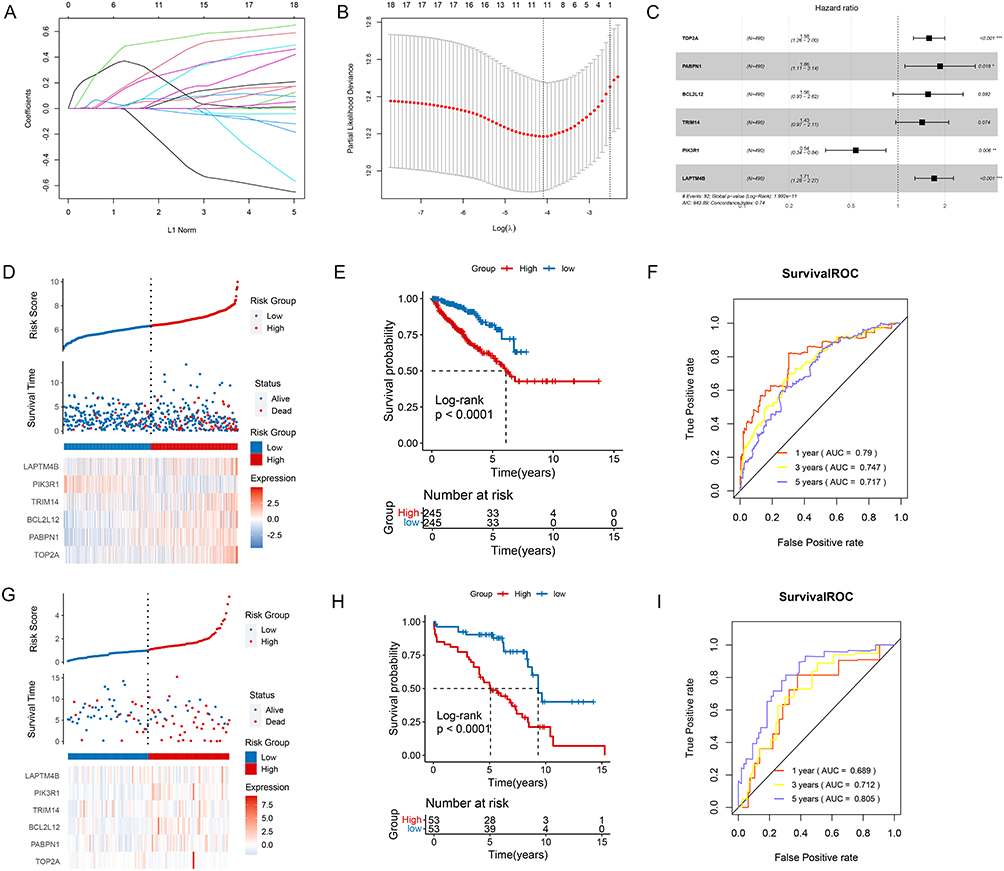 |
Figure 2 The prognostic signature investigation and validation. (A) The least absolute shrinkage and selection operator (LASSO) Cox analysis revealed 11 significant genes. (B) The best penalty coefficient in LASSO model. (C) The forest plot showed six signature genes based on multivariate COX regression. (D) The distribution of genes based on RS, the difference of survival time between two outcomes of disease, and gene expression based on two risk groups in the TCGA training dataset. (E) The KM analysis showed the survival probability in two different risk groups in TCGA training dataset. (F) The ROC analysis showed the AUC value of 1-year, 3-years and 5-years survival for current signatures in TCGA training dataset. (G) The distribution of genes based on RS, the difference of survival time between two outcomes of disease, and gene expression based on two risk groups in the GEO validation dataset. (H) The KM analysis showed the survival probability in two different risk groups in GEO validation dataset. (I) The ROC analysis showed the AUC value of 1-year, 3-years and 5-years survival for current signatures in GEO validation dataset. *P < 0.05; **P < 0.01; ***P < 0.001. |
Independent Prognostic Analysis
The univariate Cox regression on clinical characteristics showed that T_Stage, Gleason, Resection_Status and RS were independent prognostic factors for PRAD (Figure 3A). Meanwhile, Gleason and RS were independent prognostic factors for PRAD (Figure 3B) based on multivariate Cox regression. To further reveal the correlation between the two factors (Gleason and RS) and prognosis, these factors were enrolled for nomogram construction based on signature genes (Figure 3C). The numerical rating of each parameter was assigned along a continuum. Summing these individual ratings provided a method to predict survival outcomes, indicating the applicability of the nomogram for assessing PRAD risk. The survival prediction analysis showed that the 1-year, 2-years and 5-years survival rate were accordance with the actual survival rates (Figure 3D), which further indicated the prognostic value of current nomogram. Furthermore, the survival time was significantly different between two risk groups based on nomogram (Figure 3E). In addition, the ROC analysis for nomogram showed that the AUC value of 1-year, 3-years and 5-years were larger than 0.769, which showed a well diagnostic value for current nomogram (Figure 3F).
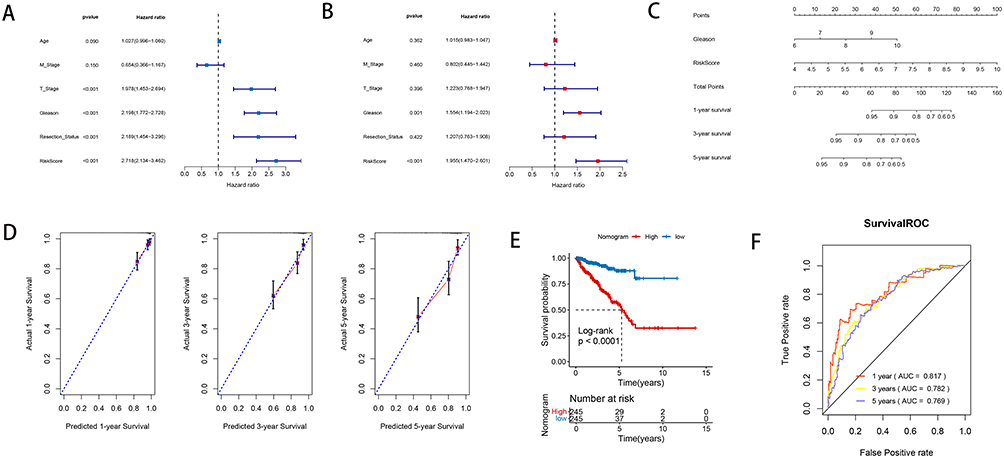 |
Figure 3 The interdependent analysis and nomogram investigation. (A) The univariate Cox regression revealed the correlation between the RS and clinical factors. (B) The Cox multivariate regression revealed the correlation between the RS and clinical factors. (C) A nomogram for predictive ability study. (D) The consistency line chart between 1-year, 2-years and 5-years survival rate predictions and actual survival rates: the X-axis represented the predicted survival rate, while the Y-axis represented the actual survival rate. (E) The KM analysis showed the survival probability in two different risk groups based on nomogram. (F) The ROC analysis showed the AUC value of 1-year, 3-years and 5-years survival for current nomogram. |
Immune Infiltration and GSEA Analysis
Based on TCGA dataset, the immune score and matrix score were calculated using the estimate algorithm. The results showed significant differences in matrix score and immune score among different risk groups (Figure 4A). Then, the CIBERSORT was used to calculate the proportion of 22 immune cells in TCGA dataset. With P < 0.05, a total of eight immune cells’ expression were revealed dramatically different between two risk groups (Figure 4B). For example, the expression of CD4+ resting memory T cells in low-risk group was dramatically higher than that in high-risk group (P < 0.001). However, the expression of Regulatory T cells (Tregs) in low-risk group was dramatically lower than that in high-risk group (P < 0.0001). In addition, the ssGSEA algorithm revealed totally 10 immune cells that differentially expressed between high-risk group and low-risk group (Figure 4C). For example, the expression of CD4+ central memory T cells in low-risk group was dramatically higher than that in high-risk group (P < 0.05). Furthermore, with P < 0.05 and NES > 1, a total of 13 KEGG pathways that significantly expressed between groups were revealed by GSEA (Figure 4D). The heatmap of hallmark gene sets analysis showed that these pathways were separated by different risk groups (Figure 4E).
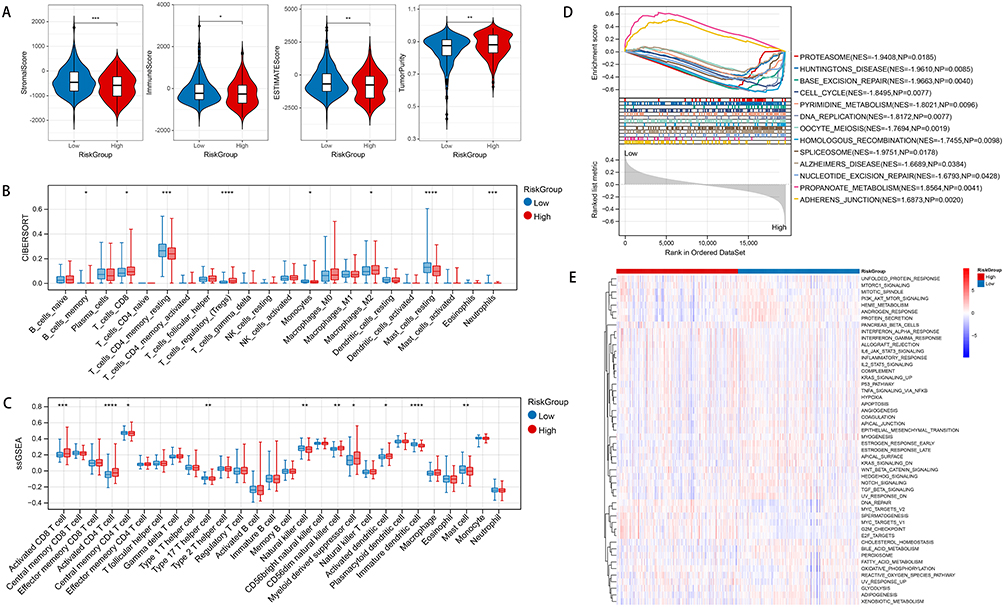 |
Figure 4 Immunological analysis and GSEA investigation. (A) Comparison of infiltration in different risk groups using violin plots for immune scores and stromal scores: X-axis represented different risk group, while the Y-axis represented different scoring. (B) The correlation between expression of immune cells and different risk group based on CIBERSORT algorithm. (C) The correlation between expression of immune cells and different risk group based on ssGSEA algorithm. (D) The significantly different KEGG pathways revealed by GSEA. (E) The heatmap showed the distribution of different KEGG pathways in two risk groups by using hallmark gene sets analysis. *P < 0.05; **P < 0.01; ***P < 0.001; ****P < 0.0001. |
Drug Sensitivity and Immunotherapy Response Analysis
Based on TCGA dataset, the IC50 values of drugs associated with PRAD expression were revealed. The result showed the association between IC50 values of 138 drugs and different risk groups. For instance, BL.D1870, SL.0101.1, and RO.3306 demonstrated notably reduced IC50 values in the high-risk cohort compared to the low-risk cohort, suggesting heightened drug sensitivity among high-risk PRAD patients (Figure 5A). Moreover, the variation in immunotherapy response between two risk groups was explored using TIDE score analysis. The results demonstrated that the TIDE score did not exhibit a marked disparity between the two risk groups (Figure 5B). In addition, except for BTLA, SIRPA, TNFRSF9, and VTCN1, the expression of the remaining checkpoints was dramatically different between two risk groups (Figure 5C) (all P < 0.05). Furthermore, except for TMB and CYT, the score of MSI and TLS between high-risk group and low-risk group was dramatically different (all P < 0.05) (Figure 5D).
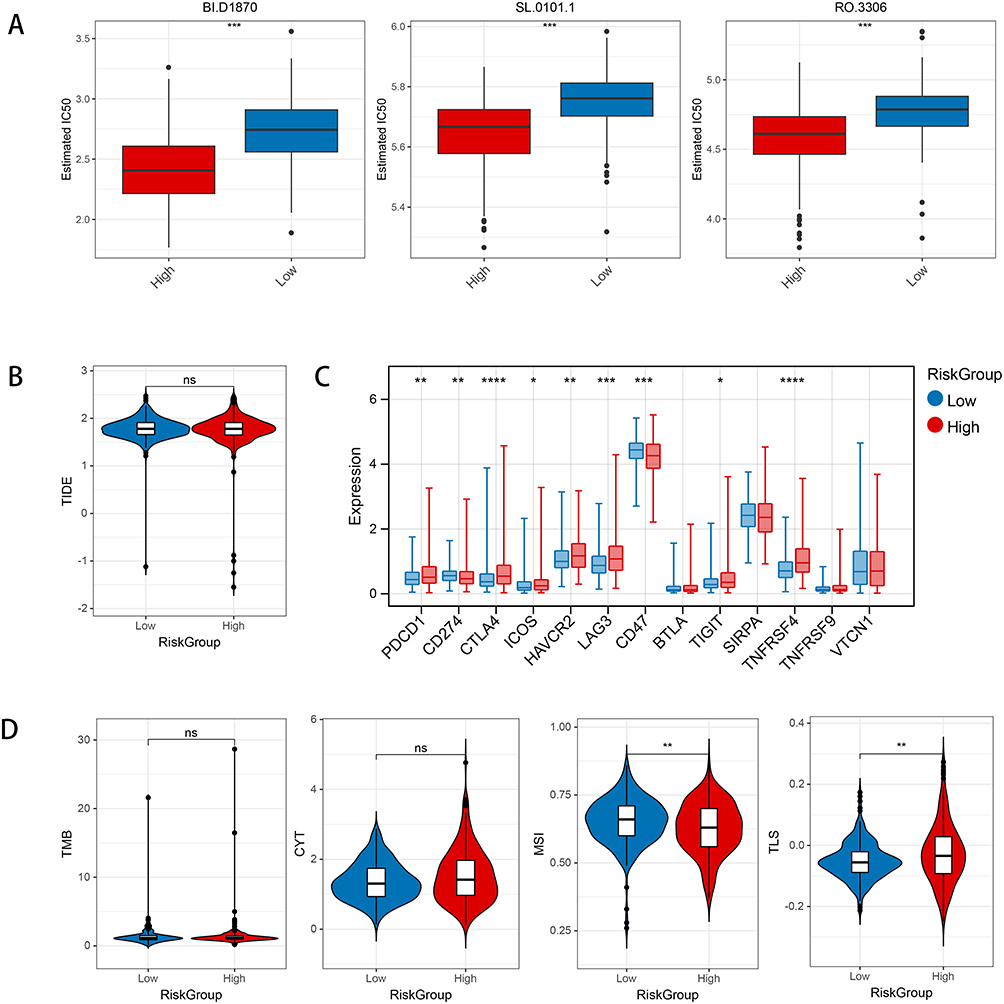 |
Figure 5 The results of drug sensitive and immunotherapy response investigation in current study. (A) Comparison of differences in IC50 levels among three chemotherapy drugs between two risk groups. (B) The comparison of differences in TIDE scores among different risk groups. (C) The expression of immune checkpoint genes among different risk groups. (D) Comparison of differences in Tumor Mutational Burden (TMB), Cytolytic Activity Score (CYT) scores, Microsatellite Instability (MSI), and Tertiary Lymphoid Structures (TLS) scores among different risk groups. *P < 0.05; **P < 0.01; ***P < 0.001; ****P < 0.0001; ns, no significant difference. |
Single-Cell Analysis Revealed the Differential Expression of Signatures in the Immune Micro-Environment
Based on GSE176031 from the TISCH database, the expression of six signatures in the immune microenvironment. The result showed that a total of 23 clusters (Figure 6A) and 9 immune cell types (Figure 6B and C) were revealed in current analysis. Immune microenvironment analysis revealed that the six signatures identified in current study were expressed in almost all cell types (Figure 6D).
 |
Figure 6 Single-cell analysis revealed the differential expression of signatures in the immune micro-environment. (A) A total of 23 clusters revealed in GSE176031 dataset: the different color represented different clusters. (B) A total of 9 immune cell types revealed in GSE176031 dataset: the different color represented different immune cell types. (C) The number and distribution of cell types. (D) The expression of six signatures including TRIM14, PIK3R1, PABPN1, BCL2L12, LAPTM4B and TOP2A by using immune micro-environment analysis. |
Clustering Analysis of DRGs Associated with 6-AA in PRAD
Based on the calculation of Cumulative Distribution Function (CDF), totally three clusters of DRGs associated with 6-AA in PRAD (Figure 7A) were identified. The heatmap analysis confirmed the result of clustering (Figure 7B). The results of clusters distribution were confirmed by the Phase-Amplitude Coupling (PAC) (Figure 7C). The PCA analysis showed that all genes could be separated by different clusters (Figure 7D). The patients with PRAD in cluster 3 had a better clinical survival prognosis than in cluster 1 and cluster 2 (Figure 7E). The heatmap analysis showed that all six signatures could be separated by different groups according to different clinical characteristics (Figure 7F). The box plot analysis for six signatures showed that all these genes were dramatically differentially expressed between cluster 1 and cluster 2 (all P < 0.0001) (Figure 7G). Moreover, the Sankey diagram analysis showed that high-risk patients were more frequently associated with cluster 1/2 and had higher Gleason scores, indicating a more aggressive disease profile and higher drug resistance. Meanwhile, low-risk patients were more prevalent in cluster 3 which correlating with lower Gleason scores, indicating a better clinical survival prognosis and lower drug resistance than cluster 1 and cluster 2 (Figure 7H). Finally, the distribution differences of RS among different clusters showed that cluster 2 had a high RS than both cluster 1 and cluster 3 (all P < 0.0001) (Figure 7I).
 |
Figure 7 The clustering analysis of PCD-related genes (DRGs) associated with 6-AA in PRAD. (A) The clustering analysis based on DRGs associated with 6-AA in PRAD by using consistency clustering empirical cumulative distribution function (CDF). (B) The heatmap analysis for two clusters. (C) The results of Phase-Amplitude Coupling (PAC) for clusters distributed. (D) The results of Principal Component Analysis (PCA) for clusters. (E) The KM survival analysis for clinical survival prognosis of clusters. (F) The clinical heatmap for signatures expression in current study: the red color represented up-regulation, while the blue color represented the down-regulation. (G) The box plot analysis showed that expression of six signatures in different clusters. (H) The Sankey diagram of different clusters, different risk groups, and clinical distribution. (I) The distribution differences of risk scores among different clusters. ***P < 0.001; ****P < 0.0001. |
The qRT-PCR Analysis
The relative expression of TOP2A, PABPN1, BCL2L12, TRIM14, PIK3R1 and LAPTM4B in cultured LNCaP cells and DU145 cells were investigated based on qPCR analysis (Figure 8A). The result showed that when compared with LNCaP cells, the expression of TOP2A, PABPN1, BCL2L12 and TRIM14 were all significantly increased in DU145 cells (all P < 0.001). Meanwhile, the expression of PIK3R1 and LAPTM4B in DU145 cells were significantly decreased than those in LNCaP cells (all P < 0.001). In addition, the result of qRT-PCR analysis based on clinical samples showed that when compared with 6-AA sensitive group, the expression of TOP2A, PABPN1, BCL2L12 and TRIM14 were all significantly increased in 6-AA resistant group (all P < 0.001). Meanwhile, the expression of PIK3R1 and LAPTM4B in 6-AA resistant were significantly decreased than those in 6-AA sensitive group (all P < 0.01) (Figure 8B). The expression of six signatures in the validation analysis aligned with the results from our ongoing bioinformatics investigation affirming the reliability of our results.
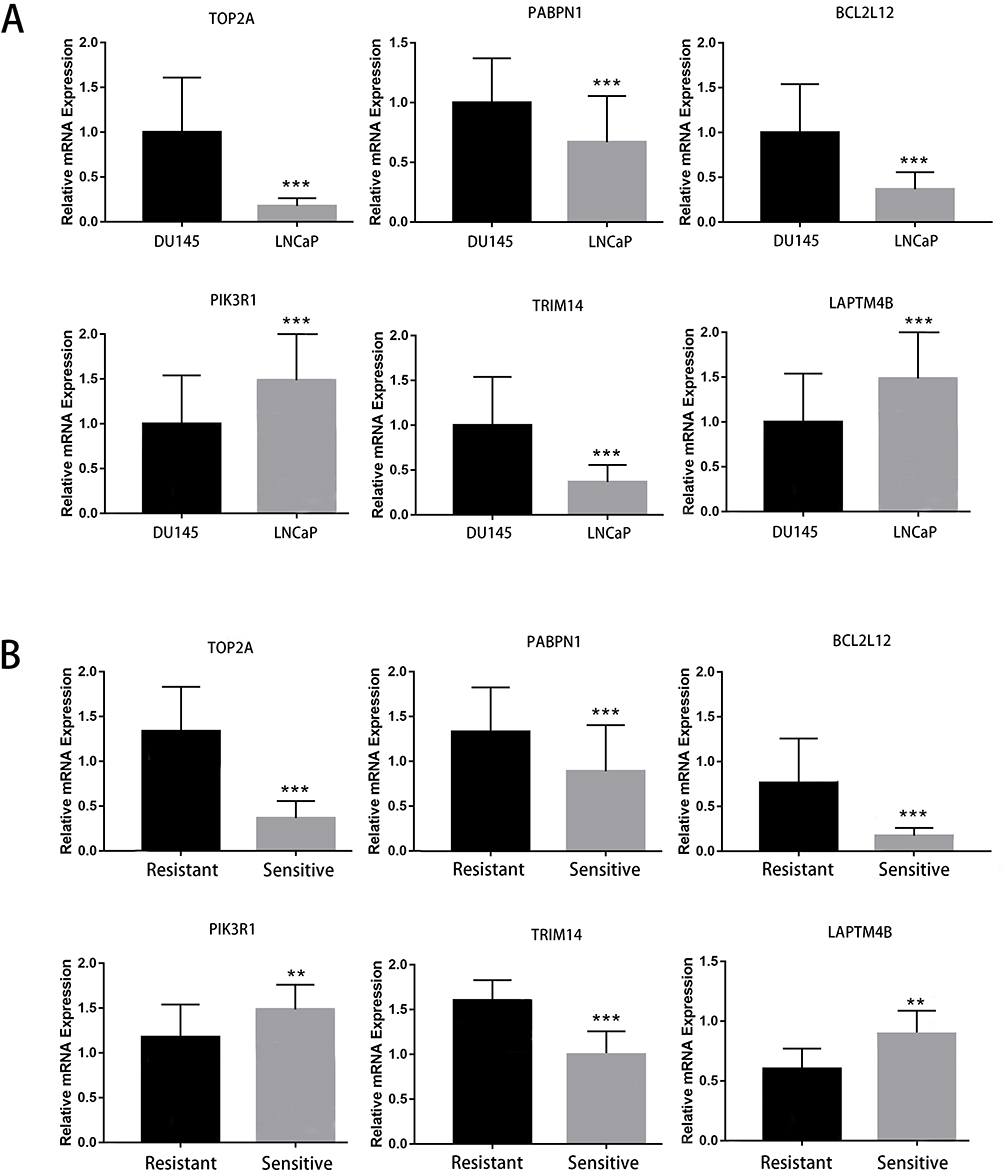 |
Figure 8 The results of qPCR analysis for the expression of signatures including TOP2A, PABPN1, BCL2L12, TRIM14, PIK3R1 and LAPTM4B. (A) The expression of six signatures between cultured LNCaP cells (6-AA sensitive group) and DU145 cells (6-AA resistant group). (B) The expression of six signatures between 6-AA sensitive samples and 6-AA resistant samples. **P < 0.01; ***P < 0.001. |
Discussion
Drug resistance is one of the key factors contributing to the high recurrence rate and poor prognosis of PRAD clinical treatments. Although recent molecular studies, including those on PCD, have partially elucidated the mechanisms of drug resistance in PRAD, the mechanisms of 6-AA resistance in PRAD and the role of PRGs in predicting recurrence and prognosis of PRAD remain unexplored. In this study, we investigated totally 57 DRGs that associated with 6-AA resistance. A total of 6 signatures including TOP2A, PABPN1, BCL2L12, TRIM14, PIK3R1 and LAPTM4B were explored, followed by expression validation by qPCR. In addition, the enrichment analysis showed that these signatures such as CBL2L12 were mainly enriched in GO functions like regulation of cysteine-type endopeptidase activity. The nomogram and survival analysis proved the prognostic value of signatures. Immune infiltration analysis based on two algorithms revealed the dyregulation of memory CD4+ T cells between different risk groups.
The prognostic genes play crucial roles in cancer recurrence and immune processes, and their study contributes to revealing the pathogenic mechanisms of tumors and identifying new therapeutic targets.31 DNA topoisomerase II Alpha (TOP2A) is a gene encoding DNA topoisomerase IIα. A previous study indicates that there is a close association between TOP2A and prognosis of PRAD.32 Overexpression of TOP2A has been associated with cancer cells’ resistance to certain chemotherapy drugs.33 Some studies suggest that TOP2A plays a role in regulating apoptosis and DNA damage repair processes, potentially linking it to PCD.34 Phosphoinositide-3-Kinase Regulatory Subunit 1 (PIK3R1) encodes the regulatory subunit of phosphoinositide 3-kinase. This pathway is often aberrantly activated in cancer and is associated with drug resistance. The abnormal expression of PIK3R1 is associated with poor prognosis in PRAD.35 It has been proved that abnormal expression of PIK3R1 affects the activity and infiltration of immune cells in the tumor microenvironment, thus further intervening in the progression of human cancers, including PRAD.36 Lysosomal Protein Transmembrane 4 Beta (LAPTM4B) is a gene involved in tumor invasion and recurrence.37 Its overexpression may affect tumor cell sensitivity to therapeutic agents through mechanisms such as modulation of apoptosis and drug transport.38 A decade ago, LAPTM4B is already proved to be a useful marker for the poor prognosis of PRAD.39 Tripartite Motif Containing 14 (TRIM14) is a gene involved in regulating cell proliferation and immune response.40 A previous study shows that aberrant expression of TRIM14 may be associated with cancer cell resistance and responses to therapy-induced cell death.41 Lysosomal Protein Transmembrane 4 Beta (PABPN1) is a gene encoding polyadenylate-binding protein, playing a crucial role in RNA synthesis and mRNA stability.42 It has been found to be associated with PRAD recurrence, and its overexpression is correlated with poor prognosis.43 While the exact role of PABPN1 in drug resistance remains to be fully elucidated, its involvement in mRNA stability and transcriptional regulation suggests potential impacts on cellular responses, including responses to therapeutic agents. BCL2 Like 12 (BCL2L12) encodes a protein that inhibits cell apoptosis, and its increased expression correlates with drug resistance and recurrence in cancer.44 It has been confirmed that overexpression of BCL2L12 may suppress tumor cell apoptosis, thereby affecting the tumor’s immunogenicity.45 In this study, a total of 6 key genes including TOP2A, PABPN1, BCL2L12, TRIM14, PIK3R1 and LAPTM4B were explored to be involved in the regulation of 6-AA resistance in PRAD patients, which indicating that TOP2A, PABPN1, BCL2L12, TRIM14, PIK3R1 and LAPTM4B might play a crucial role in mediating 6-AA resistance in PRAD. In addition, TOP2A, PABPN1, BCL2L12, TRIM14, PIK3R1 and LAPTM4B were successfully used to construct the prognostic model for predicting the prognosis PRAD. The performance of this prognostic model was confirmed in both TCGA and GEO cohorts, with Kaplan-Meier analysis results showing significant differences in survival between the low-risk and high-risk groups. Also, the ROC curve for the prognostic model showed that the AUC value of 1-year, 3-years and 5-years were all above 0.712 in both TCGA and GEO cohorts, which showed a well diagnostic value for the prognostic model. Importantly, the qRT-PCR proved that the expression of six signatures in the validation analysis aligned with the results from our ongoing bioinformatics investigation, affirming the reliability of our results. Taken together, the above findings and evidence indicated that TOP2A, PABPN1, BCL2L12, TRIM14, PIK3R1 and LAPTM4B were crucial in 6-AA resistance development in PRAD, targeting these genes will facilitate their usage in overcoming 6-AA resistance in PRAD.
A previous study shows that certain DEGs such as BIRC5 contribute to the drug resistance via participating in regulation of cysteine-type endopeptidase activity pathway in human cancers including chronic myelogenous leukemia, indicating an important role of this pathway in the progression of cancer and associated clinical drug therapy.46 The regulation of cystaine-type endopeptidase activity pathway involves the regulation of the activity of a class of enzymes called cystaine-type endopeptidases. These enzymes include many important protease families, such as caspases, which are particularly important in apoptosis and other cell death processes.47 By regulating the activity of cystinase, cancer cells can resist apoptosis induced by chemotherapy and radiotherapy, and thus obtain drug resistance. For example, overexpression of IAPs is common in a variety of cancers including PRAD, and this overexpression can inhibit cystinase activity and lead to anti-apoptosis.48 BCL2L12, a member of the Bcl-2 protein family, functions as an anti-apoptotic factor by inhibiting cysteine-type endopeptidases. By stabilizing the mitochondrial membrane, BCL2L12 prevents cytochrome c release, a key event in intrinsic apoptotic signaling.49 This stabilization diminishes the downstream activation of caspase-9 and the apoptosome complex, further contributing to drug resistance.50 A previous study based on combination treatment of Cisplatin and Titanium Dioxide Nanoparticles indicates that BCL2L12 gene is a therapy target in the clinical treatment of PRAD.51 However, the detailed molecular mechanism of BCL2L12 via cystaine-type endopeptidase activity pathway during the development of PRAD is still unclear. In the current study, we elucidated the pivotal role of BCL2L12 in mediating resistance to 6-AA through the modulation of cysteine-type endopeptidase activity. Thus, BCL2L12 may regulate PRAD progression and induce 6-AA resistance by interacting with these pathways. By inhibiting key apoptotic pathways, BCL2L12 contributed to the survival and chemoresistance of PRAD cells. Targeting this pathway may provide a novel approach to sensitizing PRAD to apoptosis-inducing therapies, offering a promising direction for future research and clinical management.
Memory CD4+ T are essential contributors to the immune system, particularly in anti-tumor immune responses.52 Studies have shown that the presence and functional status of memory CD4+ T cells in the prostatic microenvironment significantly impact tumor immune surveillance and escape mechanisms.53 However, in prostate cancer, the tumor microenvironment often suppresses the function of memory CD4+ T cells, leading to reduced anti-tumor efficacy.54 In PRAD treatment, 6-AA may exert its immunomodulatory effects by enhancing the anti-tumor activity of memory CD4+ T cells. For example, 6-AA can increase the expression of tumor antigens, promoting the recognition and attack of tumor cells by memory T cells.55 The intrinsic pathway primarily revolves around alterations in mitochondrial membrane potential and the liberation of cytochrome c, whereas the extrinsic pathway triggers apoptosis by engaging death receptors like Fas and TNF receptors.56 Activation of these pathways not only directly leads to tumor cell death but also may release tumor antigens, lead to promoting the recruitment and activation of immune cells and further enhancing the anti-tumor immune response.57 In this study, we found that both CIBERSORT and ssGSEA algorithms indicated differential expression of memory CD4+ T cells between two risk groups defined by six signatures. Thus, we speculated that memory CD4+ T cells might play take part in tumor microenvironment and influencing the efficacy of 6-AA in PRAD treatment. Although this study provides valuable insights, there are still some limitations. Firstly, the datasets used in this study were obtained from public databases, and as there were differences in data quality, the results were easily affected, resulting in bias. Secondly, the study was based on existing gene expression data and requires further experimental validation. Besides, the specific functions and mechanisms of the drug-resistant gene clusters (TOP2A, PABPN1, BCL2L12, TRIM14, PIK3R1 and LAPTM4B) needed to be further investigated by in vivo and in vitro experiments. In addition, whether BCL2L12 takes part in the resistance to 6-AA in PRAD via the cysteine-type endopeptidase activity pathway should be deeply explored. Future research should include functional experiments and clinical trials to validate the specific roles and clinical application potential of these gene clusters in prostate cancer.
Conclusion
In conclusion, PCD-related genes, TOP2A, PABPN1, BCL2L12, TRIM14, PIK3R1 and LAPTM4B, were crucial in 6-AA resistance development in PRAD, targeting these genes will facilitate their usage in overcoming 6-AA resistance in PRAD. The prognostic risk prediction model established in this study could effectively predict patients’ prognosis and provide a reference for the clinical diagnosis and immunotherapy of PRAD.
Abbreviations
PCD, programmed cell death; 6-AA, 6-acetoxy-anopterine; PRAD, prostate adenocarcinoma; DEPGs, differentially expressed programmed cell death genes; RFS, recurrence-free survival; GEO, Gene Expression Omnibus; BH, Benjamini & Hochber; BP, biological process; CC, cellular components; MF, molecular function; LASSO, Least absolute shrinkage and selection operator; RS, Risk score; KM, kaplan-Meier; NES, Normalized Enrichment Score; CYT, cytolytic activity; TLS, tertiary lymphoid structure.
Disclosure
The author(s) report no conflicts of interest in this work.
References
1. Ward RD, Purysko AS. Magnetic resonance imaging of prostate adenocarcinoma: detection and staging. Top Magn Reson Imaging. 2020;29(1):17–17. doi:10.1097/RMR.0000000000000226
2. Segal E, Dababo N, Bhalla D, Bucklan D. Prostate adenocarcinoma metastasis to the rectal submucosa and mesorectal lymph node on 18 F-PSMA PET/CT. Clin Nucl Med. 2023;48(10):e506–e508. doi:10.1097/RLU.0000000000004795
3. Fizazi K, Foulon S, Carles J, et al. Abiraterone plus prednisone added to androgen deprivation therapy and docetaxel in de novo metastatic castration-sensitive prostate cancer (PEACE-1): a multicentre, open-label, randomised, Phase 3 study with a 2 × 2 factorial design. Lancet. 2022;399(10336):1695–1707. doi:10.1016/S0140-6736(22)00367-1
4. Ma Z, Cheng X, Yue T, et al. Immune infiltration phenotypes of prostate adenocarcinoma and their clinical implications. Cancer Med. 2021;10(15):5358–5374. doi:10.1002/cam4.4063
5. Newton K, Strasser A, Kayagaki N, Dixit VM. Cell death. Cell. 2024;187(2):235–256. doi:10.1016/j.cell.2023.11.044
6. Zhou W, Lim A, Edderkaoui M, et al. Role of YAP signaling in regulation of programmed cell death and drug resistance in cancer. Int J Bio Sci. 2024;20(1):15–28. doi:10.7150/ijbs.83586
7. Shan J, Han D, Shen C, Lei Q, Zhang Y. Mechanism and strategies of immunotherapy resistance in colorectal cancer. Front Immunol. 2022;13:1016646. doi:10.3389/fimmu.2022.1016646
8. Zhu M, Liu D, Liu G, Zhang M, Pan F. Caspase-linked programmed cell death in prostate cancer: from apoptosis, necroptosis, and pyroptosis to PANoptosis. Biomolecules. 2023;13(12):1715. doi:10.3390/biom13121715
9. Li J, Li Y, Wang D, Liao R, Wu Z. PLAG1 interacts with GPX4 to conquer vulnerability to sorafenib induced ferroptosis through a PVT1/miR-195-5p axis-dependent manner in hepatocellular carcinoma. J Exp Clin Cancer Res. 2024;43(1):143. doi:10.1186/s13046-024-03061-4
10. Wang D, Zheng H, Chen Y, Hao J, Zhou Y, Li N. Inhibition of TPI1 sensitizes cisplatin-resistant oral cancer to ferroptosis. Biomedicines. 2025;13(5):1225.
11. Guo L, Kang Y, Xia D, et al. Characterization of immune-based molecular subtypes and prognostic model in prostate adenocarcinoma. Genes. 2022;13(6):1087. doi:10.3390/genes13061087
12. Hsu SK, Li CY, Lin IL, et al. Inflammation-related pyroptosis, a novel programmed cell death pathway, and its crosstalk with immune therapy in cancer treatment. Theranostics. 2021;11(18):8813–8835. doi:10.7150/thno.62521
13. Liu C, Liu Q, Lv Y, et al. CPLX1 is a novel prognostic biomarker in CRC correlating with immunotherapy resistance and ferroptosis. Front Immunol. 2025;16:1589423. doi:10.3389/fimmu.2025.1589423
14. Yan X, Chen D, Wang Y, et al. Identification of NOXA as a pivotal regulator of resistance to CAR T-cell therapy in B-cell malignancies. Signal Transduct Target Ther. 2022;7(1):98. doi:10.1038/s41392-022-00915-1
15. Levrier C, Sadowski MC, Rockstroh A, et al. 6α-acetoxyanopterine: a novel structure class of mitotic inhibitor disrupting microtubule dynamics in prostate cancer cells. Mol Cancer Ther. 2017;16(1):3–15. doi:10.1158/1535-7163.MCT-16-0325
16. Long Q, Xu J, Osunkoya AO, et al. Global transcriptome analysis of formalin-fixed prostate cancer specimens identifies biomarkers of disease recurrence. Cancer Res. 2014;74(12):3228–3237. doi:10.1158/0008-5472.CAN-13-2699
17. Smyth GK. limma: linear Models for Microarray Data. In: Gentleman R, Carey VJ, Huber W, Irizarry RA, Dudoit S, editors. Bioinformatics and Computational Biology Solutions Using R and Bioconductor. New York: Springer New York; 2005:397–420.
18. Zhou Y, Gao W, Xu Y, et al. Implications of different cell death patterns for prognosis and immunity in lung adenocarcinoma. NPJ Precis Oncol. 2023;7(1):121. doi:10.1038/s41698-023-00456-y
19. Qin H, Abulaiti A, Maimaiti A, et al. Integrated machine learning survival framework develops a prognostic model based on inter-crosstalk definition of mitochondrial function and cell death patterns in a large multicenter cohort for lower-grade glioma. J Transl Med. 2023;21(1):588. doi:10.1186/s12967-023-04468-x
20. Yu G, Wang LG, Han Y, He QY. clusterProfiler: an R package for comparing biological themes among gene clusters. Omics. 2012;16(5):284–287. doi:10.1089/omi.2011.0118
21. Tibshirani R. The lasso method for variable selection in the Cox model. Stat Med. 1997;16(4):385–395. doi:10.1002/(SICI)1097-0258(19970228)16:4<385::AID-SIM380>3.0.CO;2-3
22. Zhang S, Tong YX, Zhang XH, et al. A novel and validated nomogram to predict overall survival for gastric neuroendocrine neoplasms. J Cancer. 2019;10(24):5944–5954. doi:10.7150/jca.35785
23. Chen B, Khodadoust MS, Liu CL, Newman AM, Alizadeh AA. Profiling tumor infiltrating immune cells with CIBERSORT. Methods Mol Biol. 2018;1711:243–259.
24. Hu D, Zhou M, Zhu X. Deciphering immune-associated genes to predict survival in clear cell renal cell cancer. Biomed Res Int. 2019;2019:2506843. doi:10.1155/2019/2506843
25. Liberzon A, Subramanian A, Pinchback R, Thorvaldsdóttir H, Tamayo P, Mesirov JP. Molecular signatures database (MSigDB) 3.0. Bioinformatics. 2011;27(12):1739–1740. doi:10.1093/bioinformatics/btr260
26. Hänzelmann S, Castelo R, Guinney J. GSVA: gene set variation analysis for microarray and RNA-seq data. BMC Bioinf. 2013;14(1):7. doi:10.1186/1471-2105-14-7
27. Geeleher P, Cox N, Huang RS. pRRophetic: an R package for prediction of clinical chemotherapeutic response from tumor gene expression levels. PLoS One. 2014;9(9):e107468. doi:10.1371/journal.pone.0107468
28. Wang F, Lin H, Su Q, Li C. Cuproptosis-related lncRNA predict prognosis and immune response of lung adenocarcinoma. World J Surg Oncol. 2022;20(1):275. doi:10.1186/s12957-022-02727-7
29. Wilkerson MD, Hayes DN. ConsensusClusterPlus: a class discovery tool with confidence assessments and item tracking. Bioinformatics. 2010;26(12):1572–1573. doi:10.1093/bioinformatics/btq170
30. Livak KJ, Schmittgen TD. Analysis of relative gene expression data using real-time quantitative PCR and the 2(-Delta Delta C(T))Method. Methods. 2001;25(4):402–408. doi:10.1006/meth.2001.1262
31. Li C, Huang Y, Yi X, Tang Y, Okita R, He J. Pan-cancer prognostic model and immune microenvironment analysis of natural killer cell-related genes. Transl Cancer Res. 2024;13(4):1936–1953. doi:10.21037/tcr-24-434
32. Roganowicz M, Bär D, Bersaglieri C, Aprigliano R, Santoro R. BAZ2A-RNA mediated association with TOP2A and KDM1A represses genes implicated in prostate cancer. Life Sci Alliance. 2023;6(7):e202301950. doi:10.26508/lsa.202301950
33. Wang Z, Zhu Q, Li X, et al. TOP2A inhibition reverses drug resistance of hepatocellular carcinoma to regorafenib. Am J Cancer Res. 2022;12(9):4343–4360.
34. Zhang H, Xiong Y, Sun Y, et al. RAD54L2-mediated DNA damage avoidance pathway specifically preserves genome integrity in response to topoisomerase 2 poisons. Sci Adv. 2023;9(49):eadi6681. doi:10.1126/sciadv.adi6681
35. Chakraborty G, Nandakumar S, Hirani R, et al. The impact of PIK3R1 mutations and insulin-PI3K-glycolytic pathway regulation in prostate cancer. Clin Cancer Res. 2022;28(16):3603–3617. doi:10.1158/1078-0432.CCR-21-4272
36. Rao SR, Alham NK, Upton E, et al. Detailed molecular and immune marker profiling of archival prostate cancer samples reveals an inverse association between TMPRSS2: ERG fusion status and immune cell infiltration. J Mol Diagn. 2020;22(5):652–669. doi:10.1016/j.jmoldx.2020.02.012
37. El Mashad SN, Kandil M, Talab TAE, et al. Gastric Carcinoma with low ROR alpha, low E-Cadherin and High LAPTM4B Immunohistochemical Profile; is associated with unfavorable prognosis in Egyptian patients. J Immunoassay Immunochem. 2024;45(1):50–72. doi:10.1080/15321819.2023.2279639
38. Wang H, Wang Q, Wu Y, Lou J, Zhu S, Xu Y. Autophagy-related gene LAPTM4B promotes the progression of renal clear cell carcinoma and is associated with immunity. Front Pharmacol. 2023;14:1118217. doi:10.3389/fphar.2023.1118217
39. Zhang H, Wei Q, Liu R, et al. Overexpression of LAPTM4B-35: a novel marker of poor prognosis of prostate cancer. PLoS One. 2014;9(3):e91069. doi:10.1371/journal.pone.0091069
40. Hai J, Zhu CQ, Wang T, Organ SL, Shepherd FA, Tsao MS. TRIM14 is a putative tumor suppressor and regulator of innate immune response in non-small cell lung cancer. Sci Rep. 2017;7:39692. doi:10.1038/srep39692
41. Xu W, Zhuang L, Zhu H, Mao A, Zhou J, Wang L. TRIM14 overexpression induces chemoresistance and malignant behaviors of hepatocellular carcinoma cells by activating the STAT3/HIF-1α pathway. Int J Mol Sci. 2023;24(16):12589.
42. Guan WL, Jiang LL, Yin XF, Hu HY. PABPN1 aggregation is driven by Ala expansion and poly(A)-RNA binding, leading to CFIm25 sequestration that impairs alternative polyadenylation. J Biol Chem. 2023;299(8):105019. doi:10.1016/j.jbc.2023.105019
43. Sáez-Martínez P, Porcel-Pastrana F, Montero-Hidalgo AJ, et al. Dysregulation of RNA-Exosome machinery is directly linked to major cancer hallmarks in prostate cancer: oncogenic role of PABPN1. Cancer Lett. 2024;584:216604. doi:10.1016/j.canlet.2023.216604
44. Wang Z, Wang S, Qin J, et al. Splicing factor BUD31 promotes ovarian cancer progression through sustaining the expression of anti-apoptotic BCL2L12. Nat Commun. 2022;13(1):6246. doi:10.1038/s41467-022-34042-w
45. Yang G, Liu JQ, Mo LH, et al. Bcl2 like protine-12 (Bcl2L12) facilitates experimental airway allergic inflammation by inducing autocrine eotaxin in eosinophils. Immunol Lett. 2020;228:93–102. doi:10.1016/j.imlet.2020.10.007
46. Zhang H, Wang P, Song T, Bonnette UL, Zhang Z. Screening and identification of key genes in imatinib-resistant chronic myelogenous leukemia cells: a bioinformatics study. Hematology. 2021;26(1):408–414. doi:10.1080/16078454.2021.1931740
47. Yamada K, Basak AK, Goto-Yamada S, Tarnawska-Glatt K, Hara-Nishimura I. Vacuolar processing enzymes in the plant life cycle. New Phytol. 2020;226(1):21–31. doi:10.1111/nph.16306
48. Kim JK, Chang I, Jung Y, et al. Mycoplasma hyorhinis infection promotes TNF-α signaling and SMAC mimetic-mediated apoptosis in human prostate cancer. Heliyon. 2023;9(10):e20655. doi:10.1016/j.heliyon.2023.e20655
49. Yang MC, Loh JK, Li YY, et al. Bcl2L12 with a BH3-like domain in regulating apoptosis and TMZ-induced autophagy: a prospective combination of ABT-737 and TMZ for treating glioma. Int J Oncol. 2015;46(3):1304–1316. doi:10.3892/ijo.2015.2838
50. Wu GJ, Yang ST, Chen RM. Major contribution of Caspase-9 to honokiol-induced apoptotic insults to human drug-resistant glioblastoma cells. Molecules. 2020;25(6):1450. doi:10.3390/molecules25061450
51. Emadi A, Mokhtari MJ. Effects of combination treatment of cisplatin and titanium dioxide nanoparticles on the BCL2L12 gene in prostate cancer cells. J Ilam Uni Med Sci. 2020;28(2):21–31. doi:10.29252/sjimu.28.2.21
52. Künzli M, Masopust D. CD4(+) T cell memory. Nat Immunol. 2023;24(6):903–914. doi:10.1038/s41590-023-01510-4
53. Li M, Xu DM, Lin SB, et al. Investigation of lymphocyte subsets in peripheral blood of patients with benign prostatic hyperplasia. Int J Gene Med. 2021;14:6951–6959. doi:10.2147/IJGM.S340018
54. Anastasopoulou EA, Voutsas IF, Papamichail M, Baxevanis CN, Perez SA. MHC class II tetramer analyses in AE37-vaccinated prostate cancer patients reveal vaccine-specific polyfunctional and long-lasting CD4(+) T-cells. Oncoimmunology. 2016;5(7):e1178439. doi:10.1080/2162402X.2016.1178439
55. Terekhova M, Swain A, Bohacova P, et al. Single-cell atlas of healthy human blood unveils age-related loss of NKG2C(+)GZMB(-)CD8(+) memory T cells and accumulation of type 2 memory T cells. Immunity. 2023;56(12):2836–2854.e2839. doi:10.1016/j.immuni.2023.10.013
56. Tian H, Liu L, Li Z, et al. Chinese medicine CGA formula ameliorates liver fibrosis induced by carbon tetrachloride involving inhibition of hepatic apoptosis in rats. J Ethnopharmacol. 2019;232:227–235. doi:10.1016/j.jep.2018.11.027
57. Moriyama K, Nishida O. Targeting cytokines, pathogen-associated molecular patterns, and damage-associated molecular patterns in sepsis via blood purification. Int J Mol Sci. 2021;22(16):8882. doi:10.3390/ijms22168882
 © 2026 The Author(s). This work is published and licensed by Dove Medical Press Limited. The
full terms of this license are available at https://www.dovepress.com/terms
and incorporate the Creative Commons Attribution
- Non Commercial (unported, 4.0) License.
By accessing the work you hereby accept the Terms. Non-commercial uses of the work are permitted
without any further permission from Dove Medical Press Limited, provided the work is properly
attributed. For permission for commercial use of this work, please see paragraphs 4.2 and 5 of our Terms.
© 2026 The Author(s). This work is published and licensed by Dove Medical Press Limited. The
full terms of this license are available at https://www.dovepress.com/terms
and incorporate the Creative Commons Attribution
- Non Commercial (unported, 4.0) License.
By accessing the work you hereby accept the Terms. Non-commercial uses of the work are permitted
without any further permission from Dove Medical Press Limited, provided the work is properly
attributed. For permission for commercial use of this work, please see paragraphs 4.2 and 5 of our Terms.