Back to Journals » Psychology Research and Behavior Management » Volume 17
Prediction of Junior High School Students’ Problematic Internet Use: The Comparison of Neural Network Models and Linear Mixed Models in Longitudinal Study
Authors Tian M, Xing Q, Wang X, Yuan X ![]() , Cheng X, Ming Y, Yin K, Li Z, Wang P
, Cheng X, Ming Y, Yin K, Li Z, Wang P ![]()
Received 17 January 2024
Accepted for publication 12 March 2024
Published 15 March 2024 Volume 2024:17 Pages 1191—1203
DOI https://doi.org/10.2147/PRBM.S450083
Checked for plagiarism Yes
Review by Single anonymous peer review
Peer reviewer comments 4
Editor who approved publication: Professor Mei-Chun Cheung
Mei Tian,1 Qiulian Xing,2 Xiao Wang,2 Xiqing Yuan,2 Xinyu Cheng,2 Yu Ming,2 Kexin Yin,2 Zhi Li,2 Peng Wang2
1Library, Shandong Normal University, Jinan, People’s Republic of China; 2School of Psychology, Shandong Normal University, Jinan, People’s Republic of China
Correspondence: Zhi Li, School of Psychology, Shandong Normal University, Jinan, People’s Republic of China, Email [email protected]
Purpose: With the rise of big data, deep learning neural networks have garnered attention from psychology researchers due to their ability to process vast amounts of data and achieve superior model fitting. We aim to explore the predictive accuracy of neural network models and linear mixed models in tracking data when subjective variables are predominant in the field of psychology. We separately analyzed the predictive accuracy of both models and conduct a comparative study to further investigate. Simultaneously, we utilized the neural network model to examine the influencing factors of problematic internet usage and its temporal changes, attempting to provide insights for early interventions in problematic internet use.
Patients and Methods: This study compared longitudinal data of junior high school students using both a linear mixed model and a neural network model to ascertain the efficacy of these two methods in processing psychological longitudinal data.
Results: The neural network model exhibited significantly smaller errors compared to the linear mixed model. Furthermore, the outcomes from the neural network model revealed that, when analyzing data from a single time point, the influences of seventh grade better predicted Problematic Internet Use in ninth grade. And when analyzing data from multiple time points, the influences of sixth, seventh, and eighth grades more accurately predicted Problematic Internet Use in ninth grade.
Conclusion: Neural network models surpass linear mixed models in precision when predicting and analyzing longitudinal data. Furthermore, the influencing factors in lower grades provide more accurate predictions of Problematic Internet Use in higher grades. The highest prediction accuracy is attained through the utilization of data from multiple time points.
Keywords: problematic internet use, junior high school students, neural network model, linear mixed model
Introduction
With the advancement of technology and the progress of society, teenagers are growing up in an increasingly abundant material and spiritual world, facing progressively complex challenges. Technology has not only enriched their spiritual experiences but has also given rise to various issues, such as Problematic Internet Use (PIU).1 In recent years, researchers have shown growing concern about the internet-related issues faced by teenagers, such as the chaos within “celebrity fan clubs” and the existence of grey industry chains,2 as well as the addictive nature of online games.3 Some researchers have also focused on implementing relevant countermeasures, including enhancing online safety.4 The intersection of rapidly advancing internet technology and junior high school students, who are undergoing significant physical and mental changes, makes these issues even more apparent.
Junior high school students possess a strong curiosity about the world, especially regarding new internet-related phenomena. However, their behaviors and values are not yet fully developed, and their ability to self-regulate is limited. Consequently, resisting the allure of the internet becomes challenging, and they are often easily captivated by new games and carefully designed information online. Additionally, junior high school is a period marked by heightened independence and rebelliousness. These students yearn to break free from parental and teacher control, seeking autonomy and adulthood, and the internet offers an environment that caters to such desires, leading them to be more prone to indulgence.5
Nonetheless, there have been fewer studies focusing on the longitudinal changes in PIU among middle school students and the factors influencing it. In recent years, research methodologies like deep-learning neural networks have increasingly come into the researchers’ purview. In contrast to traditional linear statistical analysis methods, which suffer from poor model fitting, neural network models can overcome these limitations and provide better model fitting.
In the field of medicine, some scholars have compared the accuracy of neural network and linear hybrid model. Li et al compared the prediction accuracy of neural network and linear random effect mixed model in longitudinal data. The results showed that whether it is long-term prediction or short-term prediction, the standardized mean square error of neural network model is less than that of linear mixed model.6 Some researchers compared the prediction effect of neural network model and decision tree method with linear regression model on adolescent mental illness. The results showed that both neural network model and decision tree model have higher predictability and are better than linear regression model.7
However, the variables studied in the medical field are more objective measurements, while in the field of psychology, they are more subjective variables. In addition, in the field of psychology, such as junior high school students’ questionable Internet use and adolescent mental health problems,8 it is easy to be affected by many variables, such as individual characteristics, school, family, environment and so on. Linear mixed model and neural network model can analyze the relationship between variables more accurately than traditional statistical methods, and may show greater advantages in dealing with subjective variables. However, which one has a more accurate fitting effect needs to be further explored.
The objective of this study is to investigate the longitudinal influences on PIU among junior high school students, comparing a linear mixed model with a neural network model to determine the more fitting approach. Furthermore, we aim to analyze how variables at different time points can predict PIU among junior high school students and, based on these findings, propose countermeasures to mitigate PIU among this age group.
Definition and Theoretical Basis of PIU
In 2001, Davis introduced a Cognitive-Behavioral Model of Pathological Internet Use, subsequently extended by Caplan,9,10 which has been employed to explore the correlation between PIU and various mental health variables (Figure 1). The model categorizes PIU into two distinct types: specific PIU and generalized PIU. Specific PIU pertains to individuals who excessively rely on certain Internet features, such as the misuse of online pornographic material and engaging in online gambling. On the other hand, Generalized PIU involves a pervasive, multidimensional overuse of the Internet, often encompassing unproductive time spent online.
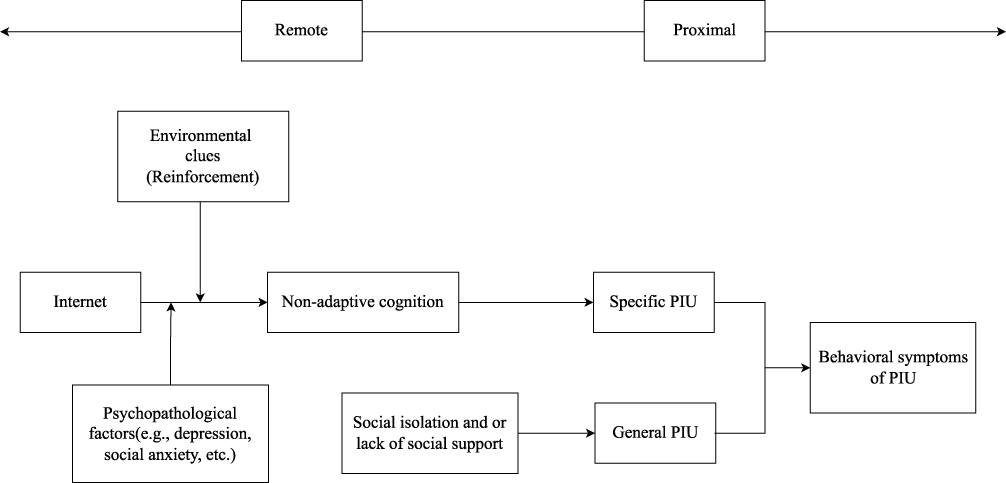 |
Figure 1 Cognitive behavior model. Note: PIU for Problematic Internet Use. |
The cognitive-behavioral model provides a detailed explanation of the various factors influencing PIU and is widely accepted among psychologists. It also differentiates PIU into general PIU and specific PIU, facilitating an in-depth investigation into the nature of PIU. As a result, this study has chosen the cognitive-behavioral model as the theoretical foundation to examine PIU among junior high school students.
Influencing Factors of PIU in Junior High School Students
Teenagers constitute one of the primary user groups of the internet. As of December 2022, the number of internet users in China reached 1.067 billion, with teenagers aged 10 to 19 accounting for approximately 14.3% of the total users. The age at which teenagers access the internet is progressively younger.11
PIU among middle school students can be attributed to four general causes. Firstly, the family factor plays a significant role, as parenting styles influence junior high school students’ PIU. Studies have found that negative parenting styles are positively associated with PIU among middle school students. Positive and healthy families, characterized by strong parent-child relationships, effective communication, and support, can reduce the incidence of PIU through timely identification and correction.12,13 Social support has been shown to have a negative predictive effect on PIU, while loneliness has a positive predictive effect, with loneliness partially mediating the relationship between social support and PIU.14
Secondly, personal traits also contribute to PIU. Shyness has been found to have a significant positive effect on PIU among secondary school and college students.15 Additionally, the way junior high school students seek to satisfy their needs online influences their PIU, with perceptions of online need satisfaction positively predicting PIU, and offline need satisfaction having a negative predictive effect.16 Research has also demonstrated a significant negative correlation between self-esteem and PIU in middle school students.3
Thirdly, the immature stage of physical and mental development in junior high school students contributes to PIU. Their strong curiosity about the outside world, including the internet, coupled with their underdeveloped behaviors and values, makes it difficult for them to resist internet temptations.5 Tracking surveys of secondary school students in Hong Kong indicated an increase in PIU among junior high school students over time.17–19
Finally, peer factors also play a significant role. As junior high school students experience rapid physical and mental development, their interpersonal relationships undergo transformation. Peers assume an increasingly significant role in their lives. Junior high school students with poorer relationships with peers are more likely to exhibit PIU.20
According to PIU’s cognitive-behavioral model, psychopathology is the necessary distal cause of PIU symptoms. In this study, depression, which is a common psychopathological symptom, was measured.21 At the same time, new technologies related to the Internet are also important factors contributing to questionable Internet use, so we took the use of social networking sites, online shopping, online pornography and online games as examples to measure.6,15 In addition, the core factor in PIU’s cognitive-behavioral model is the existence of maladaptive cognition. We took shyness, life satisfaction and self-esteem as examples.6,15 One of the factors contributing to the broad causal path of PIU is also related to the individual’s social background. Specifically, the lack of social support and / or social isolation from family or friends will lead to universal PIU, so this study used the Loneliness scale to measure this. Finally, we used the questionable Internet usage scale to measure individual questionable Internet usage.
Overview of Neural Network Model
Neural networks have gradually emerged since the 1980s and 1990s, gaining popularity for their extensive applications and remarkable features such as high nonlinearity, self-organization, self-learning, and self-adaptation.22 Among the various neural network models, the Multi-layer Feed-Forward Neural Network stands out. The back-propagation algorithm (BP Network), initially proposed in Werbos’ PhD thesis, gained significant attention in 1986 when Rumelhart et al successfully implemented a multi-layer network trained with this algorithm, capturing the interest of researchers.23
In psychology and related fields, there is a limited number of studies that apply feed-forward neural networks, with Convolutional Neural Networks (CNN) being more commonly used to analyze text or image content. Some research combines neural networks with CNN, as seen in Ferreira et al’s study in 2021 on the theory of child overextension.24 Additionally, Generalized Regression Neural Network (GRNN) has been utilized to estimate item parameters of a two-dimensional item response theory two-parameter dichotomous scoring compensation model, with the error value of their parameter estimation being lower than that of a single neural network.25
Overview of the Linear Mixed Model
Linear Mixed Models have found widespread application in statistical analysis of longitudinal data, particularly in the fields of biology and medicine.26 In psychology, researchers have utilized linear mixed models for various investigations. For example, Hafkemeijer et al studied the effectiveness of eye-movement desensitization reprocessing therapy for treating personality disorders using a linear mixed model.27 Peltonen et al used a linear mixed model to evaluate the effectiveness of narrative exposure therapy for treating PTSD in children, among other studies.28
Despite their wide usage, linear mixed models have some limitations. Dealing with complex data that includes numerous observations and variables may lead to convergence issues during calculations, necessitating variable filtering.6 Additionally, the linear mixed model assumes a normal distribution or a specific distribution for the data, with the intercept and slope following a multivariate normal distribution, and it presupposes a linear trend in the data.29 However, real-world psychological data may not always conform to these assumptions, leading to substantial errors when using linear mixed models in such cases. Consequently, researchers have compared the accuracy of neural networks to linear mixed models in the medical field. Li et al demonstrated that the neural network model outperformed the linear mixed model in terms of prediction accuracy for both short-term and long-term predictions on longitudinal data.6
Based on previous research, this study aims to explore the predictive accuracy of neural network models compared to linear mixed models when dealing with subjective variables in psychological longitudinal data. The comparison of predictive analysis results between the two models will provide insights into their accuracy, forming the basis for the following hypotheses:
Hypothesis 1: The neural network model exhibits higher accuracy in analyzing psychological longitudinal data compared to the linear mixed model. Hypothesis 2: When predicting PIU using independent variables at different time points, the neural network model yields superior predictions for single time points at lower grades and consistently better predictions for multiple time points at different grades.
Materials and Methods
Sample
The data for this study were collected using a whole-group sampling approach, encompassing all sixth-grade students from a middle school in Shandong Province. The middle school follows a four-year program, from sixth to ninth grade. The study spanned three years, during which participants underwent testing four times, occurring in the pre-midterm period of the participants’ sixth, seventh, eighth, and ninth grades. The total number of valid data entries for analysis was 289, with 161 females and 127 males included in the final dataset. Before starting the study, we obtained the consent of the school, the students and their parents, and signed the corresponding paper version of the informed consent form. To ensure the quality of the data, both administrators are professionally trained graduate students. In the classroom environment, the administrators helped the participants to complete the questionnaire in turn and stressed to the subjects that they should answer according to their true feelings.
Research Tools
Chinese Version of the Center for Epidemiological Studies Depression Scale
This scale comprises 20 questions and is rated on a four-point scale. Higher scores correspond to more severe depressive states.30 The Cronbach’s alpha coefficient for this scale at the first time point is 0.92.
Social Networking Site Usage Scale
The scale is translated and revised by the Facebook usage scale,31 in which the context of Facebook is replaced with the context of Wechat moments and Qzone, because it is a relatively popular way of social interaction for the subjects.This scale consists of 12 questions, and participants rate their responses on a seven-point scale. Higher scores indicate a higher intensity of social networking site use. The Cronbach’s alpha coefficient for this scale at the first time point is 0.85.
Internet Shopping Addiction Scale
The scale contains 18 questions, and responses are scored on a seven-point scale.32 Higher scores reflect a higher tendency for online shopping. The Cronbach’s alpha coefficient for this scale at the first time point is 0.96.
Internet Pornography Scale
This scale encompasses 12 questions,33 and participants rate their responses on a seven-point scale. Higher scores indicate greater use of Internet pornography. The Cronbach’s alpha coefficient for this scale at the first time point is 0.94.
Online Gaming Disorder Scale
Comprising 10 questions, this scale is scored on a seven-point scale.34 Higher scores signify increased usage of online games. The Cronbach’s alpha coefficient for this scale at the first time point is 0.92.
Shyness Scale
Henderson shyness scale (RHUSS) was used in this study, which was developed by Henderson et al.35 With 17 questions, this scale is rated on a five-point scale. Higher scores indicate a higher level of shyness. The Cronbach’s alpha coefficient for this scale at the first time point is 0.87.
Life Satisfaction Scale
The scale comprises six questions, and participants rate their agreement on a seven-point scale.36 Higher scores suggest greater life satisfaction. The Cronbach’s alpha coefficient for this scale at the first time point is 0.92.
Self-Esteem Scale
In this study, the modified Rosenberg self-esteem scale was used to evaluate the self-esteem of Chinese school students.37 This scale consists of seven questions, and responses are scored on a five-point scale. Higher scores indicate higher levels of self-esteem. The Cronbach’s alpha coefficient for this scale at the first time point is 0.82.
Loneliness Scale
This study uses the Chinese version of the original version of the University of California, Los Angeles (UCLA) Loneliness scale through translation and revision.38 With 20 questions, this scale is rated on a four-point scale. Higher scores signify increased feelings of loneliness. The Cronbach’s alpha coefficient for this scale at the first time point is 0.92.
Problematic Internet Use Scale
Patricia Gomez’s generalized pathological Internet usage table Generalized Pathological Internet Use Scale (GPIUS) was adapted and developed to measure Chinese students’ use of the Internet in general problems.39 Comprising 11 questions, this scale is scored on a seven-point scale. Higher scores indicate a higher degree of PIU. The Cronbach’s alpha coefficient for this scale at the first time point is 0.88.
Data Analysis
All analyses were carried out in SPSS and Python 3.8. Firstly, the normality test of the dependent variable was carried out, and then the linear mixed model and neural network model were carried out respectively, and their output results were compared and analyzed. In addition, the output results of the neural network model were used to infer the degree of influence of the influencing factors at different time points on problematic Internet use.
Missing Data Analysis
The data for this study were collected from a follow-up study at four time points within three years, resulting in some scales having missing values due to participant absence and other reasons. Due to the neural network model’s specific data analysis requirements, blank values are not allowed. Therefore, missing data were imputed. In this study, the amount of missing data was less than 10%. To ensure the integrity of the information and reduce the reduction in statistical test power caused by deleting a large amount of data, the mean imputation method was adopted. This involved using the mean value of all data for the variable to fill in missing values.40
Results
In this study, a graphical test (Q-Q plot) was used to test the normality of the variables. The results found that the dependent variable basically showed a normal distribution (Figure 2).
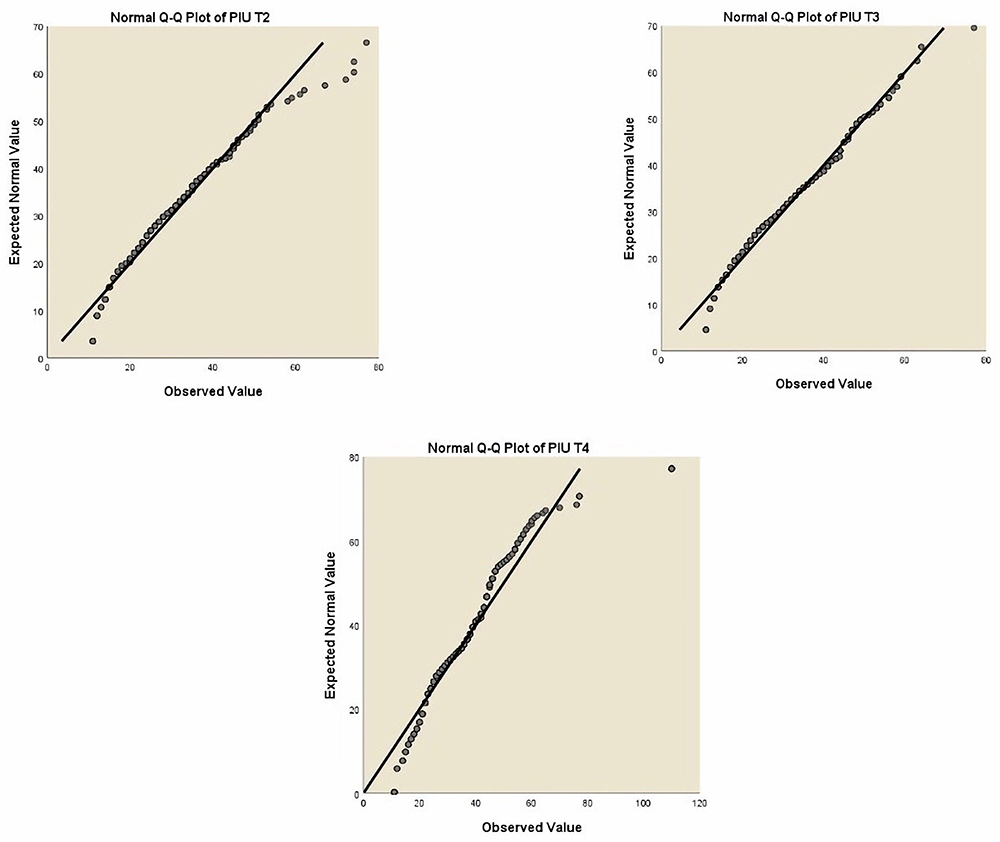 |
Figure 2 The Q-Q graph of PIU at three time points. Note: T2-T4 for grades 7–9, respectively. |
Linear Mixed Model Output Results
The linear mixed model uses a 10-fold cross-validation to regress the data and the predicted results for different periods are as follows (Table 1 and Figure 3).
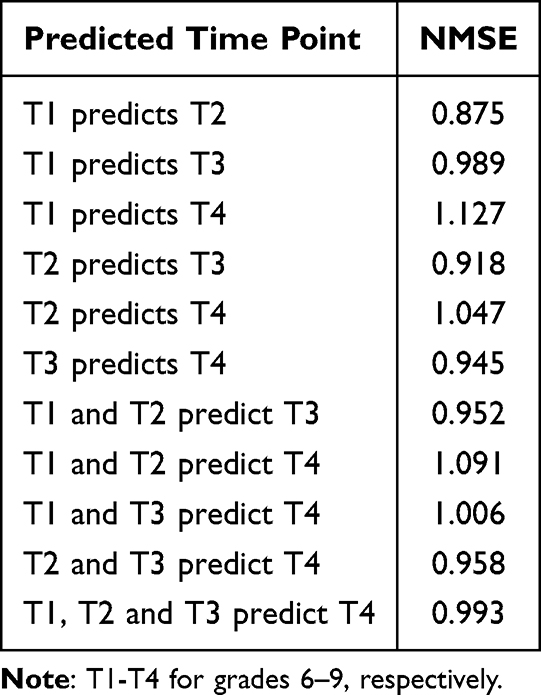 |
Table 1 Linear Mixed Model Output Results Table |
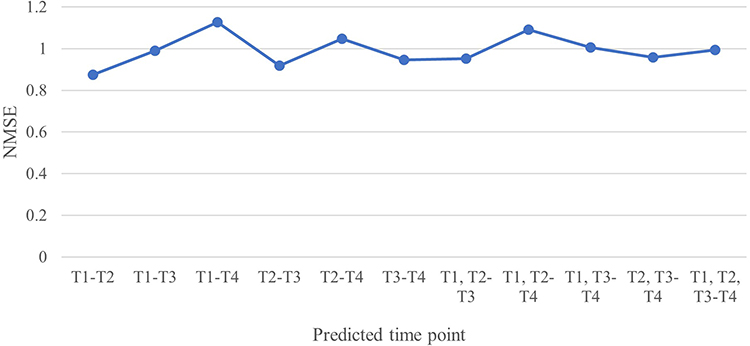 |
Figure 3 Output results of linear mixed model. Note: T1-T4 for grades 6–9, respectively. |
The observation of NMSEs (Normalized Mean Square Errors) exceeding 1 suggests that the linear mixed model’s predictions may not be valid for certain data points.6 Specifically, the data sets that exhibit NMSEs greater than 1 are as follows:1st time point predicts 4th time point; 2nd time point predicts 4th time point; 1st and 2nd time points predict 4th time point; 1st and 3rd time points predict 4th time point. These data sets may have higher prediction errors, making their validity questionable. Additionally, for the data sets with NMSEs that did not exceed 1, it is important to note that the closer their NMSEs are to 1, the lower their validity, indicating less reliable predictions. Further examination and consideration of these findings are essential for the accurate interpretation of the linear mixed model’s results.
Neural Network Model Output Results
Using a neural network model to systematically analyze data from different periods, we selected the normalized mean square error of ten predictions to further analyze the predictive effect of data from different periods. The results are as follows (Table 2 and Figure 4).
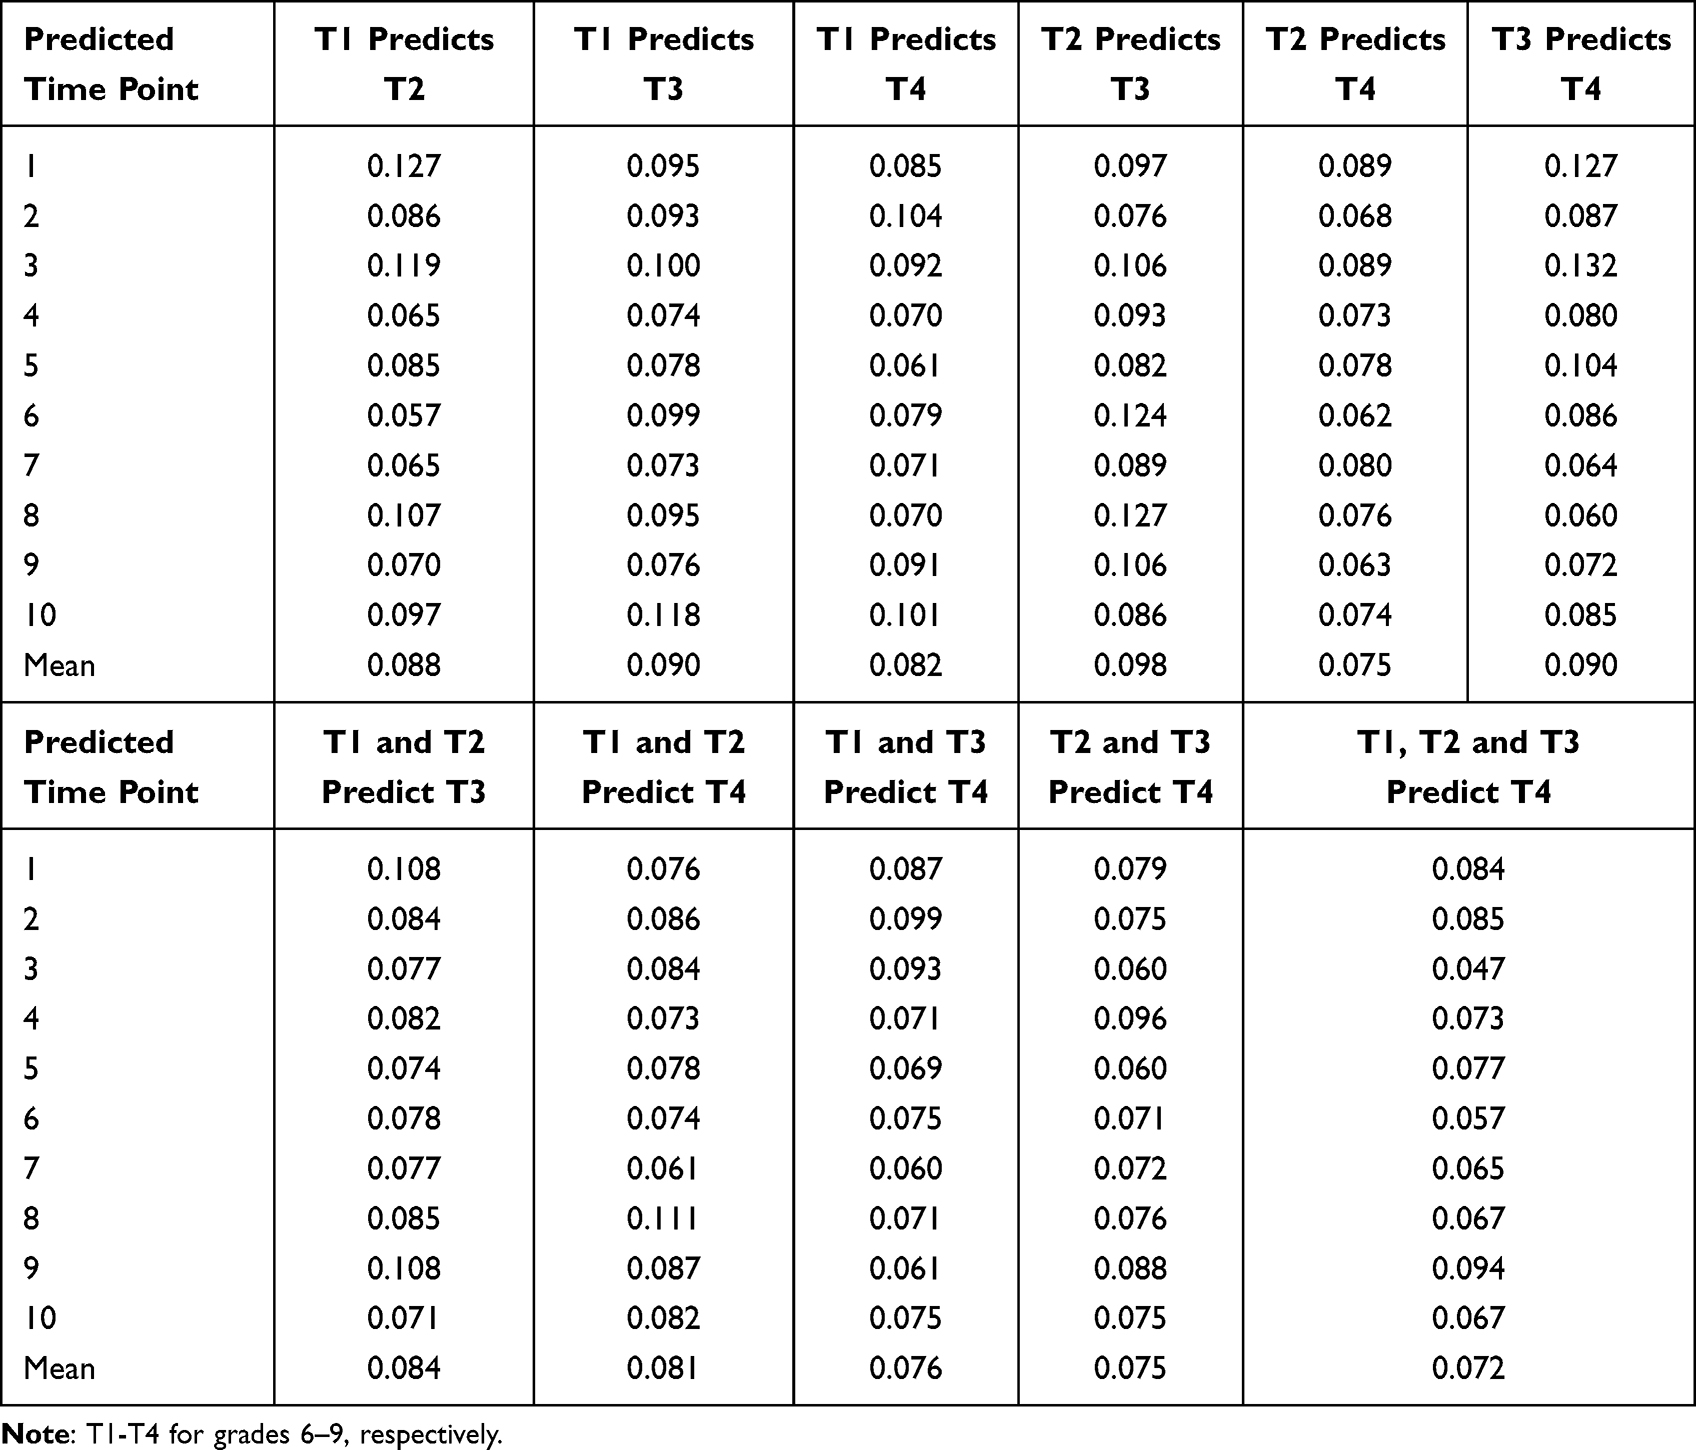 |
Table 2 Neural Network Model Analysis of PIU Output Results Table |
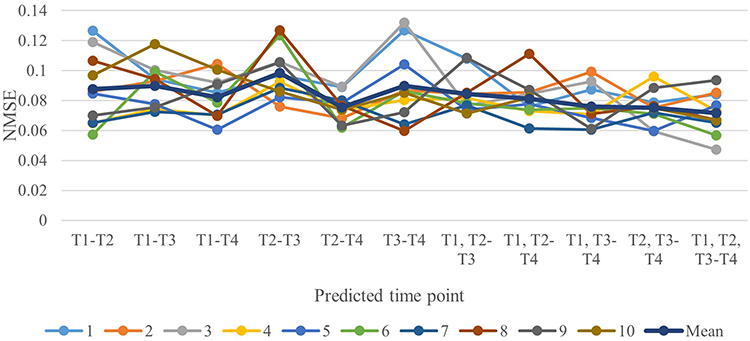 |
Figure 4 Neural network model analysis of PIU output results graph. Note: T1-T4 for grades 6–9, respectively. |
Comparison of Linear Mixed Model and Neural Network Model and Prediction Analysis Results
The prediction results of the two analysis methods are compared as follows (Figure 5):
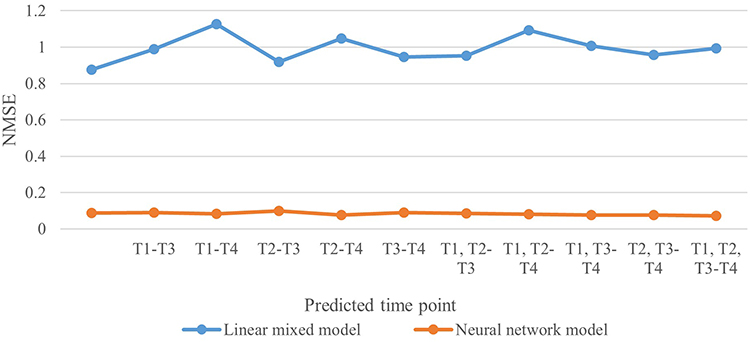 |
Figure 5 Comparison of output results of linear mixed model and neural network model. Note: T1-T4 for grades 6–9, respectively. |
Based on the comparison between the linear mixed model and the neural network model using the normalized mean square error (NMSE) as the evaluation metric, several important findings emerge:
In the linear mixed model, certain data sets, such as 1–4, 2–4, 1–2–4, and 1–3–4, exhibit NMSE values above 1, indicating that these data sets are not valid and may have poor predictive accuracy. Other data sets in the linear mixed model have NMSE values ranging from around 0.8 to 0.9, suggesting suboptimal accuracy with large prediction errors. On the contrary, the neural network model consistently demonstrates better performance. The mean value of the NMSE for the neural network model remains below 0.1, indicating higher accuracy and better stability of results when dealing with psychological longitudinal data. Based on these comparison results, it can be concluded that the neural network model has superior model fitting capabilities compared to the linear mixed model when analyzing psychological longitudinal data.
These findings underscore the advantage of employing neural network models for predictive analysis in longitudinal psychological research, as they exhibit better accuracy and stability in capturing complex patterns and relationships in the data.
Neural Network Models to Analyze the Results of Data Studies at Different Time Points
After importing the data into the neural network model, we conducted a thorough analysis of the data from various periods. Subsequently, we computed the average of multiple experiments (refer to Table 2 and Figure 3). In the comparative study (refer to Figure 4), we observed that utilizing the neural network model to predict based on data from different periods resulted in fluctuating data within a specific range. Notably, the highest normalized mean square error and lowest accuracy were evident when predicting the dependent variable of the third test using the independent variable from the second test. However, as we predicted the dependent variable using data from multiple time points, the accuracy significantly improved.
As a result, we can deduce that when employing single time point data for predictive analysis, the accuracy of using the second test’s independent variable to predict the dependent variable of the fourth test is higher. Conversely, when multiple time point data is available for predictive analysis, employing the first three independent variables to predict the dependent variable of the fourth test yields higher accuracy.
Discussion
Discussion of the Results of a Study Comparing Linear Mixed Models and Neural Network Models for Problematic Internet Usage Longitudinal Data
Based on the comparison of the results and findings from this study, it is evident that the neural network model outperforms the linear mixed model when dealing with psychological longitudinal data. This conclusion aligns with previous research conducted by Li, Zhang, Wang et al, and Zhao et al,6,41–43 which also demonstrated the superiority of neural network models in various predictive analyses.
Specifically, Li found that the normalized mean square error of the neural network model was smaller than that of the linear mixed model for both long-term and short-term predictions on longitudinal data.6 Zhang also highlighted the advantage of neural network models over linear mixed models in constructing disease-specific models, complementing traditional approaches.41
Moreover, Wang et al compared neural network models and decision tree methods with linear regression models and observed that both neural network models and decision tree models exhibited high predictive power.42 Similarly, Zhao et al conducted a cross-sectional study on PIU and time management tendencies among junior high school students using BP neural network models, and the findings indicated that neural network models offered more accurate predictions across different variables such as gender and regions.43
Therefore, the consistent findings from this study and the comparative results of other scholars reinforce the predictive advantage of neural network models, especially in analyzing psychological longitudinal data. This advantage empowers psychology researchers to make more precise predictions of various issues and, subsequently, implement more accurate and targeted interventions. The utilization of neural network models contributes to advancing the effectiveness and precision of predictive analysis in psychological research.
Discussion of the Results of a Study of Neural Network Models for Predicting PIU Among Junior High School Students
The results clearly demonstrate that when employing the neural network model, data fluctuates within a certain range when predicting based on data from different periods. Notably, the highest normalized mean square error and lowest accuracy were observed when predicting the dependent variable of the third test using the second test’s independent variable. However, the accuracy improved when predicting the dependent variable using multiple sets of data.
These findings align with previous studies showing the strong stability of PIU.44 Moreover, social support and loneliness have been identified as predictors of PIU,14 with shyness also exerting a significant predictive effect.9 Additionally, self-esteem among junior high school students was found to be positively associated with PIU.3
Shek and Yu’s follow-up survey of Hong Kong secondary school students revealed that the proportion of junior high school students in the PIU group increased from 26.4% to 26.7%.18 Those who met the criteria for PIU at the first measurement were more likely to be classified as a PIU group at the second measurement. Furthermore, the level of PIU among junior high school students tended to increase significantly over a period of one and a half years.17–19
The present study provides more accurate predictions to further elucidate the factors influencing junior high school students’ PIU and its variations over time.
Limitations
Conclusion
Ethics Approval and Consent to Participate
The study was approved by the Institutional Review Board (or Ethics Committee) of Ethics Committee of Shandong Normal University and this study was conducted in accordance with the Declaration of Helsinki. The parents of the participants signed an informed consent form, and the participants were told that the information they provided was anonymous and confidential. We declare that participants in our research study allow us to use their data for academic research and publication.
Funding
This project is supported by the Shandong Province Natural Science Foundation (ZR2020MF158).
Disclosure
The authors report no conflicts of interest in this work.
References
1. Pan Q, Xiao SH. Advances in research on pathological Internet use. Chin J Clin Psychol. 2002;03:237–240.
2. Yang KX A study on the relationship between anxiety, depression, personality traits and Internet overuse among middle school students in a school in Jinan [MA thesis]. Shandong University; 2021. doi:10.27272/d.cnki.gshdu.2021.002632.
3. Zhang Y Current situation and intervention study of negative life events, self-esteem and Internet addiction among junior high school students [Master’s thesis]. Yan’an University; 2021. doi:10.27438/d.cnki.gyadu.2021.000321.
4. Feng YX Research on the regulation of short video content [Master’s thesis]. Beijing Printing Institute; 2021. doi:10.26968/d.cnki.gbjyc.2021.000065.
5. Zhang ML Research on the relationship between junior high school students’ tendency of Internet addiction and their personality traits and coping styles [Master’s thesis]. Hebei Normal University; 2007. https://kns.cnki.net/KCMS/detail/detail.aspx?dbname=CMFD2008&filename=2007151023.nh.
6. Li HM, Wu XZ, Wang T. Comparison of neural networks based on longitudinal data and multicollinearity data with traditional methods. Stat Decis Making. 2020;36(9):22–25. doi:10.13546/j.cnki.tjyjc.2020.09.004
7. de Lacy N, Ramshaw MJ, McCauley E, et al. Predicting individual cases of major adolescent psychiatric conditions with artificial intelligence. Transl Psychiatry. 2023;13(1):314. doi:10.1038/s41398-023-02599-9
8. Tate AE, McCabe RC, Larsson H, Lundström S, Lichtenstein P, Kuja-Halkola R. Predicting mental health problems in adolescence using machine learning techniques. PLoS One. 2020;15(4):e0230389. doi:10.1371/journal.pone.0230389
9. Caplan ES. Problematic Internet use and psychosocial well-being: development of a theory-based cognitive–behavioral measurement instrument[J]. Computers in Human Behavior. 2002;18(5):553–575. doi:10.1016/S0747-5632(02)00004-3
10. Caplan ES. Theory and measurement of generalized problematic Internet use: a two-step approach[J]. Computers in Human Behavior. 2010;26(5):1089–1097. doi:10.1016/j.chb.2010.03.012
11. CNNIC Internet Research. The 51st statistical report on China’s Internet development. China Education Network. 2023;51:23.
12. Ary DV, Duncan TE, Biglan A, Metzler CW, Noell JW, Smolkowski K. Development of adolescent problem behavior. J Abnorm Child Psychol. 1999;27(2):141–150. doi:10.1023/a:1021963531607
13. Rankin JH, Kern R. Parental attachments and delinquency. Criminology. 1994;32(4):495–515. doi:10.1111/j.1745-9125.1994.tb01163.x
14. Qiu LB Research on the influence of social support and loneliness on internet addiction and intervention for junior high school students [Master’s thesis]. Zhengzhou University; 2018.
15. Gao F, Guo Z, Tian Y, Si Y, Wang P. Relationship between shyness and generalized pathological internet use among Chinese school students: the serial mediating roles of loneliness, depression, and self-esteem. Front Psychol. 2018;9:1822. doi:10.3389/fpsyg.2018.01822
16. Liu DY, Li DP. Parenting styles and adolescent Internet addiction: a test of the mediating and moderating role of selfresilience. Psychol Sci. 2017;40(06):107–113. doi:10.16719/j.cnki.1671-6981.20170617
17. Witt EA, Massman AJ, Jackson LA. Trends youth’s video game playing, overall computer use, and communication technology use: the impact of self-esteem and the big five personality factors. Computers in Human Behavior. 2011;27(2):763–769. doi:10.1016/j.chb.2010.10.025
18. Shek DT, Yu L. Internet addiction phenomenon in early adolescents in Hong Kong. ScientificWorldJournal. 2012;2012:104304. doi:10.1100/2012/104304
19. Xu FZ, Zhang WX. The relationship between adolescent alienation and pathological Internet use: an examination of the moderating effects of family functioning and peer acceptance. J Psychol. 2011;43(4):410–419.
20. Luo F, Lu XL A study on the correlation between peer relationships and Internet use among middle school students. Enhancing the awareness and function of psychology in serving society.
21. Wang W. Prevention of adolescent depression: introduction of adolescent resilience counseling program. Psychol Sci. 2000;4.
22. Feng ZY Comparative study and application of wavelet neural network and BP network [Master’s thesis]. Chengdu University of Technology; 2007. https://kns.cnki.net/KCMS/detail/detail.aspx?dbname=CMFD2007&filename=2007142764.nh.
23. Werbos P Beyond regression: new tools for prediction and analysis in the behavioral sciences. [Boston: PhD Thesis]. Harvard University; 1974.
24. P R F, Xu Y. A computational theory of child overextension. Cognition. 2021;206:104472. doi:10.1016/j.cognition.2020.104472
25. Wang P, Meng W, Xuan Z, et al. Multidimensional item response theory compensatory model parameter estimation: Based on generalized regression neural network ensemble. Psychol Explor New. 2019;03:244–249.
26. Wang SG. New developments in linear mixed model theory. J Beijing Inst Technol. 2000;03:73–81.
27. Hafkemeijer L, de Jongh A, van der Palen J, Starrenburg A. Eye movement desensitization and reprocessing (EMDR) in patients with a personality disorder. Eur J Psychotraumatol. 2020;11(1):1838777. doi:10.1080/20008198.2020.1838777
28. Peltonen K, Kangaslampi S. Treating children and adolescents with multiple traumas: a randomized clinical trial of narrative exposure therapy. Eur J Psychotraumatol. 2019;10(1):1558708. doi:10.1080/20008198.2018.1558708
29. Fishbaugh J, Durrleman S, Piven J, Gerig G. A framework for longitudinal data analysis via shape regression. Proc SPIE Int Soc Opt Eng. 2012;8314. doi:10.1117/12.911721
30. Radloff LS. The CES-D scale: a self- report depression scale for research in the general population. Appl Psychol Meas. 1977;1(3):385–401. doi:10.1177/014662167700100306
31. Ellison NB, Steinfield C, Lampe C. The benefits of Facebook“friends:” social capital and college students’ use of online social network sites. J Comput-Mediated Commun. 2007;12(4):1143–1168. doi:10.1111/j.1083-6101.2007.00367.x
32. Zhao F, Zhang ZH, Bi L, et al. The association between life events and internet addiction among Chinese vocational school students: the mediating role of depression. Computers in Human Behavior. 2007;70:30–38. doi:10.1016/j.chb.2016.12.057
33. Kor A, Zilcha-Mano S, Fogel YA, Mikulincer M, Reid RC, Potenza MN. Psychometric development of the problematic pornography use scale. Addict Behav. 2014;39(5):861–868. doi:10.1016/j.addbeh.2014.01.027
34. Király O, Sleczka P, Pontes HM, Urbán R, Griffiths MD, Demetrovics Z. Validation of the ten-item internet gaming disorder test (igdt-10) and evaluation of the nine DSM-5 internet gaming disorder criteria. Addict Behav. 2015;64:253–260. doi:10.1016/j.addbeh.2015.11.005
35. Henderson L, Zimbardo P Measuring the dimension of shyness.
36. Wang YZ, Shi SH. Preparation for life satisfaction scales applicable to college students(CSLSS). Chin J Behav Med Sci. 2003;2:199–201.
37. Rosenberg M. Society and the Adolescent Self-Image. Princeton NJ: Princeton University Press; 1965.
38. Russell D, Peplau LA, Ferguson ML. Developing a measure of loneliness. J Personality Assess. 1978;42(3):290–294. doi:10.1207/s15327752jpa4203_11
39. Gómez P, Harris SK, Barreiro C, Isorna M, Rial A. Profiles of internet use and parental involvement, and rates of online risks and problematic internet use among Spanish adolescents. Computers in Human Behavior. 2017;75:826–833. doi:10.1016/j.chb.2017.06.027
40. Liu HY. Advanced Psychostatistics. Beijing: China Renmin University Press; 2019.
41. Zhang WX, Su HX, Sun LJ, Zhang YH. Research progress of neural network model in longitudinal follow-up data analysis. Prev Med. 2017;01:127–129.
42. Wang DY, Yu JY Application of neural networks and decision trees in psychometric classification. (eds.) psychology and innovation enhancement.
43. Zhao DX, Liu HY A study on the application of BP neural network model in middle school students’ internet addiction.
44. Liu XX, Wang F, Chu YJ, Bao ZZ The relationship between adolescent problematic internet use and sleep problems: a cross-lagged study.
45. Dong Q, Zhang J, Li Q, et al. Multi-task dictionary learning based on convolutional neural networks for longitudinal clinical score predictions in alzheimer’s disease. In: Zeng A, Pan D, Hao T, Zhang D, Shi Y, Song X, editors. Human Brain and Artificial Intelligence. Communications in Computer and Information Science. Singapore: Springer; Vol. 1072, 2019. 21–35.
46. Chen ZE. Research and Application of Data Mining Artificial Neural Network in Prognosis Prediction of Colorectal Cancer [D]. Fujian Medical University; 2017.
 © 2024 The Author(s). This work is published and licensed by Dove Medical Press Limited. The
full terms of this license are available at https://www.dovepress.com/terms
and incorporate the Creative Commons Attribution
- Non Commercial (unported, 3.0) License.
By accessing the work you hereby accept the Terms. Non-commercial uses of the work are permitted
without any further permission from Dove Medical Press Limited, provided the work is properly
attributed. For permission for commercial use of this work, please see paragraphs 4.2 and 5 of our Terms.
© 2024 The Author(s). This work is published and licensed by Dove Medical Press Limited. The
full terms of this license are available at https://www.dovepress.com/terms
and incorporate the Creative Commons Attribution
- Non Commercial (unported, 3.0) License.
By accessing the work you hereby accept the Terms. Non-commercial uses of the work are permitted
without any further permission from Dove Medical Press Limited, provided the work is properly
attributed. For permission for commercial use of this work, please see paragraphs 4.2 and 5 of our Terms.