")
Back to Journals » ClinicoEconomics and Outcomes Research » Volume 15
Prediction of Future Medical Costs by Modifiable Measures of Health
Authors Haji-Sheikhi F, Fragala MS, Bare LA, Rowland CM, Goldberg SE
Received 1 February 2023
Accepted for publication 1 June 2023
Published 30 June 2023 Volume 2023:15 Pages 525—534
DOI https://doi.org/10.2147/CEOR.S406525
Checked for plagiarism Yes
Review by Single anonymous peer review
Peer reviewer comments 3
Editor who approved publication: Prof. Dr. Dean Smith
Farnoosh Haji-Sheikhi, Maren S Fragala, Lance A Bare, Charles M Rowland, Steven E Goldberg
Quest Diagnostics, Secaucus, NJ, USA
Correspondence: Maren S Fragala, Quest Diagnostics, 500 Plaza Dr, Secaucus, NJ, 07094, USA, Tel +1 508 728 2923, Email [email protected]
Introduction: Strategies to mitigate rising health-care costs are a priority for patients, employers, and health insurers. Yet gaps currently exist in whether health risk assessment can forecast medical claims costs. This study examined the ability of a health quotient (HQ) based on modifiable risk factors, age, sex, and chronic conditions to predict future medical claims spending.
Methods: The study included 18,695 employees and adult dependents who participated in health assessments and were enrolled in an employer-sponsored health plan. Linear mixed effect models stratified by chronic conditions and adjusted for age and sex were utilized to evaluate the relationship between the health quotient (score of 0– 100) and future medical claims spending.
Results: Lower baseline health quotient was associated with higher medical claims cost over 2 years of follow up. For participants with chronic condition(s), costs were $3628 higher for those with a low health quotient (< 73; N = 2673) compared to those with high health quotient (> 85; N = 1045), after adjustment for age and sex (P value = 0.004). Each one-unit increase in health quotient was associated with a decrease of $154 (95% CI: 87.4, 220.3) in average yearly medical claims costs during follow up.
Discussion: This study used a large employee population with 2 years of follow-up data, which provides insights that are applicable to other large employers. Results of this analysis contribute to our ability to predict health-care costs using modifiable aspects of health, objective laboratory testing and chronic condition status.
Keywords: employee population, healthcare spend, health quotient, health risk assessment, medical claims costs
Plain Language Summary
Health-care costs are rising. Predicting and modifying risk factors for high medical costs can save money. This study examined how a health score could predict future medical costs in more than 18,000 people. Over 2 years of follow-up, a lower health score was associated with higher medical costs.
Introduction
Large employers commonly invest in workplace health programs to improve the health of the workforce and mitigate rising health-care costs.1 Health risk assessments in workplace settings have the potential to aid in the development of an effective program, particularly when health risk assessments include modifiable risk factors for chronic diseases.2 Health risk assessments commonly include “behavioral” elements that can be modified with healthy lifestyle choices, including tobacco use, physical activity, alcohol consumption, blood pressure, body weight, missed days of work due to illness, lipid measures, and safety.3,4 Laboratory tests included in health risk assessments have been used to identify previously unrecognized medical conditions, such as lipid disorders, cardiovascular disease, and diabetes.5 Workplace health programs can maintain low and moderate health risk levels among employees and their dependents, as shown in a prospective longitudinal quasi-experimental study over eight years.6
Several studies have reported a relationship between health status, as measured by health risk assessment tools, and medical claims costs.3,7–9 In a large employee population, Yen et al demonstrated incremental total medical claims reductions of $56 per each additional point on their wellness score, and increases of $3574 for an existing major disease.3 In addition, retrospective analysis of well-being assessments in two large employers showed that employees who improve their wellbeing have been reported to be less likely to develop illness, avoiding $3600 of total annual health costs per occurrence and $26 to $62 per member per year.10 Since gaps currently exist in whether health risk assessments are associated with future medical claims costs, this analysis examined whether a health quotient (HQ) based on modifiable behaviors and objective laboratory testing is associated with future medical claims costs in a large employee population.
Methods
The HQ used in this employer-sponsored health assessment was generated based on the aggregate results of a health risk assessment questionnaire, venipuncture laboratory results, and biometric measurements comprised 12 components. Components of the HQ included modifiable risk factors previously shown to be associated with health-care expenditures based on prior research.7,8,11 Seven components were gathered solely from the questionnaire and included information relating to nutrition, safety (eg, seat belt use), alcohol consumption, physical activity, preventive screening, self-care, and stress. Biometric components included measurements of body weight and blood pressure. A cholesterol component was assessed based on laboratory measurements of total cholesterol and ratio of triglyceride to high-density lipoprotein-cholesterol, and a diabetes component was assessed with laboratory measurements of hemoglobin A1C and fasting glucose. A tobacco use component was based on either a positive response to the survey questionnaire or positive cotinine test result. The HQ used in this study ranges from 1 to 100, with a higher total HQ being associated with better health status.
This study analyzed the association between the HQ and future medical costs in an employee population of a healthcare company. The analysis included deidentified data from all employees and adult dependents (health plan beneficiaries) who participated in an employer-sponsored annual screening in 2016 and had continuous eligibility and medical coverage for the subsequent two years following the screening (2017 and 2018) (Figure 1). Approximately 35,000 participated in an annual screening in 2016 and less than 20,000 had 36 months (3 years) of medical claims. Of the eligible participants, 18,695 had complete data. The analysis was conducted according to the HIPAA Privacy Rule (Title 45 Code of Federal Regulations, Section 164.514e), which governs research conducted by Covered Healthcare Entities and allows retrospective analysis using a limited data set without requiring approval by an institutional review board.
 |
Figure 1 Study cohort selection. |
The baseline characteristics of participants were obtained from the wellness exam in 2016 and included age, sex, self-reported ethnicity, self-reported education, chronic conditions, and the HQ. Chronic conditions, defined based on the presence of an existing condition, were reported as Episode Treatment Groups (ETGs) (Optum, Inc.).12 The conditions represent those known to be associated with higher medical claims costs, as in prior research,3 and included anemia, cancer, diabetes, deep vein thrombosis, gastroenterological disease, heart disease, kidney disease, mental health, metabolic (obesity), pulmonary disease, and stroke. A binary indicator (ie, “Yes” or “No”) was created to flag participants with chronic conditions. The HQ was categorized as low (<73), intermediate (73–85), or high (>85) to identify groups in need of different levels of future health interventions; thresholds were based on the first and third quartile of the complete data set. To capture individuals with similar medical costs, age was categorized into three groups: under 45 (<45), 45–55, and 55 and over (≥55).
Follow-up medical costs were obtained from insurance claims in 2017 and 2018. Individual medical costs (as per member per year costs) were summed to determine the annual cost per year, which included inpatient, outpatient, pharmacy, and professional claims. The average annual medical claims costs over the 2-year follow-up period were considered as the primary outcome. Costs related to pregnancy and delivery were excluded from the analysis.
Statistical Analysis
This study was a retrospective cohort analysis of longitudinal data to examine how health quotient (HQ) generated from a health assessment program are associated with prospective medical costs adjusting for age, sex, and chronic conditions. Data were randomly split into a training set (two-thirds of the data), which was used to build the model, and an independent test set, which was used to evaluate model performance. Descriptive statistics were used to summarize the baseline characteristics of individuals and included percentages and counts for the categorical data and mean and standard deviation for the continuous variables. The distribution of baseline characteristics in the training and testing data sets were compared by using Chi-square for categorical variables or by using t-test or the Wilcoxon rank sum test for continuous variables.
Visual inspection of the mean medical costs within HQ categories by chronic condition indicated a possible interaction and therefore a linear regression model was used to test for the significance of the interaction (Figure 2). To enhance the clarity of the model interpretation, we developed linear mixed-effect models stratified by chronic condition using the training dataset.
 |
Figure 2 Change in categories of health quotient comparing individuals with a chronic condition and without a chronic condition. |
The stratified models by chronic condition evaluated the association of the HQ with future medical claims costs after adjusting for age and sex. To account for heterogeneity of variability of medical claims costs among subjects with similar baseline characteristics, a group variable was formed according to individual’s age, sex, chronic condition, and the HQ score (3 age groups × 2 sex groups × 2 chronic conditions × 3 HQ groups, NGroup=36). The group variable was included in the linear mixed model as a random effect. This approach allowed the variance of the model errors to differ by group since medical costs and thus the absolute model errors can differ dramatically by age, gender, HQ, and chronic conditions. In addition, by using the group random effect, the problem of the severely skewed cost measures was reduced after validating the residuals of the model with and without the group random effect.
The primary models stratified by chronic condition were developed using categorical variables for HQ and age and the secondary models were considered with continuous variables for both HQ and age.
The training models were applied to the independent test set stratified by chronic condition. This process allowed testing of models’ reproducibility on an independent sample test. Overall, 12,463 (66.7%) were randomized to the training data set and 6232 (33.3%) to the test data set. The predicted medical claims costs for each individual in the test data were calculated based on the regression coefficients, person’s age, gender, chronic condition, and HQ score.
To evaluate the model performance, we compared the predicted and actual medical claims costs at the group level using several metrics. Given that the actual medical claim costs were not normally distributed, Wilcoxon signed-rank test, Root Mean Squared Error (RMSE), Normalized RMSE (NRMSE), and Spearman’s rank correlation coefficient (rs) were used to evaluate the model performance.
These metrics allowed us to assess the agreement between the predicted and actual costs, taking into account different aspects such as the magnitude of errors and the non-normality of the distribution. Specifically, the Wilcoxon signed-rank evaluated whether there was a significant difference between the median of the predicted and actual costs, while the RMSE and NRMSE quantified the overall magnitude of errors. Finally, the Spearman’s rank correlation coefficient assessed the strength and direction of the relationship between the predicted and actual costs.
Differences were considered statistically significant at a P value <0.05. All statistical analyses were performed in R version 3.6.3.13 using “tidyverse” for data manipulation, “lmer” for mixed effect modeling, “Metrics” for prediction measures, “ggplot2” for visualization, and “stats” for descriptive statistics from R library.
Results
Data from 18,695 employees and spouses met eligibility criteria and were included in the analysis (Figure 1). The majority (66.2%) of participants were female (Supplementary Table A-1), the median (interquartile) age was 48 (39–56) years (Supplementary Table A-1), majority of the participants were white 38.7%, and 50.5% had at least graduated college or above. The median (interquartile) HQ was 78 (72–84), 21.2% of the participants had a high HQ (>85), 49.1% had an intermediate HQ (73–85), and 29.7% had a low HQ (<73) (Supplementary Table A-1). The majority of the study participants (12,011; 64.2%) had a chronic condition (Supplementary Table A-1).
Characteristics of individuals in the training data set did not differ significantly from those in the test data set (Table 1). The full linear regression model on the training set with interaction between HQ and chronic condition showed that average medical costs increase for individuals with lower HQ and chronic conditions (Figure 2; Interaction P < 0.001). The results of stratified models by chronic condition are shown in Table 2 and Table 3.
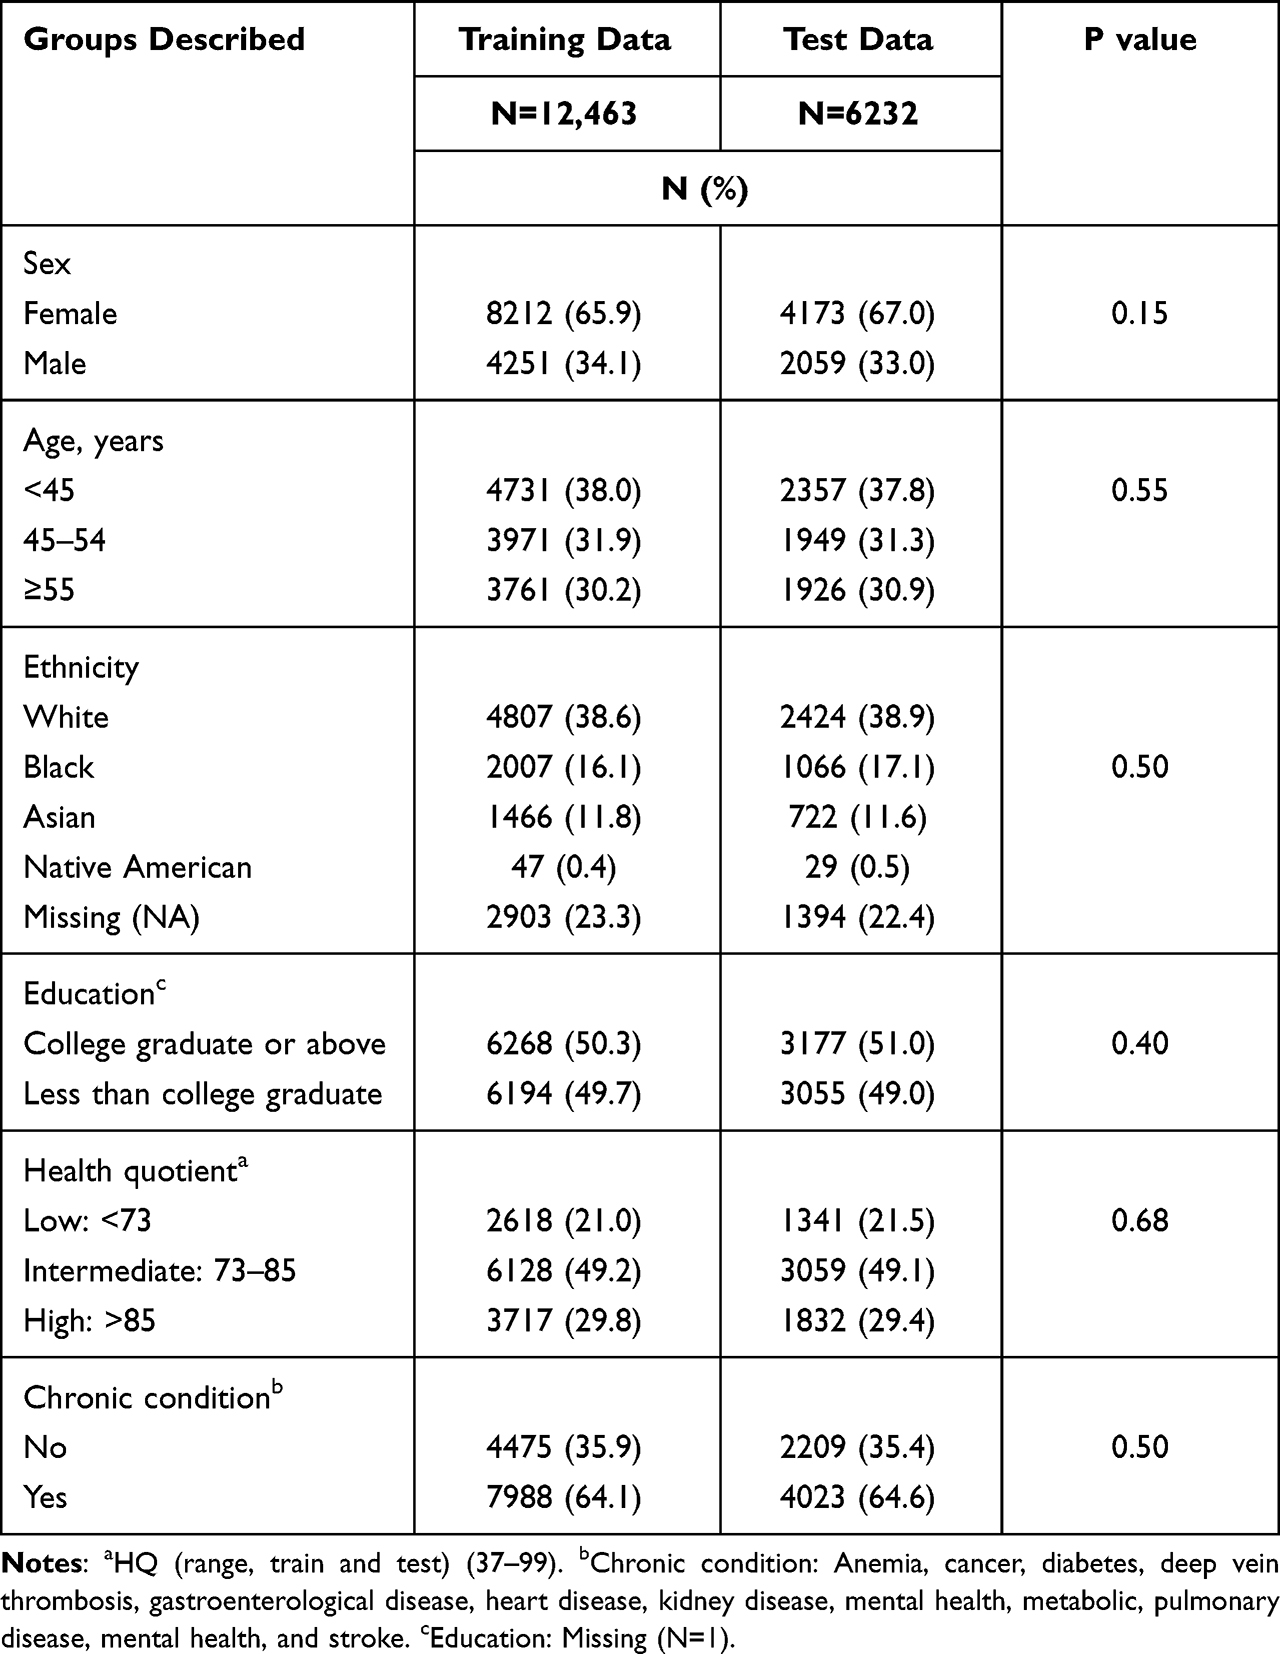 |
Table 1 Baseline Characteristics of the Study Participants |
 |
Table 2 Linear Mixed Effect Model of Future Health-care Costs Stratified by Chronic Condition with Categorical Health Quotient (Training Set, N = 12,463) |
 |
Table 3 Linear Mixed Effect Model Stratified by Chronic Condition with Continuous Health Quotient (Training Set, N = 12,463) |
The categorical model stratified by chronic condition identified that, among participants with a chronic condition, a lower HQ was associated with higher future annual average health-care claims costs (Table 2). For the population with chronic conditions, medical claims costs were $3628 higher for individuals with low HQ compared to those with high HQ, after adjusting for age and sex (P = 0.004) (Table 2). For individuals without a chronic condition, average medical claims costs were $2400 higher among those who were older than 55 years than among those under 45 (P < 0.001; Table 2).
Adjusted medical claims were $2636 higher for individuals with low HQ comparing to those with intermediate HQ (P=0.02; Supplementary Table A-2). The model with HQ and age as continuous variables (HQ ranging from 1 to 100, Age ranging from 19 to 87), estimated medical claims costs declined by ~$154 per one unit increase in HQ ($1540 per 10 unit increase in HQ) among individuals with chronic conditions (Table 3). In addition, for individuals with chronic conditions, average medical claims costs were $154 higher per additional year of age (P < 0.001; Table 3). For individuals without chronic conditions, average medical claims costs were $91 higher per additional year of age (P < 0.001; Table 3). The models without chronic condition indicated that HQ was not associated with future medical costs after adjusting for age and gender (Table 2 and Table 3).
To verify the models’ predictive value, the overall medical claims costs were calculated for the test data according to the regression coefficients and each individual’s age, sex, chronic condition, and HQ. The scatter plots of predicted values versus actual values of the test data at group level for both models are shown in Figure 3. On average, the annual predicted costs were $791 and $683 lower than the actual costs for the test data for categorical and continuous models with chronic conditions (Table 4). These differences between the predicted and actual costs were not statistically significant (Table 4). The Spearman’s rank correlation coefficients (rs) between the predicted and actual values for test data for models with chronic conditions were statistically significant (Categorical model (rs:0.6, P = 0.01), Continuous model (rs:0.5, P = 0.04)).
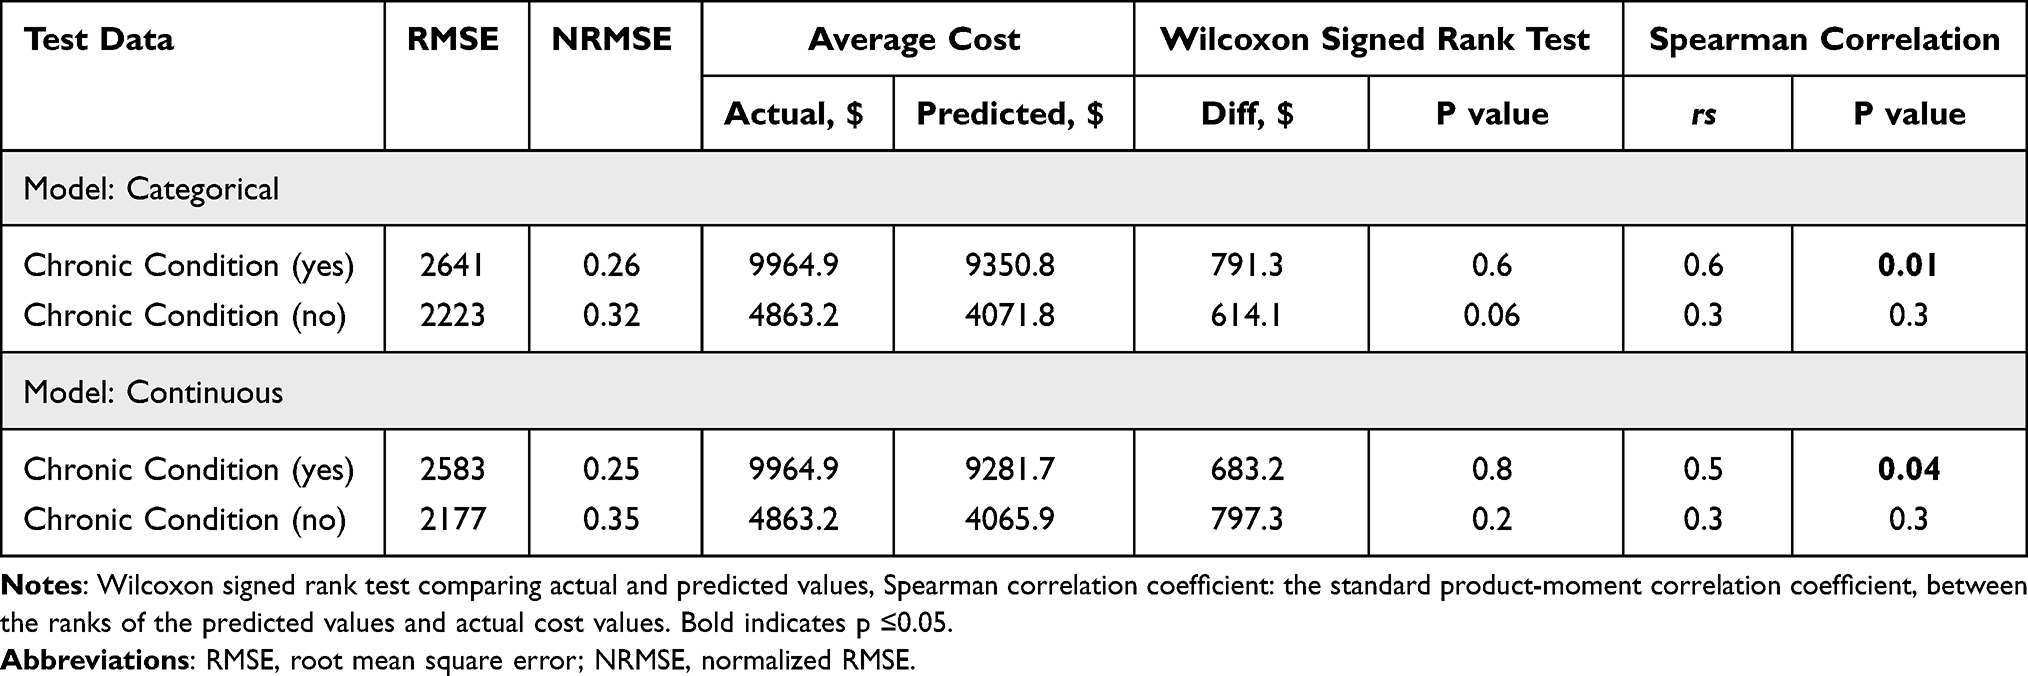 |
Table 4 Comparisons of Average Annual Medical Claims Costs Between Actual Values and Predicted Value |
 |
Figure 3 Predicted vs actual health care costs by chronic condition status at group level for (a) Categorical model; (b) Continuous model. |
In addition, models with chronic condition had the lowest average errors (Test data: NRMSE: Categorical model: 26%, Continuous model: 25%) (Table 4).
Discussion
This analysis shows that the HQ used in this employer-sponsored health assessment can help forecast future medical claims costs in an employee population: a lower HQ at baseline was associated with significantly higher medical claims costs over the subsequent 2 years. These findings build on prior research showing relationships between health-care costs and potentially modifiable behavior, health risks, and chronic conditions,14,15 where costs increase as the number of risk factors and age increase.16 Adding to prior research, the current study used a prospective model including 3-years of current health-care costs and HQ based on health behaviors and laboratory measures, in a large employee population, and reported annual average incremental healthcare spend of $154 per 1 unit decrease in HQ.
Health-care costs were higher for those with lower health quotient and older age, regardless of presence of a chronic condition. Differences in health-care costs for individuals with lower HQ are in line with previous findings.3 In previous research, medical costs were $67 to $778 higher for employees classified as high risk by health risk appraisal.3 At an incremental level, total medical claim costs decreased $56 for each additional point on the HQ, increased $88 for each additional age, and increased $3574 for an existing major disease.3
Approximately 64% of the study population had a chronic condition such as anemia, cancer, diabetes, deep vein thrombosis, gastroenterological disease, heart disease, kidney disease, metabolic, pulmonary disease, a mental health condition, and stroke. While the chronic condition definition was broad, the requirement of having 3 years of consecutive medical plan coverage to be included in the analysis, potentially biased the representation of those with a chronic condition requiring ongoing care. Although individuals with chronic conditions had higher health-care costs than those without, healthy lifestyle practices, as evidenced by a higher HQ, were associated with significantly lower health-care costs. For the population with chronic conditions, annual per-person costs were $3628 higher among individuals with low HQ (<73) than among those with high HQ (>85), after adjusting for age and sex. Thus, applications of health risk assessments can play an important role in identifying employees who may be more vulnerable to higher future health-care costs. Identifying this population may help to design interventions to lower health-care costs by managing the identified health conditions.
Assessment of health risk in HQ components may also create the opportunity for early identification of unengaged health risk and unengaged chronic conditions at the participant level.17,18 Assessment of 86,895,424 person-years of employee medical claims (from the IBM Watson Health MarketScan Commercial Claims and Encounters Database) revealed that only a minority (29% men and 36% women) of employees received a complete set of high priority preventative health services.19 With identification of risk and targeted care pathways, chronic health conditions can be prevented and managed.20–22 The components in the health assessment described here included measures based on modifiable health behaviors known to influence health outcomes. Participating in health risk assessments has been associated with lower health-care costs (29% lower total and 36% lower lifestyle-related costs), lower inpatient costs, fewer hospital admissions, and fewer hospital days of care.23
Worksite health promotion programs have demonstrated effectiveness in moving people to lower risk categories, especially in the first year of the program.15 Significant reductions in health risks have been demonstrated, especially related to high-risk blood pressure, high-risk fasting blood glucose, and high-risk stress.14 Interventions targeted at preventing the onset of health risks and reducing the risks of those with multiple risks appear most beneficial.16 Yet previous research has shown that cost decreases from health improvements do not match cost increases from health declines. In a previous study, the mean cost increase per risk factor ($350) was more than double the mean cost decrease per risk factor decreased ($150).16 Annual cost savings associated with improved wellbeing were reported to be greater for individuals with chronic condition (US$62) than for those without ($26).10 Moreover, cost savings appear to be the greatest among those who participate in workplace health programs consistently over several years.16
Findings from this analysis likely have implications for self-insured employers facing similar workforce challenges. Health risks contribute to excessive direct and indirect costs. Excess health risks have been reported to account for an estimated 25% healthcare costs.16 In addition to direct health-care costs, health risk factors such as excessive alcohol consumption, elevated blood glucose, and sedentary behavior have been associated with indirect costs to employers as greater absenteeism.24 Health risk factors are associated with higher absenteeism and lower productivity.16 Thus, other employers may consider evaluating health risk as strategy to improve the health and productivity of the workforce.
Limitations
The findings of this analysis should be interpreted in the context of a few potential limitations. The study population represented a single employer in the healthcare industry, with a larger percentage of female employees. Detailed socioeconomic data were not available on the study population. Results may differ for employees in other industries with different employee profiles and socioeconomic status. In addition, the analysis did not address the potential impact from what has been described as a “natural flow model” in an employee population over time.14 According to the natural flow model, health risks change naturally in an employee population that does not participate in health improvement programs, with most (45–70%) employees remaining in their initial risk category and the rest moving between low, moderate, and high-risk categories within the year. Finally, this analysis was not focused on evaluating a cohort of individuals who had an elevated risk score at the start of the study period, who might have subsequently achieved a lower risk score before or after the year 3 measurement interval. Future analysis on the improvement of HQ would be helpful, especially if workplace interventions are in place to address unengaged health risk and unengaged chronic condition.
Conclusion
Use of the HQ to evaluate health status in a population generates a meaningful prediction of future claims cost. Applications of these findings support the use of health risk assessments like the HQ for identifying individuals with elevated health risk and higher future health-care costs in order to manage their health risk and reduce the cost of their healthcare. Further, as preventative health services are lacking among employees nationally,19 assessment of health risks in the employee setting may bridge this gap to facilitate population health management. Further research is needed to evaluate the impact of engaging specific identified opportunities from the screening on downstream health outcomes and costs.
Ethical Considerations
The analyses of this study were conducted according to the HIPAA Privacy Rule (Title 45 Code of Federal Regulations, Section 164.514e), which governs research conducted by Covered Healthcare Entities and allows retrospective analysis using a limited data set without requiring approval by an institutional review board.
Funding
No funding was provided for this analysis. Work was performed as part of routine work responsibilities of the respective authors.
Disclosure
F H-S, MSF, LAB, CMR, and SEG are employed by and have stock ownership in Quest Diagnostics.
References
1. Kaiser Family Foundation. 2021 employer health benefits survey; 2021.
2. Johnson NB, Hayes LD, Brown K, et al. CDC national health report: leading causes of morbidity and mortality and associated behavioral risk and protective factors-United States, 2005–2013. MMWR Suppl. 2014;63(4):3–27.
3. Yen L, McDonald T, Hirschland D, Edington DW. Association between wellness score from a health risk appraisal and prospective medical claims costs. J Occup Environ Med. 2003;45(10):1049–1057. doi:10.1097/01.jom.0000088875.85321.b9
4. Yen LT, Edington DW, Witting P. Associations between health risk appraisal scores and employee medical claims costs in a manufacturing company. Am J Health Promot. 1991;6(1):46–54. doi:10.4278/0890-1171-6.1.46
5. Kaufman HW, Williams FR, Odeh MA, Ross JS. Value of laboratory tests in employer-sponsored health risk assessments for newly identifying health conditions: analysis of 52,270 participants. PLoS One. 2011;6(12):e28201. doi:10.1371/journal.pone.0028201
6. Aikas A, Absetz P, Hirvensalo M, Pronk N. Eight-year health risks trend analysis of a comprehensive workplace health promotion program. Int J Environ Res Public Health. 2020;17(24):9426. doi:10.3390/ijerph17249426
7. Anderson DR, Whitmer RW, Goetzel RZ, et al. The relationship between modifiable health risks and group-level health care expenditures. Health Enhancement Research Organization (HERO) research committee. Am J Health Promot. 2000;15(1):45–52. doi:10.4278/0890-1171-15.1.45
8. Mills PR, Masloski WS, Bashaw CM, Butler JR, Hillstrom ME, Zimmerman EM. Design, development and validation of the RedBrick health assessment: a questionnaire-based study. JRSM Short Rep. 2011;2(9):71. doi:10.1258/shorts.2011.011015
9. Marcoux V, Chouinard M-C, Diadiou F, Dufour I, Hudon C, Virgili G. Screening tools to identify patients with complex health needs at risk of high use of health care services: a scoping review. PLoS One. 2017;12(11):e0188663. doi:10.1371/journal.pone.0188663
10. Sidney JA, Jones A, Coberley C, Pope JE, Wells A. The well-being valuation model: a method for monetizing the nonmarket good of individual well-being. Health Serv Outcomes Res Methodol. 2017;17(1):84–100. doi:10.1007/s10742-016-0161-9
11. Goetzel RZ, Anderson DR, Whitmer RW, et al. The relationship between modifiable health risks and health care expenditures. An analysis of the multi-employer HERO health risk and cost database. J Occup Environ Med. 1998;40(10):843–854. doi:10.1097/00043764-199810000-00003
12. Forthman MT, Dove HG, Wooster LD. Episode Treatment Groups (ETGs): a patient classification system for measuring outcomes performance by episode of illness. Top Health Inf Manage. 2000;21(2):51–61.
13. R: a language and environment for statistical computing. R Foundation for statistical computing; 2020. Available from: https://www.R-project.org/.
14. Loeppke R, Edington DW, Beg S. Impact of the prevention plan on employee health risk reduction. Popul Health Manag. 2010;13(5):275–284. doi:10.1089/pop.2010.0027
15. Musich S, McDonald T, Hirschland D, Edington DW. Examination of risk status transitions among active employees in a comprehensive worksite health promotion program. J Occup Environ Med. 2003;45(4):393–399. doi:10.1097/01.jom.0000052969.43131.fc
16. Edington DW. Emerging research: a view from one research center. Am J Health Promot. 2001;15(5):341–349. doi:10.4278/0890-1171-15.5.341
17. Davidson KW, Barry MJ, Mangione CM, et al.; Force USPST. Screening for prediabetes and type 2 diabetes: US preventive services task force recommendation statement. JAMA. 2021;326(8):736–743. doi:10.1001/jama.2021.12531
18. Krist AH, Davidson KW, Mangione CM, et al.; Force USPST. Screening for hypertension in adults: US preventive services task force reaffirmation recommendation statement. JAMA. 2021;325(16):1650–1656. doi:10.1001/jama.2021.4987
19. Rundle AG, Torsiello NE, Davis BM, Griffin B, Neugut AI, Levy DL. Analyses of employer medical claims data to assess receipt of high-priority preventive health services. Am J Prev Med. 2020;58(5):715–723. doi:10.1016/j.amepre.2019.12.016
20. Birse CE, Shiffman D, Satish A, et al. Impact of a digital diabetes prevention program on risk factors for chronic disease in a workforce cohort. J Occup Environ Med. 2020;62(12):1040–1045. doi:10.1097/JOM.0000000000002044
21. Fragala MS, Shiffman D, Birse CE. Population health screenings for the prevention of chronic disease progression. Am J Manag Care. 2019;25(11):548–553.
22. Iakoubova OA, Tong CH, Rowland CM, et al. Workplace outreach program improves management of chronic kidney disease. J Occup Environ Med. 2021;64(6):482–487. doi:10.1097/JOM.0000000000002475
23. Goetzel RZ, Jacobson BH, Aldana SG, Vardell K, Yee L. Health care costs of worksite health promotion participants and non-participants. J Occup Environ Med. 1998;40(4):341–346. doi:10.1097/00043764-199804000-00008
24. Parsley IC, Dale AM, Fisher SL, et al. Association between workplace absenteeism and alcohol use disorder from the national survey on drug use and health, 2015–2019. JAMA Netw Open. 2022;5(3):e222954. doi:10.1001/jamanetworkopen.2022.2954
 © 2023 The Author(s). This work is published and licensed by Dove Medical Press Limited. The full terms of this license are available at https://www.dovepress.com/terms.php and incorporate the Creative Commons Attribution - Non Commercial (unported, v3.0) License.
By accessing the work you hereby accept the Terms. Non-commercial uses of the work are permitted without any further permission from Dove Medical Press Limited, provided the work is properly attributed. For permission for commercial use of this work, please see paragraphs 4.2 and 5 of our Terms.
© 2023 The Author(s). This work is published and licensed by Dove Medical Press Limited. The full terms of this license are available at https://www.dovepress.com/terms.php and incorporate the Creative Commons Attribution - Non Commercial (unported, v3.0) License.
By accessing the work you hereby accept the Terms. Non-commercial uses of the work are permitted without any further permission from Dove Medical Press Limited, provided the work is properly attributed. For permission for commercial use of this work, please see paragraphs 4.2 and 5 of our Terms.