")
Back to Journals » Journal of Hepatocellular Carcinoma » Volume 8
Prediction of Early Treatment Response to Initial Conventional Transarterial Chemoembolization Therapy for Hepatocellular Carcinoma by Machine-Learning Model Based on Computed Tomography
Authors Dong Z, Lin Y, Lin F, Luo X, Lin Z, Zhang Y, Li L, Li ZP, Feng ST, Cai H, Peng Z
Received 17 August 2021
Accepted for publication 5 November 2021
Published 30 November 2021 Volume 2021:8 Pages 1473—1484
DOI https://doi.org/10.2147/JHC.S334674
Checked for plagiarism Yes
Review by Single anonymous peer review
Peer reviewer comments 2
Editor who approved publication: Dr Ahmed Kaseb
Zhi Dong,1,* Yingyu Lin,1,* Fangzeng Lin,2,* Xuyi Luo,3 Zhi Lin,1 Yinhong Zhang,1 Lujie Li,1 Zi-Ping Li,1 Shi-Ting Feng,1 Huasong Cai,1 Zhenpeng Peng1
1Department of Radiology, The First Affiliated Hospital, Sun Yat-Sen University, Guangzhou, Guangdong, 510080, People’s Republic of China; 2Department of Interventional Radiology, The First Affiliated Hospital, Sun Yat-Sen University, Guangzhou, Guangdong, 510080, People’s Republic of China; 3Department of Emergency, Guangzhou First People’s Hospital, Guangzhou, Guangdong, 510180, People’s Republic of China
*These authors contributed equally to this work
Correspondence: Huasong Cai; Zhenpeng Peng
Department of Radiology, The First Affiliated Hospital, Sun Yat-Sen University, 58th, The Second Zhongshan Road, Guangzhou, Guangdong, People’s Republic of China
Tel +86 20-87755766, extension 8471
Fax +86 20-87615805
Email [email protected]; [email protected]
Purpose: The treatment response to initial conventional transarterial chemoembolization (cTACE) is essential for the prognosis of patients with hepatocellular carcinoma (HCC). This study explored and verified the feasibility of machine-learning models based on clinical data and contrast-enhanced computed tomography (CT) image findings to predict early responses of HCC patients after initial cTACE treatment.
Patients and Methods: Overall, 110 consecutive unresectable HCC patients who were treated with cTACE for the first time were retrospectively enrolled. Clinical data and imaging features based on contrast-enhanced CT were collected for the selection of characteristics. Treatment responses were evaluated based on the modified Response Evaluation Criteria in Solid Tumors (mRECIST) by postoperative CT examination within 2 months after the procedure. Python (version 3.70) was used to develop machine learning models. Least absolute shrinkage and selection operator (LASSO) algorithm was applied to select features with the impact on predicting treatment response after the first TACE procedure. Six machine learning algorithms were used to build predictive models, including XGBoost, decision tree, support vector machine, random forest, k-nearest neighbor, and fully convolutional networks, and their performances were compared using receiver operator characteristic (ROC) curves to determine the best performing model.
Results: Following TACE, 31 patients (28.2%) were described as responsive to TACE, while 72 patients (71.8%) were nonresponsive to TACE. Portal vein tumor thrombosis type, albumin level, and distribution of tumors within the liver were selected for predictive model building. Among the models, the RF model showed the best performance, with area under the curve (AUC), accuracy, sensitivity, and specificity of 0.802, 0.784, 0.904, and 0.480, respectively.
Conclusion: Machine learning models can provide an accurate prediction of the early response of initial TACE treatment for HCC, which can help in individualizing clinical decision-making and modification of further treatment strategies for patients with unresectable HCC.
Keywords: hepatocellular carcinoma, transarterial chemoembolization, machine learning, prediction model, treatment response
Introduction
Hepatocellular carcinoma (HCC) is the third-leading cause of cancer death, with an incidence of more than 900,000 new cases worldwide in 2020.1 Despite improving surveillance, approximately 70–80% of HCCs are first diagnosed at an intermediate or advanced stage according to the Barcelona Clinic Liver Cancer (BCLC) staging system.2 For patients with stage B BCLC HCC, transarterial chemoembolization (TACE) is the only recommended treatment option.3 However, the response to the initial TACE treatment varies greatly from patient to patient, with a variable median overall survival (OS) of 13–43 months.4,5 For HCC patients who do not respond to initial TACE, timely adjustment of treatment, for example, conversion to treatment with sorafenib or lenvatinib, is essential to prevent further progression of the disease and prolong OS.6 Therefore, a reliable preprocedural prognostic model that predicts therapeutic response after the first TACE procedure would be beneficial in personalized clinical decision-making and modification of future treatment strategies.7
Recently, several radiomic models have been developed to estimate the response of TACE treatments that have shown promising results.8–10 Chen et al built a clinical radiomics model that showed good performance in predicting the response of treatment to the first TACE in patients with intermediate-stage HCC, with the area under the receiver operator characteristic curve (AUC) reaching up to 0.94.8 Kong et al developed an MRI-based radiomics model to predict tumor response after TACE in intermediate-advanced patients with HCC.9 However, radiomics requires feature extraction from the region of interest (ROI), and the fact that HCC lesions are usually found in cirrhotic livers with heterogeneous parenchyma could have affected the algorithm’s automated discrimination between the tumor and background liver, which requires a time-consuming and labor-intensive process of reviewing images and manually defining layer by layer. In addition, it is difficult to reach a reasonable medical explanation for some features of radiomics, which hinders its application in the clinical setting.11
Machine learning based on clinical and imaging features has also shown great potential in various aspects of medical investigations and the construction of prognostic models, and the features screened for model construction are clinically explicable. Kawakami et al constructed several machine learning models based on serological indicators, among which the random forest (RF) model showed the best performance in distinguishing epithelial ovarian cancer from benign ovarian tumors, with an AUC of 0.968.12 Wang et al explored factors influencing the postoperative outcomes of patients with HCC through a machine-learning approach with different algorithms, and found that the RF model had the best efficiency in predicting postoperative mortality, with an AUC of 0.803.13
To our knowledge, there are few studies focusing on model construction to predict TACE treatment responses using different machine learning algorithms based on clinical and radiological characteristics of patients with unresectable HCCs. Therefore, this study aimed to explore and verify the feasibility of machine learning models based on clinical and contrast-enhanced computed tomography (CT) image features to predict response after initial TACE, and compare the prediction efficiency of various machine learning models to determine a model with the best prediction performance.
Patients and Methods
Patients
This retrospective study was conducted in accordance with the Declaration of Helsinki and was approved by the Institutional Review Board and the Human Ethics Committee of our hospital, and informed consent was obtained from each participant.
Between January 2013 and September 2018, a total of 181 consecutive unresectable HCC patients receiving the first conventional TACE in our hospital were retrospectively enrolled. All patients were diagnosed by imaging or histological evaluation according to the guidelines of the American Association for the Study of Liver Diseases (AASLD). Other inclusion criteria were CT examination performed within 2 weeks before the TACE procedure and followed up until death or at the end of this study (1 June 2021). Seventy-one patients were excluded based on the following criteria: (1) comorbidity with other malignancies (n = 6); (2) spontaneous tumor rupture (n = 4); (3) combination of other treatments prior to initial TACE, such as tumor resection, radiation therapy, or systemic chemotherapy (n = 53); (4) poor image quality and lack of data (n = 8). Finally, 110 patients were selected in the present study (Figure 1).
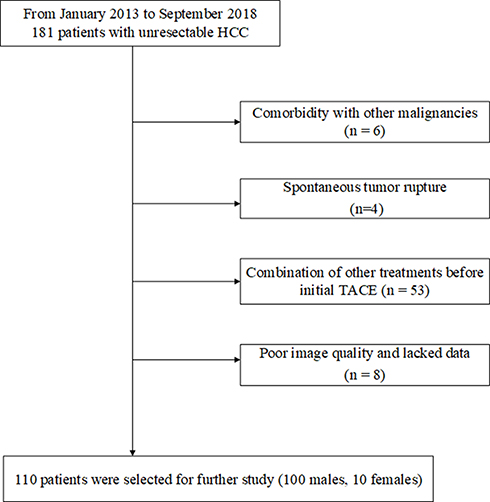 |
Figure 1 Data filtering process. |
Computed Tomography
Each patient in this study underwent CT examination using a 64-multidetector spiral CT scanner (Aquilion 64, Canon Medical, Otawara, Japan), according to the liver protocol, which included unenhanced, arterial, and portal venous phases. The arterial and portal venous phase images were obtained with delays of 18 and 50 seconds after contrast media injection, respectively. The contrast agent (Iopromide, Ultravist 370, Bayer Schering Pharma) was administered at a dose of 1.5 mL/kg of body weight at a flow rate of 3–4 mL/s.
Clinical Data
The following clinical data were collected as potential features: age; sex; etiology (hepatitis B virus, hepatitis C virus or combined infection); comorbidity (combination with hypertension, diabetes or chronic heart disease); alpha-fetoprotein level (AFP, ng/mL); alanine aminotransferase (ALT, U/L); aspartate aminotransferase (AST, U/L); total bilirubin (TB, μmol/L); albumin (ALB, g/L); prothrombin time (PT, s); and international normalized ratio (INR).
Imaging Analysis
The CT images of each patient were evaluated by two trained radiologists with more than 5 and 9 years of experience in abdominal imaging diagnosis who were blind to clinical and/or pathological results. For quantitative imaging features, the average value of the measured data of two radiologists was calculated and recorded, while qualitative features were recorded based on the consistent evaluation of two radiologists.
Quantitative Imaging Features
The number of tumor lesions was defined as 1, 2, 3, or more than 3 lesions. Tumor diameter was defined as the longest diameter of the largest tumor (if multiple tumors). The CT values of the tumor parenchyma were measured on plain scan, arterial phase, and portal venous phase (CTN, CTA, CTV), and the increasing value (ΔA) and the increasing ratio of arterial phase (ΔA%) were calculated according to the following equations:

Qualitative Imaging Features
Qualitative imaging features included: infiltrating growth pattern, defined as a tumor having no clear visible margin; tumor distribution within the liver, classified as within a single segment, within a lobe or multilobular distribution; tumor vessels, abnormal vessels within the tumor seen in the arterial phase; peritumoral enhancement, dominant hyperenhancement around the tumor seen in the arterial phase; arterial hyperenhancement, referred to as the typical enhance pattern of HCC of “wash in wash out” enhancement; tumor capsule, delayed ring enhancement seen in the portal venous phase; necrosis within the tumor; portal vein tumor thrombosis (PVTT) and classification; liver vein thrombosis; biliary invasion; cirrhosis; ascites; and splenomegaly. Among these features, infiltrating growth pattern, tumor vessels, peritumoral enhancement, arterial hyperenhancement, tumor capsule, necrosis within the tumor, hepatic vein thrombosis, biliary invasion, cirrhosis, ascites, and splenomegaly were binary (yes/no) variables, while tumor distribution within the liver and PVTT were categorical variables.
PVTT evaluation was determined by contrast-enhanced CT in accordance with Cheng’s classification,14–16 which defined PVTT as four types based on the extent of tumor thrombus in the portal vein: type I, tumor thrombus involving segmental or sectoral branches of the portal vein or above; type II, tumor thrombus involving the right/left portal vein; type III, tumor thrombus involving the main portal vein; and type IV, tumor thrombus involving the superior mesenteric vein. No visible tumor thrombus found on CT images was defined as type 0.16
Treatment Procedures
All patients received an initial TACE treatment in our hospital. Therapeutic procedures were performed according to the current practice guidelines by two interventional radiologists who had 10 and 5 years of experience. For TACE treatment, a mixture of 5 mL of ethiodized oil injection contrast medium (lipiodol, Guerbet) and 30–50 mg of doxorubicin was used. The emulsion ratio (aqueous to lipid) was 1:2. The tumor feeding branch was embolized using absorbable gelatin sponge particles to achieve complete blockage of the tumor feeding artery. Successful embolization was confirmed when no contrast staining in the tumor was detected on post-embolization angiography.
Evaluation of the TACE Response and Follow-Up
Treatment responses were evaluated after the first TACE procedure based on the modified Response Evaluation Criteria in Solid Tumors (mRECIST)17 by postoperative CT examination within 2 months after the procedure. Briefly, the corresponding responses included complete response (CR), partial response (PR), stable disease (SD), and progressive disease (PD). In the present study, the patients were divided into two groups: the TACE response group (TR) (CR and PR patients) and the TACE non-response group (TN) (PD and SD patients). Treatment response was independently evaluated by 2 radiologists with 5 and 9 years of clinical experience, and conflicting results were re-examined and determined by a third radiologist with over 20 years of experience.
All patients enrolled in this study were followed up after the initial cTACE until death or at the end point of this study (1 June 2021). Clinical data and CT/MR images of each patient were reviewed and evaluated, and a further treatment decision was made based on treatment response, evidence from current guidelines, and patient status. Time-to-tumor progression (TTP) was defined as the time point when local or intrahepatic recurrence or distant metastasis occurred after the first TACE procedure. Overall survival (OS) was defined as the time from the initial TACE treatment until any cause of death.
Statistical Analysis
Statistical analyses were performed using SPSS software (version 25.0, IBM Corp, NY, USA). The independent t-test and Mann–Whitney U-test were applied to compare numeric variables, while the chi-square test and Fisher’s exact test were applied to compare categorical variables. Kaplan Meier analysis was used to compare TTP and OS between TR and TN groups.
In this study, Python (version 3.70) was used to develop machine learning models. The least absolute shrinkage and selection operator (LASSO) was used to select the features that had the greatest effect on predicting treatment response after the first TACE procedure based on clinical characteristics and CT image features.
All patients were randomly divided into the training group and the validation group through stratified cross-validation, and the approximate distribution of the outcome indicators in the two groups was ensured to avoid systematic errors caused by the division of data sets. In this study, 5-fold cross-validation was applied, in which the samples were randomly divided into 5 equal groups. Four samples (accounting for 80.0% of the total samples) were defined as the training group each time to construct the model, while the remaining 1 sample (accounting for 20.0% of the total samples) was used as the validation group to evaluate the model performance.
In this study, six machine learning algorithms were used to build models based on selected features, including XGBoost, decision tree (DT), support vector machine (SVM), random forest (RF), k-nearest neighbor (kNN), and fully convolutional networks (FCN). The Bootstrap self-help method was used to repeat the whole machine learning process 100 times to ensure the stability of the models, and finally 6 comprehensive models constructed by different algorithms were obtained.
The prediction efficiency of each model was evaluated by AUC, accuracy (ACC), sensitivity (SEN), and specificity (SPE). The performance of each model was then compared to determine the best model for the prediction of treatment response after TACE by AUC and ACC.
Results
Clinical Data and CT Imaging Features
This study retrospectively enrolled 110 patients (100 males, 10 females, 53.8±12.7 years) with unresectable HCC. After the first TACE procedure, 31 patients (28.2%) were described as TR (CR and PR) according to the mRECIST evaluation, while 79 patients (71.8%) were in the TN (SD and PD) group. The clinical and imaging characteristics of the patients in the TR and TN groups were summarized and compared. Among all clinical data, ALB, TB, and INR showed a significant difference between the TR and TN groups (P<0.05) (Table 1). Imaging features including tumor diameter, tumor number, distribution, type of portal vein tumor thrombosis (PVTT), venous thrombosis, infiltrative growth pattern, tumor vessels, peritumor enhancement, necrosis showed a significant difference between the TR and TN groups (P < 0.05) (Table 2). Other characteristics were not statistically different between the two groups (P > 0.05). CT images of typical cases in the TR and TN groups are shown in Figure 2.
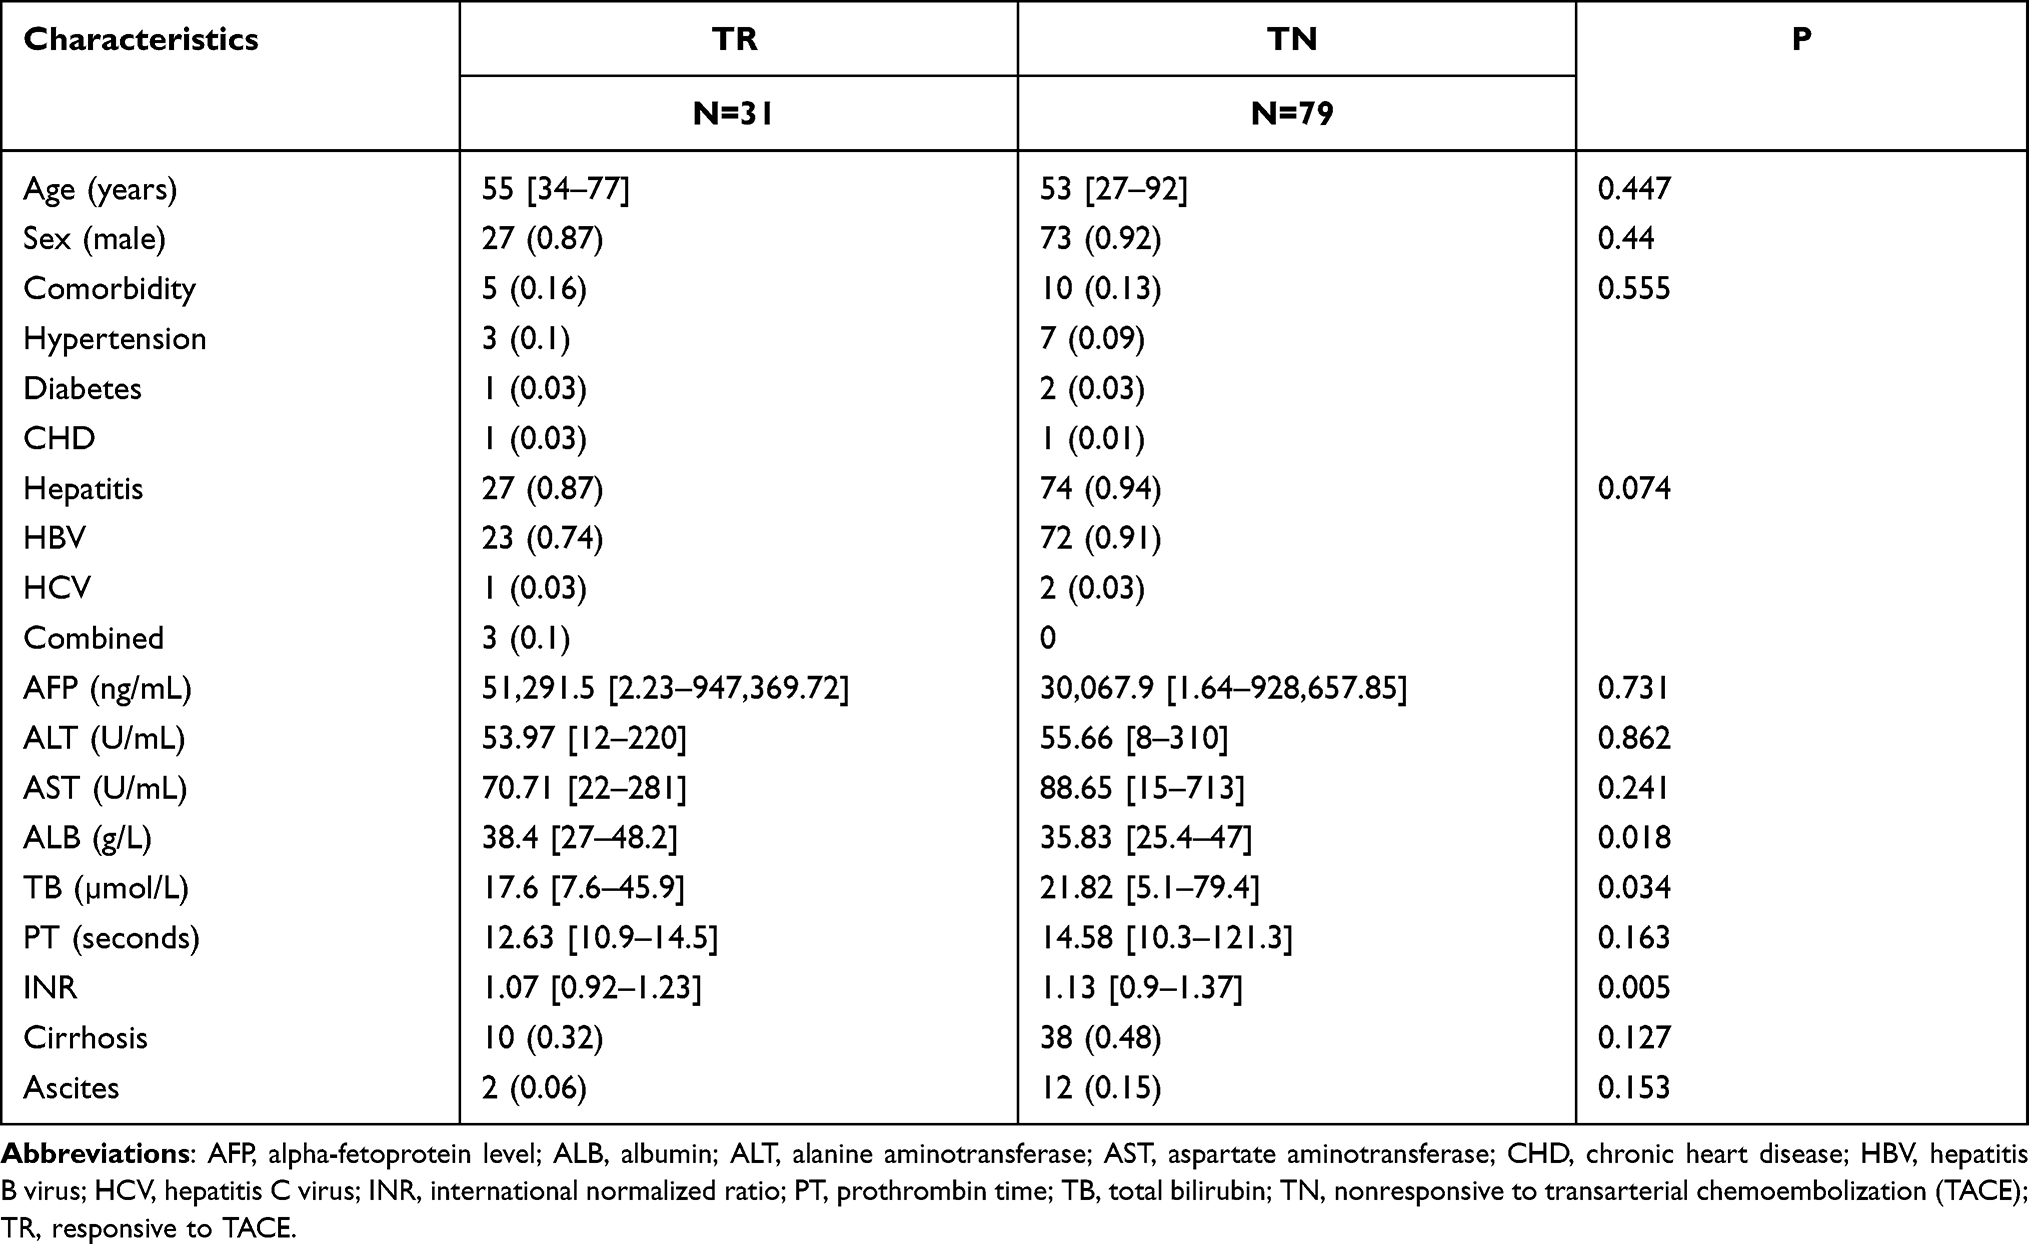 |
Table 1 Comparison of Clinical Data of Patients Between TR and TN Groups |
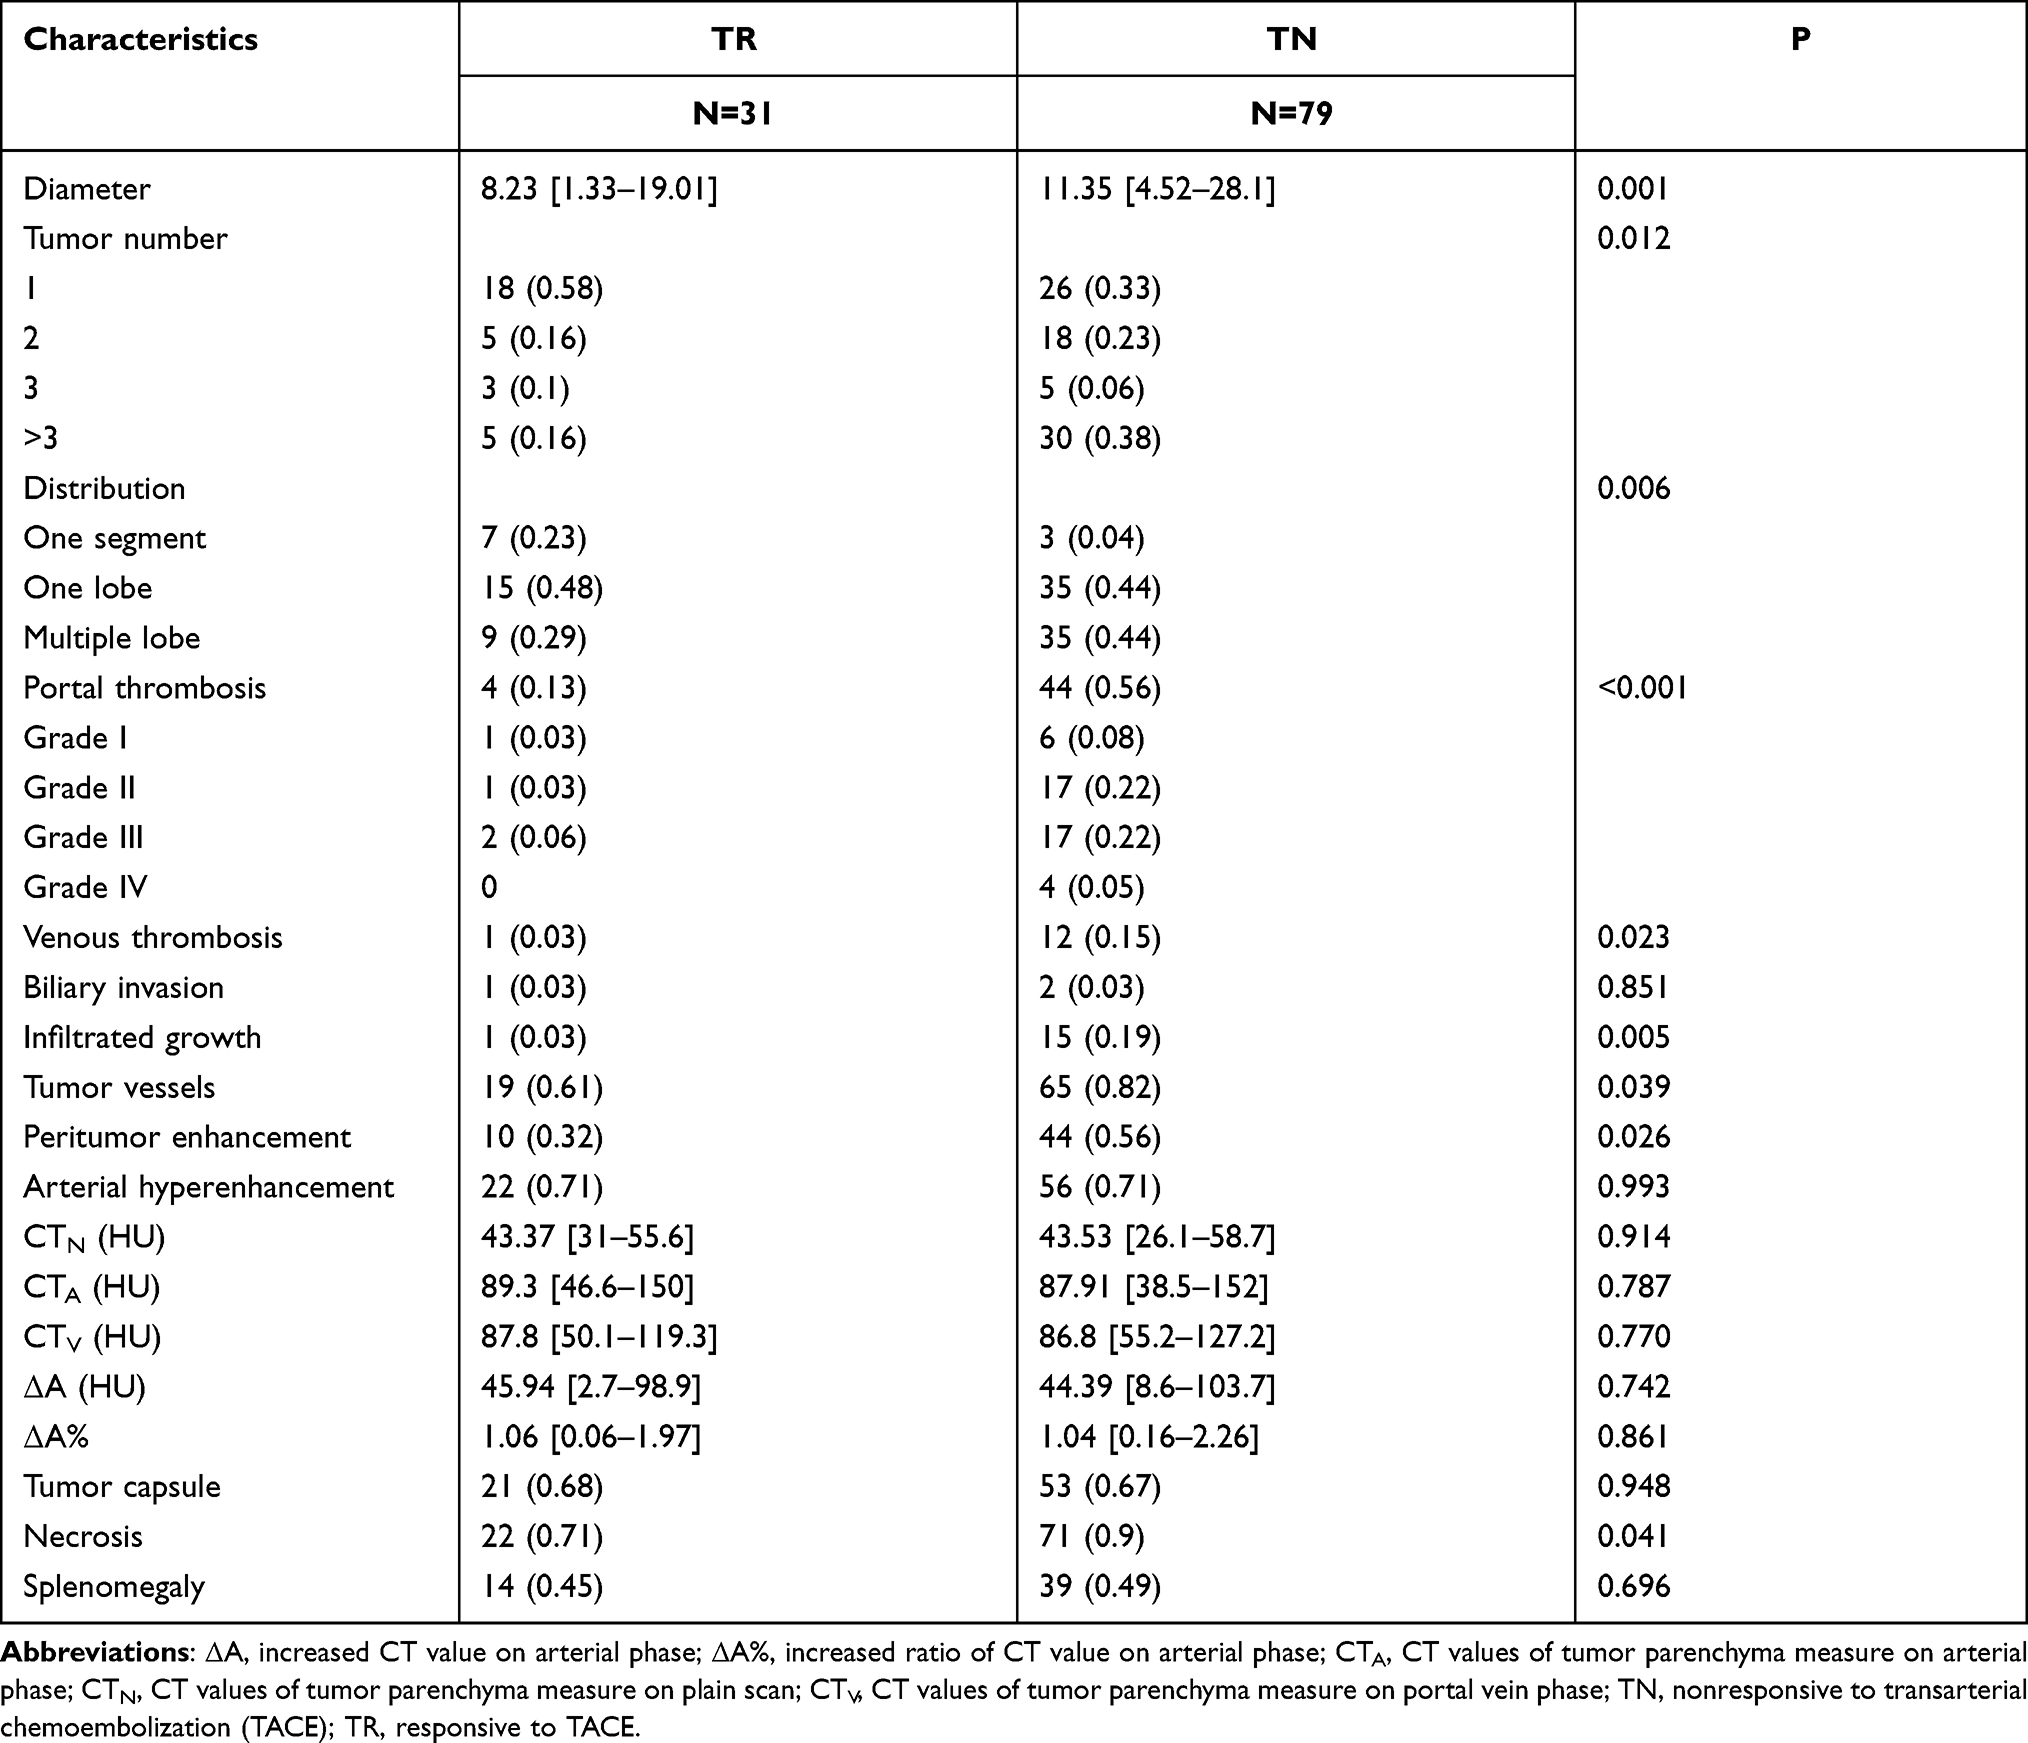 |
Table 2 Comparison of Imaging Features of Patients Between TR and TN Groups |
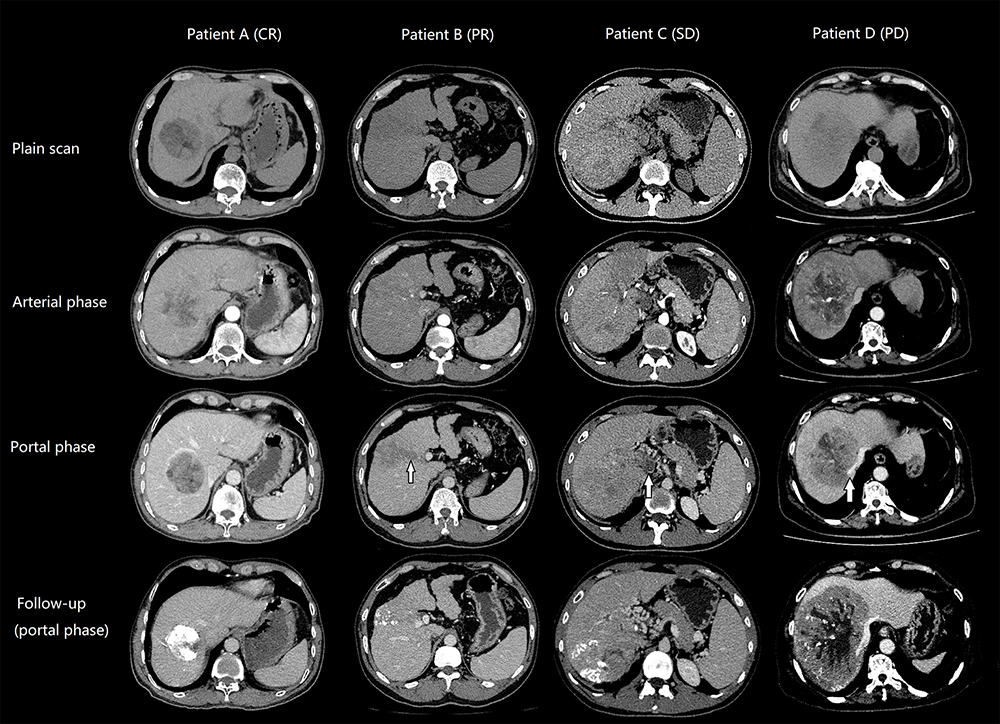 |
Figure 2 Computed tomography (CT) images of typical cases in TR and TN groups. CT images of patient A (CR, TR group) before TACE show a spherical mass located in the right lobe, with slight hyperenhancement on the arterial phase and an intact tumor capsule visible on the portal venous phase. Post-procedure CT image shows diffuse deposit of iodine oil and no enhancement of the lesion. CT images of patient B (PR, TR group) before TACE show an infiltrated lesion with visible tumor vessels on the arterial phase, and type I PVTT (arrow) on portal venous phase. Post-procedure CT image shows dominant shrinkage of the lesion with slight enhancement. CT images of patient C (SD, TN group) before TACE show ill-defined infiltrative lesion with type IV PVTT involving the main portal vein (arrow) and the superior mesenteric vein (not shown) on the portal venous phase. Post-procedure CT image shows no obvious shrinkage or progression of the lesion with some blood supply. CT images of patient D (PD, TN group) before TACE show a large mass involving multiple segments of liver, with abundant tumor vessels visible on the arterial phase, hepatic vein invasion (arrow) and type III PVTT involving the main portal vein (not shown). Dominant enlargement of the lesion can be seen in the post-procedure CT image. Abbreviations: TACE, transarterial chemoembolization; TR, responsive to TACE; TN, nonresponsive to TACE; CR, complete response; PR, partial response; SD, stable disease; PD, progressive disease; PVTT, portal vein tumor thrombosis. |
All patients enrolled in this study were followed up until death or at the end point of this study (1 June 2021), with no one lost to follow-up. All patients experienced recurrence or distant metastasis. The median TTP was 507 days (range: 70-1919 days) in the TR group and 96 days (range: 17–362 days) in the TN group, with a statistical difference (P < 0.001) between the two groups. Only three patients were alive at the end point of this study, which were censored in the OS analysis. OS between the TR (median: 1034 days, range: 407–2094 days) and TN (median: 144 days, range: 17–364 days) groups also showed a significant difference (P<0.001) (Figure 3).
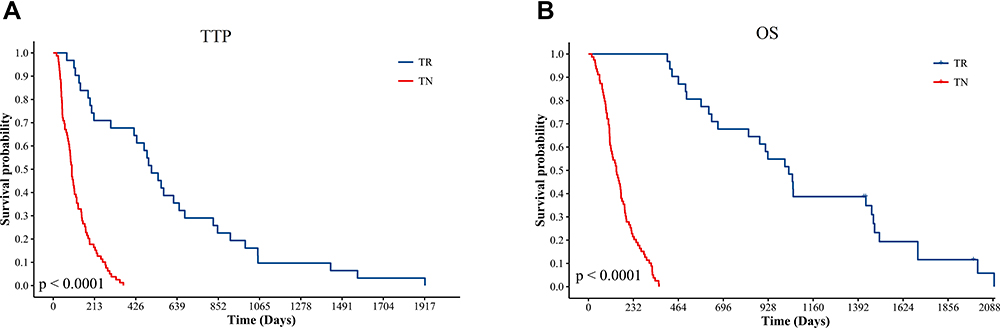 |
Figure 3 Kaplan Meier plots comparing TTP and OS between TR and TN groups. Both TTP (A) and OS (B) show significant differences between TR and TN groups (P < 0.001). Abbreviations: TTP, time to progression; OS, overall survival; TR, responsive to TACE; TN, nonresponsive to TACE. |
Feature Selection
The clinical and CT imaging features were screened by LASSO to determine the most significant features to predict treatment response after the first TACE procedure (Figure 4). The classifier adds features based on relative importance until the AUC no longer improves. Finally, PVTT type, ALB and tumor distribution were selected for predictive model building.
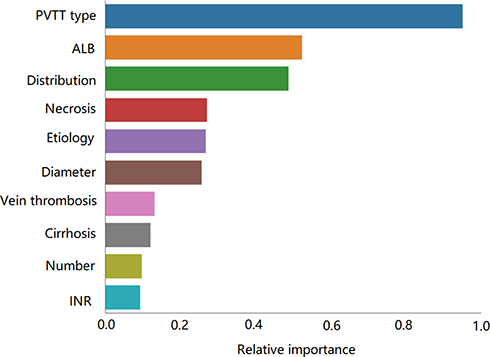 |
Figure 4 Relative importance rank of features screened using the least absolute shrinkage and selection operator (LASSO). |
Predictive Model Building and Evaluation
Machine learning models were built based on the selected features by six algorithms of XGBoost, Decision tree, SVM, RF, kNN, and FCN. The prediction efficiency of each model is shown in Table 3. Among the models, the RF model showed the best performance with AUC, ACC, SEN, and SPE of 0.802, 0.784, 0.904, and 0.480, respectively. Then, the AUC and ACC of the RF model and those of other machine learning models were compared using the Mann–Whitney U-test, respectively, and showed a significant difference (P < 0.05) (Table 4). Figure 5 shows the ROC curves of six models for one round five-fold cross-validation.
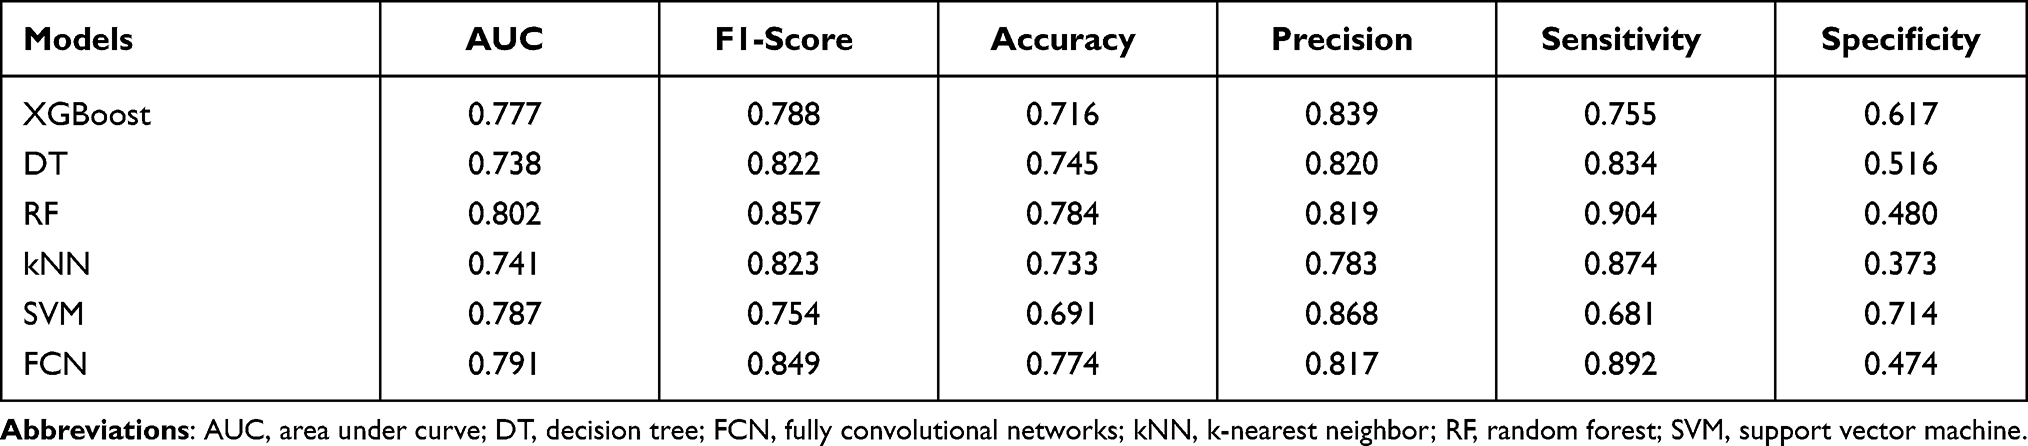 |
Table 3 Prediction Efficiency of Each Machine Learning Models |
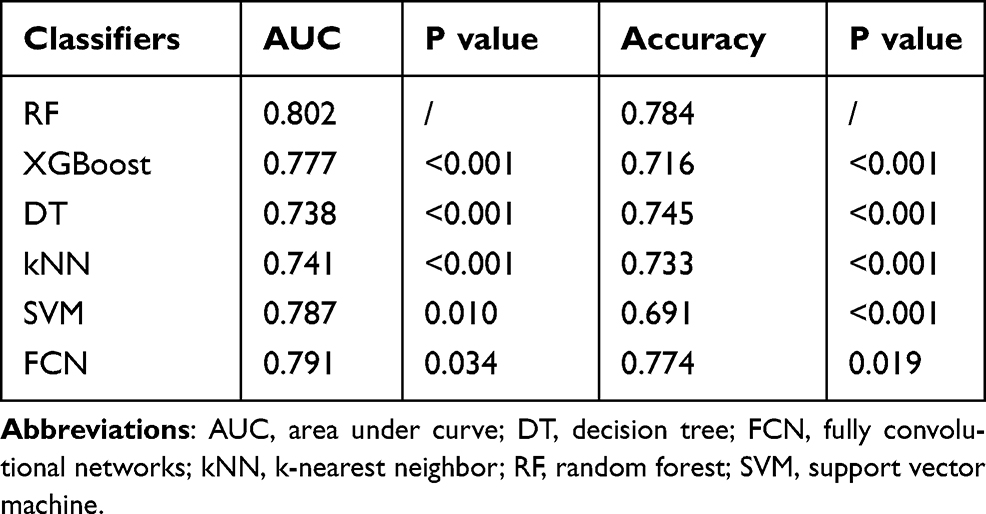 |
Table 4 Comparison of AUC and ACC Between RF and Other Machine Learning Models |
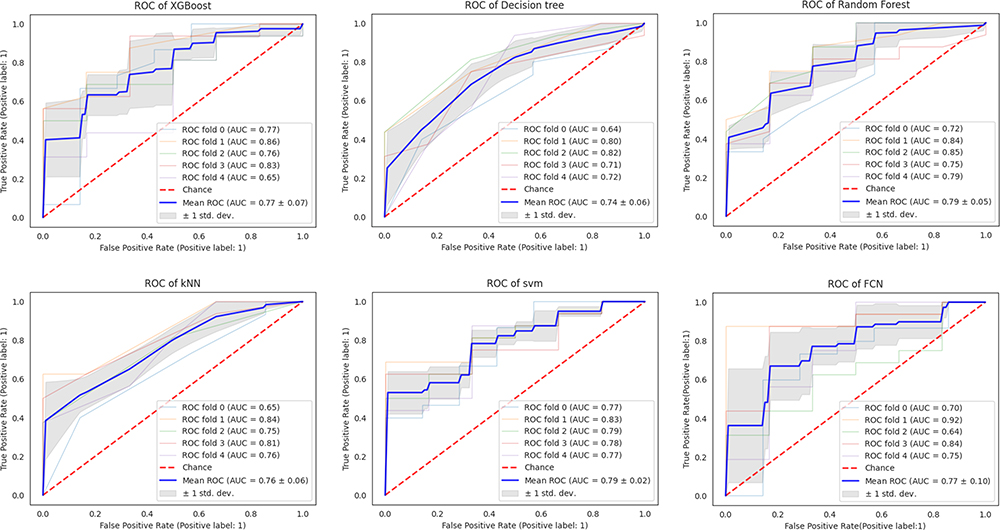 |
Figure 5 The ROC curves of six prediction models for one round cross-validation. |
Discussion
In this study, we selected the most significant clinical and CT image features of HCC patients through LASSO for building six machine learning models. We found that RF was the best performing model to predict the outcome of the initial TACE treatment.
LASSO and cross-validation are common methods for radiomics feature screening and model building.10,11,18 LASSO is widely used to select the variables that have the greatest effect on outcome indicators. In this study, PVTT type, ALB, and tumor distribution were screened out by LASSO, which had the greatest effect on the outcome of the first TACE procedure.
Random forest (RF) is an ensemble learning method used to build predictive models composed of multiple decision trees to achieve better predictive results.19 While the classification of a single decision tree is prone to overfitting and bias-variance, an RF model creates an entire forest of random decision trees using bootstrap aggregation to overcome overfitting and bias-variance problems, and to arrive at the best possible answer.20 The output result of RF depends on the prediction results of all decision trees and therefore significantly reduces the classification error and improves the accuracy and robustness of the model. Even if some of the sample data varies, only a few decision trees will be affected, which will have less impact on the final prediction model.20 Therefore, RF models are considered to have high accuracy with stability and strong generalizability. Among the models constructed in this study, the RF model also showed the best predictive performance.
In this study, PVTT type, ALB and tumor distribution were selected for model building, as these three features had the greatest effect on predicting initial TACE response.
According to our findings, the PVTT type had the most important effect on predicting response to the first TACE procedure. PVTT is one of the most representative imaging features of advanced HCC patients. Patients with PVTT usually experienced early recurrence after radical resection and poor overall outcomes.21 The role of TACE in HCC patients with PVTT remains controversial or unconfirmed. Generally, TACE is not recommended in patients with PVTT due to concerns that blockage of the arterial blood supply of the tumor might lead to massive hepatic necrosis under the circumstance of already compromised hepatic blood supply.22 However, some studies have shown that TACE could significantly prolong the survival time of patients combined with PVTT.23
Our results showed that patients with type III or IV PVTT were prone to not responding to initial TACE treatment. This may be due to the fact that these patients already had an altered hepatic blood supply, where the tumor was in a hypoxic situation and was more resistant to blockage of the arterial blood supply. Furthermore, in patients with type III or IV PVTT, intervention of arterial blood supply should be more cautious to avoid massive hepatic necrosis. Cappelli et al7 proposed a prognostic model that provides an accurate prediction for patients with unresectable HCC after TACE treatment. In their study, PVTT patients were not included to avoid bias caused by their prognostic weight in determining the prognosis in patients without PVTT.7 However, in actual clinical practice, PVTT is frequently observed in patients with unresectable HCC, and TACE is usually performed after careful evaluation and trade-off. Therefore, the patients with HCC included in this study reflected the real-life phenomenon in the clinical setting, and the constructed model can provide individualized responses for patients with and without PVTT.
ALB was selected as the second most significant feature for the building of predictive models in this study. From the results of this study, patients with low ALB tended to show no response to the initial TACE. Serum albumin is synthesized in the liver and functions as a carrier protein for steroids, fatty acids, and thyroid hormones in the blood, reflecting liver function. This study showed that low ALB was correlated with a negative response to treatment and a worse outcome in HCC patients, which is consistent with previous studies.8,24 In some studies, the BCLC staging system and Child-Pugh classification were applied to assess liver function of HCC patients, which combined multiple clinical data and provided a comprehensive assessment of liver function and patient status. However, the majority of patients suitable for TACE procedure are BCLC B stage or Child-Pugh B patients.24,25 To minimize bias caused by the high prognostic weight of the BCLC staging system or the Child-Pugh classification, and to search for characteristics that have the greatest effect on the prediction of treatment response, we assessed these clinical data separately. In addition to ALB, other clinical data including TB, ALT, AST, PT, INR, cirrhosis, and ascites were usually applied for the evaluation of liver function in HCC patients. In this study, TB (P=0.034) and INR (P=0.005) have showed significant difference between TR and TN groups, while ALT, AST, PT, cirrhosis, and ascites have no statistical difference between the two groups (P>0.05). However, LASSO did not select these data for model building in the current study, indicating that these features have less influence on the initial TACE response compared to ALB. Although these clinical characteristics were not chosen for model building in this study, they still showed an effect on the prognostic prediction.
This study showed that tumors located in multiple segments or multiple lobes of the liver tended to show no response to the first TACE treatment. In Zhong’s study, tumors with bilobar location, tumor diameter (>7 cm), and tumor number (>1) were independent risk factors associated with 1-year disease control for patients with HCC treated with TACE combined with sorafenib as initial treatment.19 Tumor location may affect the specific treatment procedure of TACE in different patients to achieve an optimal treatment response, which subsequently affects its prediction weight in the TACE response.
Tumor diameter and tumor number were considered to be key prognostic indicators in patients with HCC. The size and number of the tumor directly affect the blocking effect of the tumor feeding artery and the dosage of the chemotherapy drug, thus influencing the treatment response to the TACE procedure. In our study, tumor distribution, diameter, and tumor number also had a significant difference between the TR and TN groups. However, the tumor distribution was of higher relative importance than the other two characteristics (Figure 4) and was chosen to build predictor models.
According to our results, tumor vessels, enhancement of the peritumor, venous thrombosis, infiltrative growth pattern, and tumor necrosis showed a significant difference between the TR and TN groups (P < 0.05). The visible tumor vessel on imaging usually indicates a rich arterial blood supply of the tumor. In such a situation, it is more difficult to reach a complete blockage of the tumor feeding vessels. Peritumor enhancement has been reported to be an independent predicator of microvascular invasion of HCC and was associated with early recurrence after curative resection.26,27 HCC with venous thrombosis, infiltrative growth pattern, and necrosis within tumor parenchyma usually demonstrate rapid growth and a much more aggressive biological behavior along with early spread of tumor.2 Patients with these CT image features tend not to respond to the therapeutic TACE procedure and probably experience a worse clinical outcome. However, these features were not selected by LASSO for model building in this study. One possible reason is that the influence of PVTT type on the predicting results was so dominant that other features were relatively less important in the prediction. Furthermore, to screen out the most significant features and minimize possible bias in predicting models, we applied an approach in which the classifier added features based on relative importance, until the AUC was no longer improved. Therefore, although these clinical characteristics were not chosen for model building in the current study, they still had an influence on the response to initial TACE treatment.
Previous studies have shown that AFP level and arterial hyperenhancement were significant predictors of objective response to the first TACE treatment.8,18 However, in this study, these characteristics neither showed significant differences between the TR group and the TN group, nor were they selected for the building of prognostic models. This may be explained by the inherent heterogeneous characteristics of HCCs. For example, the level of AFP can vary in different patients even if the tumors share similar pathological characteristics or biological behavior. Patients with advanced HCC can also demonstrate a normal level of AFP.13 The increased CT value (ΔA) and increased ratio of CT value to arterial phase (ΔA%) showed no significant difference between TR and TN groups (P > 0.05). The possible reason was that the heterogeneous parenchyma and enhanced patterns within one tumor lesion and the background of hepatic fibrosis or cirrhosis may have a negative effect on the CT findings.28 However, these factors could still indirectly contribute to the response to initial TACE treatment and should not be ignored. The prognostic weight of these characteristics will be further explored in our future study with a larger population.
According to our results, the TTP and OS of the TR group were significantly longer than those of the TN group (P < 0.001). Although treatment after the initial TACE can contribute to the outcome of patients, the primary response to the first TACE procedure still has a great impact on disease progression and clinical decision-making. This may reflect the further clinical significance of predicting the response of treatment to the initial TACE.
Our study had several limitations. First, it was a single-center, retrospective study without external validation, which leads to inevitable selection bias, and thus may be subject to nongeneralizability. Second, the small number of patients in the TR group may have influenced the accurate prediction of the results. Furthermore, the long duration of the inclusion period and the relatively small study population may have influenced the robustness of the predictive model.
Conclusion
In this study, PVTT type, ALB, and tumor distribution were selected by machine learning to construct different prognostic models to predict the response to the initial cTACE treatment, and the RF model had the best prediction efficiency. The model established in this study can provide an accurate prediction of the early response to initial cTACE treatment in HCC patients, and may help in individualized clinical decision-making and modification of further treatment strategies.
Abbreviations
ΔA, increased CT value on arterial phase; ΔA%, increased ratio of CT value on arterial phase; ACC, accuracy; AFP, alpha-fetoprotein level; ALB, albumin; ALT, alanine aminotransferase; AST, aspartate aminotransferase; AUC, area under the curve; CHD, chronic heart disease; CR, complete response; CTN, CT values of tumor parenchyma measure on plain scan; CTA, CT values of tumor parenchyma measure on arterial phase; CTV, CT values of tumor parenchyma measure on portal venous phase; FCN, fully convolutional networks; HBV, hepatitis B virus; HCV, hepatitis C virus; INR, international normalized ratio; kNN, k-nearest neighbor; LASSO, least absolute shrinkage and selection operator; OS, overall survival; PD, progressive disease; PR, partial response; PT, prothrombin time; PVTT, portal vein tumor thrombosis; RF, random forest; ROI, region of interest; ROC, receiver operating characteristic; SD, stable disease; SVM, support vector machine; TACE, transarterial chemoembolization; TB, total bilirubin; TN, nonresponsive to TACE; TR, responsive to TACE; TTP, time of tumor to progression.
Data Sharing Statement
All the data concerning this study are available from the corresponding author.
Ethics Approval and Informed Consent
This retrospective study was conducted in accordance with principles of the Declaration of Helsinki. The study protocol was approved by the Institutional Review Board of the First Affiliated Hospital, Sun Yat-Sen University, and informed consent was achieved from each participant.
Ackwnowlegement
We would like to show our gratitude to Wenguang Yuan, an engineer at Huawei Cloud BU EI Innovation Laboratory, for his great contribution to the algorithm optimization and statistical analyses in this study.
Author Contributions
All authors made substantial contributions to conception and design, acquisition of data, and analysis; took part in drafting the manuscript or revising it; agreed to submit to the current journal; gave final approval for the version to be published; and agreed to be accountable for all aspects of the work.
Funding
This study received funding from the National Natural Science Foundation of China (81971684, 81771908, 82001882) and the Natural Science Foundation of Guangdong Province (2021A1515011442).
Disclosure
The authors declare that they have no competing interests.
References
1. Sung H, Ferlay J, Siegel RL, et al. Global cancer statistics 2020: GLOBOCAN estimates of incidence and mortality worldwide for 36 cancers in 185 countries. CA Cancer J Clin. 2021;71(3):209–249. doi:10.3322/caac.21660
2. Villanueva A. Hepatocellular Carcinoma. N Engl J Med. 2019;380(15):1450–1462. doi:10.1056/NEJMra1713263
3. Bruix J, Reig M, Sherman M. Evidence-based diagnosis staging, and treatment of patients with Hepatocellular carcinoma. Gastroenterology. 2016;150(4):835–853. doi:10.1053/j.gastro.2015.12.041
4. Sangro B, Salem R. Transarterial chemoembolization and radioembolization. Semin Liver Dis. 2014;34(4):435–443. doi:10.1055/s-0034-1394142
5. Wang JH, Zhong XP, Zhang YF, et al. Cezanne predicts progression and adjuvant TACE response in hepatocellular carcinoma. Cell Death Dis. 2017;8:8.
6. Arizumi T, Ueshima K, Minami T, et al. Effectiveness of sorafenib in patients with Transcatheter Arterial Chemoembolization (TACE) refractory and intermediate-stage Hepatocellular Carcinoma. Liver Cancer. 2015;4(4):253–262. doi:10.1159/000367743
7. Cappelli A, Cucchetti A, Cabibbo G, et al. Refining prognosis after trans-arterial chemo-embolization for hepatocellular carcinoma. Liver Int. 2016;36(5):729–736. doi:10.1111/liv.13029
8. Chen MY, Cao JS, Hu JH, et al. Clinical-radiomic analysis for pretreatment prediction of objective response to first transarterial chemoembolization in hepatocellular carcinoma. Liver Cancer. 2021;10(1):38–51. doi:10.1159/000512028
9. Kong C, Zhao Z, Chen W, et al. Prediction of tumor response via a pretreatment MRI radiomics-based nomogram in HCC treated with TACE. Eur Radiol. 2021;16:1–2.
10. Zhao Y, Wang N, Wu JJ, et al. Radiomics analysis based on contrast-enhanced MRI for prediction of therapeutic response to transarterial chemoembolization in Hepatocellular Carcinoma. Front Oncol. 2021;11:12.
11. Zhang L, Xia W, Yan ZP, et al. Deep learning predicts overall survival of patients with unresectable hepatocellular carcinoma treated by transarterial chemoembolization plus sorafenib. Front Oncol. 2020;10:11.
12. Kawakami E, Tabata J, Yanaihara N, et al. Application of artificial intelligence for preoperative diagnostic and prognostic prediction in epithelial ovarian cancer based on blood biomarkers. Clin Cancer Res. 2019;25(10):3006–3015. doi:10.1158/1078-0432.CCR-18-3378
13. Wang Y, Ji CP, Wang Y, et al. Predicting postoperative liver cancer death outcomes with machine learning. Curr Med Res Opin. 2021;37(4):629–634. doi:10.1080/03007995.2021.1885361
14. Shi J, Lai ECH, Li N, et al. A new classification for hepatocellular carcinoma with portal vein tumor thrombus. J Hepato-Biliary-Pancreat Sci. 2011;18(1):74–80. doi:10.1007/s00534-010-0314-0
15. Cheng SQ, Wu MC, Chen H, et al. Tumor thrombus types influence the prognosis of hepatocellular carcinoma with the tumor thrombi in the portal vein. Hepato-Gastroenterol. 2007;54(74):499–502.
16. Cheng SQ, Chen MS, Cai JQ, et al. Chinese expert consensus on multidisciplinary diagnosis and treatment of hepatocellular carcinoma with portal vein tumor thrombus (2018 Edition). Liver Cancer. 2020;9(1):28–40. doi:10.1159/000503685
17. Lencioni R, Montal R, Torre F, et al. Objective response by mRECIST as a predictor and potential surrogate end-point of overall survival in advanced HCC. J Hepatol. 2017;66(6):1166–1172. doi:10.1016/j.jhep.2017.01.012
18. Meng XP, Wang YC, Ju SH, et al. Radiomics analysis on multiphase contrast-enhanced CT: a survival prediction tool in patients with hepatocellular carcinoma undergoing transarterial chemoembolization. Front Oncol. 2020;10:12. doi:10.3389/fonc.2020.01196
19. Zhong BY, Yan ZP, Sun JH, et al. Random survival forests to predict disease control for Hepatocellular carcinoma treated with transarterial chemoembolization combined with sorafenib. Front Mol Biosci. 2021;20:8.
20. Seo H, Khuzani MB, Vasudevan V, et al. Machine learning techniques for biomedical image segmentation: an overview of technical aspects and introduction to state-of-art applications. Med Phys. 2020;47(5):E148–E167. doi:10.1002/mp.13649
21. Lv WF, Liu KC, Lu D, et al. Transarterial chemoembolization for hepatocellular carcinoma combined with portal vein tumor thrombosis. Cancer Manag Res. 2018;10:4719–4726. doi:10.2147/CMAR.S166527
22. Yu SJ, Kim YJ. Effective treatment strategies other than sorafenib for the patients with advanced hepatocellular carcinoma invading portal vein. World J Hepatol. 2015;7(11):1553–1561. doi:10.4254/wjh.v7.i11.1553
23. Niu ZJ, Ma YL, Kang P, et al. Transarterial chemoembolization compared with conservative treatment for advanced hepatocellular carcinoma with portal vein tumor thrombus: using a new classification. Med Oncol. 2012;29(4):2992–2997. doi:10.1007/s12032-011-0145-0
24. Sun YJ, Bai HL, Xia W, et al. Predicting the outcome of transcatheter arterial embolization therapy for unresectable Hepatocellular carcinoma based on radiomics of preoperative multiparameter MRI. J Magn Reson Imaging. 2020;52(4):1083–1090. doi:10.1002/jmri.27143
25. Morshid A, Elsayes KM, Khalaf AM, et al. A machine learning model to predict hepatocellular carcinoma response to transcatheter arterial chemoembolization. Radiol Artif Intell. 2019;1:5. doi:10.1148/ryai.2019180021
26. Lee S, Kim SH, Lee JE, et al. Preoperative gadoxetic acid-enhanced MRI for predicting microvascular invasion in patients with single hepatocellular carcinoma. J Hepatol. 2017;67(3):526–534. doi:10.1016/j.jhep.2017.04.024
27. An C, Kim DW, Park YN, et al. Single Hepatocellular Carcinoma: preoperative MR imaging to predict early recurrence after curative resection. Radiology. 2015;276(2):433–443. doi:10.1148/radiol.15142394
28. Choi WS, Chang W, Lee M, et al. Spectral CT-based iodized oil quantification to predict tumor response following chemoembolization of Hepatocellular carcinoma. J Vasc Interv Radiol. 2021;32(1):16–22. doi:10.1016/j.jvir.2020.09.020
 © 2021 The Author(s). This work is published and licensed by Dove Medical Press Limited. The full terms of this license are available at https://www.dovepress.com/terms.php and incorporate the Creative Commons Attribution - Non Commercial (unported, v3.0) License.
By accessing the work you hereby accept the Terms. Non-commercial uses of the work are permitted without any further permission from Dove Medical Press Limited, provided the work is properly attributed. For permission for commercial use of this work, please see paragraphs 4.2 and 5 of our Terms.
© 2021 The Author(s). This work is published and licensed by Dove Medical Press Limited. The full terms of this license are available at https://www.dovepress.com/terms.php and incorporate the Creative Commons Attribution - Non Commercial (unported, v3.0) License.
By accessing the work you hereby accept the Terms. Non-commercial uses of the work are permitted without any further permission from Dove Medical Press Limited, provided the work is properly attributed. For permission for commercial use of this work, please see paragraphs 4.2 and 5 of our Terms.