")
Back to Journals » Clinical Epidemiology » Volume 9
Prediction models for the mortality risk in chronic dialysis patients: a systematic review and independent external validation study
Authors Ramspek CL, Voskamp PWM , van Ittersum FJ, Krediet RT, Dekker FW , van Diepen M
Received 15 April 2017
Accepted for publication 17 July 2017
Published 5 September 2017 Volume 2017:9 Pages 451—464
DOI https://doi.org/10.2147/CLEP.S139748
Checked for plagiarism Yes
Review by Single anonymous peer review
Peer reviewer comments 2
Editor who approved publication: Professor Vera Ehrenstein
Chava L Ramspek,1 Pauline WM Voskamp,1 Frans J van Ittersum,2 Raymond T Krediet,3 Friedo W Dekker,1 Merel van Diepen1
On behalf of the NECOSAD study group
1Department of Clinical Epidemiology, Leiden University Medical Center, Leiden, 2Department of Nephrology, VU University Medical Center, 3Department of Nephrology, Academic Medical Center, Amsterdam, The Netherlands
Objective: In medicine, many more prediction models have been developed than are implemented or used in clinical practice. These models cannot be recommended for clinical use before external validity is established. Though various models to predict mortality in dialysis patients have been published, very few have been validated and none are used in routine clinical practice. The aim of the current study was to identify existing models for predicting mortality in dialysis patients through a review and subsequently to externally validate these models in the same large independent patient cohort, in order to assess and compare their predictive capacities.
Methods: A systematic review was performed following the preferred reporting items for systematic reviews and meta-analyses (PRISMA) guidelines. To account for missing data, multiple imputation was performed. The original prediction formulae were extracted from selected studies. The probability of death per model was calculated for each individual within the Netherlands Cooperative Study on the Adequacy of Dialysis (NECOSAD). The predictive performance of the models was assessed based on their discrimination and calibration.
Results: In total, 16 articles were included in the systematic review. External validation was performed in 1,943 dialysis patients from NECOSAD for a total of seven models. The models performed moderately to well in terms of discrimination, with C-statistics ranging from 0.710 (interquartile range 0.708–0.711) to 0.752 (interquartile range 0.750–0.753) for a time frame of 1 year. According to the calibration, most models overestimated the probability of death.
Conclusion: Overall, the performance of the models was poorer in the external validation than in the original population, affirming the importance of external validation. Floege et al’s models showed the highest predictive performance. The present study is a step forward in the use of a prediction model as a useful tool for nephrologists, using evidence-based medicine that combines individual clinical expertise, patients’ choices, and the best available external evidence.
Keywords: external validation, prediction, nephrology, dialysis, mortality
Introduction
End-stage renal disease (ESRD) is a large public health problem. Treatment options for ESRD consist of transplantation, conservative treatment, or dialysis, of which there are two main forms: hemodialysis (HD) and peritoneal dialysis (PD). Dialysis patients are a very vulnerable population, with 3-year cumulative survival of approximately 50%, considerably lower than survival rates for cancer and heart-failure patients.1,2 Many different patient characteristics have been reported to influence this poor survival, and there is wide interindividual variability in prognosis.3–5
Identifying dialysis patients with an increased risk of dying through prediction models could offer valuable information on prognosis to patients, as well as help clinicians recognize these high-risk patients and apply more intensive care and supportive therapies when needed.3,6,7 Furthermore, a risk-stratification model could be used as an important research tool when adjusting for baseline risk in comparative studies, targeting specific interventions to high- or low-risk patients or even provide tools to compare mortality risks among different centers, regions, or countries.3,7,8
Various models to predict mortality in dialysis patients have been published.7–13 However, no review of these articles exists, and only a fraction of these prediction models or risk scores have been externally validated.7 The few studies that have externally validated models to predict mortality in dialysis patients did so for not more than one or two models at a time.7,12,13 Differences in cohorts used to validate various models make it difficult to compare predictive performances fairly; ideally, one would externally validate all available models in the same cohort. External validation entails that a model is tested in other data than that in which the model was derived, in order to test the generalizability of the tool on the targeted patient population.14 Since the performance of a prediction model is generally lower in new individuals than in the population in which the model was developed,15 these models cannot be recommended for clinical use before external validity is established, as is also stressed in the TRIPOD (transparent reporting of a multivariable prediction model for individual prognosis or diagnosis) statement for reporting prediction models.14–20 Though the importance of combining evidence is recognized, many more models have been developed in the medical research field than are used in clinical practice or even tested on different populations.17,21,22 To combat this research waste, the realization of more external validation studies is imperative and increasingly in demand.14,17,20,23–25
A direct comparison of the predictive performance of existing models in the same external-validation cohort could help bridge the gap between the development of models and their clinical application. The aim of the current study was to perform a systematic literature review to identify existing models for predicting the risk of death in dialysis patients and subsequently to externally validate these models in the same large independent patient cohort, in order to assess and compare their predictive capacities.
Methods
Systematic review
The PRISMA (preferred reporting items for systematic reviews and meta-analyses) guidelines were followed for the review process.26 A systematic literature search was performed in PubMed to identify articles that described prediction models for risk of death in dialysis patients. PubMed was searched on October 28, 2016 using the search string presented in the Supplementary materials. Additional relevant articles were identified by checking the references of the selected articles from the PubMed search. Titles and abstracts were screened, and full texts of potentially eligible articles were read carefully.
Studies were included in the systematic review if they met the following criteria: 1) the study contained at least one formal, original prediction model from which individual risk estimates could be calculated; 2) the study population consisted of chronic dialysis patients or patients with ESRD; 3) the end point of the prediction was all-cause mortality for a defined time frame, studied in a longitudinal design; and 4) the goal of the study was to predict mortality to the best of the authors’ ability, and not to research whether a particular comorbidity score or single variable was predictive of mortality.
Titles, abstracts, and full papers were reviewed by two authors independently (CLR and PWMV), and any discrepancies in the full-text review were solved by consulting a third party (MvD). For the articles included, two investigators (CLR and PWMV) independently extracted the main characteristics and necessary data from the main paper and any accompanying supplemental material, as recommended by the PRISMA guidelines.26
Validation cohort
NECOSAD (Netherlands Cooperative Study on the Adequacy of Dialysis) was a multicenter, prospective cohort study, in which 38 dialysis centers throughout the Netherlands participated. Incident dialysis patients were included at the start of dialysis treatment if they were aged ≥18 years and had no history of previous renal replacement therapy. Patient characteristics on dialysis modality, comorbidities, laboratory investigations, and clinical parameters were recorded. High-sensitivity CRP was not assessed in standard fashion, but retrospectively determined in 2002 from frozen blood samples for all patients included till then. Patients were followed till time of death or censored due to kidney transplantation or loss to follow-up. Inclusion of patients took place between 1997 and 2007, and follow-up data on death were available until February 1, 2015. For more information on study design, please refer to one of the hallmark NECOSAD articles published in the Lancet.27 The study protocol was fully approved by the Amsterdam Medical Centre ethics committee, and subsequently all local medical ethics committees gave a declaration of agreement. All patients gave written informed consent. The NECOSAD data set will be made available upon request.
For the current study, baseline measurements were taken 3 months after dialysis initiation, with the exception of predialysis serum creatinine. This was primarily done to ascertain that the dialysis patients included had chronic renal failure and the choice of treatment modality would be more definite. Furthermore, laboratory investigations were collected at this time, since the clinical condition of the patient was more stabilized. Patients who had a follow-up within NECOSAD of less than 90 days were thus excluded from the current study.
Studies selected for validation
Predictors from the studies included in the review were assessed and matched to variables available in NECOSAD. For predictors that were not recorded in NECOSAD, a panel of researchers and nephrologists was consulted on the possible use of proxies. When the panel considered it appropriate, original predictors were replaced with proxies, in order to allow validation of the model. If these studies presented more than one formal prediction model, their final model or the model with the best predictive performance was selected. The original prediction models with regression coefficients per predictor and intercept and/or baseline hazard were extracted from the selected studies and used as published to evaluate predictive performance within our external population. If the full prediction formula was not provided in the article or its supplementary material, the authors were approached multiple times by email or phone with a request to supply this formula.
Statistical analysis
Baseline characteristics of the patients in NECOSAD are presented as mean values with standard deviations (SD) or as median values with interquartile ranges (IQRs) for continuous variables (depending on the normality of the distribution), and as percentages for categorical variables. Baseline characteristics included all the predictors from the validated studies, and were stratified per treatment modality.
To account for missing data on predictors, multiple imputation was performed using the fully conditional specification.28–31 The imputation model contained all predictor variables, outcome variables, and any variables that could help impute the missing data.30 Normally distributed variables were log-transformed. Outcomes from the ten imputed data sets were combined into one overall estimate, with associated variance that incorporated both within- and between-imputation variability. This was done through applying the rules described by Marshall et al, which are an extension of Rubin’s rules aimed specifically at imputation in prognostic modeling studies.30
Probabilities of death predicted by each validated model were calculated for each individual within the validation cohort, using the original model formulae and the time frame used in the original papers. The predictive performance of the models was assessed based on outcomes for discrimination and calibration, and these measures are described later (see Supplementary materials for a full description of the model formulae and predictors/proxies used).
Discrimination is a measure for how well a model is able to distinguish between people who will or will not have the event (death) within the given time frame.32 It can be assessed with the C-statistic, which indicates the probability that the model will assign a higher risk to a random case than to a random non-case.33 The C-statistic lies between 0.5 and 1, where 1 is perfect, 0.7 is considered reasonable, and 0.8 is considered good discrimination. For a logistic regression model, the C-statistic is equivalent to the area under the receiver-operating curve. For Cox proportional-hazard models, Harrell’s C-index of concordance is presented. This outcome measure takes censoring into account.34 The C-statistic was assessed per model for multiple prediction time frames and stratified by dialysis modality. Additionally, we computed Kaplan–Meier survival curves for four risk groups, based on quartiles of prognostic indices. These survival curves can provide informal evidence of discrimination, and allow for a visual interpretation of model performance over time: the further the survival curves lie from one another, the better the discrimination.34
Calibration describes how accurately the predicted risks from a model reflect the mortality risks in the observed data.34 This is best represented visually in a calibration plot, in which observed mean mortality risk is plotted against predicted mean mortality risk by a tenth of the predicted risk.22,33,35 The calibration plot can be characterized by a slope and calibration-in-the-large. The calibration-in-the-large indicates to what extent the model may systematically over- or underestimate the probability of death. For a perfectly calibrated risk score, the calibration plot would lie on the 45° line and have a slope of 1, and the calibration-in-the-large would be identical to the observed risk.24,34,35 In the current study, calibration was assessed per model by presenting a calibration plot, calibration slope, and calibration-in-the-large for multiple prediction time frames (if possible) and stratified by dialysis modality.
To test the additional benefit of recalibration, we updated the models in a sensitivity analysis. For the Cox models, this was done by adjusting the baseline hazard of death to the hazard of death observed within the NECOSAD population in the model.15,25,36 For the logistic model, this was done by calculating a correction factor for the intercept based on the incidence of death in the validation cohort, as described by Janssen et al.36 Recalibration can improve calibration measures, but does not affect the discrimination (C-statistic) of the model performance. All statistical analyses were performed in SPSS version 23.
Results
Systematic review
Using the PubMed search strategy (Supplementary materials), 508 articles were identified and their titles screened. From these articles, 112 were selected for abstract review. From the reviewed abstracts, 42 articles were selected for full-text review and three that had been identified through references of other articles were added to the full-text review selection. After the full review 16 articles were included in the systematic review, based on the predefined inclusion criteria as described in the “Methods” section. The study-inclusion flowchart is presented in Figure 1. The main reasons for exclusion were that no formal prediction model was presented or that the goal of the model was not to predict mortality in individual patients. Characteristics from the selected studies were collected by two independent researchers, and are summarized in Table 1. Most of the studies were performed on HD patients, as opposed to PD patients, and made use of Cox models. Many studies used predictors not routinely collected by nephrologists; these were: socioeconomic status, fasting blood glucose, left ventricular ejection fraction, surprise question, plasma S100A12, peritoneal equilibration test, and ventilation.10,11,37–41
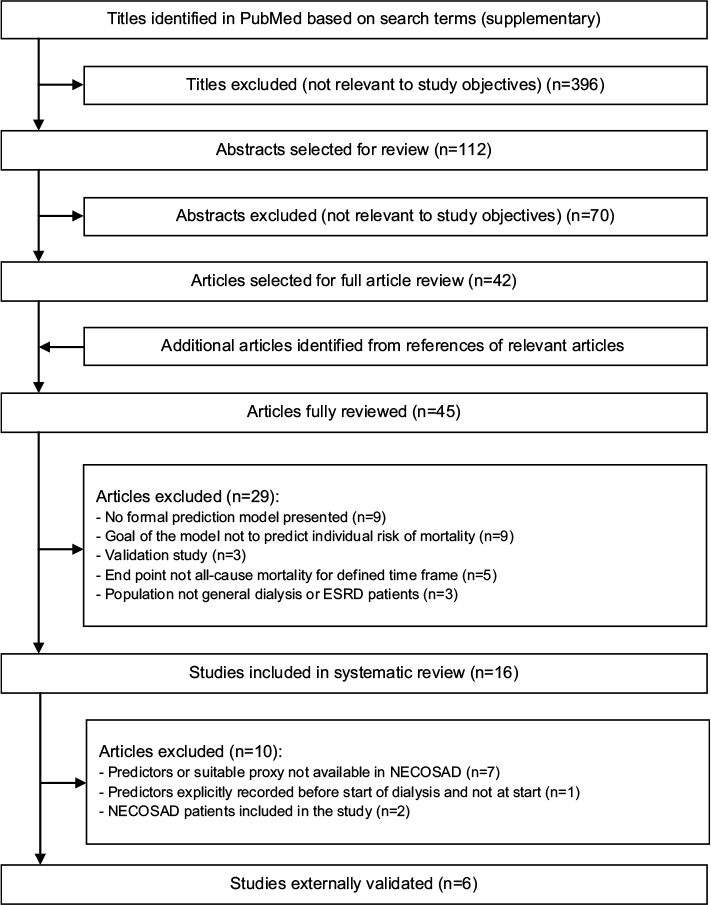 | Figure 1 Flowchart of study selection for systematic review and external validation. Abbreviations: ESRD, end-stage renal disease; NECOSAD, Netherlands Cooperative Study on the Adequacy of Dialysis. |
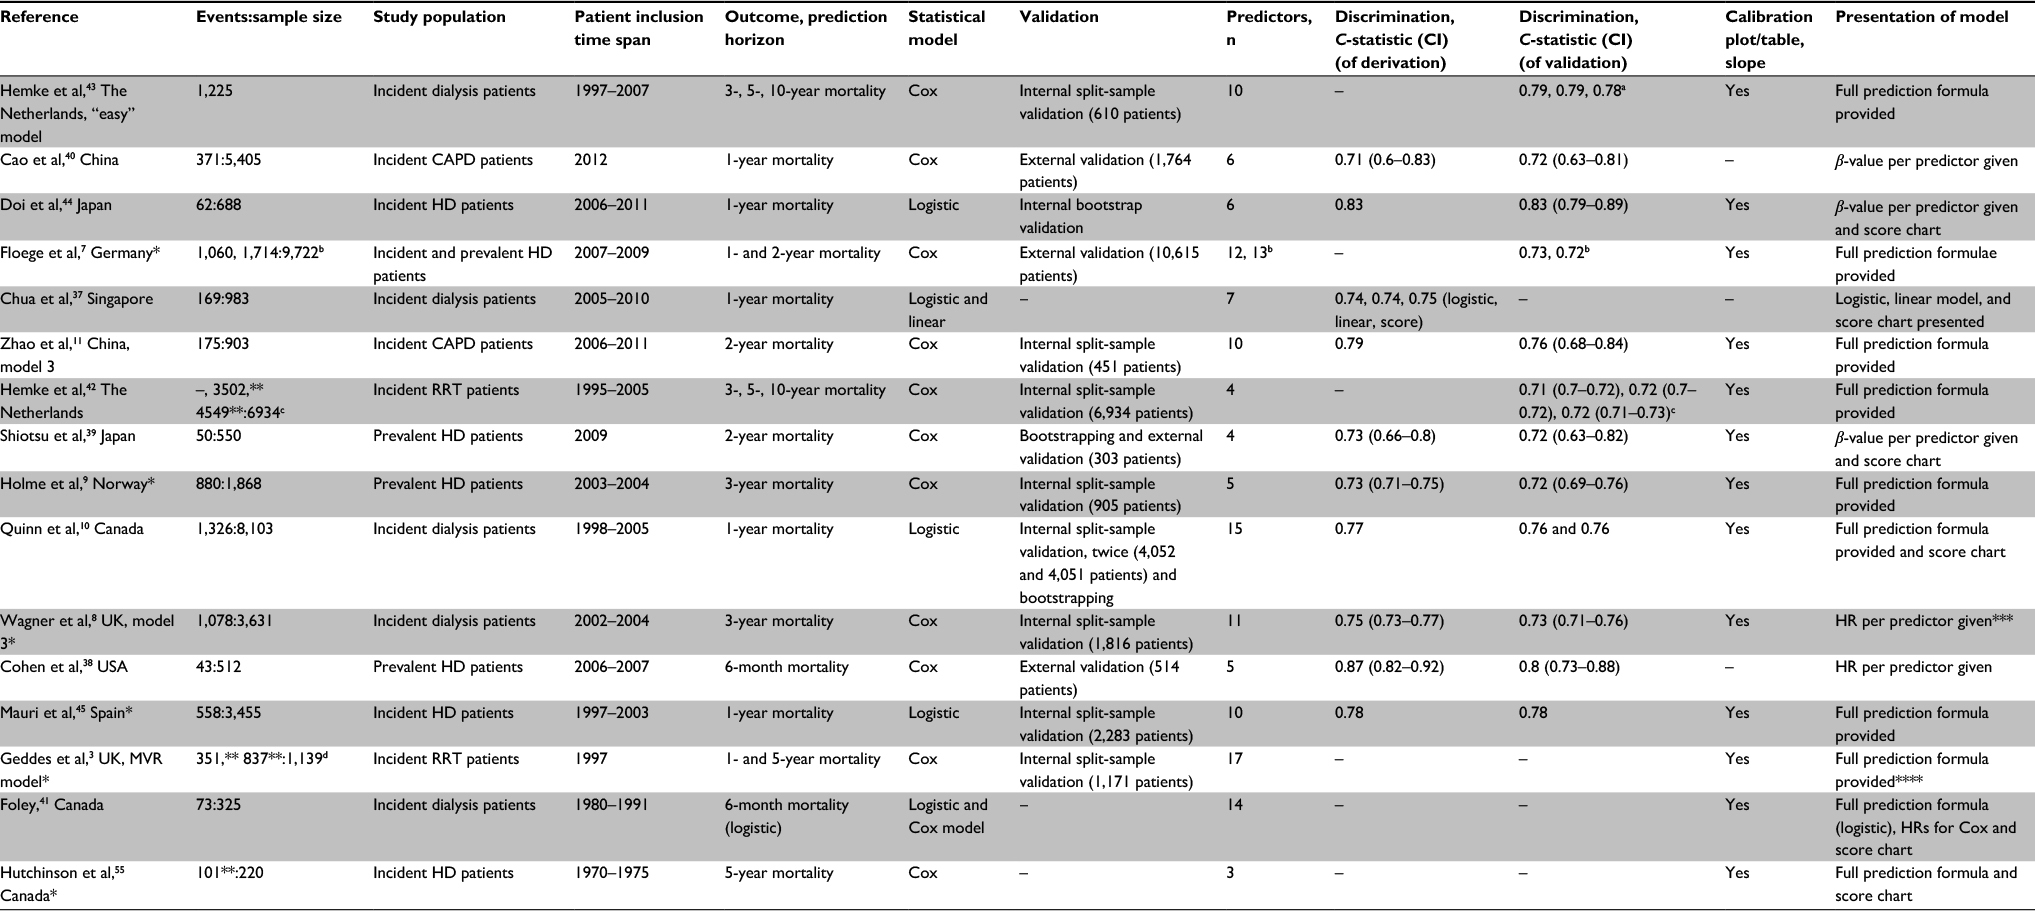 | Table 1 General characteristics of models to predict risk of all-cause mortality in dialysis patients Notes: *Externally validated in the current independent study; **deducted/calculated based on information available in article; ***baseline hazard provided upon request; ****shrinkage factor provided upon request. a3, 5, 10-year mortality, respectively; b1 and 2-year mortality events respectively; c3, 5 and 10 year mortality events, respectively; d1, and 5-year mortality events, respectively. “–” not provided. Abbreviations: CAPD, continuous ambulatory peritoneal dialysis; HD, hemodialysis; HR, hazard ratio; MVR, multivariate regression; RRT, renal replacement therapy. |
As shown in Table 1, a discrimination value was presented for 13 of the 16 models, and ranged from 0.71 to 0.87 in the derivation cohorts. For 12 models, information on calibration in the form of a plot or table was present. A full prediction formula, including baseline hazard and/or intercept and regression coefficients, was available in ten of 16 studies. The baseline hazard function, with which one can calculate predicted probabilities for any time frame in a Cox model, was only offered in one study by Geddes et al.3 Multiple studies offered their estimated baseline hazard for multiple time frames, allowing the model to be used to predict mortality over different prediction horizons.
Selection for external validation
All studies included in the systematic review were considered carefully for validation. A number of studies used very specific predictors that could not be replaced by a proxy. These studies (n=7) were excluded from the validation (see Supplementary material for the specific variables).10,11,37–41 Two studies were excluded because they were (partly) developed on NECOSAD patients.42,43 Finally, one study was excluded because the authors explicitly stated that they had recorded all their predictors before the initiation of dialysis and the values of these predictors change notably after dialysis initiation.44 As shown in Figure 1, a total of six studies presenting seven final-prediction models were finally selected for external validation. Of these studies, four were developed in HD patients and two in dialysis patients in general (HD and PD). The statistical model used was a Cox model in all but one of the validated models, the exception being Mauri et al.45 Upon request, the full prediction formula was made available for all studies.
Baseline characteristics of the validation cohort
Baseline patient characteristics of the NECOSAD patients included at 3 months after dialysis initiation stratified for dialysis modality are summarized in Table 2. The mean time between dialysis initiation and baseline measurement was 93 (SD 13) days. As expected, some marked differences between HD and PD patients were present. For example, the median age was much lower in PD patients. In Table S1, baseline characteristics are given for each predictor/proxy used for validation. In Table S2, baseline characteristics from the derivation cohorts of the validated models are shown. In the first year after baseline (at approximately 15 months after dialysis initiation), 12.6% of the patients (n=244) died. After 2 years 23.3% (n=452) had passed away, and this was 30.2% (n=586) after 3 years and 40.5% (n=787) after 5 years.
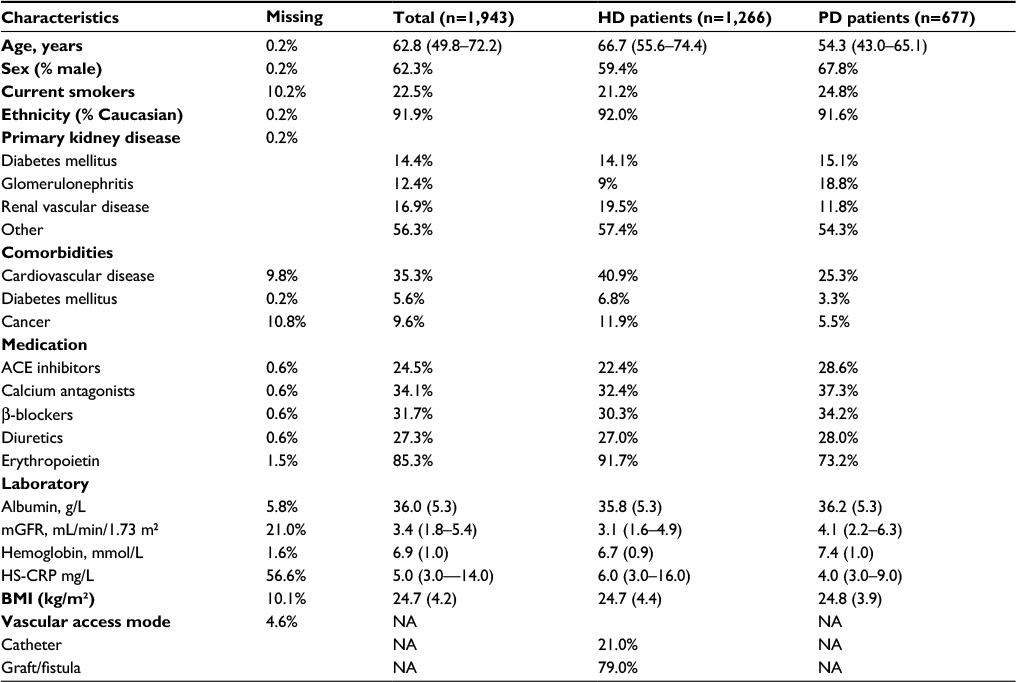 | Table 2 Baseline characteristics of external validation cohort (NECOSAD) at 3 months after dialysis initiation Notes: Continuous variables presented as mean values with standard deviations for normally distributed variables. Continuous variables presented as median values with interquartile ranges for non-normal distributed variables. Categorical variables presented as valid percentages. Abbreviations: NECOSAD, Netherlands Cooperative Study on the Adequacy of Dialysis; HD, hemodialysis; PD, peritoneal dialysis; mGFR, measured glomerular filtration rate (combined creatinine and urea clearance in 24-hour urine samples at 3 months); BMI, body-mass index; NA, not applicable; HS-CROP, high sensitivity C-reactive protein. |
Performance of validated models
Table 3 shows the discrimination of the validated models presented as the pooled mean Harrell’s C-index from the ten imputation sets with IQRs. In Table 4, the discrimination is presented when stratified for dialysis modality. The models performed moderately to well in terms of discrimination, with C-statistics ranging from 0.71 (IQR 0.708–0.711) to 0.752 (IQR 0.750–0.753) for a time frame of 1 year. Models tested for different time frames performed consistently more poorly when the prediction horizon increased. All models performed better in the PD population than in the HD population. The model of Wagner et al8 showed the highest discriminatory ability for 1 year, with a C-statistic of 0.752 (IQR 0.750–0.753), while models by Floege et al7 showed similarly high discrimination, with highest discriminatory ability for a 2-year prediction time frame with a C-statistic of 0.740 (IQR 0.737–0.742). To assist comparison, C-statistics found through current external validation were plotted against original C-statistics (if available; Figure 2). As one can tell from this figure, all studies that presented a C-statistic performed more poorly in external validation. In Figure 3, Kaplan–Meier curves are shown per model for quartiles of the prognostic indices. This clarifies the models’ capability of distinguishing between patients with high or low mortality rates, and gives insight on how the discrimination capacity changes over time.
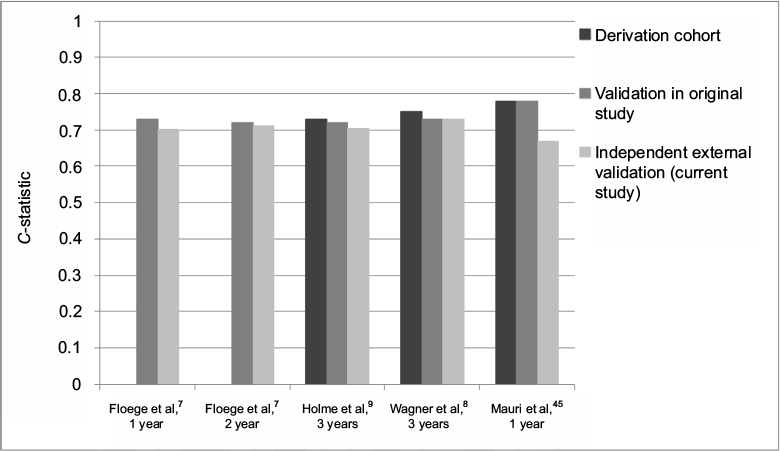 | Figure 2 C-statistics reported in the original study compared to those found through external validation (for the original time frame and original dialysis modality). Note: The validation in the original study of Floege et al7 was an external validation also. |
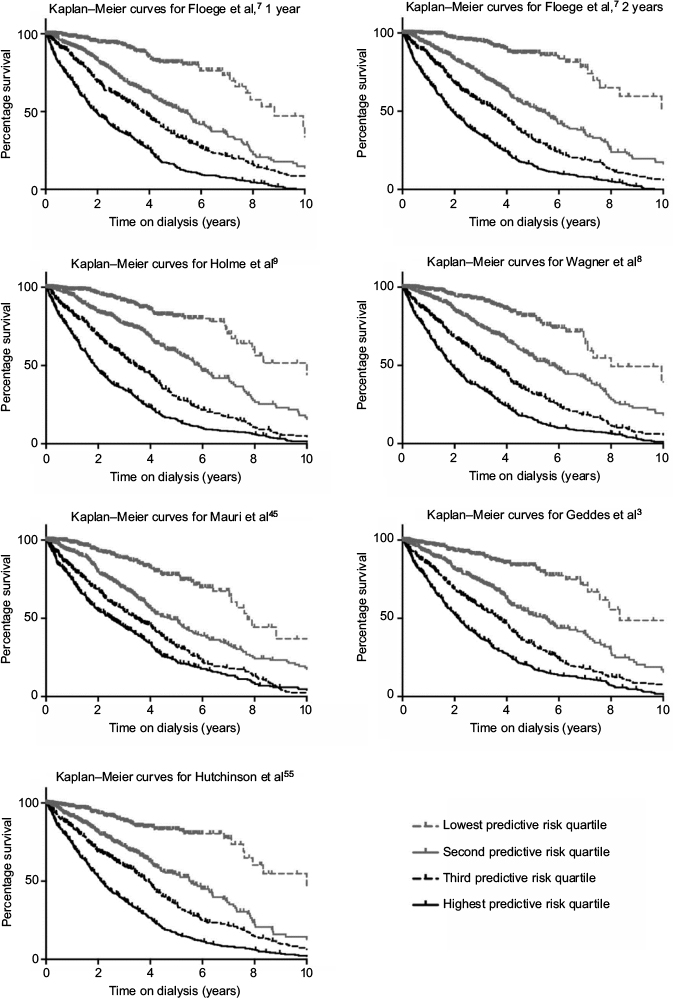 | Figure 3 Kaplan–Meier survival curves by quartile of the prognostic index. |
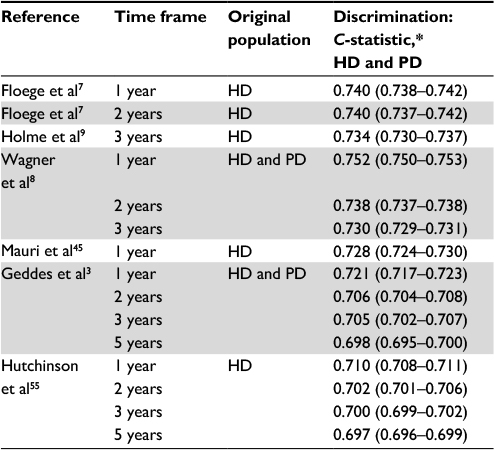 | Table 3 Discrimination results of external validation for HD and PD patients Note: *C-statistics presented as medians and interquartile ranges from pooled imputation results. Abbreviations: HD, hemodialysis; PD, peritoneal dialysis. |
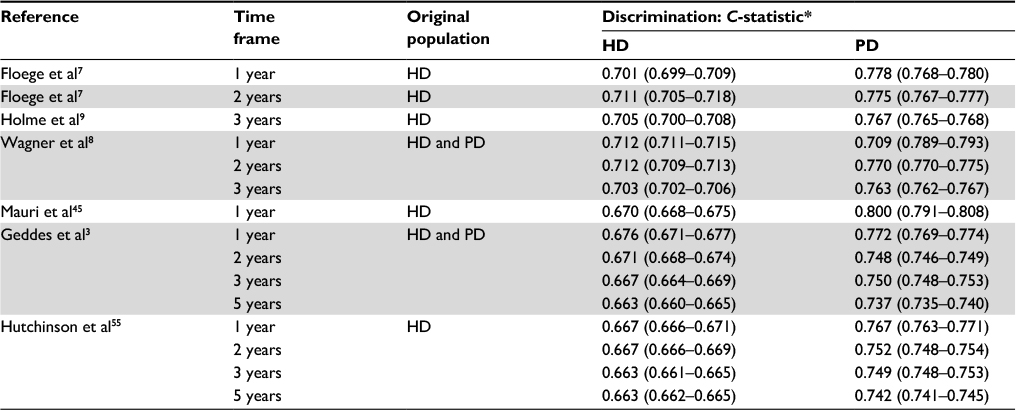 | Table 4 Discrimination results of external validation stratified for dialysis modality Note: *C-statistics presented as medians and interquartile ranges from pooled imputation results. Abbreviations: HD, hemodialysis; PD, peritoneal dialysis. |
The overall calibration of the models can best be judged by examining the calibration plots presented in Figure 4 and taking the calibration slope and calibration-in-the-large into account, as shown in Tables 5 and 6. Calibration plots are presented for single time frames and combined for HD and PD patients (see Figure S1 for calibration plots stratified by dialysis modality and for various prediction time frames). Though the model tended to overestimate slightly, the calibration of Holme et al’s9 model was fairly good, as can be seen in the plot, and was exemplified by a calibration slope close to 1. Floege et al’s7 1- and 2-year models also showed fairly good calibration. The models of Geddes et al3 and Hutchinson et al55 both overestimated considerably, especially in the higher risk ranges. The model of Wagner et al8 significantly underestimated the probability of mortality, and the model of Mauri et al45 slightly underestimated and had a poor slope of 0.27. After adjustment for differences in mortality rates between NECOSAD and the development cohorts as a sensitivity analysis, overall the calibration plots improved (Table S3 and Figure S2).
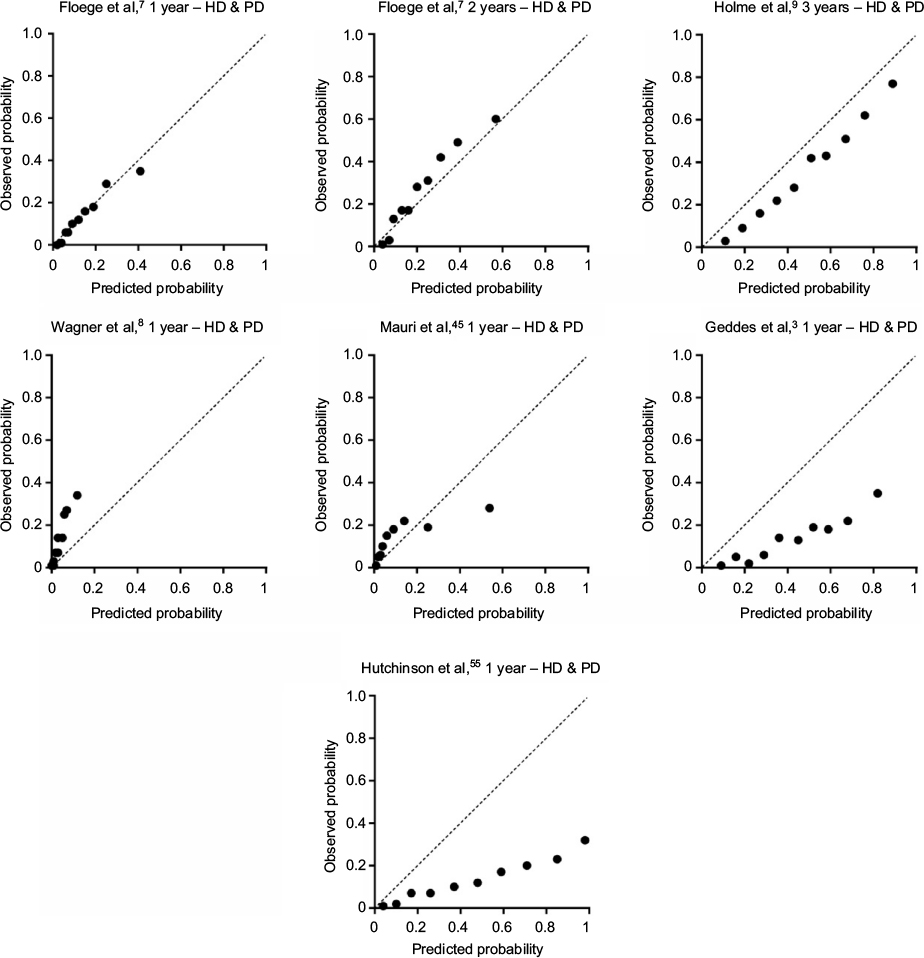 | Figure 4 Calibration plots per model. Abbreviations: HD, hemodialysis; PD, peritoneal dialysis. |
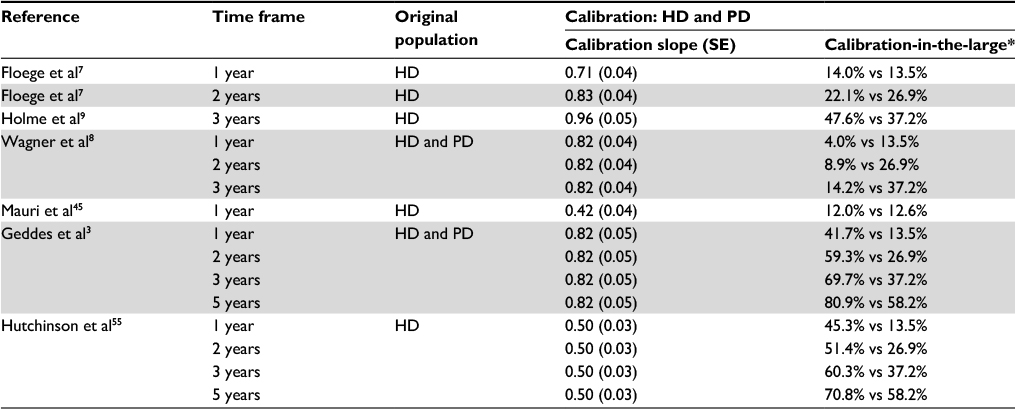 | Table 5 Calibration results of external validation for HD and PD patients Note: *Predicted vs observed risk of death. Abbreviations: HD, hemodialysis; PD, peritoneal dialysis; SE, standard error. |
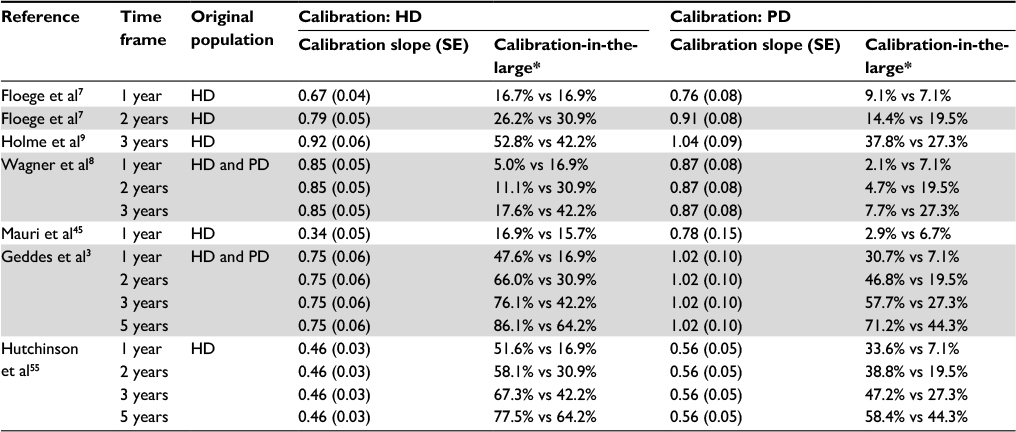 | Table 6 Calibration results of external validation stratified for dialysis modality Note: *Predicted vs observed risk of death. Abbreviations: HD, hemodialysis; PD, peritoneal dialysis; SE, standard error. |
Discussion
In this study, which included a systematic review and external validation, it was shown that there are 16 published models predicting death in dialysis patients, which previously have barely been validated and have not been implemented in clinical practice on a large scale. Validating them in a large independent cohort showed that they all performed more poorly on new patients, demonstrating the importance of external validation before clinical implementation in the shared decision-making process.
The systematic review exemplified that many articles describing the development of a prediction model used rare predictors that are difficult to validate. Besides complicating validation, the use of rare predictors makes these tools extremely impractical for nephrologists and large-scale clinical implementation highly improbable. The systematic review also showed that many studies were incomplete in providing all information necessary for complete external validation or described outcome-assessment measures differently from standard discrimination and calibration, thus complicating comparison of different models and comparison of model performance in different populations. Similar problems gave rise to the development of the TRIPOD guidelines and were also described in a review by Bouwmeester et al, in which it was concluded that the majority of prediction studies do not follow current methodological recommendations.20,46
The current study externally validated seven models (presented in six studies) on the same patient population for the same outcome measures. Depending on the intended use of the models and the available predictors, the preferred model to implement would differ. Considering discrimination, the model proposed by Wagner et al8 seems to be best suited for distinguishing high- and low-mortality-risk patients in a population of HD and PD patients over a time frame of 1 year in this validation cohort. The models of Floege et al7 also showed high discriminatory ability, with the highest C-statistics for a 2-year time frame. For predicting 3-year probability of mortality, Holme et al’s9 model performed best on discrimination. As far as calibration goes, most models showed poor calibration when eyeing the calibration plots, and calibration seemed to be best in the models of Floege et al7 and Holme et al9.
When comparing the predictive performances found in this external validation to the performance reported in the original articles (Figure 2), we can state that overall performance was poorer in the validation (as expected), especially when looking at performance in only HD patients. In conclusion, the models presented by Floege et al7 seem to be best suited to their goal, and showed results in validation that were very consistent with their original findings. This might be due to the fact that they presented predictive performances that were already based on external validation (as well as internal validation), which they had performed on their model in the original publication, but also could have been influenced by the high resemblance among the Western European patient populations in which the model was derived and validated. In addition, parsimony of a model may weigh against a slight loss in performance. Since the models compared differed greatly in number of predictors included, one could imagine that a model with fewer predictors, such as that of Holme et al9, which uses only five variables, might be preferred in a fast-paced clinical setting to Floege et al’s7 models, which both include over ten predictors. One might also take into account that certain predictors might not be readily available in all settings. The simplicity of a model partly determines its clinical usefulness and reliability.14
By evaluating the different models in the same data set, this study provides a far greater amount of information than separate validation studies would, as attested by Collins and Moons and recently demonstrated in a study by Abbasi et al, who systematically validated prediction models for the risk of developing diabetes.47,48 Unfortunately, a lack of well-conducted external-validation studies of prognostic models was found, and many validation studies handle missing data inadequately or do not report measures of model calibration.18,22 These are issues that we have accounted for. Still, there are a number of limitations to our study.
First, our results were influenced by differences in case-mix and mortality rates between the derivation cohorts and our validation cohort. Inherently, some of the derivation cohorts will resemble our validation cohort more than others, since patient characteristics can differ strongly per country, per time span of patient inclusion, or per chosen method for patient inclusion.
Furthermore, percentage of missing data of predictors can differ between derivation and validation, especially for CRP, which had a large missing rate in our cohort. However, this was dealt with by using multiple imputation, under the assumption that these data were missing at random. Baseline mortality, which can largely influence calibration results, differs strongly per time period and also per country and setting, such as an inpatient clinic, hospital, or outpatient clinic. The marked overestimation of mortality in the model of Hutchinson et al can be accounted for by the dramatic change in mortality rates of dialysis patients between the 1970s and late 1990s,49 and exemplifies the fact that recalibration over time is important to adjust models to new event rates.
The importance of differences in patient characteristics was also seen in the large difference between results in HD and PD patients. It seems counterintuitive that all models showed better discrimination for PD patients, even though they were not designed for this group of patients. However, this can be accounted for by a larger case-mix heterogeneity within the PD-patient population, specifically in age, allowing for better discrimination, which is a population characteristic and has little to do with model fit.50 Due to such differences in case-mix and mortality rates, this validation study can be seen as a true test of the transportability of the models to patients from different source populations, in which population differences on a geographical and temporal level can be a great strength.23 If a model performs well across a spectrum of different populations, a universally applicable model may be within reach.
Another factor that complicates comparison is the different prediction time frames used by the studies. The larger the time frame, the more difficult it is to predict a patient’s death. For a better comparison and validation, we urge studies to include the baseline hazard function of a Cox prediction model or at least the baseline hazard value for clinically relevant time points, as specified in the TRIPOD guidelines.
To conclude, we warn against drawing general conclusions on which validated model is “the best”, as the different models were tested on transportability to a different degree and reproducibility was not always apparent. Clinical expertise remains leading when interpreting the differences between derivation and validation cohorts and differences between model performance.
This study contains a number of great strengths. To our knowledge, this is the first study to conduct a systematic review of existing models for predicting mortality in dialysis patients and subsequently validate and compare the existing models. To guarantee study reproducibility and transparency to the greatest extent possible, the PRISMA and TRIPOD guidelines were followed. Furthermore, missing data were accounted for by performing multiple imputations. This allowed us to test each model on the same patient population, and decreased the chance of selection bias.28 Additionally, NECOSAD is a highly representative large cohort of incident dialysis patients, and the large number of events within NECOSAD provide us with unbiased and precise estimations of calibration and discrimination performance measures.51,52
We have chosen to perform very conservative model updating as a sensitivity analysis only, and recommend that our main (unupdated) results be used when interpreting the performance of the validated models. Since validation means assessing the performance of a predefined model with new data, one could wonder whether model updating leads to a new model, which would then need external validation itself.34,53 If the validation results demonstrate that a model is not transportable to a specific (sub)population, this could give incentive for model updating in the context of an impact study or during clinical implementation.23
It is clear that before clinical implementation of prognostic models is warranted, extensive validation is necessary. The aim of clinical implementation is for such models to function as a useful tool for nephrologists, using evidence-based medicine that combines individual clinical expertise, patients’ choices, and the best external evidence.6,54
For future research, we suggest that more effort is put into validating, building upon, and implementing existing models in different populations. In the emerging field of prediction modeling, it is essential to provide summaries and evaluations of previously conducted studies through external validation, in order to move forward and prevent research waste. This study brings us a step closer to the use of a model with which personalized information on prognosis can be given to dialysis patients, aiding patient-centered decision making.
Acknowledgments
We would like to thank the Dutch Kidney Foundation and the Dutch Kidney Patient Association for their enthusiasm and support. The nursing staff of the 38 different dialysis units, who collected most of the data, are gratefully acknowledged for their assistance. Moreover, we thank the staff of the NECOSAD trial office for assistance in the logistics of this study.
The NECOSAD study group consisted of AJ Apperloo, JA Bijlsma, M Boekhout, WH Boer, PJM van der Boog, HR Büller, M van Buren, FTH de Charro, CJ Doorenbos, MA van den Dorpel, A van Es, WJ Fagel, GW Feith, CWH de Fijter, LAM Frenken, JACA van Geelen, PGG Gerlag, W Grave, JPMC Gorgels, RM Huisman, KJ Jager, K Jie, WAH Koning-Mulder, MI Koolen, TK Kremer Hovinga, ATJ Lavrijssen, AJ Luik, J van der Meulen, KJ Parlevliet, MHM Raasveld, FM van der Sande, MJM Schonck, MMJ Schuurmans, CEH Siegert, CA Stegeman, P Stevens, JGP Thijssen, RM Valentijn, GH Vastenburg, CA Verburgh, HH Vincent, and PF Vos.
Disclosure
CL Ramspek received a Kolff student research grant (number 15OKK99) from the Dutch Kidney Foundation (De Nierstichting) for her research activities and internship. The other authors report no conflicts of interest in this work.
References
 © 2017 The Author(s). This work is published and licensed by Dove Medical Press Limited. The full terms of this license are available at https://www.dovepress.com/terms.php and incorporate the Creative Commons Attribution - Non Commercial (unported, v3.0) License.
By accessing the work you hereby accept the Terms. Non-commercial uses of the work are permitted without any further permission from Dove Medical Press Limited, provided the work is properly attributed. For permission for commercial use of this work, please see paragraphs 4.2 and 5 of our Terms.
© 2017 The Author(s). This work is published and licensed by Dove Medical Press Limited. The full terms of this license are available at https://www.dovepress.com/terms.php and incorporate the Creative Commons Attribution - Non Commercial (unported, v3.0) License.
By accessing the work you hereby accept the Terms. Non-commercial uses of the work are permitted without any further permission from Dove Medical Press Limited, provided the work is properly attributed. For permission for commercial use of this work, please see paragraphs 4.2 and 5 of our Terms.