Back to Journals » International Journal of General Medicine » Volume 14
Prediction Models for AKI in ICU: A Comparative Study
Authors Qian Q, Wu J, Wang J ![]() , Sun H
, Sun H ![]() , Yang L
, Yang L
Received 30 October 2020
Accepted for publication 7 January 2021
Published 25 February 2021 Volume 2021:14 Pages 623—632
DOI https://doi.org/10.2147/IJGM.S289671
Checked for plagiarism Yes
Review by Single anonymous peer review
Peer reviewer comments 2
Editor who approved publication: Dr Scott Fraser
Qing Qian, 1, 2 Jinming Wu, 2 Jiayang Wang, 2 Haixia Sun, 2 Lei Yang 1
1Hangzhou Normal University, Hangzhou, People’s Republic of China; 2Institute of Medical Information & Library, Chinese Academy of Medical Sciences & Peking Union Medical College, Beijing, People’s Republic of China
Correspondence: Lei Yang
Hangzhou Normal University, Hangzhou, People’s Republic of China
Email [email protected]
Purpose: To assess the performance of models for early prediction of acute kidney injury (AKI) in the Intensive Care Unit (ICU) setting.
Patients and Methods: Data were collected from the Medical Information Mart for Intensive Care (MIMIC)-III database for all patients aged ≥ 18 years who had their serum creatinine (SCr) level measured for 72 h following ICU admission. Those with existing conditions of kidney disease upon ICU admission were excluded from our analyses. Seventeen predictor variables comprising patient demographics and physiological indicators were selected on the basis of the Kidney Disease Improving Global Outcomes (KDIGO) and medical literature. Six models from three types of methods were tested: Logistic Regression (LR), Support Vector Machines (SVM), Random Forest (RF), eXtreme Gradient Boosting (XGBoost), Light Gradient Boosting Decision Machine (LightGBM), and Convolutional Neural Network (CNN). The area under receiver operating characteristic curve (AUC), accuracy, precision, recall and F-measure (F1) were calculated for each model to evaluate performance.
Results: We extracted the ICU records of 17,205 patients from MIMIC-III dataset. LightGBM had the best performance, with all evaluation indicators achieving the highest value (average AUC = 0.905, F1 = 0.897, recall = 0.836). XGBoost had the second best performance and LR, RF, SVM performed similarly (P = 0.082, 0.158 and 0.710, respectively) on AUC. The CNN model achieved the lowest score for accuracy, precision, F1 and AUC. SVM and LR had relatively low recall compared with that of the other models. The SCr level had the most significant effect on the early prediction of AKI onset in LR, RF, SVM and LightGBM.
Conclusion: LightGBM demonstrated the best capability for predicting AKI in the first 72 h of ICU admission. LightGBM and XGBoost showed great potential for clinical application owing to their high recall value. This study can provide references for artificial intelligence-powered clinical decision support systems for AKI early prediction in the ICU setting.
Keywords: acute kidney injury, intensive care unit, prediction models, machine learning, deep learning
Introduction
Acute kidney injury (AKI) is a common complication of critical illnesses. AKI carries a worldwide prevalence of 5–20%.1 AKI contributes to longer hospital stay and higher morbidity and, subsequently leads to a heavy financial burden to patients.2–4 In China, among hospitalized patients, prevalence of AKI is 1%-2%, the prevalence of mortality due to AKI is 12.4% and the prevalence of misdiagnosis of AKI is 74.2% according to national epidemiology study on AKI.5 ICU patients who develop AKI carry a higher risk for end-stage renal disease and tend to have worse outcome and higher risk of death after hospital discharge.6
Specific treatments cannot reverse AKI, so early recognition and management are essential. Indeed, recognition of patients at risk for AKI before the diagnosis seems likely to contribute to better clinical outcomes than treatment of only established AKI.7 However, early recognition of AKI remains a prodigious clinical challenge because AKI is defined based on an increase in serum creatinine (SCr) level or a decline in urine output, both of which are late, non-specific markers of the underlying disease.8 Electronic health records (EHR) are becoming more prevalent. Increasingly, digitalized healthcare systems can aid development of predictive models using the clinical data of thousands of “patient encounters”.9 To identify patients at risk for AKI early and guide clinical decision-making, various predictive models using EHR have been published or validated for different clinical settings, for example, AKI after cardiac surgery,10–13 after non-cardiac surgery,14,15 (eg, liver transplantation16) after exposure to radiocontrast material,17–19 after suffering burns, or in the intensive care unit (ICU),8,20–26 etc..
Mohamadlou and colleagues created an AKI-prediction tool using a machine learning (ML) method, and boosted ensembles of “decision trees”.27 Tomašev et al developed a deep-learning (DL) approach using a recurrent neural network (RNN) for the continuous risk prediction of deterioration in patients.28 In the ICU setting, Malhotra and collaborators developed and validated a risk score by logistic regression (LR) for predicting AKI.24 Sanchez-Pinto and colleagues proposed a data-driven multivariable clinical prediction model of AKI using LR methods.20 ML and DL methods have also been applied to AKI prediction in ICU scenarios, such as support vector machine (SVM), Naive Bayesian (NB), random forest (RF), adaptive boosting (AdaBoost), gradient boosting decision tree (GDBT), convolutional neural networks (CNN) and RNNs.23
Several studies have compared prediction models for AKI.10,29–32 Kiers and colleagues compared the clinical suitability of eight prediction models for cardiac surgery-related AKI.10 Caragata et al compared ML approaches with LR model for the prediction of AKI after liver transplantation.16 Parreco and colleagues trained different classifiers (GDBT, LR, DL) for AKI prediction.29 However, the performance of models may vary in different scenarios, and the studies mentioned above do not focus on the critical-care setting. Few studies involving comparisons of models have concentrated on AKI prediction in the ICU.15,21 We compared the performance of different popular models for early prediction of AKI for a general adult patient population in the ICU. We focused on early prediction for patients who did not develop AKI upon admission. In this way, we targeted a population that could benefit from strategies to prevent AKI (or minimize its clinical impact). We chose LR, SVM and RF as conventional ML practices and Light Gradient Boosting Decision Machine (LightGBM) and eXtreme Gradient Boosting (XGBoost) as new ML algorithms with outstanding performance. DL studies have also shown great potential for supporting clinical decision-making, so a CNN model was also included.
Methods
Data Collection
Data used in this study were collected from Medical Information Mart for Intensive Care (MIMIC)-III,33–35 which captured de-identified health information for >46,000 patients admitted to the critical care units at Beth Israel Medical Center (New York, NY, USA) between 2001 and 2012. We used MIMIC-III version 1.4 published in 2016 with additional structured electronic healthcare data.
We restricted our research to structured data. This was because the processing of unstructured data (eg, clinical notes), even though it can provide additional diagnostic and laboratory information, is reliant on Natural Language Processing (NLP) technology, which could have a direct impact on our comparison of performance between different models.
A structured query language script was developed to query the MIMIC-III database for patients who aged ≥18 years, without chronic kidney disease, who had undergone kidney transplantation or had end-stage renal disease upon hospital admission and had valid data for SCr measurement 72 h after ICU admission. A total of 17,205 records for ICU stay met the inclusion criteria for our study. The data extracted were age, gender, ethnicity, 72 h SCr level and other physiological indicators during the first day of ICU admission. Indicators of the SCr level and urine output for the first 72 h were used for AKI identification. All other physiological indicators for the first 24 h of ICU admission, along with SCr level and urine output were used for modelling.
Ethical Issues
Ethical approval from our institution (Institute of Medical Information & Library, Chinese Academy of Medical Sciences & Peking Union Medical College) was not required because our research did not impact clinical care and all protected health information is de-identified in MIMIC-III. De-identification was undertaken in compliance with Health Insurance Portability and Accountability Act standards to facilitate public access to MIMIC-III. Protected health information was deleted from structured data sources (eg, database fields that provide the name or date of birth of the patient) and removed from free text (eg, discharge summaries, diagnostic reports, nursing and respiratory notes).36
AKI Definition
In Kidney Disease Improving Global Outcomes (KDIGO), AKI is defined as any of the following: (i) increase in SCr ≥0.3 mg/dL within 48 h; (ii) increase in SCr ≥1.5 times compared with baseline known or presumed to have occurred within the prior 7 days; or (iii) urine volume value ≤0.5 mL/kg/h for 6 hours. We wished to rule out patients with severe kidney problems. Hence, only patients with initial SCr <4.0mg/dL were selected according to risk, injury, failure, loss, end-stage kidney disease (RIFLE) and acute kidney injury network (AKIN) criteria.37,38 In our study, the SCr level from day-2 and day-3 was compared with the SCr level on day-1 of ICU admission. If the SCr level in the subsequent 48 h increased by ≥0.3 mg/dL than the minimum SCr level on day-1, the record was labeled as “AKI”. Patients who developed AKI by 72 h of ICU stay were identified by comparing the maximum SCr level on day-2 and day-3 with the minimum SCr level on day-1 (baseline) as well as the urine volume as defined by KDIGO criteria. Figure 1 presents the time windows of data collection in the present study.
 |
Figure 1 Time windows for data collection. |
Predictor Variables
Demographic information, physiological indices, related interventions and comorbidities are usually taken into consideration with respect to predictor variables. According to KDIGO criteria and the literature, 17 physiological measurements were selected in the present study: (i) demographic information (age, sex and body mass index (BMI)); (ii) laboratory tests or physiological indices (Blood Urea Nitrogen (mg/dL), International Normalized Ratio, Glucose (mg/dL), Partial Thromboplastin Time (s), Hemoglobin (K/μL), Platelet Count (K/μL), Potassium (mg/dL), White Blood Cell Count (K/μL), Bicarbonate (mg/dL), Calcium (mg/dL), Prothrombin Time (s), Creatinine (mg/dL) and Urine Output (mL), Oxygen saturation (%)). All of these physiological measurements apart from BMI, have been included in at least three other peer studies.21,26 Obesity is associated with an increased risk and greater severity of AKI, so BMI is considered a predictor of AKI.5,17 The maximum value and minimum value in the first 24 h of each physiological feature were considered as different variables in the final dataset. Accordingly, the extracted data for each patient contained three demographic variables, 28 physiological variables (maximum value and minimum value for each physiological measurement) in the first 24 h and one AKI indicator (SCr level based on KIDIGO).
Comorbidities (eg, diabetes mellitus) were not take into consideration. This is because laboratory tests or vital signs are effective for predicting AKI for critically ill patients with multiple acute symptoms or chronic diseases.21 However, we believe that diagnoses stated by patients before ICU admission could provide valuable information for predictive modeling. Therefore, all diagnostic information was converted into a numeric vector, whereas chronic diseases that could affect AKI (eg, diabetes mellitus) were not given extra weight.
Data Processing
Abnormal Value Handling
There were special values in MIMIC-III because of de-privacy processing. For example, MIMIC-III shifted all the date-time records to a random future date to protect the privacy of patients. The age of patients was calculated by subtracting the data of ICU admission from the date of birth; however, all patients aged >89 years were shifted to age >300 years. To make the data more realistic, these unreliable data were treated as age =90 years.
Demographic information (age, sex, ethnicity) was complete. Laboratory tests and physiological items contained missing values, but this did not mean that the vital signs of patients had not been documented; it may indicate that certain tests did not need to be done during the ICU stay according to the clinician’s opinion. In the early stage of the patient entering the ICU, various indicators were monitored closely. After physical signs had stabilized, the attending physician screened some important indicators according to the patient’s condition and continued monitoring, or measurement of some indicators declined gradually (or was even stopped) if they had low correlation with the condition. Therefore, the number of missing values in the medical records increased over time.
In the collected dataset, rows (one row records all the data for one patient) with 50% missing values were removed. The remainder of the data had missing values replaced with method “norm.predict” in Multivariate Imputation by Chained Equation (MICE) which uses LR to predict missing values.41
Handling of Imbalanced Data
It has been reported that the prevalence of AKI in the ICU is 5.7%–67%.5 The prevalence of AKI on day-1 in the present study was 24.54%, which was within the range of real-world observations. Accordingly, imbalanced data would cause a biased result in the training set. That is, learning algorithms would pick-up more non-AKI features, and AKI patients would tend to be predicted as a non-AKI group. There were 3929 AKI patients and 12,084 non-AKI patients in our cohort. The medical records of 3929 non-AKI patients were chosen randomly and mixed with the medical records of 3929 AKI patients to balance positive samples and negative samples. Then, this cohort of 7858 medical records was inputted into a model and split randomly into a training set (80%) and testing set (20%). Figure 2 illustrates this process using blue blocks as the medical records of AKI patients and red blocks as the medical records of non-AKI patients. As an experimental control, imbalanced data were also fed into each model for comparison.
 |
Figure 2 Handling and splitting of imbalanced data. Notes: (A) Imbalanced cohort with more non-AKI patients than AKI patients. (B) Balanced cohort with the same number of AKI and non-AKI patients. (C) Resorting of the sequence randomly. (D) Randomly selected 20% from c as the testing set. (E) Random selection of 20% from c as the training set. |
Prediction
Six methods were chosen to build predictive models, as discussed below.
LR is a traditional statistical method that has been used extensively in disease prediction (including early prediction of AKI). In multivariate LR, the log probability of an event is:
LR,43 a log-linear model. In the multivariate logistic regression, the log probability of an event is:
log[p(x)/1-p(x)]=β0+β1X1+ … +βpXp,
then the probability of an event is:
p(X)=eβ0+β1X1+···+βpXp/(1+eβ0+β1X1+···+βpXp).
SVM is a two-class classification model.44 The basic model is a linear classifier with the largest interval defined in the feature space. SVM can be formalized as a problem of solving convex quadratic programming, which is also equivalent to the problem of minimizing the regularized hinge loss function. The learning algorithm of SVM is the optimal algorithm for solving convex quadratic programming.
RF is a collection of tree classifiers (h(x, βk), k=1 …).45 Among them, the base classifier h(x, βx) is an unpruned classification regression tree constructed by the Classification and Regression Tree (CART) algorithm, and the output uses a simple majority voting method.
The basis of LightGBM is to use a weak classifier for iterative train to obtain the optimal model.46 Then, a gradient-boosting framework that uses a tree-based learning algorithm is employed to reduce the amount of calculation of the structure score. On this basis, this histogram-based algorithm was used to select the split point and use the leaf-wise strategy to simplify calculations and improve accuracy.
XGBoost is an application of gradient-supported decision trees designed for speed and performance. It is structured on classification and regression predictive modeling problems or dominating data sets in tabular form.47
CNN is a DL method based on multilayered artificial neural network structure.48 The neural network takes a tensor as an input. The convolution layers abstract the features of the input and pass them to polling, activation and fully connected layers for further feature extraction. Each type of layer can be repeated due to the different nature of the tasks. Different from traditional machine learning methods, CNN can process 3D input and have exceptional performance on image recognition tasks.
The data fed into the prediction models were handled for missing and imbalanced values. Before the training of each model, the pre-selected cohort went through the handling of unbalanced data. This was followed by splitting of data randomly into a training set (80%) and testing set (20%) (Figure 2). To ensure maximum use of data, we did not use a cross-validation method. Instead, each time that unbalanced data were handled, different non-AKI data were chosen randomly to mix with AKI data to form a new dataset, and then fed into the training set; this was repeated 10 times for each model. Data processing and modeling work were done using Python 3.6.4 (www.python.org/). Handling of missing values was partially done in R 3.6.0 (R Project for Statistical Computing, Vienna, Austria).
Results
Baseline Characteristics of the Cohort
The selected dataset comprised the demographic information, day-1 of physiological measurements, and AKI indicator (SCr level on day-2 and day-3) of the patient cohort. The dataset contained the medical records of 17,205 patients.
Medical records with >50% missing values were removed, and the remaining missing values were replaced with the help of MICE. The data size decreased from 17,205 to 16,013. Before modeling, the dataset was handled to balance the sample. All AKI samples were mixed with the same number of non-AKI samples (selected randomly from all non-AKI samples). Eventually, a dataset with 7858 records (half AKI and half non-AKI) and 31 features (three demographic features, the maximum value and minimum value for each of 14 physiological features) were fed into each model.
Table 1 shows that the population characteristics between AKI patients and non-AKI patients were distinctive. AKI patients tended to be older than non-AKI patients and to have higher BMI. There were more males than females in the cohort, and the AKI group had a higher male: female ratio than the non-AKI group. The difference between all physiological features was significant (95% confidence interval (CI)) except for the maximum hemoglobin level, heart rate, and pulmonary artery diastolic pressure.
 |
Table 1 Demographic Characteristics of the Patient Cohort at Baseline |
Comparison of the Performance of Each Model
“AUC” is the area under the receiver operating characteristic (ROC) curve. It describes the performance of a classifier reasonably well.49 To evaluate the performance of 6 models, the average AUC for 10 running results was used for comparison. Precision, recall, F1-measure and accuracy were also calculated for reference.
In the control experiment using imbalanced data, the result of the training set was not ideal. All methods had rather poor recall (≤0.52) except for LightGBM (AUC ≥0.76). After feeding a model with balanced data (same number of AKI and non-AKI medical records), all six models showed improved results. Due to the stochastic nature of the algorithms, each model was run 10 times.
To be certain that the difference between each model was distinctive on at the statistical level, the ANOVA test was applied for a 10 times-repeated AUC result for each model. The difference between each model was significant (P = 1.7 x 10⁻³⁴, 95% CI) (Tables 2 and 3).
 |
Table 2 Statistic Summary of the 10-Times AUC Result for Each Model |
 |
Table 3 ANOVA of the 10-Times AUC Result for Each Model |
LightGBM showed the best performance among the models tested, with average AUC of 0.905, F1 of 0.897, recall of 0.836. XGBoost achieved the second best, with average AUC of 0.76, F1 of 0.771, recall of 0.8). LR, RF and SVM had similar AUC values (P = 0.082, 0.158, 0.710, respectively) and they were considered to have similar performance on AKI prediction (Table 4). The CNN model performed poorly on accuracy, precision, F1 and AUC. RF and CNN had a reasonable recall (>0.7), but were positioned third and fourth compared with the respective value for LightGBM and XGBoost.
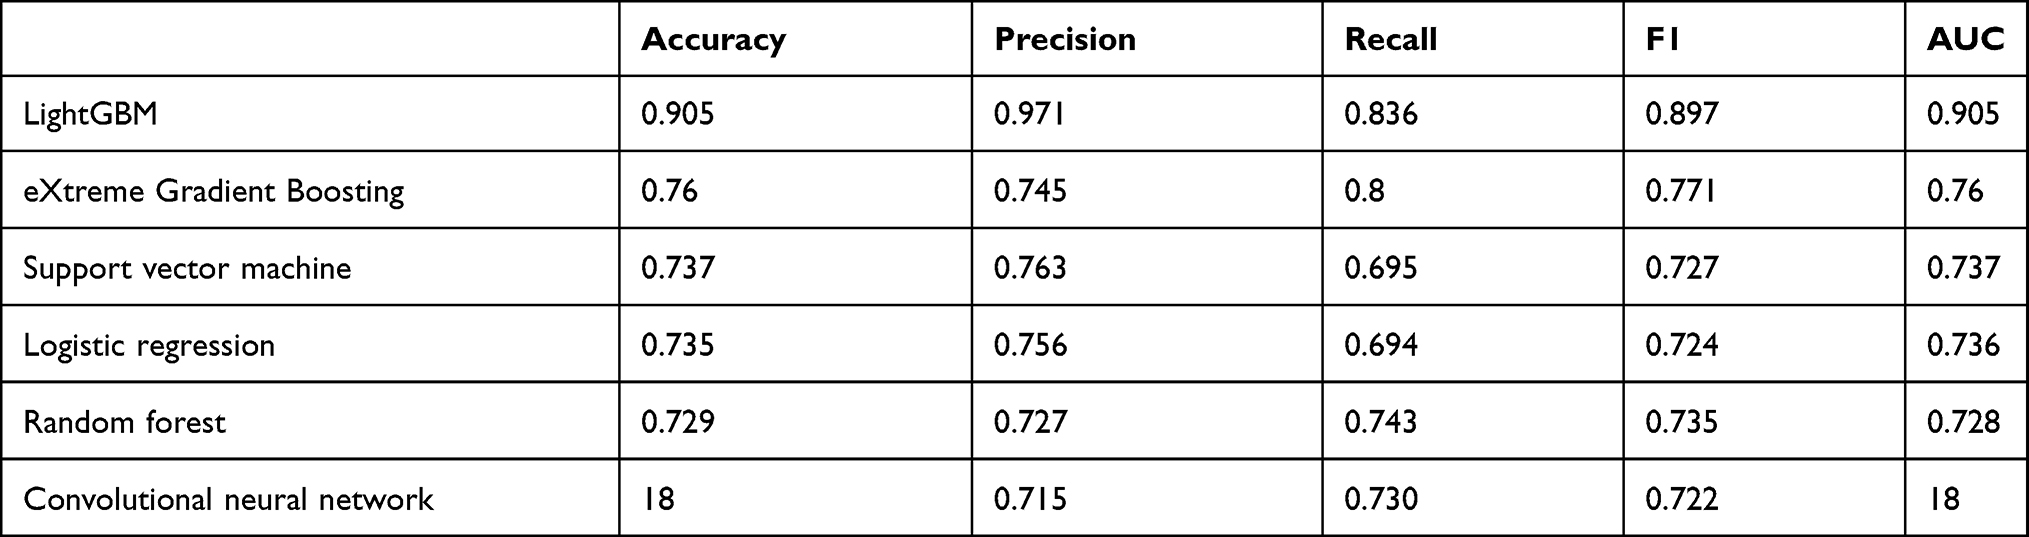 |
Table 4 Predictive Models Results |
Discussion
Data and Predictors
Few studies have compared AKI-prediction models in the ICU setting. Table 5 shows the studies done on AKI prediction in the ICU and the methods used by other scholars. The comparison results are not consistent, which may have resulted from differences in the patient cohort, the predictors adopted, data type/size, outcome definitions or other factors. Even if there are similarities in prediction objectives, databases and inclusion criteria, the comparison results will be different due to different methods of language processing and choice of predictor variables. For example, Yikuan et al found LR to have a slightly better AUC than SVM with L1-regularization when using clinical notes.25 Sun et al,22 who used structured data and clinical notes, concluded that SVM with L1-regularization gave the best AUC among LR, RF, NB and CNN methods. To avoid these external influences, we selected only structured data and the predictors known to be more effective in predicting AKI that appeared in more than two studies previously.
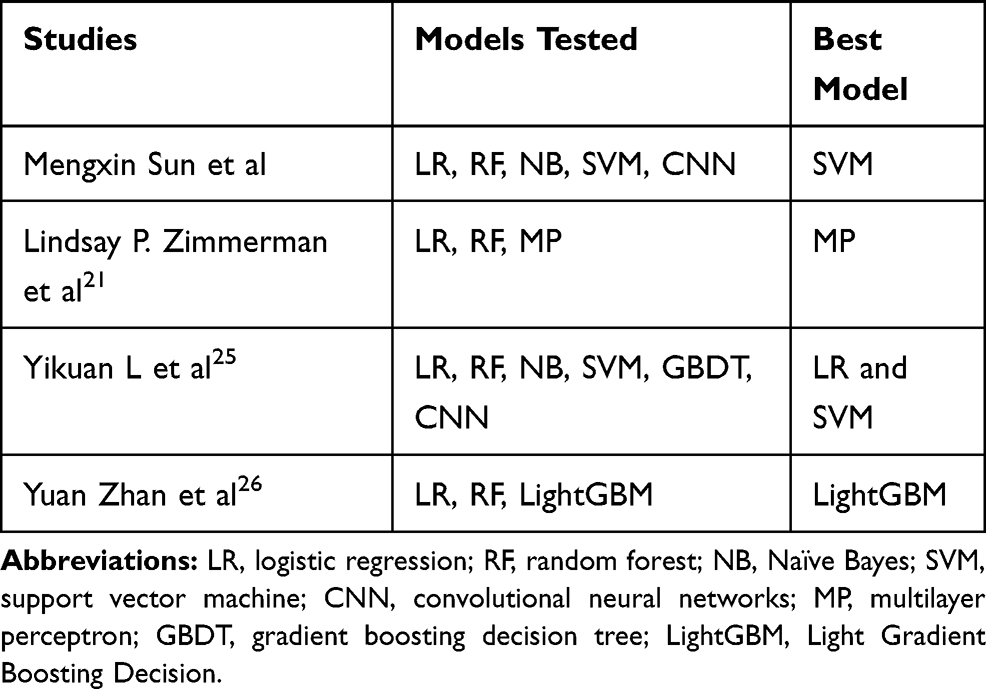 |
Table 5 Studies on Predicting Acute Kidney Injury in ICU |
Performance of Models
The predictive ability was compared among the traditional regression model LR, 4 ML models (RF, SVM, LightGBM, XGBoost) and a DL model CNN for predicting whether patients developed AKI after entering the ICU for 24 h.
Despite the lopsided dataset, LightGBM showed the best performance: (i) among the models tested; (ii) using datasets with evenly distributed samples. The results were consistent with previous studies in different practical scenarios.
Lee and colleagues reported that the gradient-boosting model had a superior performance for AKI prediction after cardiac surgery and liver transplantation.11,16 Yuan and collaborators demonstrated that LightGBM worked better in AKI prediction in the ICU setting than the traditional LR and ML models.26 A higher value for recall means that a model may perform well upon early warning of AKI because as many patients as possible at risk of AKI can be identified. New studies should focus on LightGBM when conducting AKI-prediction studies on ICU populations.
In accordance with other comparative studies,22,24 the CNN model did not show obvious superiority over other non-DL methods in the present study. One reason may be that our dataset was not complicate or large to fully represent the advantage of the CNN model. Another reason may be that the predictor variables were selected artificially in advance instead of by self-learning, which is an advantage of DL methods compared with traditional ML methods.
Importance of Features
After calculation, we ranked the importance of the features of LR, RF, SVM, LightGBM and XGBoost on the prediction result. The indicator that contributed most to AKI prediction in LR, SVM, RF and LightGBM models was the maximum level of SCr, whereas in XGBoost, it was age. Each time we ran the models, they elicited different results of the most important feature, so each model was run ten times to ascertain the top-10 features.
The 10 most influential features of each model were given a weight from 1 to 10. Then, the average weight of each feature was calculated for each model. The heatmap of features with average weight >1.5 is listed in Figure 3 and sorted by average weight. The SCr level was considered to be most influential feature among all other physiological measurements, which is in accordance with KDIGO recommendations stating that the SCr level one of the most important indicators of AKI. However, this heatmap does not necessarily mean that using the top 10 features for dimension reduction will help improve any individual model. Our study objective was to identify high-risk predictors that could be used to predict new AKI early upon ICU admission and compare the sensitivity of different models to various predictors. Our results provide a reference for the selection of predictors in the context of extremely sparse clinical data. Unfortunately, the CNN method was excluded in Figure 3 because the python library did not provide a relevant API.
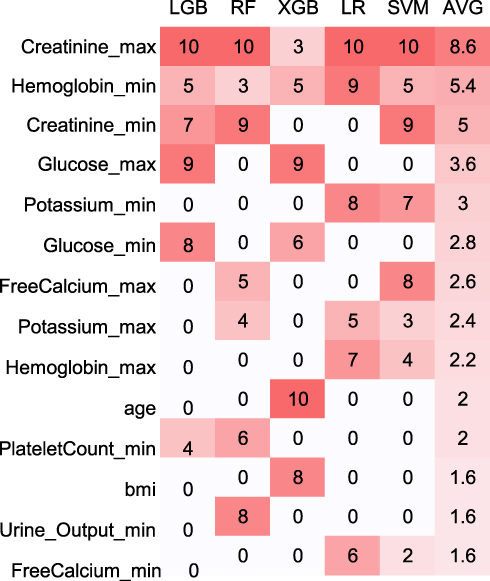 |
Figure 3 The importance of each feature in each model. Abbreviations: LGB, Light Gradient Boosting Decision; RF, random forest; XGB, eXtreme Gradient Boosting; LR, logistic regression; SVM, supported vector machine; AVG, average. |
Limitations and Further Study
Our study had four main limitations. First, the inclusion criteria were stringent in that patients with any disease or symptom associated with the kidneys were excluded. Hence, the data included in our analyses were of a limited size but of higher purity and without missing values. This scenario hampered verification of the difference in the ability to process noise data among the six methods, as well as universality and robustness. Therefore, relaxation criteria will be performed in future studies. Second, we focused on predicting AKI at a fixed time point using the data collected in a fixed time window (ie the first 24 h of ICU stay). In future studies, earlier prediction of AKI risk will be compared in a shorter time after ICU admission by developing predictive models using the data from the first 6, 12, or 18 h after ICU admission. In addition, more dynamic prediction if AKI can be practiced in future work. For example, by using patient data from a certain day (not limited to the first day of ICU admission) to predict AKI risk for the next 2 days. Third, the population in our study was adult patients admitted to the ICU. Further division of a population based on age was not taken into account. However, we found that age played an important part in prediction of AKI risk, and older people were more likely to develop AKI. In future studies, we will divide patients into different subgroups according to age. Fourth, handling of missing data enabled maximum use of the data we have collected. The norm.predict method from MICE was applied to fill missing values using the observed values of each column, but this does not mean that the filled values were the best replacements. Clinical practice violates this assumption because clinician commission tests with some expectation about the likely result. Nonetheless, Zimmerman and colleagues showed that an imputation bias due to a not-missing-at-random value may have only a minimal impact on outcome prediction.21 In future study, more methods for handling missing values should be tested.
Conclusions
We compared the performances of six models for AKI prediction in the first 72 h after ICU admission. LightGBM showed the best predictive capability, with all of its evaluation indicators being significantly higher than those of other methods. LightGBM and XGBoost showed great potential for clinical application owing to their promising recall value, which indicates that patients carrying a higher risk of developing AKI are more likely to be identified so that ICU caregivers can pay more attention to them. Our study could provide references for an ML-based clinical decision support system to aid early prediction of AKI in the ICU setting.
Abbreviations
ICU, intensive care unit; AKI, acute kidney injury; MIMIC, Medical information mart for intensive care; KDIGO, Kidney Disease Improving Global Outcomes; LR, logistic regression; SVM, support vector machines; RF, random forest; XGBoost, eXtreme Gradient Boosting; XGB, eXtreme Gradient Boosting; LightGBM, Light Gradient Boosting Decision; LGB, Light Gradient Boosting Decision; RNN, recurrent neural network; ROC, receiver operating characteristic curve; AUC, area under the curve of ROC; HER, electrical health record; SCr, serum creatinine; CNN, convolutional neural network; DL, deep learning; GBDT, gradient boosting decision tree; NLP, natural language processing; CKD, chronic kidney disease; AVG, average; BMI, body mass index; NGAL, neutrophil gelatinase-associated lipocalin.
Acknowledgments
The authors thank Dr Jiao Li (Chinese Academy of Medical Sciences & Peking Union Medical College) for helpful comments on the manuscript.
Funding
This work was supported by the National Key Research & Development Plan of China (Grant No 2016YFC0901602) and the Chinese Academy of Medical Sciences (Grant No 2018PT33024, 2018-I2M-AI-016).
Disclosure
The authors report no conflicts of interest in this work.
References
1. Barrantes F, Tian J, Vazquez R, Amoateng-Adjepong Y, Manthous CA. Acute kidney injury criteria predict outcomes of critically ill patients. Crit Care Med. 2008;36(5):1397–1403. doi:10.1097/CCM.0b013e318168fbe0
2. Ali T, Khan I, Simpson W, et al. Incidence and outcomes in acute kidney injury: a comprehensive population-based study. J Am Soc Nephrol. 2007;18(4):1292–1298. doi:10.1681/ASN.2006070756
3. Thakar CV, Christianson A, Freyberg R, Almenoff P, Render ML. Incidence and outcomes of acute kidney injury in intensive care units: a veterans administration study. Crit Care Med. 2009;37(9):2552–2558. doi:10.1097/CCM.0b013e3181a5906f
4. Sutherland SM, Chawla LS, Kane-Gill SL, et al. Utilizing electronic health records to predict acute kidney injury risk and outcomes: workgroup statements from the 15(th) ADQI consensus conference. Can J Kidney Health Dis. 2016;3:11. doi:10.1186/s40697-016-0099-4
5. Yang L, Xing G, Wang L, et al. Acute kidney injury in China: a cross-sectional survey. Lancet. 2015;386(10002):1465–1471. doi:10.1016/S0140-6736(15)00344-X
6. Horkan CM, Purtle SW, Mendu ML, Moromizato T, Gibbons FK, Christopher KB. The association of acute kidney injury in the critically ill and postdischarge outcomes: a cohort study*. Crit Care Med. 2015;43(2):354–364. doi:10.1097/CCM.0000000000000706
7. Khwaja A. KDIGO clinical practice guidelines for acute kidney injury. Nephron Clin Pract. 2012;120(4):c179–184. doi:10.1159/000339789
8. Flechet M, Güiza F, Schetz M, et al. AKIpredictor, an online prognostic calculator for acute kidney injury in adult critically ill patients: development, validation and comparison to serum neutrophil gelatinase-associated lipocalin. Intensive Care Med. 2017;43(6):764–773. doi:10.1007/s00134-017-4678-3
9. Hemingway H, Croft P, Perel P, et al. Prognosis research strategy (PROGRESS) 1: a framework for researching clinical outcomes. BMJ. 2013;346.
10. Kiers HD, van den Boogaard M, Schoenmakers MC, et al. Comparison and clinical suitability of eight prediction models for cardiac surgery-related acute kidney injury. Nephrol Dial Transplant. 2013;28(2):345–351. doi:10.1093/ndt/gfs518
11. Lee HC, Yoon HK, Nam K, et al. Derivation and validation of machine learning approaches to predict acute kidney injury after cardiac surgery. J Clin Med. 18;7(10):322. doi:10.3390/jcm7100322
12. Callejas R, Panadero A, Vives M, Duque P, Echarri G, Monedero P. Preoperative predictive model for acute kidney injury after elective cardiac surgery: a prospective multicenter cohort study. Minerva Anestesiol. 2019;85(1):34–44. doi:10.23736/S0375-9393.18.12257-7
13. Huen SC, Parikh CR. Predicting acute kidney injury after cardiac surgery: a systematic review. Ann Thorac Surg. 2012;93(1):337–347. doi:10.1016/j.athoracsur.2011.09.010
14. Mizota T, Yamamoto Y, Hamada M, Matsukawa S, Shimizu S, Kai S. Intraoperative oliguria predicts acute kidney injury after major abdominal surgery. Br J Anaesth. 2017;119(6):1127–1134. doi:10.1093/bja/aex255
15. Wilson T, Quan S, Cheema K, et al. Risk prediction models for acute kidney injury following major noncardiac surgery: systematic review. Nephrol Dial Transplant. 2016;31(2):231–240. doi:10.1093/ndt/gfv415
16. Caragata R, Wyssusek KH, Kruger P. Acute kidney injury following liver transplantation: a systematic review of published predictive models. Anaesth Intensive Care. 2016;44(2):251–261. doi:10.1177/0310057X1604400212
17. Lin KY, Zheng WP, Bei WJ, et al. A novel risk score model for prediction of contrast-induced nephropathy after emergent percutaneous coronary intervention. Int J Cardiol. 2017;230:402–412. doi:10.1016/j.ijcard.2016.12.095
18. Yin WJ, Yi YH, Guan XF, et al. Preprocedural prediction model for contrast-induced nephropathy patients. J Am Heart Assoc. 2017;6(2):e004498. doi:10.1161/JAHA.116.004498
19. Silver SA, Shah PM, Chertow GM, Harel S, Wald R, Harel Z. Risk prediction models for contrast induced nephropathy: systematic review. BMJ. 2015;351:h4395. doi:10.1136/bmj.h4395
20. Sanchez-Pinto LN, Khemani RG. Development of a prediction model of early acute kidney injury in critically ill children using electronic health record data. Pediatr Crit Care Med. 2016;17(6):508–515. doi:10.1097/PCC.0000000000000750
21. Zimmerman LP, Reyfman PA, Smith ADR, et al. Early prediction of acute kidney injury following ICU admission using a multivariate panel of physiological measurements. BMC Med Inform Decis Mak. 2019;19(Suppl 1):16. doi:10.1186/s12911-019-0733-z
22. McKown AC, Wang L, Wanderer JP, et al. Predicting major adverse kidney events among critically ill adults using the electronic health record. J Med Syst. 2017;41(10):156. doi:10.1007/s10916-017-0806-4
23. Sun M, Baron J, Dighe A, et al. Early prediction of acute kidney injury in critical care setting using clinical notes and structured multivariate physiological measurements. Stud Health Technol Inform. 2019;264:368–372. doi:10.3233/SHTI190245
24. Malhotra R, Kashani KB, Macedo E, et al. A risk prediction score for acute kidney injury in the intensive care unit. Nephrol Dial Transplant. 2017;32(5):814–822. doi:10.1093/ndt/gfx026
25. Li Y. Early prediction of acute kidney injury in critical care setting using clinical notes.
26. Yuan Z, Feng C. LightGBM model for predicting acute kidney injury risk in ICU patients. Acad J Chinese PLA Med Sch. 2019;40(4):316–320.
27. Mohamadlou H, Lynn-Palevsky A, Barton C, et al. Prediction of acute kidney injury with a machine learning algorithm using electronic health record data. Can J Kidney Health Dis. 18;5:2054358118776326. doi:10.1177/2054358118776326
28. Tomašev N, Glorot X, Rae JW, et al. A clinically applicable approach to continuous prediction of future acute kidney injury. Nature. 2019;572(7767):116–119. doi:10.1038/s41586-019-1390-1
29. Parreco J, Soe-Lin H, Parks JJ, et al. Comparing machine learning algorithms for predicting acute kidney injury. Am Surg. 2019;85(7):25–729. doi:10.1177/000313481908500731
30. Kellum JA, Sileanu FE, Murugan R, Lucko N, Shaw AD, Clermont G. Classifying AKI by urine output versus serum creatinine level. J Am Soc Nephrol. 2015;26(9):2231–2238. doi:10.1681/ASN.2014070724
31. Thottakkara P, Ozrazgat-Baslanti T, Hupf BB, et al. Application of machine learning techniques to high-dimensional clinical data to forecast postoperative complications. PLoS One. 2016;11(5):e0155705. doi:10.1371/journal.pone.0155705
32. He J, Hu Y, Zhang X, Wu L, Waitman LR, Liu M. Multi-perspective predictive modeling for acute kidney injury in general hospital populations using electronic medical records. JAMIA Open. 2019;2(1):115–122. doi:10.1093/jamiaopen/ooy043
33. Johnson AE, Pollard TJ, Shen L, et al. MIMIC-III, a freely accessible critical care database. Sci Data. 2016;3(1):160035. doi:10.1038/sdata.2016.35
34. Goldberger AL, Amaral LA, Glass L, et al. PhysioBank, PhysioToolkit, and PhysioNet: components of a new research resource for complex physiologic signals. Circulation. 2000;101(23):E215–220. doi:10.1161/01.CIR.101.23.e215
35. Johnson APT, Mark R. MIMIC-III clinical database (version 1.4). Available from: https://physionet.org/content/mimiciii/1.4/.
36. Neamatullah I, Douglass MM, Lehman LW, et al. Automated de-identification of free-text medical records. BMC Med Inform Decis Mak. 2008;8(1):32. doi:10.1186/1472-6947-8-32
37. Bellomo R, Ronco C, Kellum JA, Mehta RL, Palevsky P. Acute renal failure - definition, outcome measures, animal models, fluid therapy and information technology needs: the second international consensus conference of the acute dialysis quality initiative (ADQI) group. Crit Care. 2004;8(4):R204–212. doi:10.1186/cc2872
38. Levey AS, Bosch JP, Lewis JB, Greene T, Rogers N, Roth D. A more accurate method to estimate glomerular filtration rate from serum creatinine: a new prediction equation. modification of diet in renal disease study group. Ann Intern Med. 1999;130(6):461–470. doi:10.7326/0003-4819-130-6-199903160-00002
39. Druml W, Metnitz B, Schaden E, Bauer P, Metnitz PG. Impact of body mass on incidence and prognosis of acute kidney injury requiring renal replacement therapy. Intensive Care Med. 2010;36(7):1221–1228. doi:10.1007/s00134-010-1844-2
40. MacLaughlin HL, Blacklock RM, Wright K, et al. Obesity and recovery from acute kidney injury (Ob AKI): a prospective cohort feasibility study. BMJ Open. 2019;9(3):e024033. doi:10.1136/bmjopen-2018-024033
41. Buuren S, Groothuis-Oudshoorn C. MICE: multivariate imputation by chained equations in R. J Stat Softw. 2011;45(3):1–67. doi:10.18637/jss.v045.i03
42. Siew ED, Davenport A. The growth of acute kidney injury: a rising tide or just closer attention to detail? Kidney Int. 2015;87(1):46–61. doi:10.1038/ki.2014.293
43. Sperandei S. Understanding logistic regression analysis. Biochem Med (Zagreb). 2014;24(1):12–18. doi:10.11613/BM.2014.003
44. Noble WS. Support vector machine applications in computational biology. In: Schoelkopf B, Tsuda K, Vert JP, editors. Kernel Methods in Computational Biology. Vol. 14. MIT Press; 2004:71–92.
45. Breiman L. Random forests. Mach Learn. 2001;45(1):5–32. doi:10.1023/A:1010933404324
46. Zhang J, Mucs D, Norinder U, Svensson F. LightGBM: an effective and scalable algorithm for prediction of chemical toxicity-application to the tox21 and mutagenicity data sets. J Chem Inf Model. 2019;59(10):4150–4158. doi:10.1021/acs.jcim.9b00633
47. Chen T, Guestrin C. XGBoost: a scalable tree boosting system. ArXiv Eprints. 2016;arXiv:
48. Hinton G. R. R. reducing the dimensionality of data with neural networks. Science. 2006;313(5786):504–507. doi:10.1126/science.1127647
49. Bradley A. The use of the area under the ROC curve in the evaluation of machine learning algorithms. Pattern Recognit. 1996;30(7):1145–1159. doi:10.1016/S0031-3203(96)00142-2
 © 2021 The Author(s). This work is published and licensed by Dove Medical Press Limited. The
full terms of this license are available at https://www.dovepress.com/terms
and incorporate the Creative Commons Attribution
- Non Commercial (unported, 3.0) License.
By accessing the work you hereby accept the Terms. Non-commercial uses of the work are permitted
without any further permission from Dove Medical Press Limited, provided the work is properly
attributed. For permission for commercial use of this work, please see paragraphs 4.2 and 5 of our Terms.
© 2021 The Author(s). This work is published and licensed by Dove Medical Press Limited. The
full terms of this license are available at https://www.dovepress.com/terms
and incorporate the Creative Commons Attribution
- Non Commercial (unported, 3.0) License.
By accessing the work you hereby accept the Terms. Non-commercial uses of the work are permitted
without any further permission from Dove Medical Press Limited, provided the work is properly
attributed. For permission for commercial use of this work, please see paragraphs 4.2 and 5 of our Terms.