Back to Journals » Advances in Medical Education and Practice » Volume 8
Predicting United States Medical Licensure Examination Step 2 clinical knowledge scores from previous academic indicators
Authors Monteiro KA, George P, Dollase R, Dumenco L
Received 1 April 2017
Accepted for publication 19 May 2017
Published 19 June 2017 Volume 2017:8 Pages 385—391
DOI https://doi.org/10.2147/AMEP.S138557
Checked for plagiarism Yes
Review by Single anonymous peer review
Peer reviewer comments 2
Editor who approved publication: Dr Md Anwarul Azim Majumder
Kristina A Monteiro, Paul George, Richard Dollase, Luba Dumenco
Office of Medical Education, The Warren Alpert Medical School of Brown University, Providence, RI, USA
Abstract: The use of multiple academic indicators to identify students at risk of experiencing difficulty completing licensure requirements provides an opportunity to increase support services prior to high-stakes licensure examinations, including the United States Medical Licensure Examination (USMLE) Step 2 clinical knowledge (CK). Step 2 CK is becoming increasingly important in decision-making by residency directors because of increasing undergraduate medical enrollment and limited available residency vacancies. We created and validated a regression equation to predict students’ Step 2 CK scores from previous academic indicators to identify students at risk, with sufficient time to intervene with additional support services as necessary. Data from three cohorts of students (N=218) with preclinical mean course exam score, National Board of Medical Examination subject examinations, and USMLE Step 1 and Step 2 CK between 2011 and 2013 were used in analyses. The authors created models capable of predicting Step 2 CK scores from academic indicators to identify at-risk students. In model 1, preclinical mean course exam score and Step 1 score accounted for 56% of the variance in Step 2 CK score. The second series of models included mean preclinical course exam score, Step 1 score, and scores on three NBME subject exams, and accounted for 67%–69% of the variance in Step 2 CK score. The authors validated the findings on the most recent cohort of graduating students (N=89) and predicted Step 2 CK score within a mean of four points (SD=8). The authors suggest using the first model as a needs assessment to gauge the level of future support required after completion of preclinical course requirements, and rescreening after three of six clerkships to identify students who might benefit from additional support before taking USMLE Step 2 CK.
Keywords: assessment, at-risk students, licensure exam, medical education, Step 2 CK, USMLE
Introduction
The ability to identify students at risk of experiencing difficulty completing curricular requirements is a crucial piece of educational assessment and evaluation. To practice medicine in the USA, students are required to pass the United States Medical Licensure Examination (USMLE), which is divided into “Steps” completed throughout undergraduate medical and postgraduate medical training. Step 1, evaluating basic science knowledge, is typically completed after the second year of preclinical coursework, while the Step 2 clinical knowledge (CK) and Step 2 clinical skills (CS) exams are traditionally completed following the third year of clerkship rotations. We aimed to identify an equation to predict students’ Step 2 CK scores from prior academic achievement indicators in order to identify students who would benefit from additional support services, such as tutoring and additional study time, in an effort to increase the number of students passing the exam.
Data from the National Resident Matching Program (NRMP) from the 2015 match indicated that the ratio of postgraduate year 1 (PGY-1) positions per active senior in the USA was 1.51.1 This figure does not include medical students who are considered independent applicants. When taking into account total applicants for PGY-1 vacancies, this figure reduces to 0.78 positions per applicant.1 Moreover, the number of graduate medical education program residency vacancies has remained stable over time, despite an 18% growth in medical school enrollment as a response to the Association of American Colleges recommendations to increase enrollments.2 Given these findings, it appears that the number of residency vacancies in the USA is inadequate in the face of increasing enrollment numbers in US medical schools and international applicants. The high number of applicants for these residency positions increases the need for programs to consider as much information as possible for assessing candidates. This has notably increased the importance of the Step 2 CK score in the residency selection process.
A national survey of residency program directors to identify importance of academic criteria in residency applicant selection in 2006 revealed that performance on the USMLE Step 2 CK ranks fifth among other academic selection criteria, behind grades in required clerkships and USMLE Step 1 score, but more important than USMLE Step 2 CS and grades in preclinical courses.3 Data from the NRMP in 2014 revealed that the mean Step 2 CK score for matched US applicants was 243, while the unmatched mean was 231.4 Taken together, these reports provide evidence that a passing score on Step 2 CK is essential to students being matched in their preferred field.
While there are multiple studies identifying correlates and predictors of Step 1 score and fewer predicting Step 2 score, there has not been substantive study on the predictive power of NBME subject exams in conjunction with other academic indicators to predict Step 2 CK score.5,6 A study from 1999 provided evidence of the predictive power of Step 1 score and one discipline-specific NBME exam to predict Step 2 CK score.6 We sought to extend these findings by combining multiple disciplines (i.e., multiple NBME subject exams) to increase predictive power in order to screen our students as they progressed through their third year. In sum, we sought to build a model with a prediction equation using data from multiple clerkships, rather than use a prior approach of producing a discipline-specific equation to screen students in individual clerkship rotations.6 This allows us to use the same equation for our entire medical student class. We also aimed to use additional scores (i.e., data points) to increase the reliability of our model and to validate our model, which is novel to this area of the field.
Finally, results from a study of 20 medical schools has provided promise that the level of “clinical science achievement” has the ability to predict Step 2 CK score.7 However, the level of clinical science achievement for each student was rated as unacceptable, marginal, acceptable, or excellent based on guidelines and standards unique to each individual school, resulting in a lack of consistency across sites.7 We add to the literature by using NBME subject exam scores as a continuous objective measure of clinical science achievement, specifically in regard to medical knowledge and application of medical knowledge, which can be generalized across schools. Moreover, these scores were used in conjunction with other variables, such as preclinical mean course exam score and Step 1 score. This method aims to increase reliability by using standardized, continuous measures of clinical science achievement and includes variables that other studies have not included (i.e., mean preclinical course exam scores) in the prediction of Step 2 CK score. We then sought to validate our findings by building a regression equation that could be tested on our most recent graduating cohort of students to determine its accuracy and precision in predicting Step 2 CK scores.
Method
We used a local database containing student data from students who graduated from the Warren Alpert Medical School of Brown University (AMS) between the years of 2010 and 2013 and for whom we were able to have complete data on the variables used in analyses. De-identified student data were entered into a secure database and analyzed with the Statistical Package for Social Sciences (SPSS v. 22.0, Armonk, NY: IBV Corp.). We used data from students (N=218) with complete data on all of the variables used in analyses. The Brown University Institutional Review Board exempted this study from review as it did not meet the threshold to be considered human subjects research because of the de-identification of student data and that this evaluation was primarily for program evaluation purposes.
At AMS we have an integrated, patient-centered competency-based curriculum. Basic scientific concepts are taught with an emphasis on clinical relevance during the first 2 years of medical school (a 17-month “preclinical” curriculum). Our students are assessed with locally designed preclinical examinations during years 1 and 2. These exams (with actual scores ranging from 0% to 100%) are designed by our course leaders and utilize single-best answer multiple-choice board-format questions. For analyses, we used the mean of all final course examination grades administered in years 1 and 2.
In year 3 of medical school, our students participate in a traditional core clerkship model consisting of six block rotations, including internal medicine, family medicine, pediatrics, obstetrics and gynecology, surgery, and psychiatry, with a duration ranging from 4 to 12 weeks. On the final day of each core clerkship rotation, students complete the National Board of Medical Examiners (NBME) subject exams (i.e., “shelf”) that target basic knowledge of clinical content in each respective clerkship rotation. Raw student scores are reported directly to AMS via the NBME. Finally, our students complete the USMLE Step 1 and 2 Exams and scores are reported directly to AMS via the NBME. For Step 1 and Step 2 CK student scores, we limited our data to first-time test takers.
The variables we included in forming the regression equations included mean preclinical final course examination scores (each consisting of an average of locally designed exams from years 1 and 2), USMLE Step 1 scores (provided by the NBME), and NBME subject examination scores for internal medicine, pediatrics, obstetrics and gynecology, and surgery. We used the total Step 2 CK score that is reported to students, rather than individual breakdowns by content (i.e., internal medicine score, pediatrics score) because the goal of our model was to predict Step 2 CK total score. Students at AMS do not complete the NBME subject examination for family medicine; thus, this clerkship was excluded from our analysis. We included psychiatry in preliminary analyses to test the effect of all five available subject exams, but ultimately decided to remove this score from analyses, as our students now participate in an integrated neurology-psychiatry clerkship, limiting the usefulness of data from the previous cohorts. USMLE Step 2 CK scores provided by the NBME were also included in the final database analyses.
Our goal was to create a regression equation by which we could predict a student’s Step 2 CK score from previous academic indicators. To start, we assessed correlations between the academic indicators and Step 2 CK performance. This ensured that only predictors with a statistically significant association with Step 2 CK performance would be included in the regression models. We conducted correlation analyses between mean preclinical course exam score, USMLE Step 1 score, a combination of any three NBME subject examination scores, and a combination of four NBME subject examination scores with USMLE Step 2 CK score. From there, we considered at what time during the student’s academic career the information would become available (e.g., at the end of second year, midway through third year, and so on) in order to weigh the benefits and challenges of proposed timing of educational intervention(s) for high-risk students. After assessing the significant associations and considering the time at which the predictor would become available, we entered the variables that would become available prior to the middle of third year into a regression model. This method enabled us to analyze the effect the predictors had in combination with one another in the ability to predict Step 2 CK score and to form an equation to project student scores. The resulting models allow us to calculate a predicted Step 2 CK score for each student based on these academic indicators.
Results
Correlations among predictors and Step 2 CK
Descriptive statistics for all predictors and Step 2 CK score for the model-building sample can be found in Table 1. Results from the correlation analyses showed statistically significant correlations between all predictors and Step 2 CK score. Including four subject examinations in an average subject exam score was also statistically significant and highly correlated with Step 2 CK performance (r=0.82, p<0.001). Including an average of three of the five subject exam scores was correlated with Step 2 CK performance (r=0.80–0.81, p<0.001) regardless of which of the three examinations were completed. See Table 2 for correlations representing each combination of subject exam scores. Step 1 score was statistically significant and strongly correlated with Step 2 CK score (r=0.74, p<0.001). Consistent with our previous curriculum findings, mean preclinical course exam scores from years 1 and 2 were significantly correlated with Step 2 CK scores (r=0.54, p<0.001). These findings are summarized in Table 2.
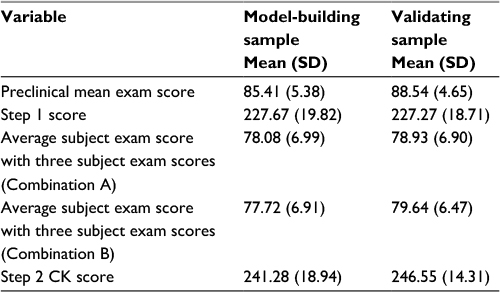 | Table 1 Descriptive statistics; this table provides the descriptive statistics for the predictors and Step 2 CK score for the model-building sample and the validating sample. Abbreviation: CK, clinical knowledge. |
 | Table 2 Step 2 CK and predictor correlations; this table provides the correlations between the predictors and Step 2 CK score and the point in the academic career when the data become available Notes: ***p<0.001. For average subject exam scores, Combination A consisted of 1) internal medicine, 2) surgery, and 3) pediatrics subject exam scores, while Combination B consisted of 1) internal medicine, 2) surgery, and 3) obstetrics and gynecology subject exam scores. Abbreviation: CK, clinical knowledge. |
Model building
The first regression (Table 3) consisted of a model that could be used as early identification for students at the end of year 2, after completion and receipt of Step 1 score. This model assists medical faculty, staff, and academic advisors to anticipate the resources needed within the next academic year. The combination of mean preclinical course exam score from years 1 and 2 and Step 1 score contributed to a statistically significant model and together predicted 56% of the variance in Step 2 CK score (R2=0.56, F (3, 216)=136.82, p<0.001). Each of the predictors was individually statistically significant, with mean preclinical course exam score demonstrating a small effect size (B=0.17, t=3.11, p=0.002) and Step 1 score demonstrating a large effect size (B=0.64, t=11.52, p<0.001).
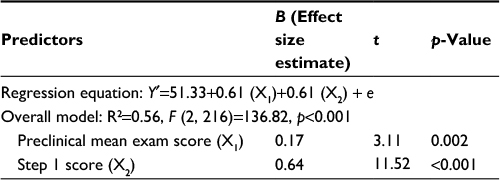 | Table 3 Regression results prior to year 3; this regression table provides an equation that can be used to anticipate resources necessary in the upcoming academic year |
Additional models utilized student data obtained following three clerkship rotations at the time when students have completed approximately half of their clerkship rotations. Mean preclinical course exam scores from years 1 and 2, Step 1 score, and three subject examinations were entered into two regression models. The first regression model (Combination A) contained one combination of subject examinations, while the second model (Combination B) contained a separate combination of subject examinations to control for the order of clerkship rotations. Both of the regression models produced statistically significant results and predicted between 67% and 69% of the variance in Step 2 CK score. Specifically, Combination A explained ~67% of the variance in Step 2 CK score (R2=0.67, F (3, 215)=144.92, p<0.001). Both Step 1 score (B=0.27, t=4.27, p<0.001) and subject examinations (B=0.54, t=8.46, p<0.001) were significant predictors of Step 2 CK score. Similarly, Combination B explained ~69% of the variance in Step 2 CK score (R2=0.69, F (3, 215)=169.50, p<0.001) and again both Step 1 score (B=0.28, t=4.79, p<0.001) and subject examinations (B=0.56, t=9.74, p<0.001) were significant predictors of Step 2 CK score. Mean preclinical course exam score did not remain a statistically significant predictor of Step 2 CK score in Combination A or Combination B. Although there are additional combinations of clerkship sequences, we aim to screen students after three of the clerkships; therefore, we did not feel it necessary to statistically test additional sequences because most of our students will have completed these shelf exams at the point of screening. For a summary of regression results and equations, see Table 4.
 | Table 4 Regression results after completion of three clerkships subject exams; this table provides the regression results for two combinations of any three subject exam scores Notes: Both the models significantly predicted over half of the amount of variance within Step 2 CK score. We conclude that completion of any three clerkships is an appropriate opportunity to screen students for Step 2 CK score. Combination A consisted of 1) internal medicine, 2) surgery, and 3) pediatrics subject exam scores. Combination B consisted of 1) internal medicine, 2) surgery, and 3) obstetrics and gynecology subject exam scores. |
Model validation
To validate our findings, we used the Combination A model to predict Step 2 CK scores for a separate cohort of students that graduated from AMS in May of 2015 and had complete mean preclinical course exam scores, NBME subject examination scores, Step 1 scores, and Step 2 CK scores (N=89). This provided an opportunity to evaluate the accuracy and precision of our model on our most recent cohort of students. Descriptive statistics for all predictors and Step 2 CK score for the validation sample can be found in Table 1. We measured the deviation between predicted Step 2 CK score using our model and observed Step 2 CK scores by number of points. Results revealed that our model was able to predict Step 2 CK scores within a mean of 4 points and that our model had a standard deviation of 8 points. In addition, the standard error of the estimate was equal to 10.10. The smaller the standard error of the estimate, the more accurate the predicted score. As an example, for students whose predicted score is near passing (e.g., 200), we can predict that the student will likely score somewhere between 192 and 208 on the actual Step 2 CK exam, given that our model is predictive for about 68% of students. Students within a range such as this may benefit from additional support in the form of tutoring or additional study time. Moreover, our model underpredicted Step 2 CK scores. The Step 2 CK exam ranges from 1 to 300 points, and in 2013–2014 had a mean of 240 points and a standard deviation of 19 points. As of March 2016, the website for the USMLE states that the passing rate for Step 2 CK is 209 points.8 Given these psychometric characteristics, the ability to predict student scores within an average of 4 points and a standard deviation of 8 points demonstrates precision and accuracy. See Figure 1.
 | Figure 1 Step 2 CK predicted and actual scores. Notes: This graph demonstrates validation of our model by comparing predicted Step 2 CK scores from our model and the actual Step 2 CK scores with the corresponding regression line. The model was able to predict Step 2 CK score within a mean of 4 points and a standard deviation of 8 points. Abbreviation: CK, clinical knowledge. |
Discussion
We used existing academic indicators to create a regression model that has the ability to predict a student’s Step 2 CK score given a mean preclinical course exam score, USMLE Step 1 score, and NBME subject examinations on three of the six clerkship rotations. When building models, we wanted to take into account the correlation strength between the predictor and Step 2 CK score, but also when the data would become available in the medical student’s academic career. Students accumulate additional subject examinations scores as they continue progressing through the clerkships, which have been shown to individually correlate with Step 2 CK score (Table 2). Thus, we considered the amount of variance accounted for after completion of three of the six clerkships to be sufficient in screening our students.
Early identification would allow ample time for students to receive support services before taking the Step 2 CK exam and may allow unimpeded progress in medical school. This model can be used to identify students in need of support services before finishing third year, with sufficient time to complete extra tutoring and practice. Models that require academic indicators acquired beyond three clerkships increase the accuracy of predicting Step 2 CK score by accounting for additional variance, but become available too late during the academic career to take full advantage of support services. We also provide an additional regression model that can, to a lesser extent, predict a student’s Step 2 CK score given mean preclinical course exam score and USMLE Step 1 score.
Internal evaluations indicate that student performance on integrated preclinical examinations in the years 1 and 2 is highly predictive of student performance on Step 1 of the USMLE. This is confirmed by research that demonstrates that basic science exam performance in undergraduate medical education (UME) has the ability to predict scores on USMLE Steps 1 and 2.9,10 Evidence also indicates that scores on the Medical College Admission Test (MCAT) account for a significant amount of variance in USLME Steps 1, 2, and 3 scores.11 Other preadmission factors that predict Step 1 score include undergraduate grade point average (GPA), though the MCAT has been shown to have greater predictive power on Step 1 score than GPA.12
The combination of variables that we selected are particularly important for our student population, as many of our students enter AMS through the Program in Liberal Medical Education (PLME) admission route and do not report undergraduate GPA or complete the MCAT, limiting the preadmission variables we are able to use for prediction.13 While preadmission variables such as these have the ability to predict Step 2 CK score, many of our students have incomplete data in these areas, opening up opportunities to investigate relationships among variables that are obtained throughout the student’s preclinical medical education career. The Pearson correlation coefficient between portions of the MCAT, a preadmission variable, and Step 2 scores reported by a previous study ranged from 0.24 to 0.33, yielding small to medium levels of association.14,15 Our equation using multiple academic indicators explains a higher percentage of variance and demonstrates larger effect sizes, supporting the use of multiple academic indicators as valuable in ensuring precision and accuracy. Moreover, the model that includes Step 1 and preclinical exam score accounts for ~58% of Step 2 CK score, given a normal distribution, while including the shelf exam scores increases the variance accounted for to 68%.
While our study provides a framework for other medical schools to use, we encourage replication of the findings presented here across a variety of medical school curricula and would collaborate with other institutions to build more generalizable models. This study took place at a small private medical school in the northeast, thus limiting generalizability because of several of the unique aspects of our medical school. For example, approximately one third of our students enter medical school from our PLME program, which provides a route of admission into AMS from Brown University without completion of the MCAT or providing undergraduate GPA.12 Prior research has indicated that preadmission variables such as the MCAT have predictive validity for licensure examinations, but we were not able to use this measure as a predictor in our analyses.11 Other institutions may benefit from including variables such as undergraduate GPA and MCAT score in their own models to improve predictability. On a similar note, our students do not complete the NBME subject exam in family medicine, and our psychiatry clerkship rotation has evolved into a clinical neuroscience and psychiatry integrated clerkship rotation, limiting our findings by excluding two of the core clerkships from our results. As with preadmission variables, medical schools that utilize the NBME subject exam for family medicine will have the ability to tailor models to fit their own institutions. Additionally, an avenue of future research may wish to identify the predictive power of USMLE scores on postgraduate specialty exams, which has recently been investigated with surgery residents and the American Board of Surgery In-Training Examination.16
With these findings comes additional decisions to consider. For example, students who have a predicted Step 2 CK score below the passing range, the decision to provide tutoring and support services appears clear. However, we must consider at what threshold student scores are “in danger” of failing. This was our rationale for not dichotomizing students into “in danger” or “not in danger.” A recent study by Casey et al used cutoff scores for USMLE Step 1 to predict NBME subject exam scores below the 10th percentile based on sensitivity and specificity. This is a model that we may decide to use in the future as we accumulate additional student data.17 Finally, the projected student scores and the actual student scores should be continuously compared over time to determine the reliability of these models. Additionally, the optimal form of academic support for students at risk will need to be determined.
In practice, the first regression model using mean preclinical course exam score and Step 1 score may be used as a needs assessment at the end of the second year of medical school to estimate the potential resource needs during the upcoming academic year. This allows faculty, staff, and medical school academic advisors to begin to collaborate and identify methods of educational intervention, such as recruiting student tutors and obtaining additional testing materials for practice. The second regression model using mean preclinical course exam score, Step 1 score, and three of the NBME subject examinations can be used in the middle of the third year of medical school in order to identify which students would benefit from academic and support services. We have begun to implement and utilize these models with our current cohort of students.
In sum, we used existing academic indicators to create a regression model that has the ability to predict Step 2 CK scores for our students, considering both statistical findings (i.e., number of academic indicators needed for a sound model) and educational context (i.e., when the academic indicator data becomes available). By being able to predict Step 2 CK scores before completing the licensure exam, we are able to identify students at risk and provide them with the educational support structures, such as peer tutoring, that are needed to successfully complete the licensure exam.
Disclosure
The authors report no conflicts of interest in this work.
References
National Resident Matching Program. National Resident Matching Program, Results and Data: 2015 Main Residency Match. Washington DC: NRMP; 2015. Available from: http://www.nrmp.org/wp-content/uploads/2015/05/Main-Match-Results-and-Data-2015_final.pdf. Accessed March 31, 2017. | ||
Iglehart JK. The residency mismatch. N Engl J Med. 2013;369:297–299. | ||
Green M, Joes P, Thomas JX Jr. Selection criteria for residency: results of a national program directors survey. Acad Med. 2009;84(3):362–367. | ||
National Resident Matching Program. National Resident Matching Program, Charting Outcomes in the Match. Washington DC: NRMP; 2014. Available from: http://www.nrmp.org/wp-content/uploads/2014/09/Charting-Outcomes-2014-Final.pdf. Accessed March 31, 2017. | ||
Coumarbatch J, Robinson L, Thomas R, Bridge PD. Strategies for identifying students at risk for USMLE step 1 failure. Fam Med. 2010;42(2):105–110. | ||
Ripkey DR, Case SM, Swanson DB. Identifying students at risk for poor performance on the USMLE step 2. Acad Med. 1999;74(10 Suppl):S45–S48. | ||
Case SM, Ripkey DR, Swanson DB. The relationship between clinical science performance in 20 medical schools and performance on the USMLE licensing examination. 1994–1995 validity study group for USMLE Step 1 and 2 pass/fail standards. Acad Med. 1996; 71:31–33. | ||
United States Medical Licensing Examination. USMLE Score Interpretation Guidelines. Available from: http://www.usmle.org/pdfs/transcripts/USMLE_Step_Examination_Score_Interpretation_Guidelines.pdf. Accessed March 31, 2017. | ||
Gandy RA, Herial NA, Khuder SA, Metting PJ. Use of curricular and extracurricular assessments to predict performance on the United States Licensure Examination (USMLE) step 1: a multi-year study. TLAR. 2008;13:37–35. | ||
Gohara S, Shapiro JI, Jacob AN, et al. Predictors of success on the United States Licensure Examination (USMLE). TLAR. 2011; 16:11–20. | ||
Donnon T, Paolucci EO, Violato C. The predictive validity of the MCAT for medical school performance and medical board licensing examinations: a meta-analysis of the published research. Acad Med. 2007;82(1):100–106. | ||
Julian ER. Validity of the medical college admission test for predicting medical school performance. Acad Med. 2013;80(10):910–907. | ||
George P, Park YS, Ip J, Gruppuso PA, Adashi EY. The association between premedical curricular and admission requirements and medical school performance and residency placement: a study of two admission routes at the Warren Alpert Medical School of Brown University. Acad Med. 2016;91(3):388–394. | ||
Kleshinski J, Khuder SA, Shapiro JI, Gold JP. Impact of preadmission variables on USMLE Step 1 and Step 2 performance. Adv Health Sci Educ Theory Prac. 2009;14(1):69–78. | ||
Kleshinski J. Predictors of success on the United States Licensures Examination (USMLE). TLAR. 2011;16:11–20. | ||
Spurlock DR, Holden C, Hartranft T. Using United States Licensure Examination (USMLE) examination results to predict later in-training examination performance among general surgery residents. J Surg Educ. 2010;67(6):452–456. | ||
Casey PM, Palmer BA, Thompson, GB, et al. Predictors of medical school clerkship performance: a multispecialty longitudinal analysis of standardized examination scores and clinical assessments. BMC Med Educ. 2016;16;128. |
 © 2017 The Author(s). This work is published and licensed by Dove Medical Press Limited. The
full terms of this license are available at https://www.dovepress.com/terms
and incorporate the Creative Commons Attribution
- Non Commercial (unported, 3.0) License.
By accessing the work you hereby accept the Terms. Non-commercial uses of the work are permitted
without any further permission from Dove Medical Press Limited, provided the work is properly
attributed. For permission for commercial use of this work, please see paragraphs 4.2 and 5 of our Terms.
© 2017 The Author(s). This work is published and licensed by Dove Medical Press Limited. The
full terms of this license are available at https://www.dovepress.com/terms
and incorporate the Creative Commons Attribution
- Non Commercial (unported, 3.0) License.
By accessing the work you hereby accept the Terms. Non-commercial uses of the work are permitted
without any further permission from Dove Medical Press Limited, provided the work is properly
attributed. For permission for commercial use of this work, please see paragraphs 4.2 and 5 of our Terms.