Back to Journals » Journal of Hepatocellular Carcinoma » Volume 12
Predicting the Occurrence of Cachexia in Patients with BCLC Stage B/C Hepatocellular Carcinoma Receiving Systemic Therapy: A Nomogram Based on Common Clinical Parameters
Authors Ma W, Han J, Yu H, Liang Z, Peng C, Lu Y
Received 21 August 2025
Accepted for publication 6 November 2025
Published 20 December 2025 Volume 2025:12 Pages 2845—2857
DOI https://doi.org/10.2147/JHC.S558288
Checked for plagiarism Yes
Review by Single anonymous peer review
Peer reviewer comments 3
Editor who approved publication: Dr Mohamed Shaker
Weihong Ma,1,2 Jie Han,1,2 Hongli Yu,1,2 Zhipeng Liang,3 Caiyun Peng,1 Yinying Lu1,2
1Senior Department of Hepatology, The 5th Medical Center of the PLA General Hospital, Beijing, People’s Republic of China; 2Chinese PLA Medical School, Beijing, People’s Republic of China; 3Guizhou Medical University, Guizhou, People’s Republic of China
Correspondence: Yinying Lu, Email [email protected] Caiyun Peng, Email [email protected]
Background and Objective: During the disease course of patients with BCLC B/C hepatocellular carcinoma (HCC) receiving systemic therapy, approximately half of the patients will develop cachexia. Therefore, early identification of which patients are likely to develop cachexia is of crucial significance.This study aims to construct and validate a nomogram for predicting the risk of cachexia in this population based on common clinical parameters.
Patients and Methods: This retrospective single - center study involved 906 patients managed at the Fifth Medical Center of Chinese PLA General Hospital from January 2020 to December 2023. Baseline clinical imaging data, biochemical indicators, and relevant clinical data of patients before systemic treatment were collected. All patients were followed up to record treatment regimens and document weight changes for cachexia diagnosis. The data were stratified into a training cohort and a validation cohort. In this study, LASSO regression alongside univariate and multivariate Logistic regression analyses were utilized to ascertain independent risk factors linked to cachexia occurrence, and further to construct and validate a diagnostic nomogram.
Results: This nomogram incorporates predictors such as patient age, maximum size of intrahepatic lesions, extrahepatic metastasis, neutrophil-to-lymphocyte ratio (NLR), and total bile acids, demonstrating good predictive performance. In the training and validation cohorts, its Harrell’s concordance index (C-index) reached 0.865 (95% CI: 0.836– 0.895) and 0.820 (95% CI: 0.768– 0.871), respectively. Calibration curves demonstrated strong consistency between the nomogram’s predicted outcomes and the actual measured values, and decision curve analysis (DCA) further substantiated its clinical applicability.
Conclusion: This nomogram shows good predictive performance and can effectively identify high-risk individuals, but it is limited by its single-center retrospective design and requires further verification and optimization through multicenter prospective studies.
Keywords: cancer-related cachexia, targeted immunotherapy, model evaluation, weight loss
Introduction
Cancer-related cachexia is a metabolic disorder syndrome caused by multiple factors, characterized by involuntary weight loss, mainly manifested by persistent loss of skeletal muscle mass (with or without loss of fat mass), which cannot be fully reversed by traditional nutritional support.1,2 The presence of cachexia in cancer patients is associated with poor prognosis, reduced treatment efficacy, and shorter survival time. It affects approximately 50–80% of cancer patients and is the direct cause of death in about 30% of patients.3,4 Given the liver’s important role in nutrient metabolism, hepatocellular carcinoma (HCC) is one of the cancers most frequently complicated by cachexia.5 Studies have shown that approximately 50.1% of HCC patients develop cachexia during disease progression,6 and it is an important independent risk factor for poor prognosis in HCC.7 For patients with Barcelona Clinic Liver Cancer (BCLC) stage B/C HCC, systemic therapy combined with local treatment strategies have been widely used in clinical practice in recent years, significantly prolonging patients’ overall survival (OS). Yet, cachexia development remains a primary therapeutic challenge: it not only markedly reduces patients’ quality of life (QoL) but also strongly correlates with poor prognosis and higher mortality.8,9
Currently, research on risk factors for cachexia in HCC patients has mainly focused on evaluating the predictive value of baseline imaging biomarkers, such as body composition analysis parameters based on magnetic resonance imaging (MRI) (eg, skeletal muscle index, visceral fat area),10 functional liver imaging score (FLIS),11 and metabolic parameters obtained by positron emission tomography (PET),12 among others. However, existing studies remain insufficient in the systematic integration of multi-dimensional clinical data, including baseline demographic characteristics, medical history data, clinical symptoms, laboratory test indicators, tumor biological characteristics, and treatment regimens during follow-up. Meanwhile, cachexia in cancer patients is often underestimated and overlooked. The current clinical definition of cancer-related cachexia mainly relies on weight monitoring, requiring 6 months of continuous monitoring for diagnosis, which lacks sufficient sensitivity and has a lag, often leading to missed opportunities for early intervention.13 This not only worsens patients’ general condition and quality of life but also impairs antitumor therapy efficacy, underscoring the critical need for early identification of cachexia risk in HCC patients undergoing systemic therapy to improve survival and quality of life.
Notably, with the advent of the era of systemic targeted immunotherapy, BCLC stage B/C HCC patients now widely receive this treatment,14 while local therapies like transarterial chemoembolization (TACE) and hepatic arterial infusion chemotherapy (HAIC) are increasingly used for this stage.15 Studies have shown that the incidence of cachexia in patients receiving systemic targeted therapy is as high as 38.6%, which is significantly associated with shortened overall survival (HR=1.64);16 moreover, the decrease in skeletal muscle mass after TACE is also associated with increased mortality (HR=1.93).17 However, the specific link between different systemic/local treatment modalities and cachexia risk remains unclear—for example, whether treatments contribute to cachexia via altering the inflammatory microenvironment or disrupting nutritional metabolic pathways. This gap may impede clinicians’ ability to recognize “treatment-related cachexia,” particularly in patients on multimodal combination therapy. Thus, future studies should prioritize integrating and analyzing multidimensional routine clinical data to more conveniently and comprehensively identify cachexia risk factors in BCLC stage B/C HCC patients undergoing systemic therapy. This will enable more precise patient interventions and provide evidence-based support for individualized nutritional regimens.
This study seeks to employ clinical data from HCC patients to construct and verify a new nomogram tool, in order to predict the probability of cachexia in BCLC stage B/C HCC patients scheduled to undergo systemic therapy.Compared with existing methods, the nomogram constructed in this study has three key advantages: First, it integrates multi-dimensional routine clinical data, which can address the single-modal limitation of models related to MRI/PET; Second, it specifically targets patients with BCLC stage B/C — a population underrepresented in previous models — and incorporates treatment-related variables, thus filling the gap in existing studies that ignore the impact of treatment; Third, as a visual nomogram, it does not rely on specialized imaging equipment, making it more convenient for routine clinical risk screening.This will enable earlier identification of patients at high risk of cachexia and prompt implementation of targeted preventive and therapeutic measures.
Materials and Methods
Study Population
This study was reviewed and approved by the Ethics Committee of the Fifth Medical Center of Chinese PLA General Hospital on June 27, 2025 (approval number: KY-2025-6-129-1). This study was conducted in accordance with the principles of the 2013 revised Declaration of Helsinki. As a retrospective study, the Ethics Committee approved the waiver of individual informed consent for this study.
Inclusion criteria were as follows: (1) All enrolled patients were diagnosed with HCC according to the criteria established by the American Association for the Study of Liver Diseases (AASLD);18(2) Planned to receive systemic therapy with tyrosine kinase inhibitor (TKI) or TKI + programmed death-1 (PD-1) inhibitor; (3) BCLC stage B or C; (4) Without cachexia; (6) With available baseline weight records; with at least 2 weight records during the 6-month follow-up period; (7) Eastern Cooperative Oncology Group Performance Status (ECOG PS) score of 0–2; (8) With at least 1 measurable target lesion according to modified Response Evaluation Criteria in Solid Tumors (mRECIST); (9) Duration of systemic therapy ≥ 3 months. Exclusion criteria were as follows: (1) Patients who had received any anticancer treatment other than hepatectomy or ablation; (2) Child-Pugh class C; (3) With other comorbidities, such as other tumors, pancreatitis, heart failure, kidney disease, chronic obstructive pulmonary disease, acute cholecystitis, severe liver cirrhosis, severe fatty liver, massive ascites, patients using diuretics, or those with hepatic encephalopathy; (4) Patients who received unconventional dosage regimens or had frequent dosage adjustments due to poor medication adherence during follow-up; (5) Incomplete clinical or follow-up data.
We conducted a retrospective review of clinical data from 2282 BCLC stage B/C HCC patients undergoing TKI or TKI + PD-1 therapy, who visited the Fifth Medical Center of Chinese PLA General Hospital from January 2020 to December 2023. Subsequently, 1376 patients were excluded based on the inclusion and exclusion criteria: presence of cachexia before receiving systemic therapy (n=623); Child-Pugh class C (n=101); ECOG PS score > 2 (n=111); previous receipt of other anticancer treatments besides hepatectomy and ablation (n=233); complicated with severe cardiovascular diseases, respiratory diseases, other malignant tumors, massive ascites, use of diuretics, etc. (n=163); and inadequate clinical or follow-up data (n=145).Therefore, a total of 906 patients were included in the study. This 906-patient sample size is statistically relatively stable, providing the required degrees of freedom for analysis and ensuring more accurate and reliable results. Figure 1 shows the flow chart of eligible patient screening.
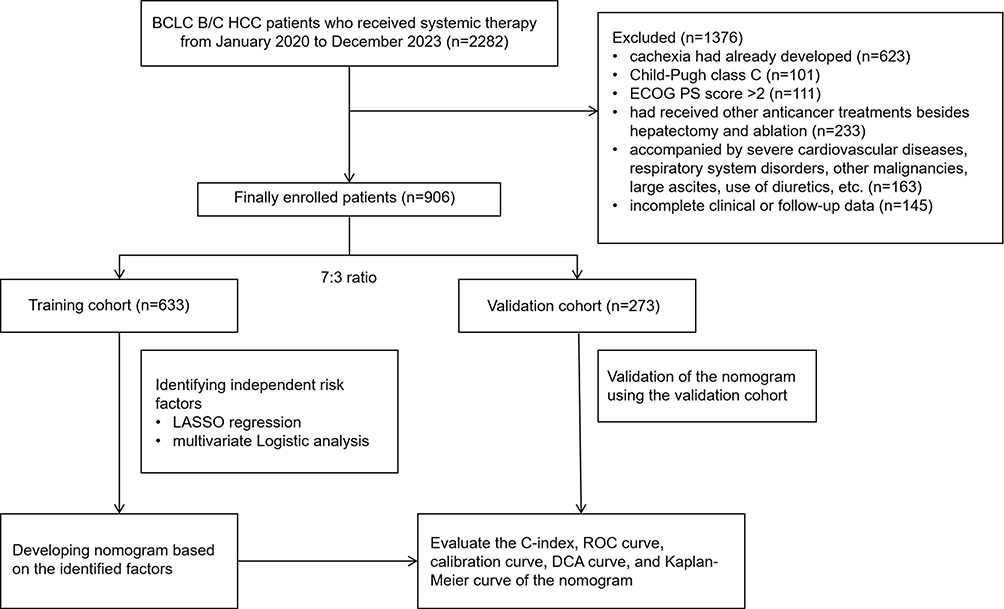 |
Figure 1 Flowchart of this study. Abbreviations: HCC, hepatocellular carcinoma;BCLC, Barcelona Clinic Liver Cancer; LASSO, least absolute shrinkage and selection operator; ROC, receiver operating characteristic; DCA, decision curve analysis. |
Data Collection
We conducted a comprehensive collection of clinical information for the enrolled patients, covering demographic data including age, gender, and body mass index (BMI); medical history information such as hypertension, diabetes, hepatitis B virus infection history, smoking, and drinking habits; laboratory test data and their calculated results including hemoglobin (Hb), triglycerides (TG), interleukin-6 (IL-6), C-reactive protein (CRP), platelet-to-lymphocyte ratio (PLR), NLR, Controlled nutritional status grading (COUNT grade), alanine aminotransferase (ALT), total bile acids, albumin (Alb), prealbumin, Child-Pugh score, and alpha-fetoprotein (AFP); tumor pathological features such as portal hypertension, liver cirrhosis, maximum size of intrahepatic lesions, vascular invasion, extrahepatic metastasis, and BCLC stage; as well as previous treatments received by patients, including surgery and ablation therapy. These data were all obtained from the clinical records database when patients were first diagnosed with BCLC stage B/C HCC in our hospital and planned to receive systemic therapy. In addition, we also tracked patients’ weight changes over six months and recorded the treatment modalities received by patients within six months after the baseline time, including targeted therapy, targeted therapy combined with immunotherapy, surgery, ablation, TACE/HAIC, and radiotherapy.
Treatment and Follow-Up
Regarding the individualized treatment selection of PD-1 inhibitors and targeted drugs (TKIs) during patient follow-up, all decisions were made in accordance with China’s local practices and guidelines,19,20 with comprehensive consideration of patients’ specific conditions, economic burden, and personal preferences. In terms of treatment implementation, modalities such as TACE, HAIC, surgery, ablation, and radiotherapy could be administered concurrently with drug administration or performed within 3 months after drug administration, aiming to achieve significant control of local lesions. The multidisciplinary team (MDT) played a crucial role in formulating these personalized treatment recommendations. All first-line PD-1 inhibitors and targeted drugs were administered at recommended doses and frequencies. Systemic therapy was continued until disease progression or the occurrence of unacceptable toxicities.
Follow-up assessments included regular evaluations of patients’ weight and treatment modalities, with intervals set at 6 to 9 weeks. The diagnostic criteria for cachexia were: weight loss exceeding 5% within 6 months without dieting, or a body mass index (BMI) < 20 kg/m2 with weight loss exceeding 2%.2,21 Patients were followed up until death or the end of the study (as of June 1, 2025).
Statistical Analysis
All statistical analyses in this study were performed using R software (Version 4.3.2), with the statistical significance level set at P < 0.05. Based on the data distribution characteristics, continuous variables were described as mean ± standard deviation (mean±SD), and inter-cohort differences were quantified using the standardized mean difference (SMD). Categorical variables were expressed as frequency (n) and percentage (n, %), and inter-cohort differences were assessed using the standardized proportion difference (SPD). Criteria for determining baseline balance referred to methodological consensus in the field: for continuous variables, if the absolute value of the standardized mean difference (SMD) is less than 0.25; for categorical variables, if the absolute value of the standardized proportion difference (SPD) is less than 0.25, the baseline characteristics of this variable between the two cohorts were deemed well-balanced.
During the data collection phase, information on candidate variables was extracted by reviewing original medical records, this study first excluded variables with no clear biological link to the pathogenesis of cachexia (eg, patient ID, admission date) to reduce irrelevant interference,with an overall data missing rate of < 2%. For missing values, the predictive mean matching method was used for imputation, and missing information on some key clinical indicators was supplemented and confirmed by consulting the attending physicians.
Given the potential multicollinearity among the initial 33 clinical variables, LASSO regression was first used for dimensionality reduction. This method screens for core predictors by minimizing prediction errors and imposing penalties on the absolute values of regression coefficients; only variables with non-zero coefficients were included in subsequent univariate and multivariate Logistic regression analyses. In both univariate and multivariate Logistic regression analyses, the odds ratio (OR) and 95% confidence interval (CI) were used to describe the strength of association of each risk factor. Among these, variables with P<0.1 in the univariate analysis were further included in the multivariate analysis. Subsequently, a visual nomogram model was constructed based on the identified risk factors, and its discriminative ability, calibration ability, and clinical utility were evaluated. Discriminative ability was assessed using the C-index and AUC; calibration ability was evaluated via the calibration curve, which compares the probability of cachexia predicted by the model with the actual occurrence probability. To evaluate the clinical applicability of the nomogram, decision curve analysis (DCA) was conducted, which assesses the net benefit of the model in clinical decision-making through considering potential risks and benefits at different treatment thresholds.
Results
Clinicopathological Characteristics of the Enrolled Patients
A total of 906 patients were finally enrolled in this study, randomly split into the training cohort (n=633) and validation cohort (n=273) with a 7:3 ratio. The training cohort focused on identifying risk factors and building a nomogram prediction model, while the validation cohort was tasked with evaluating the model’s general applicability. Comparisons of characteristics confirmed that there were no statistically significant differences in variables between the two cohorts (see Table 1). The presented data included various parameters such as age, gender, tumor characteristics, laboratory test results, and different treatment modalities. The mean ages of the two cohorts were similar, with a median age of 57 years in the training cohort and 59 years in the validation cohort. The gender distribution was also comparable: 537/633 (84.8%) were male in the training cohort, and 241/273 (88.3%) were male in the validation cohort. In terms of tumor characteristics, most patients in both cohorts had no extrahepatic metastasis: 421/633 (66.5%) in the training cohort and 178/273 (65.2%) in the validation cohort. The patients in both cohorts received similar systemic treatment modalities during follow-up, with 467/633 (73.8%) in the training cohort and 197/273 (72.2%) in the validation cohort receiving TKI combined with PD-1 therapy. Laboratory test results such as AFP, albumin, NLR, and IL-6 also showed no significant differences between the two cohorts.
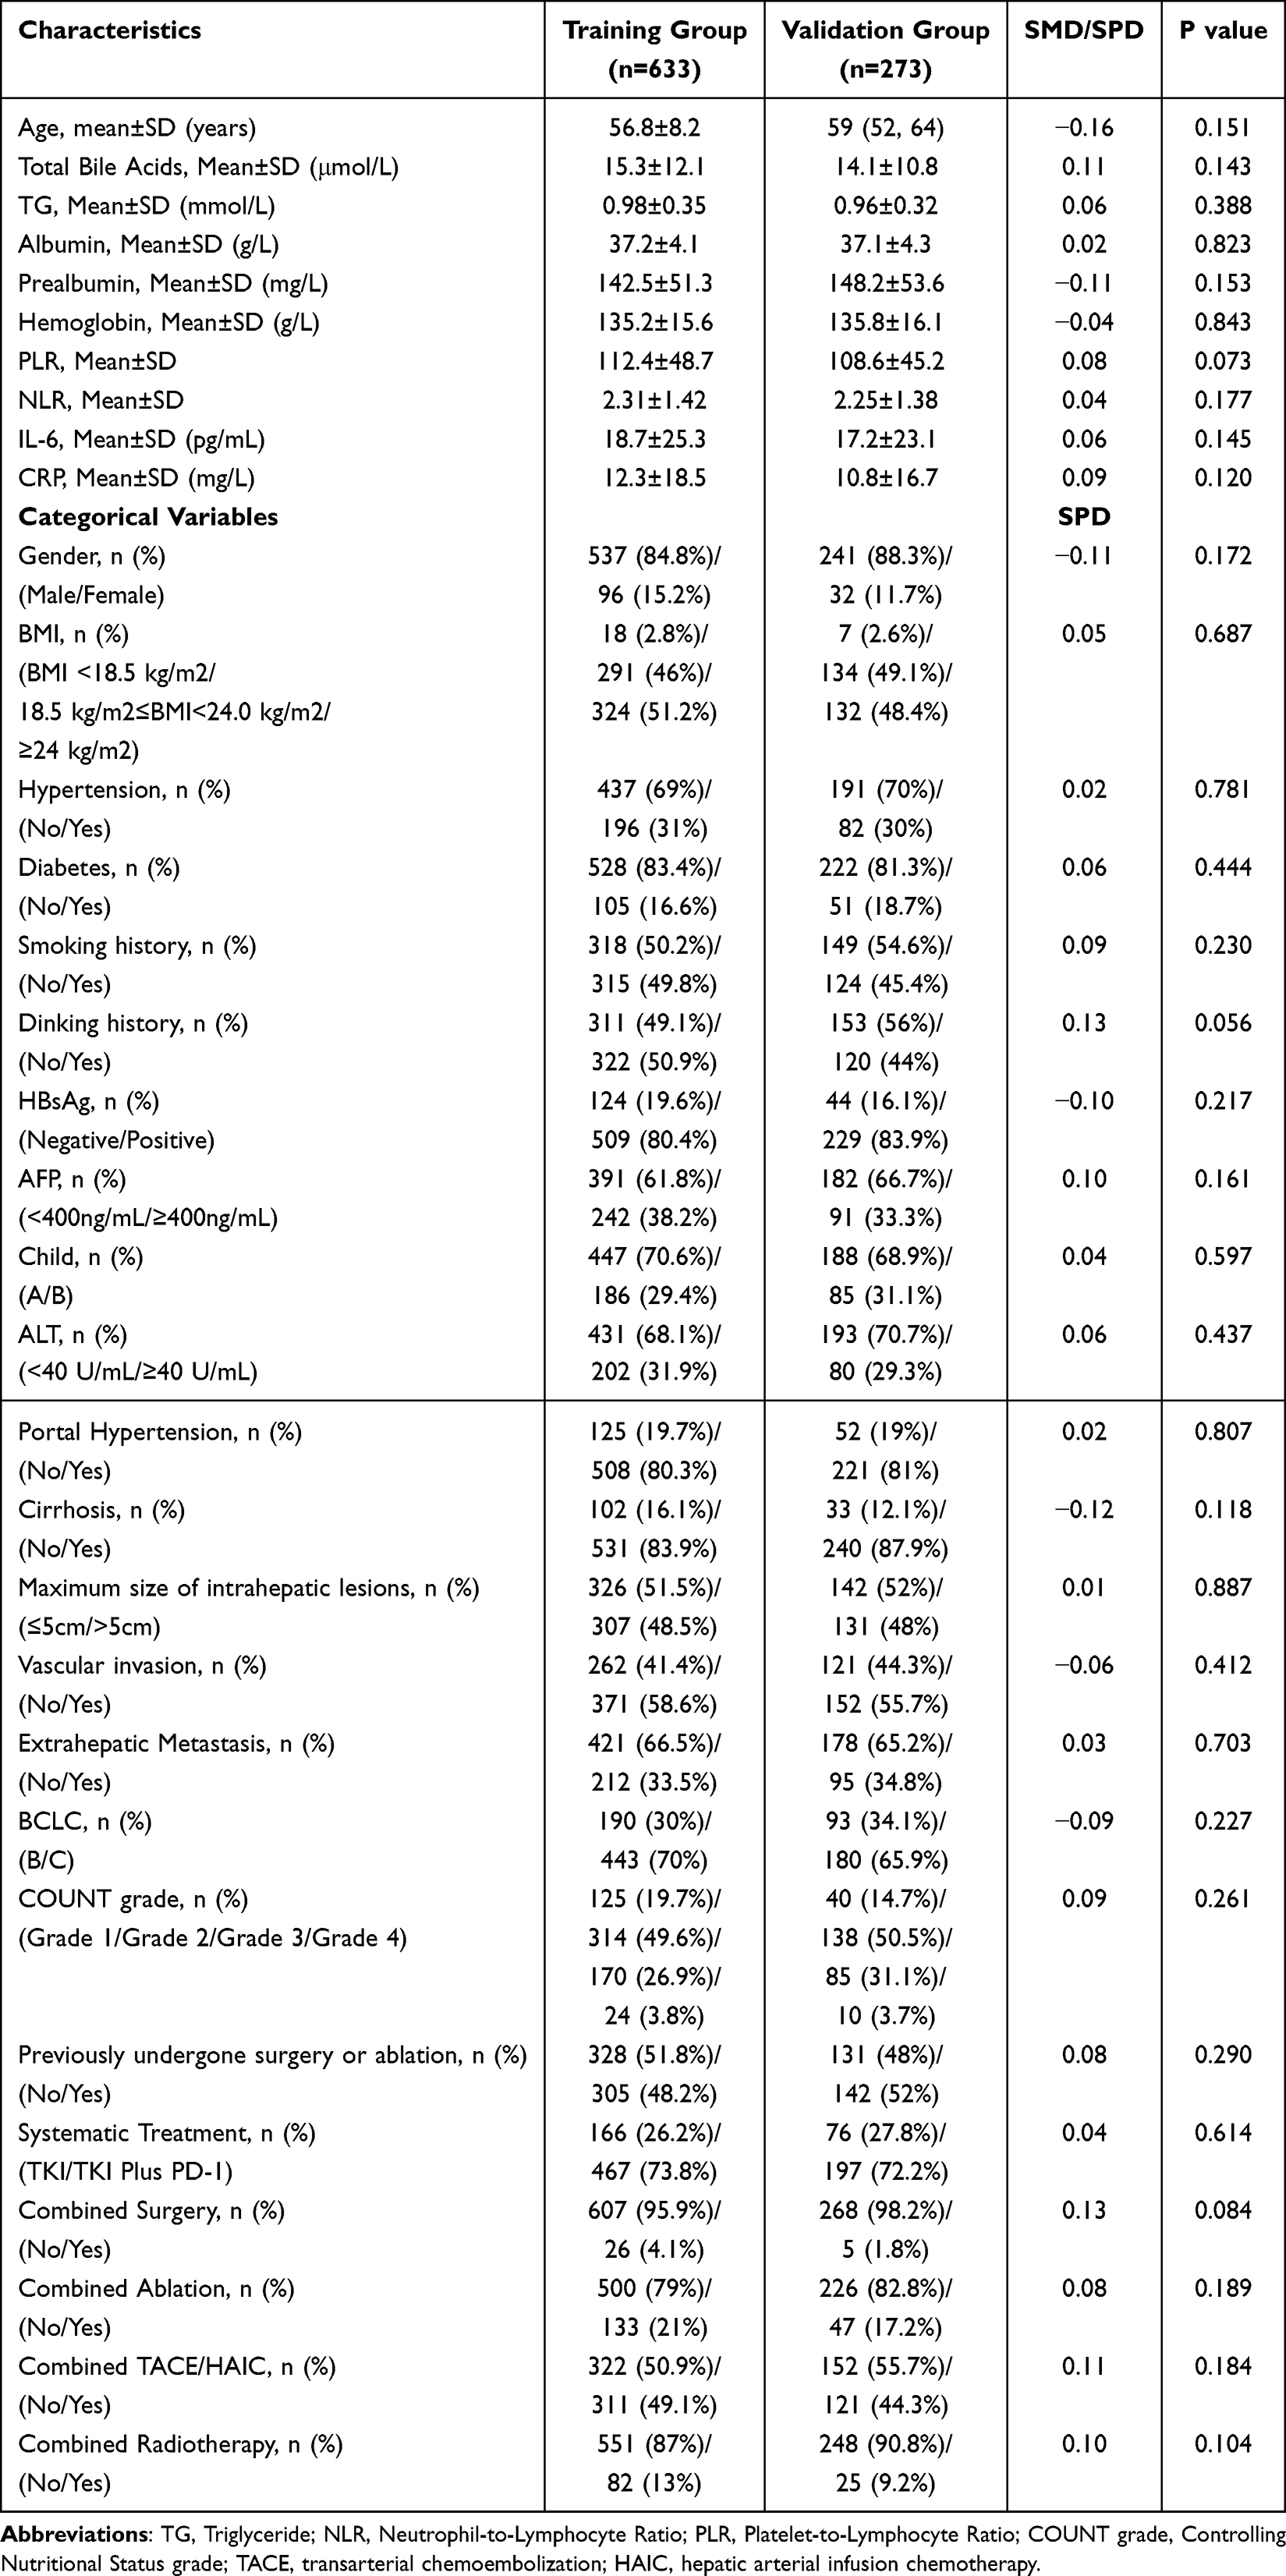 |
Table 1 Comparison of the Clinicopathological Characteristics Between the Training Cohort and the Validation Cohort (Including SMD/SPD) |
The Independent Influencing Factors for the Development of Cachexia in BCLC Stage B/C HCC Patients Receiving Systemic Therapy Were Identified via LASSO Regression and Univariate and Multivariate Logistic Regression
In this study, we first performed LASSO regression analysis for preliminary screening of potential influencing factors for the development of cachexia in patients with BCLC stage B/C HCC receiving systemic therapy. Subsequently, we further refined the variables through univariate and multivariate Logistic regression analyses, and identified variables with a statistical test P<0.05 as independent risk factors for the development of cachexia in this population.
For this study, the optimal λ value identified via LASSO regression was 0.022366. With this as a reference, 33 initial variables were screened, and the trajectory of each variable’s coefficient as λ changed is depicted in Figure 2A. Through this screening process, we narrowed down to 10 variables with non-zero coefficients, which acted as potential predictors in the training cohort (as illustrated in Figure 2B). These variables specifically include: age, BMI, total bile acids, maximum size of intrahepatic lesions, vascular invasion, extrahepatic metastasis, albumin, NLR, CRP, and combined TACE or HAIC during follow-up. Together, Figure 2A and B detail the LASSO-based variable selection procedure.
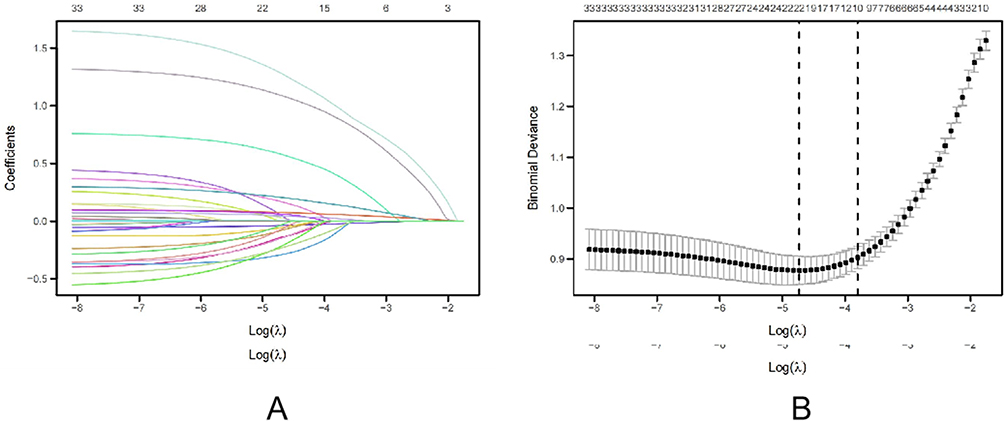 |
Figure 2 Risk factors for the occurrence of cachexia were initially identified using LASSO regression. (A) LASSO regression coefficients paths; (B) LASSO regression cross-validation curve. |
Finally, we included 10 variables (with non-zero coefficients filtered by LASSO regression) as potential risk factors in univariate and multivariate logistic regression analyses. Results revealed that five of these variables had P-values <0.05, therefore these five were determined to be independent risk factors in the development of cachexia. They specifically included: age (OR: 0.957; 95% CI: 0.934–0.980; P< 0.001), total bile acids (OR: 1.088; 95% CI: 1.068–1.108; P< 0.001), maximum size of intrahepatic lesions (OR: 3.589; 95% CI: 2.332–5.521; P< 0.001), extrahepatic metastasis (OR: 3.577; 95% CI: 2.296–5.572; P< 0.001), and NLR (OR: 1.238; 95% CI: 1.118–1.371; P< 0.001) (see Table 2). The results of the multivariate Logistic regression are presented in a forest plot (see Figure 3).
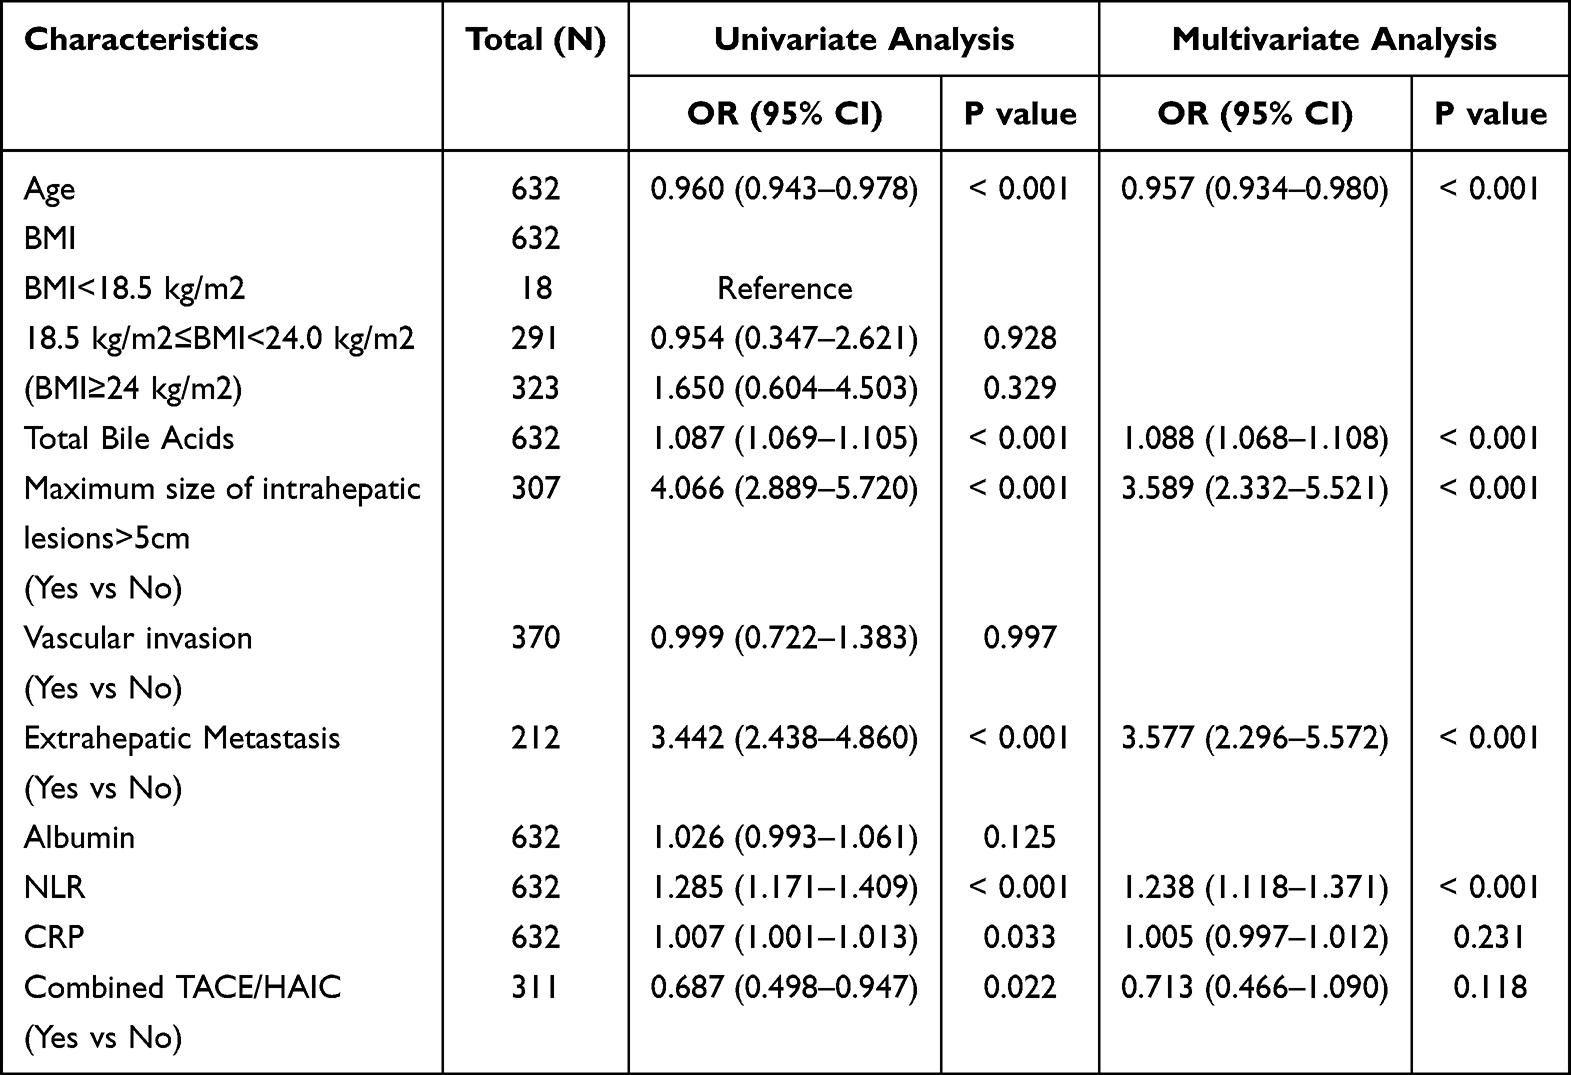 |
Table 2 Results of Univariate and Multivariate Logistic Regression Analysis |
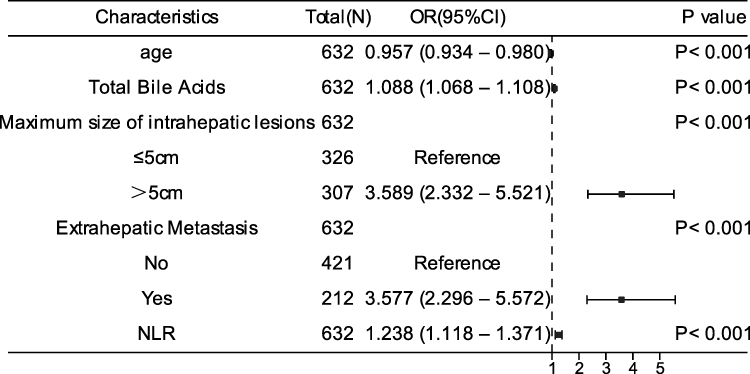 |
Figure 3 A forest plot is used to display the results of the multivariable logistic regression analysis. |
Construction of a Nomogram for Predicting the Occurrence of Cachexia Based on the Identified Risk Factors
In this study, five independent risk factors were identified through LASSO regression, as well as univariate and multivariate Logistic regression analyses: age, Maximum size of intrahepatic lesions, Extrahepatic Metastasis, NLR, and Total Bile Acids. Based on these factors, we constructed a nomogram model (Figure 4) to predict the risk of cachexia in patients with BCLC stage B/C HCC receiving systemic therapy. The nomogram consists of four components: scores, predictors (ie, the aforementioned risk factors), total score, and predicted probability. The total score is obtained by summing the scores corresponding to each predictor, and the value corresponding to this total score on the coordinate axis is the predicted probability of cachexia in the patient. Subsequently, the model performance will be evaluated.
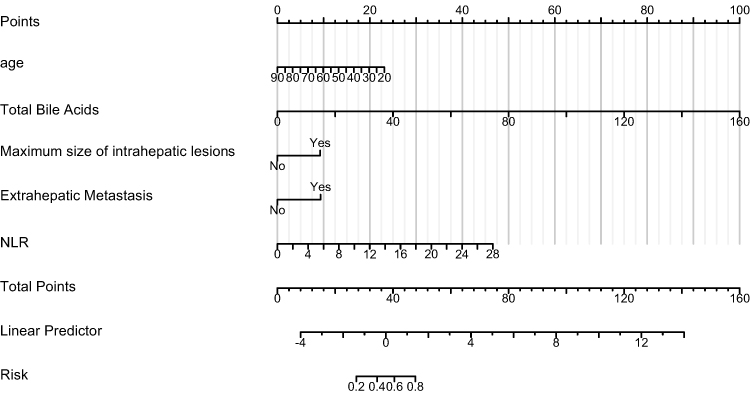 |
Figure 4 Nomogram for predicting the risk of cachexia in BCLC B/C HCC patients following systemic therapy. |
Predictive Performance of the Nomogram in Training Cohort
In this study, the discriminative ability of the nomogram was evaluated using the concordance index (C-index) and the area under the receiver operating characteristic curve (AUC). The C-index ranges from 0.5 to 1, with higher values indicating better discriminative accuracy of the model. In the training cohort, this index was 0.865 (95% CI: 0.836–0.895), indicating that the nomogram has good discriminative ability for patients at high risk of cachexia; meanwhile, the AUC value for the occurrence of cachexia in the training cohort was also 0.865, further confirming the excellent discriminative ability of the nomogram (see Figure 5A for details).
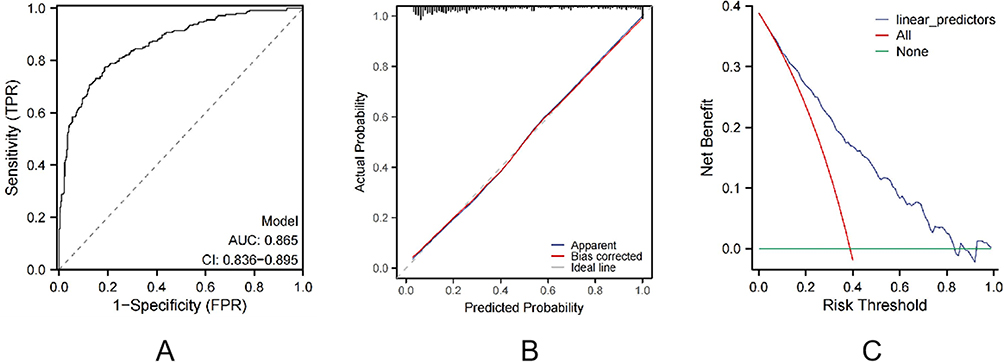 |
Figure 5 Evaluation Results of the Nomogram in the Training Cohort. (A) Receiver operating characteristic (ROC) curve of the nomogram in the training cohort. (B) Calibration curves of the nomogram in the training cohort. (C) Decision curve analysis (DCA) of the nomogram in the training cohort. |
Subsequently, we constructed a calibration curve and compared the predicted probabilities of the nomogram with the actually observed probabilities to evaluate the predictive accuracy of the nomogram. For the model built based on the training cohort, we conducted a calibration curve analysis. The results are gratifying: the predicted curve highly overlaps with the ideal curve. Specifically, the slope of the calibration curve is 1.06, extremely close to 1, which means that the proportional deviation between the predicted values and the actual values is negligible. The intercept is −0.14, nearly 0, indicating that the overall offset of the predicted values is minimal. The Brier score is 0.11. Since a Brier score closer to 0 indicates a smaller prediction error, this value fully demonstrates that the predicted probabilities of the nomogram are highly consistent with the actual probabilities, and its predictive accuracy is quite excellent (see Figure 5B). To ensure the reliability of the results, we also used the bootstrapping method to validate the calibration curve, further confirming the robustness and precision of the nomogram in prediction.
Finally, we used DCA to evaluate the clinical application value of the nomogram. The DCA curve of the training cohort in this study shows that within the clinically relevant threshold range of 10% - 30%, the net benefit value of the nomogram is positive and exceeds the values corresponding to the two extreme scenarios of “Intervention for All” and “No Intervention”, indicating that the model has high clinical applicability (details are shown in Figure 5C).
Nomogram’s Predictive Ability in the Validation Cohort
The performance of this nomogram was further evaluated in the validation cohort to test its generalizability. The evaluation results showed that the model had good discriminative ability, with a C-index of 0.820 (95% CI: 0.768–0.871), which was consistent with the AUC value of 0.820 for predicting the risk of cachexia in patients (Figure 6A). Calibration curve analysis revealed good consistency between the predicted probability of cachexia by the model and the actual observed results (Figure 6B). DCA in the validation cohort demonstrated that this nomogram could yield favorable net benefits in predicting the risk of cachexia in patients with BCLC stage B/C HCC receiving systemic therapy, indicating good clinical utility (Figure 6C).
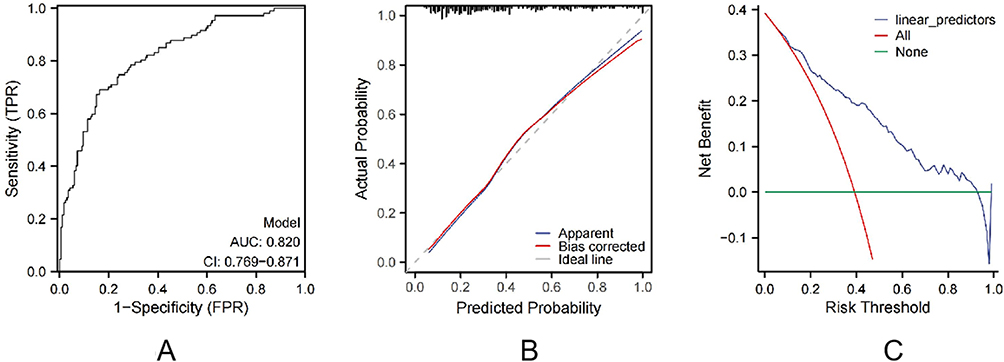 |
Figure 6 Evaluation Results of the Nomogram in the validation Cohort. (A) Receiver operating characteristic (ROC) curve of the nomogram in the validation cohort. (B) Calibration curves of the nomogram in the validation cohort. (C) Decision curve analysis (DCA) of the nomogram in the validation cohort. |
Discussion
This study developed and validated a nomogram model based on clinical characteristic parameters. This model, which utilizes routine data, helps predict the risk of cachexia in patients with BCLC stage B/C HCC who are receiving systemic treatment. The model incorporates five independent predictors, including age, total bile acid level, maximum size of intrahepatic lesions, presence of extrahepatic metastasis, and NLR. Methodologically, LASSO regression was used to screen key variables, and univariate and multivariate Logistic regression to identify independent risk factors. This approach was proven to effectively reduce the risk of overfitting and enhance model stability.22 The nomogram constructed in this study exhibited excellent predictive performance in both the training and validation cohorts, with C-indices reaching 0.865 and 0.820, respectively, and good calibration. Moreover, results of DCA further confirmed that the model has clear clinical utility. In addition, the data showed no significant difference in the risk of cachexia between different systemic treatment regimens and local treatment regimens. This preliminarily indicates that an increase in drug dosage did not exacerbate the occurrence of cachexia, while local treatment, due to the limited scope of its action, has a weaker systemic impact.
Regarding predictive factors, the five independent risk factors identified in this study are highly consistent with the pathogenesis of cachexia reported in existing literature. The study showed that age is an independent risk factor for cachexia, with an odds ratio (OR) of 0.957 (95% [CI]: 0.934–0.980; P<0.001), indicating a significant negative correlation between increasing age and the risk of cachexia. Notably, the finding in this study differs from most previous reports concluding that older age is accompanied by an elevated risk of cachexia.22 To address this seemingly contradictory observation, we first analyzed it from the perspective of physiological adaptation mechanisms: age-related decreases in basal metabolic rate, gradual loss of skeletal muscle mass, and mild impairment of immune function—these changes may endow elderly patients with greater tolerance to moderate weight loss and lower metabolic demands, thereby reducing the likelihood of their meeting the clinical diagnostic criteria for cachexia.23 Additionally, selection bias in this study may also be a key factor contributing to this result: the cohort strictly included patients with BCLC stage B/C HCC who had an ECOG PS score of 0–2 and Child-Pugh class A/B, while explicitly excluding elderly patients with severe comorbidities. Such populations are often high-risk groups for cachexia, and whether they are included or not may directly lead to differences in study conclusions.
Meanwhile, total bile acid levels are also an independent risk factor for predicting cachexia, with an OR of 1.088 (95% CI: 1.068–1.108; P<0.001). As key metabolic signaling molecules, bile acids regulate energy metabolism homeostasis and inflammatory responses by activating pathways such as the nuclear receptor FXR and membrane receptor TGR5.24 Preclinical studies have shown that abnormal bile acid levels can inhibit the PI3K/Akt/mTOR pathway, thereby blocking muscle protein synthesis, driving energy metabolism reprogramming, and impairing tissue regenerative capacity.25–27 Notably, bile acid metabolic disorder is significantly associated with the risk of cachexia, particularly as early changes in bile acid profiles (eg, reduced levels of the secondary bile acid TDCA) have been observed in cancer cachexia models.28 The value of total bile acids as a predictor lies in their specific indication of the potential mechanistic link between liver function impairment and the development of cachexia, providing new clues for targeted intervention in liver disease-related cachexia.
The maximum diameter of intrahepatic lesions and extrahepatic metastasis are direct indicators of tumor burden. Among these, the OR for the maximum diameter of intrahepatic lesions and extrahepatic metastasis were 3.589 (95% CI: 2.332–5.521, P<0.001) and 3.577 (95% CI: 2.296–5.572, P<0.001), respectively, indicating that increased tumor burden can significantly elevate the risk of cachexia.Mechanistically, increased tumor burden can drive the progression of cachexia through multiple pathways: it can activate the ubiquitin-proteasome pathway to mediate skeletal muscle protein degradation, accelerating muscle wasting;29,30 meanwhile, increased tumor burden is accompanied by aggravated liver function impairment, leading to a significant elevation in the body’s metabolic demand. In addition, the rapid proliferation of tumor cells consumes large amounts of nutrients, further exacerbating the body’s negative nitrogen balance;30 furthermore, larger tumor lesions and metastases can release a large number of inflammatory factors (eg, IL-6, TNF-α) and metabolic toxic products, which induce systemic inflammatory responses through paracrine/endocrine pathways, synergistically promoting the breakdown of muscle and adipose tissue.1,31
Additionally, we found that the systemic inflammatory marker NLR is strongly associated with the risk of cachexia, with an OR of 1.238 (95% CI: 1.118–1.371, P<0.001). As an inflammatory marker, NLR can reflect the body’s inflammatory status and immune function: a higher NLR usually indicates the presence of chronic inflammation. Studies have shown that a high NLR may activate the NF-κB signaling pathway, induce the expression of muscle atrophy-related genes (such as Atrogin-1 and MuRF-1), thereby promoting muscle protein breakdown, inhibiting protein synthesis, and accelerating the progression of cachexia.32 Furthermore, chronic inflammation may also activate tumor-related signaling pathways, promote tumor growth and invasion, and further increase the risk of cachexia.33 Meanwhile, NLR has been confirmed to be closely associated with the diagnosis and prognosis of cachexia. A study showed that NLR can be combined with other markers such as CRP and GPS for the diagnosis and assessment of cachexia severity.34 Moreover, a multicenter study involving 1,826 patients with cancer cachexia confirmed that NLR combined with handgrip strength can be used for survival prognosis assessment.35 Given its advantages of simple detection, low cost, and non-invasiveness, NLR has been proposed as a routine screening tool for cachexia.
The key factors identified in this study are closely related to the pathogenesis of cachexia, revealing the complexity of its multifactorial synergistic effects. However, the study has the following limitations: First, as a single-center retrospective study, it inevitably has selection bias, which may affect the generalizability of the results.In the future, multicenter prospective studies can be conducted for external validation to further verify the predictive performance of this nomogram. In addition, the follow-up duration set in this study is 6 months, and its long-term predictive efficacy still needs further evaluation. Notably, this study observed a correlation between elevated bile acid levels and the risk of cachexia. In the future, combined with basic research, in vivo and in vitro experiments can be used to explore the underlying molecular mechanisms by which bile acid metabolic disorders drive cachexia, so as to enhance the biological interpretability of the prediction model.
In summary, this study successfully developed and validated a nomogram model that incorporates tumor biological characteristics, patient age, inflammatory indicators, and metabolic parameters. This model provides a reliable tool for predicting the risk of cachexia in patients with BCLC stage B/C HCC receiving systemic therapy. The significance of developing this model lies in its ability to assist clinicians in predicting the risk of cachexia and guiding early intervention. It facilitates the prediction of cachexia risk based on these easily accessible data when patients are diagnosed with BCLC stage B/C HCC and initiate anti-tumor therapy, aiding in identifying high-risk groups for cachexia. Thus, while formulating anti-tumor treatment plans, clinicians can simultaneously strengthen nutritional support, thereby reducing the incidence of cachexia, delaying its progression, ensuring patients receive regular anti-tumor therapy, avoiding treatment interruption due to poor nutritional status, and ultimately prolonging patients’ OS and improving their quality of life.
Conclusion
This study constructed and validated a nomogram for predicting cachexia risk in BCLC stage B/C HCC patients under systemic therapy, with five routine predictors: age, intrahepatic lesion maximum size, extrahepatic metastasis, NLR, and total bile acids. It performed well, with C-indexes 0.865 (training cohort) and 0.820 (validation cohort); calibration curves and DCA confirmed consistency and clinical utility. Future multicenter studies will validate its generalizability. This tool aids early high-risk identification for timely interventions to reduce cachexia and improve prognosis.
Institutional Review Board Statement
This study has been examined and approved by the Ethics Committee of the Fifth Medical Center of Chinese PLA General Hospital on June 27, 2025 (approval number: KY-2025-6-129-1). As a retrospective study, it involved no biological sample collection or invasive interventions throughout the process, posing no anticipated harm to the subjects. Furthermore, stringent measures have been implemented to eliminate the risk of personal privacy disclosure. For these reasons, the Ethics Committee waived individual informed consent for this study.
Data Sharing Statement
The datasets generated and/or analyzed during the present study may be obtained from the corresponding author, Luyinying, upon reasonable request.
Acknowledgments
We are truly grateful to all the clinical physicians from the Hepatic Disease and Oncology Department of the Fifth Medical Center of the Chinese PLA General Hospital for their wholehearted support in collecting the clinical information of patients for this research.
Author Contributions
All authors have made significant contributions to the work of this study, encompassing any or all of the stages including study conception, design, execution, data collection, analysis, and interpretation; participated in drafting, revising, or critically reviewing the manuscript; approved the final version to be published; agreed on the journal to which the article has been submitted; and agree to be accountable for all aspects of the research work.
Funding
This study was supported by the National Natural Science Foundation of China (NO. 82272956).
Disclosure
The authors declare no conflicts of interest.
References
1. Clamon G, Byrne MM, Talbert EE. Inflammation as a therapeutic target in cancer cachexia. Cancers. 2022;14(21). doi:10.3390/cancers14215262
2. Fearon K, Strasser F, Anker SD, et al. Definition and classification of cancer cachexia: an international consensus. Lancet Oncol. 2011;12(5):489–495. doi:10.1016/S1470-2045(10)70218-7
3. Kumar NB, Kazi A, Smith T, et al. Cancer cachexia: traditional therapies and novel molecular mechanism-based approaches to treatment. Curr Treat Options Oncol. 2010;11(3–4):107–117. doi:10.1007/s11864-010-0127-z
4. Brown JL, Rosa-Caldwell ME, Lee DE, et al. Mitochondrial degeneration precedes the development of muscle atrophy in progression of cancer cachexia in tumour-bearing mice. J Cachexia Sarcopenia Muscle. 2017;8(6):926–938. doi:10.1002/jcsm.12232
5. Baracos VE, Martin L, Korc M, Guttridge DC, Fearon KCH. Cancer-associated cachexia. Nat Rev Dis Primers. 2018;4:17105. doi:10.1038/nrdp.2017.105
6. Anker MS, Holcomb R, Muscaritoli M, et al. Orphan disease status of cancer cachexia in the USA and in the European Union: a systematic review. J Cachexia Sarcopenia Muscle. 2019;10(1):22–34. doi:10.1002/jcsm.12402
7. Rich NE, Phen S, Desai N, et al. Cachexia is prevalent in patients with hepatocellular carcinoma and associated with worse prognosis. Clin Gastroenterol Hepatol. 2022;20(5):e1157–e1169. doi:10.1016/j.cgh.2021.09.022
8. Morimoto K, Uchino J, Yokoi T, et al. Impact of cancer cachexia on the therapeutic outcome of combined chemoimmunotherapy in patients with non-small cell lung cancer: a retrospective study. Oncoimmunology. 2021;10(1):1950411. doi:10.1080/2162402X.2021.1950411
9. Mariean CR, Tiuca OM, Mariean A, Cotoi OS. Cancer cachexia: new insights and future directions. Cancers. 2023;15(23). doi:10.3390/cancers15235590
10. Li XX, Liu B, Zhao YF, Jiang Y, Mao H, Peng XG. Predicting cachexia in hepatocellular carcinoma patients: a nomogram based on MRI features and body composition. Acta radiologica. 2024;65(8):898–906. doi:10.1177/02841851241261703
11. Li XX, Liu B, Zhao YF, Jiang Y, Cui Y, Peng XG. Functional liver imaging score derived from gadoxetic acid-enhanced MRI predicts cachexia and prognosis in hepatocellular carcinoma patients. Curr Med Sci. 2024;44(5):1018–1025. doi:10.1007/s11596-024-2930-y
12. Jiang Y, Huang M, Zhao Y, et al. A [(18)F]FDG PET based nomogram to predict cancer-associated cachexia and survival outcome: a multi-center study. Nutrition. 2025;129:112593. doi:10.1016/j.nut.2024.112593
13. Takaoka T, Yaegashi A, Watanabe D. Prevalence of and survival with cachexia among patients with cancer: a systematic review and meta-analysis. Adv Nutr. 2024;15(9):100282. doi:10.1016/j.advnut.2024.100282
14. Bejjani AC, Finn RS. Hepatocellular carcinoma: pick the winner-tyrosine kinase inhibitor versus immuno-oncology agent-based combinations. J Clin Oncol. 2022;40(24):2763–2773. doi:10.1200/jco.21.02605
15. Yuan Y, He W, Yang Z, et al. TACE-HAIC combined with targeted therapy and immunotherapy versus TACE alone for hepatocellular carcinoma with portal vein tumour thrombus: a propensity score matching study. Int J Surg. 2023;109(5):1222–1230. doi:10.1097/js9.0000000000000256
16. Unome S, Imai K, Aiba M, et al. Cachexia is an independent predictor of mortality in patients with hepatocellular carcinoma on systemic targeted therapy. Clin Nutr ESPEN. 2025;66:454–459. doi:10.1016/j.clnesp.2025.02.018
17. Bannangkoon K, Hongsakul K, Tubtawee T, Ina N, Chichareon P. Association of myosteatosis with treatment response and survival in patients with hepatocellular carcinoma undergoing chemoembolization: a retrospective cohort study. Sci Rep. 2023;13(1):3978. doi:10.1038/s41598-023-31184-9
18. Marrero JA, Kulik LM, Sirlin CB, et al. Diagnosis, staging, and management of hepatocellular carcinoma: 2018 practice guidance by the American association for the study of liver diseases. Hepatology. 2018;68(2):723–750. doi:10.1002/hep.29913
19. Zhou J, Sun H, Wang Z, et al. Guidelines for the diagnosis and treatment of primary liver cancer (2022 Edition). Liver Cancer. 2023;12(5):405–444. doi:10.1159/000530495
20. Clinical Guidelines Committee of Chinese College of I. Chinese clinical practice guidelines for transarterial chemoembolization of hepatocellular carcinoma (2023 edition). Zhonghua Yi Xue Za Zhi. 2023;103(34):2674–2694. doi:10.3760/cma.j.cn112137-20230630-01114
21. Liu K, Wu J, Xu Y, Li D, Huang S, Mao Y. Efficacy and safety of regorafenib with or without PD-1 Inhibitors as second-line therapy for advanced hepatocellular carcinoma in real-world clinical practice. Onco Targets Ther. 2022;15:1079–1094. doi:10.2147/ott.S383685
22. Li Y, Ma Y, Sun B, Rosenheck R, Zhang J, He H. A nomogram for predicting non-suicide self-injury in youth depression patients: a longitudinal analysis. Eur Child Adolescent Psychiatry. 2025;34(6):1959–1968. doi:10.1007/s00787-024-02603-7
23. Fountain WA, Bopp TS, Bene M, Walston JD. Metabolic dysfunction and the development of physical frailty: an aging war of attrition. GeroScience. 2024;46(4):3711–3721. doi:10.1007/s11357-024-01101-7
24. Yan W, Zhang K, Guo J, Xu L. Bile acid-mediated gut-liver axis crosstalk: the role of nuclear receptor signaling in dynamic regulation of inflammatory networks. Front Immunol. 2025;16:1595486. doi:10.3389/fimmu.2025.1595486
25. Jia F, Liu X, Liu Y. Bile acid signaling in skeletal muscle homeostasis: from molecular mechanisms to clinical applications. Front Endocrinol. 2025;16:1551100. doi:10.3389/fendo.2025.1551100
26. Abrigo J, Olguin H, Tacchi F, et al. Cholic and deoxycholic acids induce mitochondrial dysfunction, impaired biogenesis and autophagic flux in skeletal muscle cells. Biol Res. 2023;56(1):30. doi:10.1186/s40659-023-00436-3
27. Abrigo J, Olguin H, Gutierrez D, et al. Bile acids induce alterations in mitochondrial function in skeletal muscle fibers. Antioxidants. 2022;11(9). doi:10.3390/antiox11091706
28. Thibaut MM, Roumain M, Piron E, et al. The microbiota-derived bile acid taurodeoxycholic acid improves hepatic cholesterol levels in mice with cancer cachexia. Gut Microbes. 2025;17(1):2449586. doi:10.1080/19490976.2025.2449586
29. Dave S, Patel BM. Deliberation on debilitating condition of cancer cachexia: skeletal muscle wasting. Fundamental Clin Pharmacol. 2023;37(6):1079–1091. doi:10.1111/fcp.12931
30. Li L, Ling ZQ. Mechanisms of cancer cachexia and targeted therapeutic strategies. Biochimica Et Biophysica. 2024;1879(6):189208. doi:10.1016/j.bbcan.2024.189208
31. Malla J, Zahra A, Venugopal S, et al. What role do inflammatory cytokines play in cancer cachexia? Cureus. 2022;14(7):e26798. doi:10.7759/cureus.26798
32. Liu Y, Wang D, Li T, et al. The role of NLRP3 inflammasome in inflammation-related skeletal muscle atrophy. Front Immunol. 2022;13:1035709. doi:10.3389/fimmu.2022.1035709
33. Nishida A, Andoh A. The role of inflammation in cancer: mechanisms of tumor initiation, progression, and metastasis. Cells. 2025;14(7). doi:10.3390/cells14070488
34. Xie H, Wei L, Ruan G, et al. AWGC2023 cachexia consensus as a valuable tool for predicting prognosis and burden in Chinese patients with cancer. J Cachexia Sarcopenia Muscle. 2024;15(5):2084–2093. doi:10.1002/jcsm.13555
35. Zhang KL, Zhou MM, Wang KH, et al. Integrated neutrophil-to-lymphocyte ratio and handgrip strength better predict survival in patients with cancer cachexia. Nutrition. 2024;122:112399. doi:10.1016/j.nut.2024.112399
 © 2025 The Author(s). This work is published and licensed by Dove Medical Press Limited. The
full terms of this license are available at https://www.dovepress.com/terms
and incorporate the Creative Commons Attribution
- Non Commercial (unported, 4.0) License.
By accessing the work you hereby accept the Terms. Non-commercial uses of the work are permitted
without any further permission from Dove Medical Press Limited, provided the work is properly
attributed. For permission for commercial use of this work, please see paragraphs 4.2 and 5 of our Terms.
© 2025 The Author(s). This work is published and licensed by Dove Medical Press Limited. The
full terms of this license are available at https://www.dovepress.com/terms
and incorporate the Creative Commons Attribution
- Non Commercial (unported, 4.0) License.
By accessing the work you hereby accept the Terms. Non-commercial uses of the work are permitted
without any further permission from Dove Medical Press Limited, provided the work is properly
attributed. For permission for commercial use of this work, please see paragraphs 4.2 and 5 of our Terms.