")
Back to Journals » Cancer Management and Research » Volume 13
Predicting T and N Staging of Resectable Gastric Cancer According to Whole Tumor Histogram Analysis About a Non-Cartesian k-Space Acquisition DCE-MRI: A Feasibility Study
Authors Yan L, Qu J , Li J , Zhang H, Lu Y, Gao J
Received 2 July 2021
Accepted for publication 8 September 2021
Published 18 October 2021 Volume 2021:13 Pages 7951—7960
DOI https://doi.org/10.2147/CMAR.S326874
Checked for plagiarism Yes
Review by Single anonymous peer review
Peer reviewer comments 2
Editor who approved publication: Dr Sanjeev K. Srivastava
Liangliang Yan,1 Jinrong Qu,2 Jing Li,2 Hongkai Zhang,2 Yanan Lu,2 Jianbo Gao1
1The Department of Radiology, The First Affiliated Hospital of Zhengzhou University, Zhengzhou, Henan Province, People’s Republic of China; 2Department of Radiology, Affiliated Cancer Hospital of Zhengzhou University & Henan Cancer Hospital, Zhengzhou, Henan Province, People’s Republic of China
Correspondence: Jianbo Gao Tel +86 15188330092
Email [email protected]
Objective: To explore the feasibility of the whole tumor histogram analysis parameters derived from dynamic contrast-enhanced MRI (DCE-MRI) based on stack-of stars (StarVIBE) to predict T and N staging of resectable gastric cancer (GC).
Methods: Eighty-seven patients confirmed as GC by histopathology were enrolled in this prospective study. DCE-MRI were performed before surgery, and quantitative DCE parameters (Ktrans, Kep, Ve) and histogram metrics (Skewness, Kurtosis and Entropy) were measured by Omni-Kinetics software. Intraclass correlation coefficient (ICC) testing was used to determine the consistency of Ktrans, Kep and Ve values and histogram metrics values between two radiologists using Bland–Altman analysis. The quantitative DCE parameters or histogram metrics values between T stage or N stage were compared using ANOVA or Kruskal–Wallis testing. Receiver operating characteristic (ROC) analyses was performed to find out the best parameters for identifying T and N staging.
Results: There was statistical difference in Ktrans, Kep, Ve and entropy to identify T staging (P=0.015, 0.033, < 0.001, and 0.007, respectively), and in pairwise comparisons of Ve values showed statistically difference between T1+2 and T3 group (P< 0.001), T1+2 and T4 group (P< 0.001). There were statistical differences in Ve to identify N staging (P=0.041). In ROC analysis, Ve was the best parameter for identifying T staging (AUC: 0.788, the sensitivity and specificity was 0.929 and 0.578, respectively) and N staging (AUC: 0.590, the sensitivity and specificity was 0.714 and 0.899, respectively).
Conclusion: The whole tumor histogram analysis parameters derived from StarVIBE DCE-MRI may be able to quantitatively evaluate T and N staging of GC, so as to help clinical treatment decision optimization.
Keywords: magnetic resonance imaging, quantitative DCE parameters, histogram metrics, starVIBE, T and N staging, stomach neoplasms
Introduction
Gastric cancer (GC) is the fifth most common cancer globally and is responsible for the fourth most cancer death worldwide.1 The major histological type of this cancer is adenocarcinoma. Patients with clinical T1aN0M0 GC is recommended to endoscopic resection, while as cT1bN0M0- cT2N0M0 GC suitable for surgery, and cT1-2N1-3M0-cT3-4aN1-3M0 (II–III stage) GC suitable for gastrectomy and adjuvant chemotherapy, and the IV stage GC requires multi-disciplinary team (MDT) discussion to determine the best treatment plan.2 Therefore, preoperative T and N staging prediction of GC is critical in optimizing appropriate tumor treatment protocols.
Compared with other staging modalities (such as abdominal ultrasound, computed tomography, positron emission tomography), Magnetic resonance imaging (MRI) has higher accuracy and specificity for the evaluation of T staging of gastric cancer (83%, 77%–87%, respectively).3 MRI can show the hierarchical structure of the stomach wall and surrounding structure, making it easier to accurately determine the T and N staging.3 Furthermore, MRI also provides a variety of quantitative methods to evaluate GC, such as Intravoxel incoherent motion imaging (IVIM), ADC value, and quantitative dynamic contrast enhancement (DCE) parameters.4–6 Of which, quantitative DCE parameters are gradually used to evaluate T and N staging of tumor.7
In contrast to the post-processing workstations of various manufacturers that can only measure the Ktrans, Kep and Ve of lesions, the whole tumor histogram analysis parameters performed by Omni-Kinetics software (GE Healthcare, Shanghai, China) can easily extract various heterogeneous parameters from the entire tumor, thereby comprehensively assessing the biological characteristics of the tumor, which has been confirmed in esophageal cancer, glioma and ovarian cancer.8–10 But there were no literature in GC to identify whether whole tumor histogram analysis parameters could evaluate T and N staging.
The purpose of the present study was to explore the feasibility of the whole tumor histogram analysis parameters derived from DCE-MRI to predict T and N staging of GC.
Materials and Methods
Patients
After approval by our Institutional Review Board, the present prospective study was conducted between February 2019 and February 2021. All patients signed informed consent form. All results were confirmed by histopathology within one week of MRI. The inclusion criteria were newly diagnosed untreated patients with a histopathological diagnosis of adenocarcinoma; no contraindications that affect MRI and surgical examinations; good-quality MR images without severe motion artifacts. The exclusion criteria were proven non-adenocarcinoma histopathological types, such as squamous cell carcinoma, polyps, stromal tumors, etc.; received early chemotherapy; Inoperable patients whose clinical stage exceeded T4bT0M0; and poor image quality precluding accurate analysis. The study workflow diagram of patient selection is shown in Figure 1.
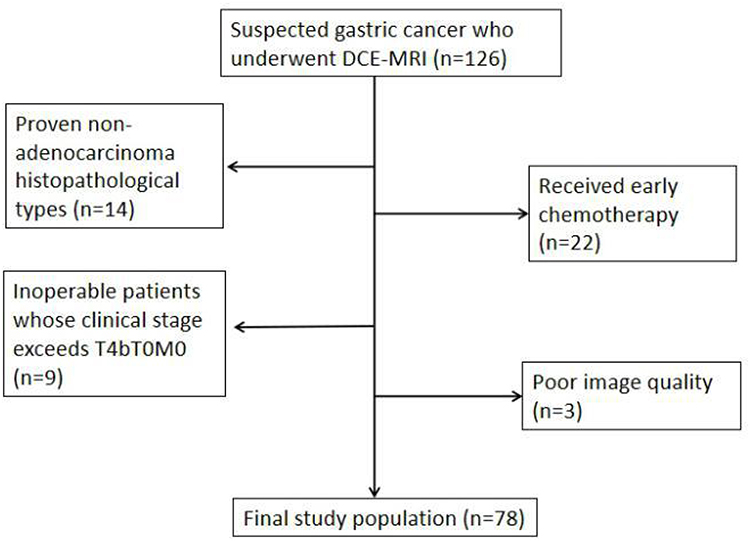 |
Figure 1 Study workflow diagram of patient selection. |
MRI Examination
All MRI scanning were performed on a 3T MR scanner (MAGNETOM Skyra, Siemens, Erlangen, Germany) with an 18-channel body coil and a 32-channel spine coil. All patients were placed in a supine position with a feet-first orientation. An automatic dual-barrel high-pressure syringe (Spectris Solaris EP, Medrad, Indiana, Pennsylvania) was used to intravenously administrate dimethylpentylamine glutarate (Consun Pharmaceutical, Guangzhou, China) at a metered volume of 0.2 mL/kg, and flow rate of 2.5 mL/s, after which 20 mL saline was administrated at the same flow rate. All patients were fasted for 6 hours prior to MRI, and 10 mg of anisodamine was administrated intramuscularly about 10 minutes before the examination, and 800–1000 mL of water was taken orally before MRI.
Scanning parameters in accordance with the standard MRI protocol included T1-weighted images (T1WI) (repetition time [TR]/echo time [TE]=4.34 ms/1.34 ms, section thickness=3 mm, field of view [FOV]=380), and T2 weighted images (T2WI) (TR/TE=4000–8000 ms/96 ms, section thickness=5.5 mm, FOV=380), diffusion-weighted imaging (DWI) (TR/TE=2600 ms/51 ms, section thickness=5.5 mm, FOV=340, b=50, 800s/mm2). For DCE imaging, a prototyped T1WI volumetric interpolated breath-hold examination (VIBE) with radial acquisition trajectory (StarVIBE) was assessed with a total of 42 stages and total acquisition time was 5min24s. StarVIBE parameters were as follows: TR/TE=3.87 ms/1.82 ms; section thickness=2.5 mm; FOV=380; flip angle=12°.
Image Analysis
The DCE-MRI data were transferred to the Omni-Kinetics software, and all data were independently analyzed by two radiologists (Y.L.L. and L.J. with 7 and 11 years of experience in radiology, respectively) who had no knowledge of the histopathological results. First, the arterial input function (AIF) was extracted by manually drawing a circular ROI on the descending aorta. Then, according to T2WI, DWI and DCE images, the range of manual delineation of the entire tumor was determined, and it was ensured that the cystic and necrotic area, surrounding gas and adipose tissue were excluded. Finally, quantitative DCE parameters (Ktrans, Kep, Ve) and histogram metrics (Skewness, Kurtosis and Entropy) were automatically obtained through the Tofts two-chamber model (Figures 2–5). Ktrans represents the volume transfer coefficient, Kep represents countercurrent rate constant, and Ve represents extracellular extravascular space (EES) volume fraction, the three reflect the permeability of tumor blood vessels and can be used to predict tumor malignancy, treatment outcome and prognosis. Skewness describes the asymmetry of the probability distribution: a completely symmetrical histogram has a skewness of 0, a histogram with a long right tail has a positive skewness, and a histogram with a long left tail has a negative skewness. Kurtosis describes the sharpness of the distribution and is a measure of the shape of the histogram: the kurtosis of a normal distribution is 0, and the kurtosis of a histogram with greater kurtosis is positive. Entropy represents the statistical measure of “irregularity” in the histogram: the value of entropy increases as the “irregularity” increases.
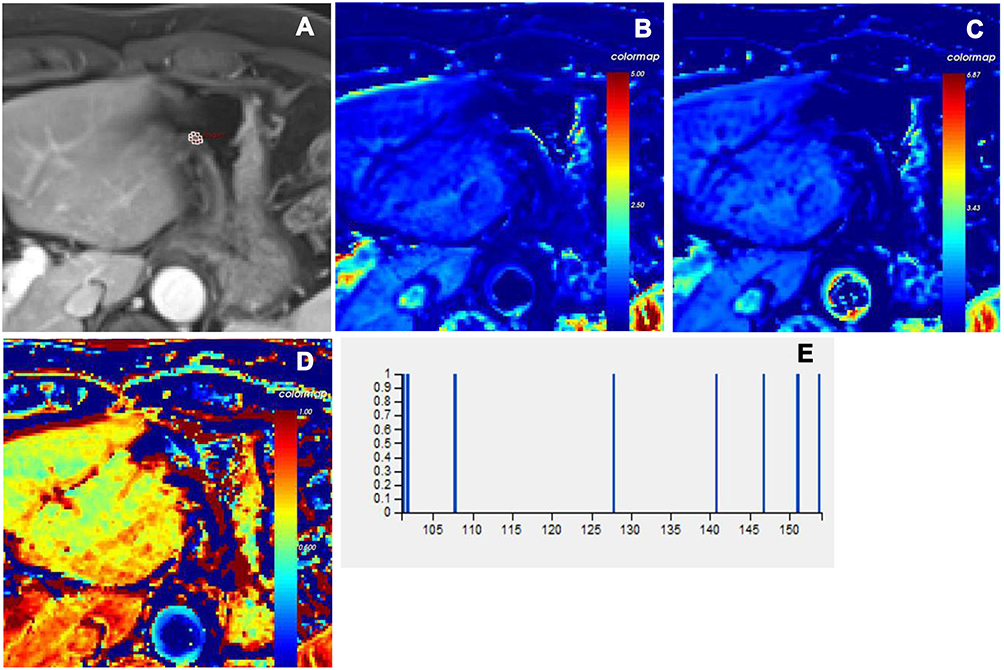 |
Figure 2 Male, 63 years old. The pathological diagnosis is intramucosal adenocarcinoma. The lesion invades the submucosa of the lesser curvature of stomach and is determined to be T1 stage. (A) ROI was manually drawn on whole lesions in late arterial phase. Corresponding parametric maps of Ktrans (B), Kep (C) and Ve (D) are created automatically. The corresponding mean values of Ktrans, Kep and Ve are 0.587 /min, 0.491 /min and 0.970, respectively. The histogram of tumor (E) demonstrates that the skewness, kurtosis and entropy are -0.899, 0.207 and 2.807, respectively. |
 |
Figure 3 Male, 65 years old. The pathological diagnosis is poorly differentiated adenocarcinoma. The lesion invades the muscular layer of the cardiac wall and is determined to be T2 stage. (A) ROI was manually drawn on whole lesions in late arterial phase. Corresponding parametric maps of Ktrans (B), Kep (C) and Ve (D) are created automatically. The corresponding mean values of Ktrans, Kep and Ve are 0.570 /min, 1.418 /min and 0.402, respectively. The histogram of tumor (E) demonstrates that the skewness, kurtosis and entropy are 0.315, 0.147 and 5.595, respectively. |
 |
Figure 4 Female, 57 years old. The pathological diagnosis is poorly differentiated adenocarcinoma. The lesion invades the subserosa of the lesser curvature of the stomach and is determined to be T3 stage. (A) ROI was manually drawn on whole lesions in late arterial phase. Corresponding parametric maps of Ktrans (B), Kep (C) and Ve (D) are created automatically. The corresponding mean values of Ktrans, Kep and Ve are 0.818 /min, 1.298 /min and 0.551, respectively. The histogram of tumor (E) demonstrates that the skewness, kurtosis and entropy are -0.030, 0.139 and 6.003, respectively. |
 |
Figure 5 Male, 51 years old. The pathological diagnosis is adenocarcinoma. The lesion invades the serosal layer of the lesser curvature of the stomach and is determined to be T4a stage. (A) ROI was manually drawn on whole lesions in late arterial phase. Corresponding parametric maps of Ktrans (B), Kep (C) and Ve (D) are created automatically. The corresponding mean values of Ktrans, Kep and Ve are 0.159 /min, 0.117 /min and 0.327, respectively. The histogram of tumor (E) demonstrates that the skewness, kurtosis and entropy are 0.012, -0.142 and 6.104, respectively. |
Determination of T and N Staging
The postoperative histopathology and American Joint Committee on Cancer/Union for International Cancer Control (AJCC/UICC) eighth edition was the evaluation standard. In the T1 stage, the abnormally tissue of the stomach wall does not exceed the mucosa or submucosa; in the T2 stage, the abnormally tissue invades the muscularis propria; in the T3 stage, the abnormally tissue penetrates the muscle layer and invades the subserosal tissue; and in the T4 stage, the abnormallyt issue breaks through the serosal layer or invades organs adjacent to the stomach. Lymph nodes with a short diameter greater than 10 mm or having circular enhancement are the criteria for judging a positive metastatic status of the gastric lymph nodes. N0, no regional lymph node metastasis; N1, 1 or 2 regional lymph node metastases; N2, 3 to 6 regional lymph node metastases; N3, more than 7 regional lymph node metastases.
Since there were very few cases of T1 and N3 (only 5 and 2 cases, respectively), this study combined the T1 and T2 stages into the T1+2 stage, and the N2 and N3 stages into the N2+3 stage.
Statistical Analysis
Statistical analysis was performed with SPSS 22.0 (Statistical Product and Service Solutions, IBM Corp, Armonk, NY, USA). The Ktrans, Kep, Ve and histogram metrics values were expressed as mean and standard deviation. Intraclass correlation coefficient (ICC) testing was used to determine the consistency of Ktrans, Kep and Ve values and histogram metrics results between two radiologists using Bland–Altman analysis. ICC values < 0.40 were considered to indicate poor consistency; 0.41–0.75 were considered to indicate moderate consistency; and > 0.75 was considered to indicate good consistency. The quantitative DCE parameters or histogram metrics values between T stage or N stage were compared using ANOVA or Kruskal–Wallis testing, and pairwise comparisons were done by the least significant difference (LSD) post-hoc testing. ROC analysis was performed to identify the best parameters for predicting T and N staging. The area under the curve (AUC) value 0.85–1 were good diagnostic performance, 0.70–0.85 were moderate diagnostic performance, 0.50–070 were poor diagnostic performance. P < 0.05 was considered statistically significant.
Results
Of the 126 patients, 78 patients were evaluated in the present study. The clinicopathological characteristics of the 78 GC cases are listed in Table 1 and a consistency analysis of the quantitative DCE parameters and histogram metrics measured by the two radiologists is shown in Table 2. The ICC values show good consistency (ICC value: 0.792, 95% CI: 0.711, 0.853). Figures 2–5 shows that the determination of ROI in different T stages of GC patients, and corresponding Ktrans, Kep, Ve maps and histogram.
 |
Table 1 The Clinicopathological Characteristics of Gastric Cancer |
 |
Table 2 The Consistency Analysis of Quantitative DCE Parameters and Histogram Metrics Results Measured by Two Radiologists |
There were statistically difference in Ktrans, Kep, Ve and entropy to identify T staging (P=0.015, 0.033, <0.001, and 0.007, respectively), and in pairwise comparisons of Ve, the Ve values showed statistically difference between T1+2 and T3 group (P<0.001), T1+2 and T4 group (P<0.001), and the Ve values of T3 and T4 were higher than that of T1+2 (Tables 3 and 4). The other quantitative DCE parameters and histogram metrics were not statistically difference in identifying T staging (all P>0.05).
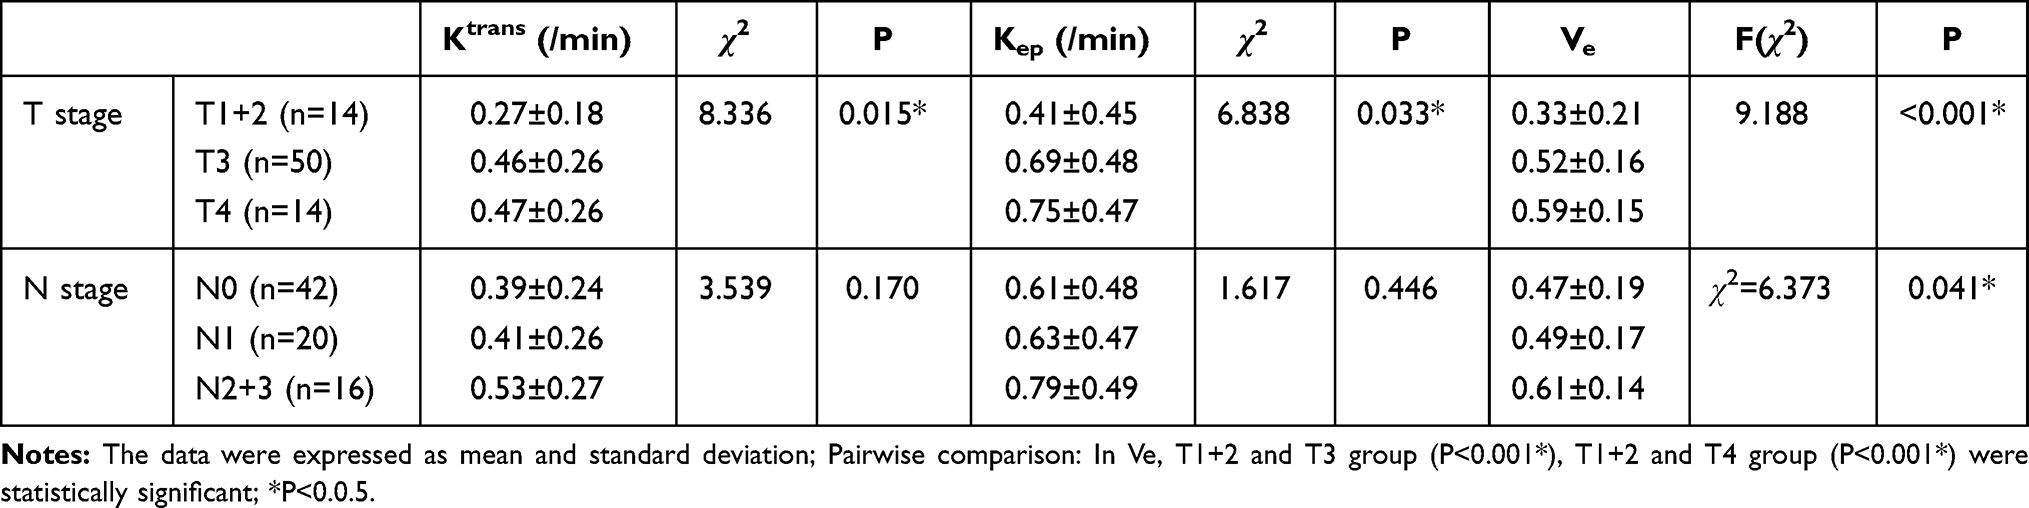 |
Table 3 Quantitative DCE Parameters to Evaluate T and N Staging |
 |
Table 4 Histogram Metrics to Evaluate T and N Staging |
There were statistically differences in Ve to identify N staging (P=0.041) (Table 3). The other quantitative DCE parameters and histogram metrics were not statistically difference in identifying N staging (all P>0.05).
In ROC analysis, Ve was the best parameter for identifying T staging (AUC: 0.788, the sensitivity and specificity was 0.929 and 0.578, respectively) and N staging (AUC: 0.590, the sensitivity and specificity was 0.714 and 0.899, respectively) (Table 5).
 |
Table 5 Diagnostic Performance of Whole Tumor Histogram Analysis Parameters Derived from DCE-MRI for Discriminating T and N Staging |
Discussion
In this study, quantitative DCE parameters and histogram metrics derived from DCE-MRI were used to predict T and N staging of GC. Our study also found that Ktrans, Kep, Ve and entropy might useful in predicting T staging, and Ve might useful in predicting N staging. In addition, Ve might the best parameter for identifying T and N staging.
This study showed that Ktrans, Kep might predict T staging. This was the same with some studies in nasopharyngeal cancer, oral squamous cell carcinoma, esophageal cancer, and rectal cancer.8,11–13 Ktrans, Kep represented the transfer rate of contrast agent between plasma and EES of tumor, usually Ktrans was related to blood flow, vascular permeability and the permeability surface of microcirculation, and Kep was related to vascular permeability.14 This study found that the Ktrans and Kep values of the higher T stage GC were greater than that of the lower T stage GC, indicating that the more malignant GC had higher microvascular permeability. The possible mechanism was that the higher T stage GC might have the higher expression of vascular endothelial growth factor (VEGF), which could induce vascular endothelial cells to divide and enhance microvascular permeability.15,16
The present study showed that Ve might identify T staging. This was consistent with most studies in nasopharyngeal carcinoma, GC, oesophageal carcinoma, rectal cancer and cervical carcinoma.7,8,13,17,18 The Ve value of T3 and T4 stage was higher than that of T1+2 stage, indicating that as the degree of malignancy increased, EES volume fraction also increased, so more intravascular fluid entered the EES to ensure adequate nutrition and oxygen supply for the tumor.8 In addition, this study found that Ve is the best parameter for identifying T staging (accuracy is 0.788), which is better than CT and ultrasound (accuracies are 0.715, 0.678, respectively).3
This study showed that entropy might predict T staging, there are similar reports for esophageal cancer.8 Entropy reflects the heterogeneity within the tumor. Entropy gradually increased with the increase of T stage, indicating that the heterogeneous components of the tumor (ischemic necrosis, neovascularization) increased with the increase of T stage.19
This study found that Ve can identify N staging. This has been confirmed in rectal cancer, head and neck squamous cell carcinoma, and cervical cancer.20–22 The possible mechanism was that the perigastric lymph nodes were abundant vascularity, and the vascular system communicated with the lymphatic vessels through the high-endothelial venules (HEVs).23 Once the tumor cells escaped from the primary tumor, they would enter the perigastric lymph node via HEVs, leading to lymph node metastasis. As the malignancy of the primary tumor increased, the E-cadherin in the tumor would decrease, resulting in a decrease in the adhesion of tumor cells, and tumor cells would fall off into the EES.24 As the malignancy of the tumor increased, it also leaded to an increase in EES and the permeability of the neovascular wall. Therefore, the shed tumor cells would enter the blood vessel and reach the perigastric lymph node through HEVs, leading to lymph node metastasis.
This study used the StarVIBE sequence to reduce breathing and motility artifacts. The StarVIBE sequence used the radial stack-of-star trajectory to provide uniform angular coverage of k-space, allowing the reconstruction of the image at an arbitrary timepoint with minimal temporal blurring, thereby making motion insensitivity.25 In addition, the patients were administrated anisodamine intramuscularly before the MRI scan to reduce stomach motility. The above was the basis for this study to obtain DCE-MRI data. Nevertheless, due to serious artifacts, there were still 3 cases were not finally enrolled in this study.
This study has some limitations. First, we combined T1 and T2 stage, N2 and N3 stage due to the small cases, which may bring some deviations. Second, we only analyzed the characteristics of gastric adenocarcinoma, and the other pathological types were not enrolled in this study. Third, we only analyzed a few representative parameters of the whole tumor histogram parameters, and the other parameters, such as percentile, maximum and minimum were not analyzed, because the parameters we analyzed could fully explain the heterogeneity of GC microcirculation to a certain extent.
Conclusions
This study revealed that the whole tumor histogram analysis parameters derived from StarVIBE DCE-MRI may be able to quantitatively evaluate T and N staging of GC, so as to help clinical treatment decision optimization.
Abbreviations
AJCC/UICC, American Joint Committee on Cancer/Union for International Cancer Control; AIF, arterial input function; AUC, area under the curve; DCE-MRI, dynamic contrast-enhanced magnetic resonance imaging; EES, extracellular extravascular space; GC, Gastric cancer; HEVs, high-endothelial venules; ICC, intraclass correlation coefficient; IVIM, intravoxel incoherent motion imaging; LSD, least significant difference; MDT, multi-disciplinary team; ROC, receiver operating characteristic; StarVIBE, stack-of stars; VEGF, vascular endothelial growth factor; VIBE, volumetric interpolated breath-hold examination.
Data Sharing Statement
The data that support the findings of this study are available from the corresponding author upon reasonable request.
Ethics Approval and Consent to Participate
This study was conducted in accordance with the Declaration of Helsinki. The study was approved by the Institutional Review Board (Ethic’s committee of the Zhengzhou University, 20181216). Informed consent was signed for all patients.
Acknowledgment
We thank the Department of Pathology, Affiliated Cancer Hospital of Zhengzhou University for providing us with the data of tissue.
Funding
This study has received funding by Henan Province Medical Science and Technology Research Program Provincial Department to jointly build key projects (No. SBGJ202002021; No. SBGJ202003011), Special funding of the Henan Health Science and Technology Innovation Talent Project (No. YXKC2020011), and Henan Province focuses on research and development and promotion (No. 212102310133; No. 202102310736).
Disclosure
The authors report no conflicts of interest in this work.
References
1. Sung H, Ferlay J, Siegel RL, et al. Global cancer statistics 2020: GLOBOCAN estimates of incidence and mortality worldwide for 36 cancers in 185 countries. CA Cancer J Clin. 2021;71(3):209–249. doi:10.3322/caac.21660
2. Wang FH, Shen L, Li J, et al. The Chinese Society of Clinical Oncology (CSCO): clinical guidelines for the diagnosis and treatment of gastric cancer. Cancer Commun. 2019;39(1):10. doi:10.1186/s40880-019-0349-9
3. Seevaratnam R, Cardoso R, McGregor C, et al. How useful is preoperative imaging for tumor, node, metastasis (TNM) staging of gastric cancer? A meta-analysis. Gastric Cancer. 2012;15(Suppl 1):S3–S18. doi:10.1007/s10120-011-0069-6
4. Huo X, Yuan K, Shen Y, et al. Clinical value of magnetic resonance imaging in preoperative T staging of gastric cancer and postoperative pathological diagnosis. Oncol Lett. 2014;8(1):275–280. doi:10.3892/ol.2014.2135
5. Song XL, Kang HK, Jeong GW, et al. Intravoxel incoherent motion diffusion-weighted imaging for monitoring chemotherapeutic efficacy in gastric cancer. World J Gastroenterol. 2016;22(24):5520–5531. doi:10.3748/wjg.v22.i24.5520
6. Zhang A, Song J, Ma Z, Chen T. Combined dynamic contrast-enhanced magnetic resonance imaging and diffusion-weighted imaging to predict neoadjuvant chemotherapy effect in FIGO stage IB2-IIA2 cervical cancers. Radiol Med. 2020;125(12):1233–1242. doi:10.1007/s11547-020-01214-x
7. Joo I, Lee JM, Han JK, Yang HK, Lee HJ, Choi BI. Dynamic contrast-enhanced MRI of gastric cancer: correlation of the perfusion parameters with pathological prognostic factors. J Magn Reson Imaging. 2015;41(6):1608–1614. doi:10.1002/jmri.24711
8. Chen YL, Li R, Chen TW, et al. Whole-tumour histogram analysis of pharmacokinetic parameters from dynamic contrast-enhanced MRI in resectable oesophageal squamous cell carcinoma can predict T-stage and regional lymph node metastasis. Eur J Radiol. 2019;112:112–120. doi:10.1016/j.ejrad.2019.01.012
9. Hu Y, Chen Y, Wang J, Kang JJ, Shen DD, Jia ZZ. Non-invasive estimation of glioma IDH1 mutation and VEGF expression by histogram analysis of dynamic contrast-enhanced MRI. Front Oncol. 2020;10:593102. doi:10.3389/fonc.2020.593102
10. He M, Song Y, Li H, et al. Histogram analysis comparison of monoexponential, advanced diffusion-weighted imaging, and dynamic contrast-enhanced MRI for differentiating borderline from malignant epithelial ovarian tumors. J Magn Reson Imaging. 2020;52(1):257–268. doi:10.1002/jmri.27037
11. Liu L, Hu L, Zeng Q, et al. Dynamic contrast-enhanced MRI of nasopharyngeal carcinoma: correlation of quantitative dynamic contrast-enhanced magnetic resonance imaging (DCE-MRI) parameters with hypoxia-inducible factor 1alpha expression and tumor grade/stage. Ann Palliat Med. 2021;10(2):2238–2253. doi:10.21037/apm-21-303
12. Chikui T, Kitamoto E, Kami Y, et al. Dynamic contrast-enhanced MRI of oral squamous cell carcinoma: a preliminary study of the correlations between quantitative parameters and the clinical stage. Br J Radiol. 2015;88(1050):20140814. doi:10.1259/bjr.20140814
13. Zhu Y, Zhou Y, Zhang W, et al. Value of quantitative dynamic contrast-enhanced and diffusion-weighted magnetic resonance imaging in predicting extramural venous invasion in locally advanced gastric cancer and prognostic significance. Quant Imaging Med Surg. 2021;11(1):328–340. doi:10.21037/qims-20-246
14. Tofts PS, Brix G, Buckley DL, et al. Estimating kinetic parameters from dynamic contrast-enhanced T(1)-weighted MRI of a diffusable tracer: standardized quantities and symbols. J Magn Reson Imaging. 1999;10(3):223–232. doi:10.1002/(SICI)1522-2586(199909)10:3<223::AID-JMRI2>3.0.CO;2-S
15. Park DJ, Yoon C, Thomas N, et al. Prognostic significance of targetable angiogenic and growth factors in patients undergoing resection for gastric and gastroesophageal junction cancers. Ann Surg Oncol. 2014;21(4):1130–1137. doi:10.1245/s10434-013-3429-0
16. Dvorak HF. Vascular permeability factor/vascular endothelial growth factor: a critical cytokine in tumor angiogenesis and a potential target for diagnosis and therapy. J Clin Oncol. 2002;20(21):4368–4380. doi:10.1200/JCO.2002.10.088
17. Zheng D, Chen Y, Chen Y, et al. Dynamic contrast-enhanced MRI of nasopharyngeal carcinoma: a preliminary study of the correlations between quantitative parameters and clinical stage. J Magn Reson Imaging. 2014;39(4):940–948. doi:10.1002/jmri.24249
18. Yeo DM, Oh SN, Jung CK, et al. Correlation of dynamic contrast-enhanced MRI perfusion parameters with angiogenesis and biologic aggressiveness of rectal cancer: preliminary results. J Magn Reson Imaging. 2015;41(2):474–480. doi:10.1002/jmri.24541
19. Brurberg KG, Gaustad JV, Mollatt CS, Rofstad EK. Temporal heterogeneity in blood supply in human tumor xenografts. Neoplasia. 2008;10(7):727–735. doi:10.1593/neo.08388
20. Yu XP, Wen L, Hou J, Wang H, Lu Q. Discrimination of metastatic from non-metastatic mesorectal lymph nodes in rectal cancer using quantitative dynamic contrast-enhanced magnetic resonance imaging. J Huazhong Univ Sci Technol Med Sci. 2016;36(4):594–600. doi:10.1007/s11596-016-1631-6
21. Yan S, Wang Z, Li L, et al. Characterization of cervical lymph nodes using DCE-MRI: differentiation between metastases from SCC of head and neck and benign lymph nodes. Clin Hemorheol Microcirc. 2016;64(2):213–222. doi:10.3233/CH-162065
22. Wu Q, Shi D, Dou S, et al. Radiomics analysis of multiparametric MRI evaluates the pathological features of cervical squamous cell carcinoma. J Magn Reson Imaging. 2019;49(4):1141–1148. doi:10.1002/jmri.26301
23. Willard-Mack CL. Normal structure, function, and histology of lymph nodes. Toxicol Pathol. 2006;34(5):409–424. doi:10.1080/01926230600867727
24. Na TY, Schecterson L, Mendonsa AM, Gumbiner BM. The functional activity of E-cadherin controls tumor cell metastasis at multiple steps. Proc Natl Acad Sci U S A. 2020;117(11):5931–5937. doi:10.1073/pnas.1918167117
25. Li HH, Zhu H, Yue L, et al. Feasibility of free-breathing dynamic contrast-enhanced MRI of gastric cancer using a golden-angle radial stack-of-stars VIBE sequence: comparison with the conventional contrast-enhanced breath-hold 3D VIBE sequence. Eur Radiol. 2018;28(5):1891–1899. doi:10.1007/s00330-017-5193-1
 © 2021 The Author(s). This work is published and licensed by Dove Medical Press Limited. The full terms of this license are available at https://www.dovepress.com/terms.php and incorporate the Creative Commons Attribution - Non Commercial (unported, v3.0) License.
By accessing the work you hereby accept the Terms. Non-commercial uses of the work are permitted without any further permission from Dove Medical Press Limited, provided the work is properly attributed. For permission for commercial use of this work, please see paragraphs 4.2 and 5 of our Terms.
© 2021 The Author(s). This work is published and licensed by Dove Medical Press Limited. The full terms of this license are available at https://www.dovepress.com/terms.php and incorporate the Creative Commons Attribution - Non Commercial (unported, v3.0) License.
By accessing the work you hereby accept the Terms. Non-commercial uses of the work are permitted without any further permission from Dove Medical Press Limited, provided the work is properly attributed. For permission for commercial use of this work, please see paragraphs 4.2 and 5 of our Terms.