Back to Journals » International Journal of Nanomedicine » Volume 17
Predicting Nanoparticle Delivery to Tumors Using Machine Learning and Artificial Intelligence Approaches
Authors Lin Z ![]() , Chou WC
, Chou WC ![]() , Cheng YH, He C
, Cheng YH, He C ![]() , Monteiro-Riviere NA
, Monteiro-Riviere NA ![]() , Riviere JE
, Riviere JE
Received 14 October 2021
Accepted for publication 10 March 2022
Published 24 March 2022 Volume 2022:17 Pages 1365—1379
DOI https://doi.org/10.2147/IJN.S344208
Checked for plagiarism Yes
Review by Single anonymous peer review
Peer reviewer comments 3
Editor who approved publication: Professor Lei Yang
Zhoumeng Lin,1– 4,* Wei-Chun Chou,1– 4,* Yi-Hsien Cheng,3,4 Chunla He,5 Nancy A Monteiro-Riviere,6,7 Jim E Riviere7,8
1Department of Environmental and Global Health, College of Public Health and Health Professions, University of Florida, Gainesville, FL, USA; 2Center for Environmental and Human Toxicology, University of Florida, Gainesville, FL, USA; 3Institute of Computational Comparative Medicine, Kansas State University, Manhattan, KS, USA; 4Department of Anatomy and Physiology, College of Veterinary Medicine, Kansas State University, Manhattan, KS, USA; 5Department of Biostatistics, College of Public Health and Health Professions, University of Florida, Gainesville, FL, USA; 6Nanotechnology Innovation Center of Kansas State, Kansas State University, Manhattan, KS, USA; 7Center for Chemical Toxicology Research and Pharmacokinetics, North Carolina State University, Raleigh, NC, USA; 8 1Data Consortium, Kansas State University, Olathe, KS, USA
*These authors contributed equally to this work
Correspondence: Zhoumeng Lin, Department of Environmental and Global Health, College of Public Health and Health Professions, University of Florida, 1225 Center Dr., Gainesville, FL, 32610, USA, Tel +1 352-273-6160, Email [email protected]
Background: Low delivery efficiency of nanoparticles (NPs) to the tumor is a critical barrier in the field of cancer nanomedicine. Strategies on how to improve NP tumor delivery efficiency remain to be determined.
Methods: This study analyzed the roles of NP physicochemical properties, tumor models, and cancer types in NP tumor delivery efficiency using multiple machine learning and artificial intelligence methods, using data from a recently published Nano-Tumor Database that contains 376 datasets generated from a physiologically based pharmacokinetic (PBPK) model.
Results: The deep neural network model adequately predicted the delivery efficiency of different NPs to different tumors and it outperformed all other machine learning methods; including random forest, support vector machine, linear regression, and bagged model methods. The adjusted determination coefficients (R2) in the full training dataset were 0.92, 0.77, 0.77 and 0.76 for the maximum delivery efficiency (DEmax), delivery efficiency at 24 h (DE24), at 168 h (DE168), and at the last sampling time (DETlast). The corresponding R2 values in the test dataset were 0.70, 0.46, 0.33 and 0.63, respectively. Also, this study showed that cancer type was an important determinant for the deep neural network model in predicting the tumor delivery efficiency across all endpoints (19– 29%). Among all physicochemical properties, the Zeta potential and core material played a greater role than other properties, such as the type, shape, and targeting strategy.
Conclusion: This study provides a quantitative model to improve the design of cancer nanomedicine with greater tumor delivery efficiency. These results help to improve our understanding of the causes of low NP tumor delivery efficiency. This study demonstrates the feasibility of integrating artificial intelligence with PBPK modeling approaches to study cancer nanomedicine.
Keywords: artificial intelligence, machine learning, physiologically based pharmacokinetic modeling, nanomedicine, drug delivery, nanotechnology
Graphical Abstract:

Introduction
Global Cancer Statistics estimated that almost 10 million deaths occurred worldwide due to cancer in 2020.1 The treatment of cancer remains a challenge. Traditional small molecule-based chemotherapy has limitations; such as adverse side effects, low therapeutic indices, low bioavailability, high-dose requirements, lack of specificity, and development of multi-drug resistance.2 Recent advances in nanotechnology enabled nanoparticle (NP)-based drug formulations to be designed with superior properties compared to traditional small molecule chemotherapy, including high drug loading, specific targeting/delivery, and the ability to regulate the release of the anticancer drug in a controlled or sustained manner.3 During the last 30 years, many nanomedicines were designed and tested to be effective in reducing the size of various tumor types in laboratory animals,4,5 but only a limited number of nanomedicines have been translated to clinical success and approved by the United States Food and Drug Administration (US FDA) or European Medicines Agency (EMA).6 Low clinical translation of animal results to humans has become a major obstacle in the field of cancer nanomedicine.
The low animal-to-human translation of cancer nanomedicines have been, in part, attributed to two main reasons: (1) a lack of physiologically based models that can extrapolate pharmacokinetic and biodistribution results of NPs from animals to humans,7–9 and (2) the low delivery efficiency observed for NPs to the tumor site (~0.7% of median injected dose).4,5,10 To address the former issue, physiologically based pharmacokinetic (PBPK) models were developed to simulate the biodistribution of different NPs in healthy rodents and humans.11–20 Recently, one of these models developed by our group was extrapolated to tumor-bearing mice. This model was calibrated with hundreds of datasets obtained from different types of NPs in different tumor types.5 This model was used to predict the delivery efficiencies of different NPs at different times (eg, 24 and 168 h) after intravenous (IV) injection in tumor-bearing mice (this dataset is referred to as “Nano-Tumor Database” in this manuscript). To address the issue of low tumor delivery efficiency, it is essential to determine the relationship between the physicochemical properties and the tumor delivery efficiency of the NPs. Previous studies attempted to use simple multiple linear regression analysis to determine the roles of the physicochemical properties in NP tumor delivery efficiency.4,5 Although some statistically significant correlations were identified, the extent of these correlations were low (eg, the determination coefficients R2 values were around 0.3 to 0.5). Therefore, it is important to address this critical limitation since the role of the physicochemical properties in NP tumor delivery efficiency are essential for the proper design to improve the delivery efficiency of cancer nanomedicines.
In recent years, due to the rapid growth in computational power, the availability of a large amount of data in various databases, and the development of sophisticated data analysis algorithms, multiple machine learning (ML), and artificial intelligence (AI) methods are available to help predict the absorption, distribution, metabolism, and excretion (ADME) properties, as well as the toxicity of chemicals or NPs.21–24 A summary of the basic characteristics of commonly used methods (also the methods used in this study) is provided in Table 1. Among these methods, multiple studies suggest that artificial neural networks are more robust than linear regression because they can process large datasets more efficiently, work with incomplete data, handle both linear and nonlinear processes and identify new relationships not inputted by the user.25–27 A recent report showed that a deep neural network (DNN) model (deep learning [DL] model) could be used to predict the biodistribution of NPs based on their surface chemistry in healthy rats.28 However, the use of ML or AI methods has not been applied to predict the biodistribution of NPs in tumor-bearing animals or in cancer patients.
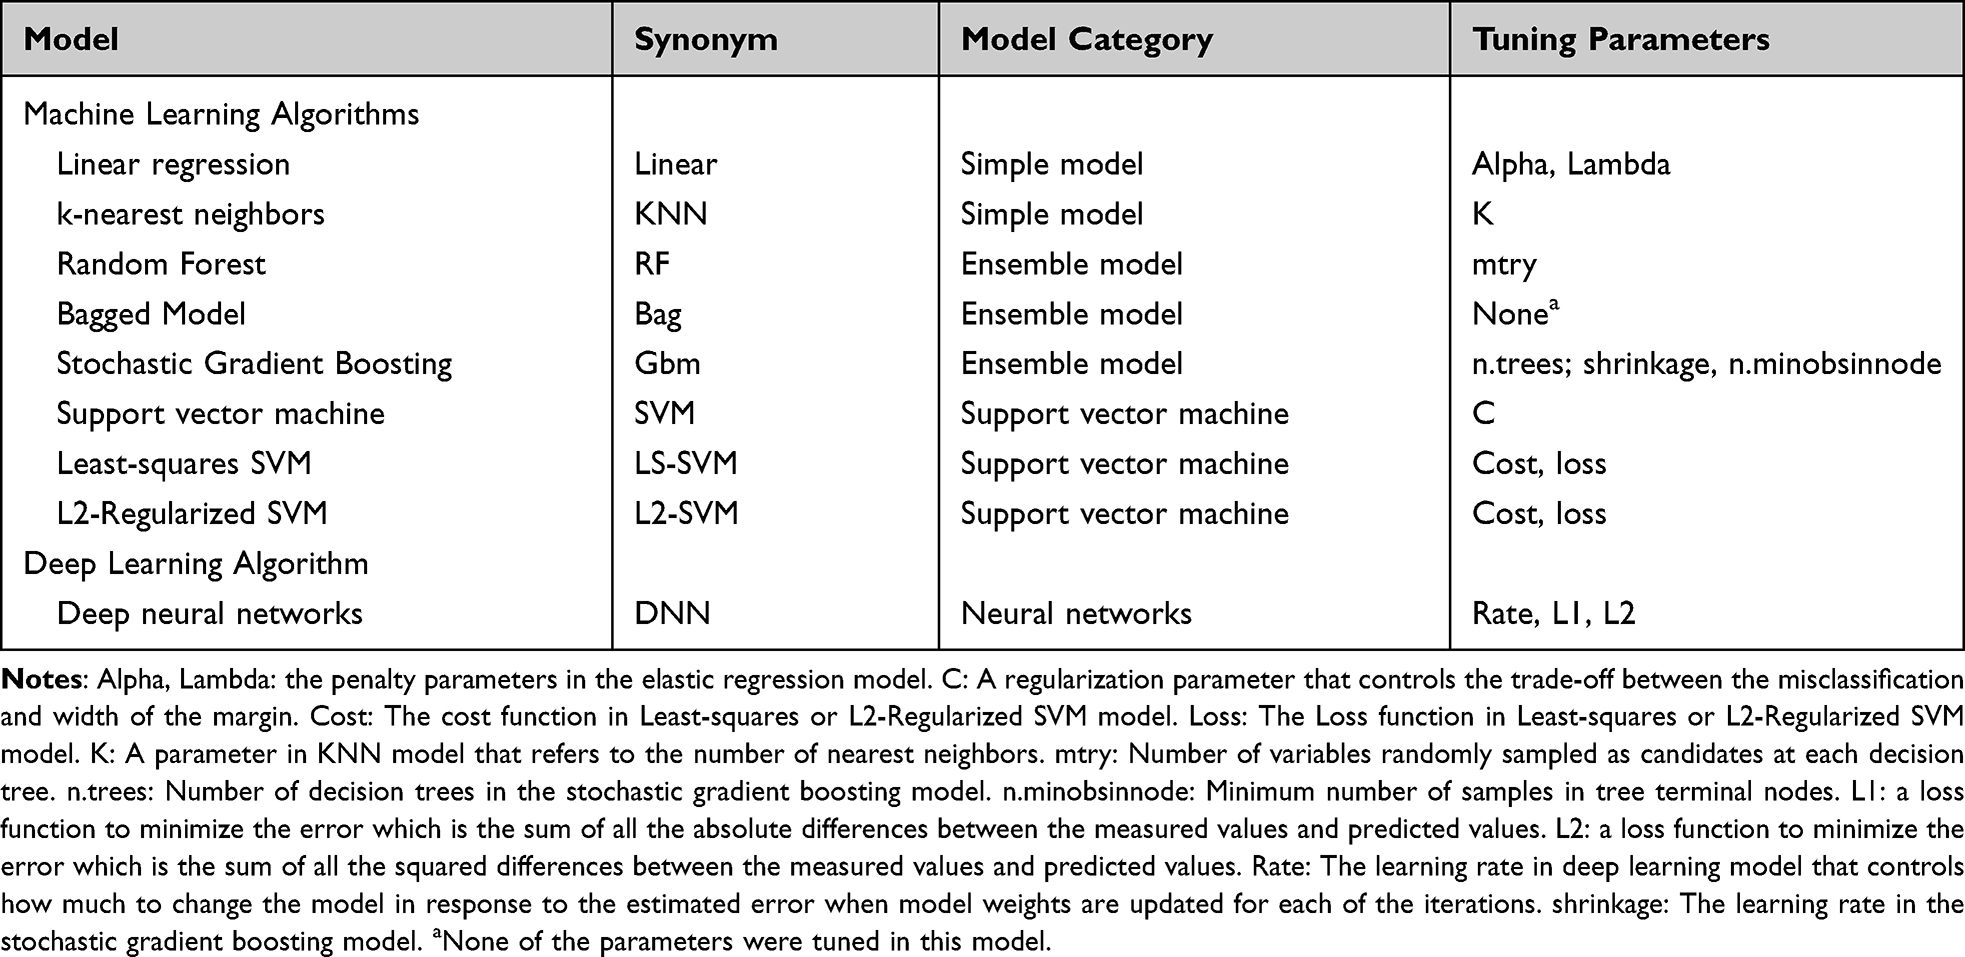 |
Table 1 Summary of Modeling Algorithms Used in This Study |
The objective of this study was to determine the roles of the physicochemical properties, tumor models, and cancer types in the tumor delivery efficiency of NPs. We hypothesized that more sophisticated ML and DNN computational methods outperform linear regression in the determination of the relationship between the physicochemical properties and the tumor delivery efficiency of NPs, with the DNN model having the best performance. The present analysis was based on our published Nano-Tumor Database that contains 376 datasets from different types of NPs in tumor-bearing mice.5 This study extends our earlier work5 by providing a better quantitative model based on the DNN approaches, which can aid in the design of new cancer nanomedicines with a higher tumor delivery efficiency. This study also provides valuable insights into the relative contributions of different physicochemical properties of NPs on tumor delivery efficiency. Another novelty of this study is that it demonstrates PBPK modeling can be integrated with ML and AI methods, and the PBPK-based supervised DNN method can be used to predict the delivery efficiency of NPs to different tumors in animals and serves as a basis for applying this approach to cancer patients.
Materials and Methods
Datasets and Data Preprocessing
In our earlier study,5 we estimated delivery efficiencies (DE) of NPs to the tumor at 24 h (DE24), 168 h (DE168) and last sampling time points (DETlast), as well as the maximum DE (DEmax) after IV administration in tumor-bearing mice using PBPK models based on the Nano-Tumor Database consisting of 376 datasets covering a wide range of cancer nanomedicines published from 2005 to 2018. Multiple variables that might influence the tumor delivery were included in this database, including the physicochemical properties of NPs [eg, log-transformed hydrodynamic diameter (Size), original value of Zeta potential (ZP), shape, core material (MAT), type of NPs (Type)], tumor therapy strategies such as the targeting strategies (TS), cancer types (CT) and tumor model (TM), etc. The hydrodynamic diameter was log-transformed because its values had a wide range and were not normally distributed. By leveraging the earlier work, the database was reorganized by filtering the missing data for the development of ML and DL models. The symbols and further explanation for all the variables in the Nano-Tumor Database are provided in Table 2.
 |
Table 2 List of Variables and Its Levels/Values in the Tumor-Nano Database |
In the data preprocessing step, both categorical and numeric data were included in the database, so two different data preprocessing techniques were used including one-hot encoding and feature scaling were applied to the data to allow it to be recognized by the ML and DL models. For the categorical variables, the data were one-hot encoded by splitting variables into different columns with its own encoded binary string to impose an artificial ordering on the variables that may have implications for the ML and DL models.29 For numerical variables, the feature scaling technique was normalized to the value to center around the mean with a unit standard deviation to aid the model optimization efficiency.30 The one-hot encoding and feature scaling were conducted by the function dummyVars and preProcess, respectively from R package caret.31
Feature Selection
To improve the model learning performance, the feature selection is essential before the model development. In this study, the low-variation feature filtering algorithm and stepwise regression selection were used to select the input features. The low-variation feature filtering algorithm was used to filter out the identical or almost identical features in the data set through the set-up threshold values. This method provided procedure to eliminate the irrelevant and redundant variables with low variance and to have less impact on the response variable. The low-variation feature filtering algorithm was executed by the nearZeroVar function in R package caret (version 6.0–86),31 followed by the stepwise regression technique via the function step in R package stats. Stepwise regression is a statistical approach to build a model by adding or removing variables based on a series of the test statistics of the estimated coefficients, which was used to identify the smallest set of features that had a significant impact to the response variable in the regression model.
Model Development
A total of 9 modeling algorithms were applied in this study. These algorithms can be categorized into four classes including classic models, ensemble models, support vector machines (SVMs) and neural networks (Table 1). Two classic models including the simple linear regression (LR) and k-nearest neighbors (KNN) were used as the simple ML algorithms. Three decision tree algorithms, including Random Forest (RF), Bagged model (Bag), and Gradient boosting model (Gbm), were used as ensemble models. For SVMs, three versions of the SVM models based on the linear basis kernel were adopted, including regular SVM (R-SVM), least-squared (LS-SVM) and L2 Regularized (L2-SVM) models. These algorithms were implemented in R software (Version 4.02) with ML packages such as kernlab (version 0.9–25),32 the randomForest (version 4.6–12),33 and the xgboost (version 0.4–4)34 for model construction. The random search method35 implemented in the R package caret was applied to optimize the hyperparameters for each ML model.
For the artificial neural networks, a DL neural network was constructed to predict the delivery efficiencies of cancer nanomedicines. DL was conducted through the R package “h2o” (Version 3.32.0.5), which is a R interface for a multilayer feedforward neural network model.36 Five dense layers (three hidden layers) were included in the architecture of the DL model. Three hidden layers comprised [512, 256, 128], [480, 240, 120], [512, 128, 64] and [180, 90, 45] nodes were used for the predictions of DEmax, DE24, DE168 and DETlast, respectively. The ReLu was used as an activation function to perform non-linear transformations.37 Using the training dataset, the learning rate and the regulation function with L1 [ie, Lasso Regression] and L2 [ie, Ridge Regression] was optimized. The Adam and root mean square error (RMSE) were used as optimizers and loss functions to compile the DL model in this study. The dropout function38 and early stopping rule39 were applied to reduce overfitting and to improve the generalization error in the model. In addition, the variable importance for the DL model was calculated based on the method from Gedeon.40
Model Performance Evaluation
The evaluation of model performance was conducted using the internal validation and external validation methods commonly used in ML and DL modeling studies.41–45 The original dataset was randomly split into a training set (80% of the data), as internal validation data through 5-fold cross-validation for training the model, and a test set (20% of data) for external validation of the model. In the 5-fold cross-validation analysis, the training set was further partitioned into five equal sized subsets. Of the five subsets, four subsets were used for building the model and a single subset was retrained as validation data for evaluating the developed model. This cross-validation process was then repeated five times until all subsets were used for validation once. The performance of each model for the 5-fold cross-validation and external validation was evaluated by root mean square error (RMSE), mean absolute error (MAE) and adjusted determination coefficient (R2). These evaluated metrics are defined as below:

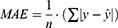

where y is the observed response variable value derived from the Nano-Tumor Database based on a PBPK model,5  is its mean,
  is the corresponding predicted value, and n is the number of data sets. R2 was used to evaluate the goodness-of-fit of the model, and RMSE and MAE were used to evaluate the error between observed and predicted values. The lower values of MAE and RMSE imply higher accuracy of the model. However, a higher value of R2 is considered desirable.
Results
Study Workflow
The overall study framework is depicted in Figure 1. All data on the physicochemical properties of NPs, tumor model, and cancer type were obtained from our published Nano-Tumor Database.5 The combination of four types of response variables (delivery efficiency at different time points after IV injection, including DE24, DE168, DEmax, and DETlast) in conjunction with nine modeling algorithms, 36 models were developed. Specifically, the physicochemical properties of NPs (Type, Size, ZP, shape, MAT), and the parameters related to the description of tumor studies (TM, TS, and CT) were used as input features to predict the tumor delivery efficiencies of different NPs derived from the PBPK model from our previous study.5 After data preprocessing (ie, feature selection and scaling), the models were developed using the different modeling algorithms presented above (Table 1). During model training, the optimization of hyperparameters was conducted to choose a set of optimal hyperparameters for ML and DL model algorithms. Final models were evaluated by the 5-fold cross-validation method and the quality of each model was evaluated with both training and test data sets, separately using several indicators, including R2, RMSE, and MAE.
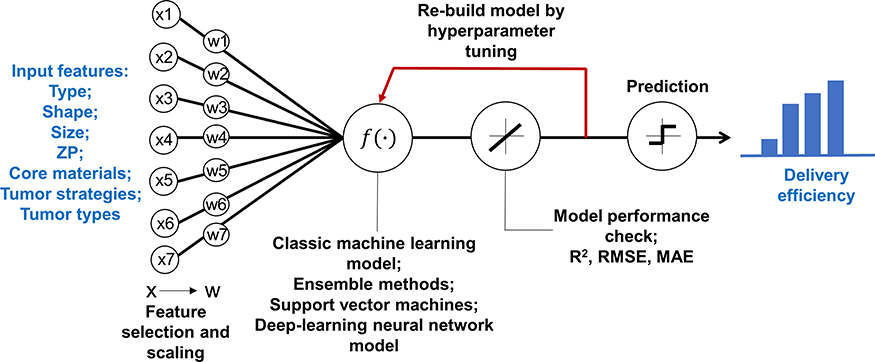 |
Figure 1 Overview of the study framework to develop machine learning and deep learning models to predict delivery efficiency of nanoparticles to the tumor site in tumor-bearing mice. X represents the initial input variables and W represents the variables after feature selections. Abbreviations: R2, adjusted coefficient of determination; RMSE, root mean square error; MAE, mean absolute error. |
Nano-Tumor Database
Figure 2 is an overview of the data sets in this study. The tumor delivery efficiency data were categorized based on the cancer therapeutic scenarios or the physicochemical properties of the NPs, including cancer TS (Figure 2A), CT (Figure 2B), TM (Figure 2C), Type (Figure 2D), shape (Figure 2E), MAT (Figure 2F), Size (Figure 2G), and ZP (Figure 2H). For the parameter of targeting strategies, the majority of datasets were from studies that used passive targeting (68%). The data were related to a wide range of different cancer types, including breast (30%), liver (17%), colon (8%), cervix (7%), and lung (6%) and others (32%). The mouse tumor models included Allograft Heterotopic (AH, 38%), Allograft Orthotopic (AO, 12%), Xenograft Heterotopic (XH, 38%), and Xenograft Orthotopic (XO, 12%). For the physicochemical properties of NPs, the majority were organic NPs (71%). The core materials were also very diverse, including polymeric (40%), gold (17%), liposomes (9%), hydrogels (6%), silica (6%), iron oxide (2%), dendrimers (2%), and others (18%). The values of ZP, which described the charge at the interface between the NP surface and its liquid medium, ranged from −59.4 mV to 71.30 mV. The “Size” of the studied NPs, which represented the log10-transformed hydrodynamic diameters of the NPs, ranged from 0.43 nm to 2.66 nm (ie, the range of the original hydrodynamic diameter values was 2.51 nm to 457 nm).
 |
Figure 2 Overview of the Nano-Tumor Database. (A–C) Percentages of data related to cancer therapy scenarios based on the Targeting Strategy (TS), Cancer Type (CT), and Tumor Model (TM). (D–H) Percentages of data that were categorized based on the physicochemical properties of the studied nanoparticles, including the type (D), the shape (E), the core (F), the log-transformed hydrodynamic diameter (G), and Zeta potential (H). In Panel H, Zeta potential values are presented using box whisker plots across 2.5th, 25th, 50th, 75th, and 97.5th percentiles. Data in the Nano-Tumor Database are from Cheng et al.5 |
Development and Validation of NP Tumor Delivery Efficiency Models
The R2, RMSE and MAE values based on 5-fold cross-validation and testing results from the developed ML and DL models are summarized in Table 3. Among the selected ML model algorithms, the RF model showed a better predicting performance for each of the endpoints with higher R2 and lower RMSE or MAE values than other categories of ML algorithms. The relatively weakest modeling algorithm was the KNN model with R2 values for all endpoints below 0.1. The R2 and RMSE values for RF ranged from 0.11 to 0.29 and from 3.17 to 7.15 across each of endpoints in the test set, while the values in the training set ranged from 0.15 to 0.19 and from 2.06 to 3.72, respectively. Although the L2-SVM model slightly outperformed the others in the test set for DE168, the results may not be reliable because the values of R2 and RMSE between training and test sets had significant differences. For the predicting performance of the DL model (Table 3; Figure 3), the results outperformed all ML methods with the highest R2 values and substantially lower RMSE and MAE values across all endpoints compared to those from other algorithms. The R2 values were 0.70, 0.46, 0.33 and 0.63 for DEmax, DE24, DE168 and DETlast in the test set, respectively, while these values were 0.92, 0.77, 0.77 and 0.76 in the full training set (Figure 3). In addition, the similar ranges of R2, RMSE and MAE between 5-fold cross-validation results in the training and test sets in the DL model results suggest that there were minimal or no overfitting problems.
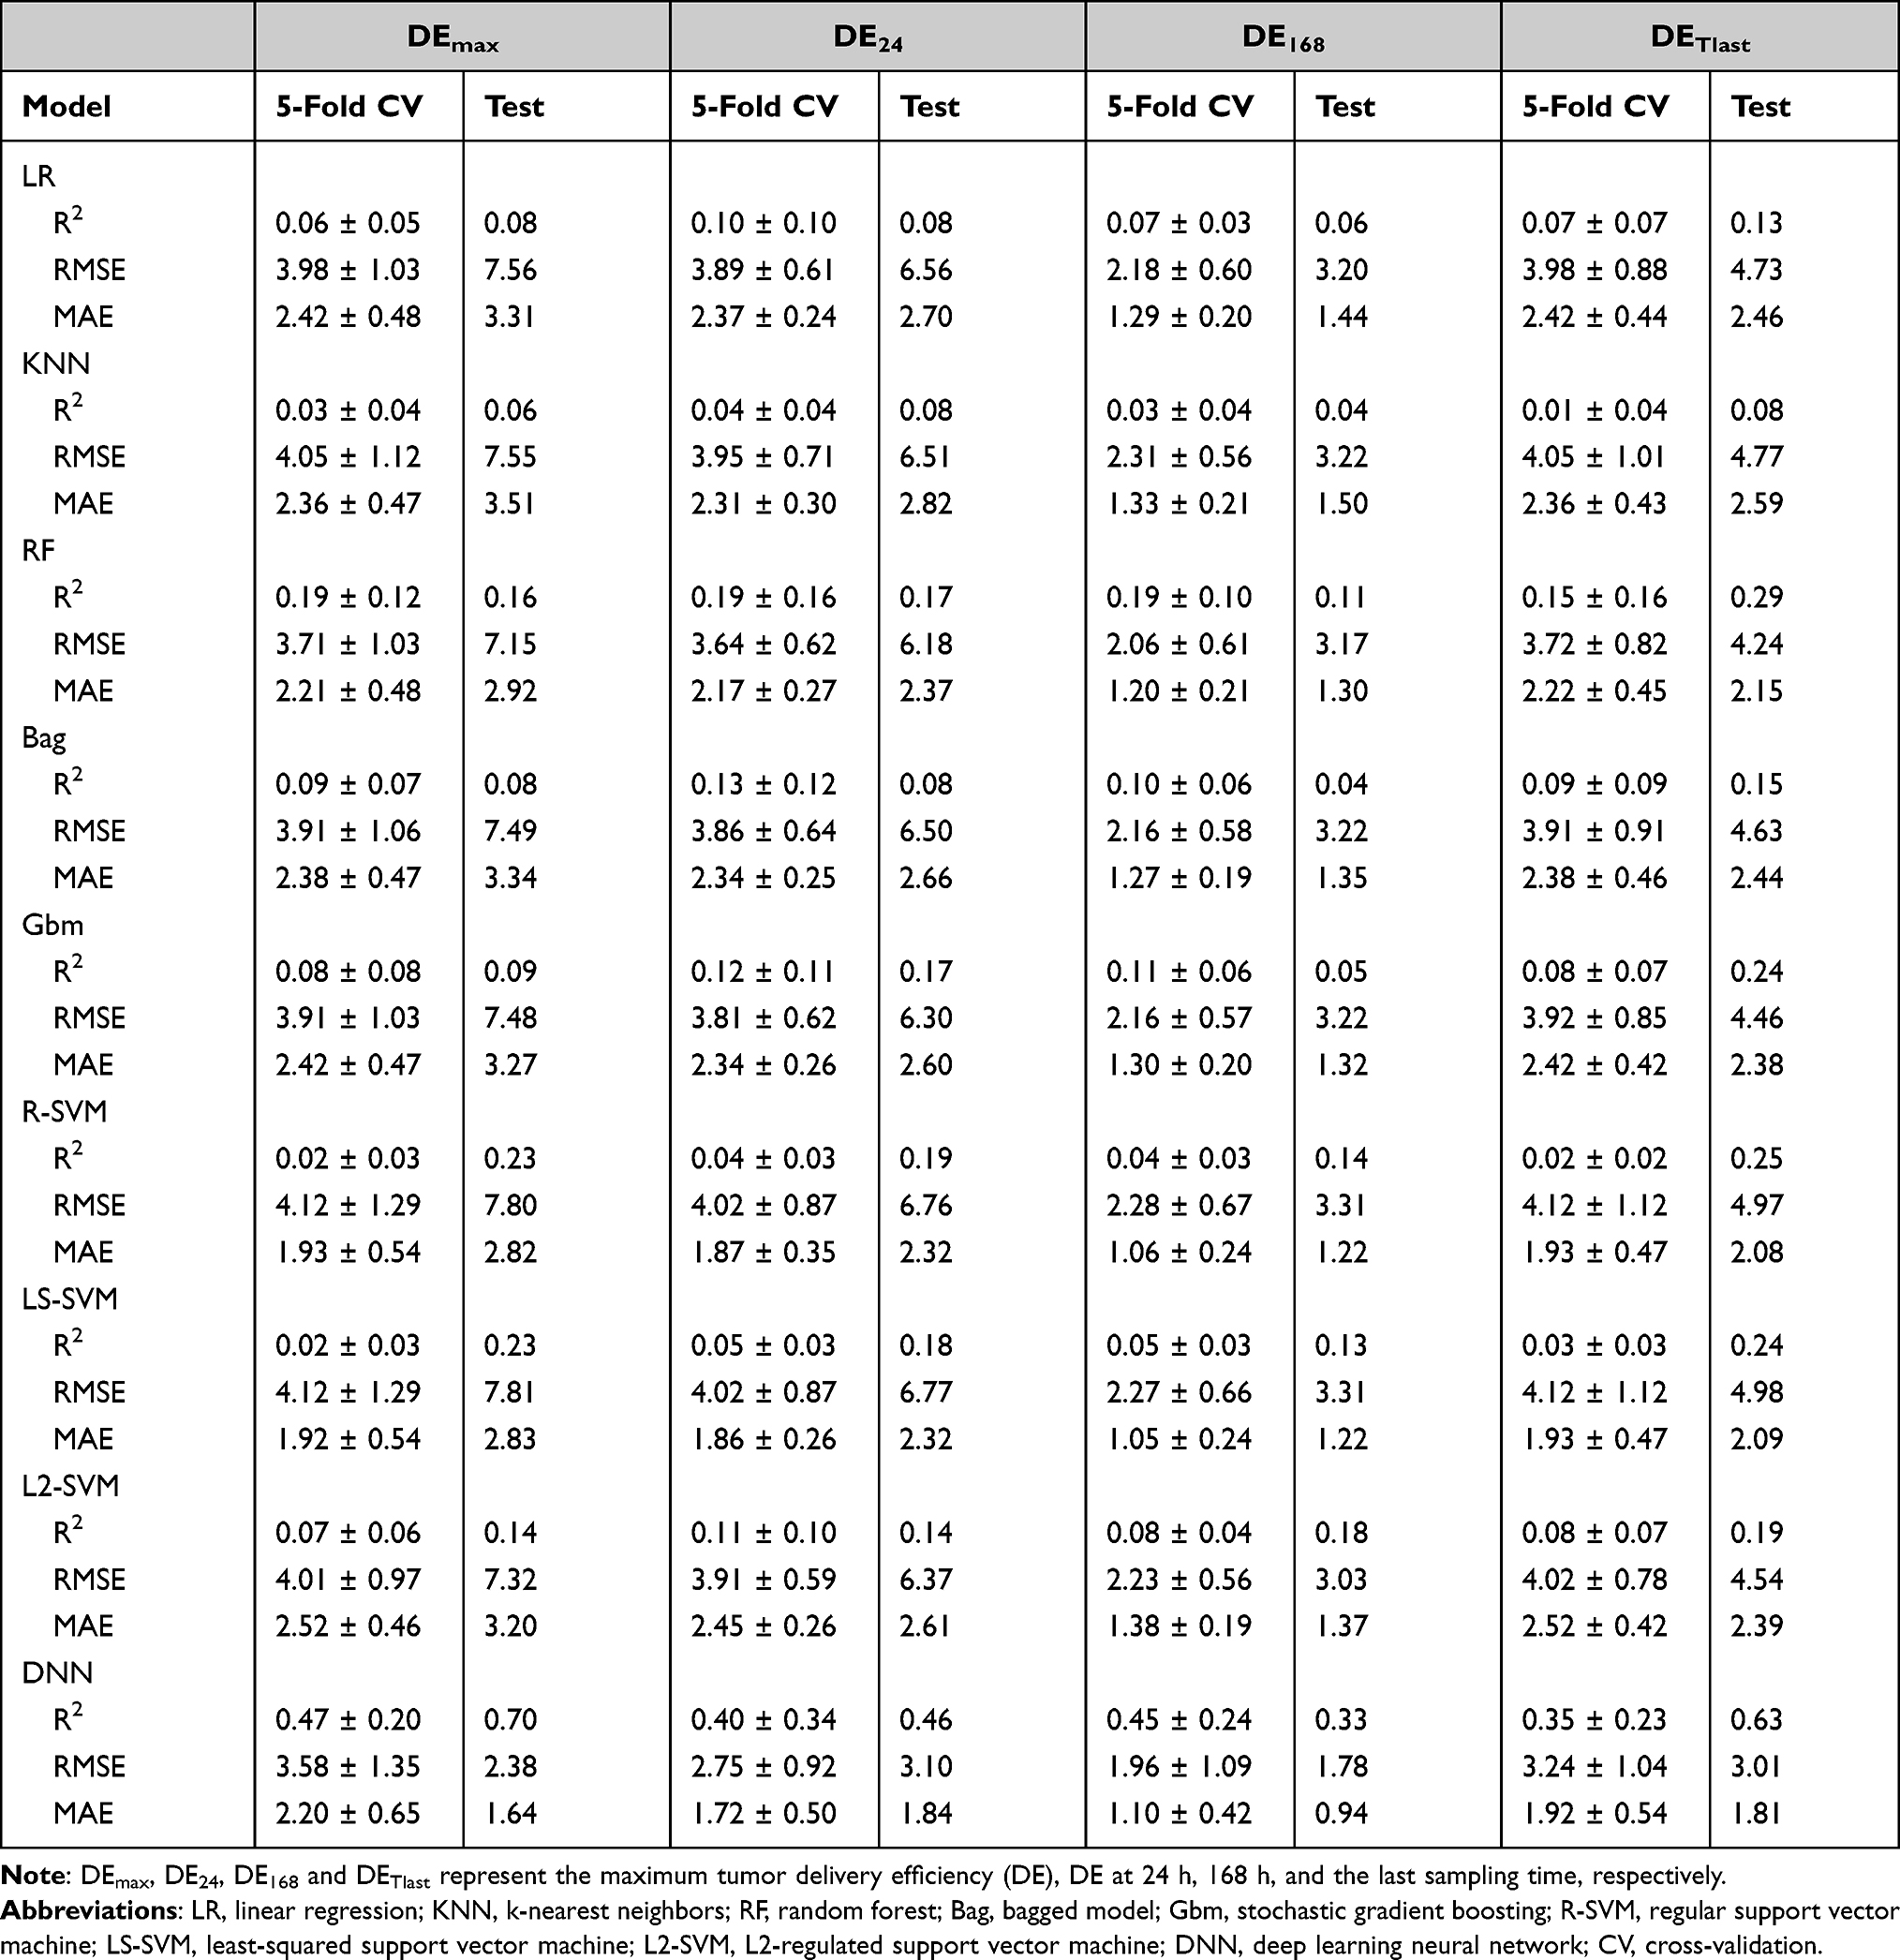 |
Table 3 Five-Fold Cross-Validation and Testing Results for Tumor Delivery Efficiency Using Different Machine Learning and Deep Learning Models |
 |
Figure 3 Correlation between values from the Nano-Tumor Database and the deep neural network model-predicted values for (A) DEmax, (B) DE24, (C) DE168 and (D) DETlast. Root mean square error (RMSE) and coefficient of determination (R2) in the training set and test set are shown. RMSE_train and R2_train represent the best performance of RMSE and R2 values in the training set, while RMSE_test and R2_test represent the values for external validation. DEmax, DE24, DE168 and DETlast represent the maximum tumor delivery efficiency (DE), DE at 24 h, 168 h, and the last sampling time, respectively. |
To further assess and to confirm whether the performances of the DL model was more superior than other methods, the traditional simple linear regression model (LM) and RF model were used to predict delivery efficiency (Figures 4–5) and then the results were compared with those from the DL model (Figure 3). These results showed that the performances of the DL model in the predictions of DEmax, DE24, DE168 and DETlast were better than the LM model based on R2 and RMSE (Figure 4). Although similar values of R2 and RMSE were found between the DL and RF models in the training dataset, the RF model did not predict as well in the test dataset compared with the DL model (Figure 5). These results suggest that of all the developed ML and DL models, the DL model had the best predicting performance among all endpoints in the training and test sets. The code of all the developed ML and DL models is provided in the GitHub (https://github.com/UFPBPK/Nano-ML-AI) to enable other researchers to reproduce our results and to apply our optimal DL model for the design of new nanomedicines.
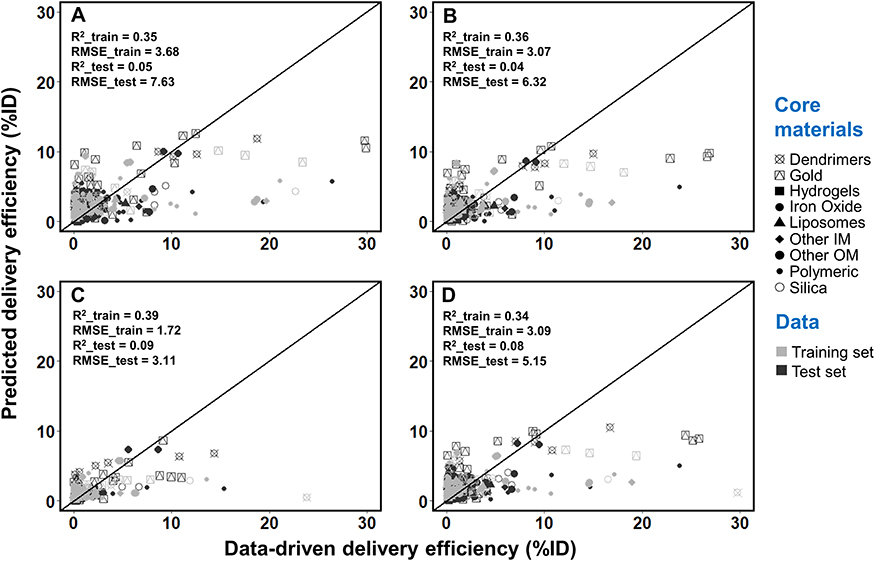 |
Figure 4 Correlation between values from the Nano-Tumor Database and the predicted values based on the simple linear regression model for (A) DEmax, (B) DE24, (C) DE168 and (D) DETlast. Root mean square error (RMSE) and coefficient of determination (R2) in the training set and test set are shown. RMSE_train and R2_train represent the best performance of RMSE and R2 values in the training set, while RMSE_test and R2_test represent the values for external validation. DEmax, DE24, DE168 and DETlast represent the maximum tumor delivery efficiency (DE), DE at 24 h, 168 h, and the last sampling time, respectively. |
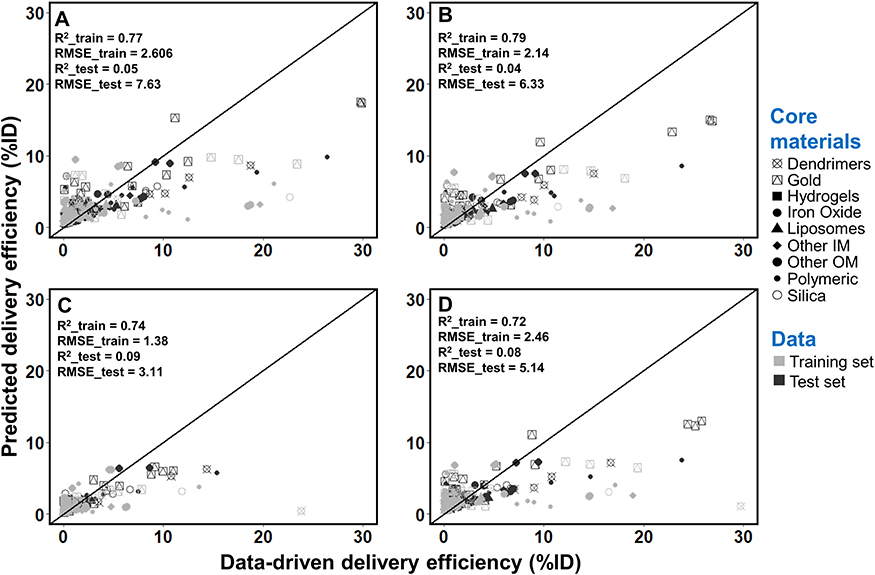 |
Figure 5 Correlation between values from the Nano-Tumor Database and the predicted values based on the random forest model for (A) DEmax, (B) DE24, (C) DE168 and (D) DETlast. Root mean square error (RMSE) and coefficient of determination (R2) in the training set and test set are also shown. RMSE_train and R2_train represent the best performance of RMSE and R2 values in the training set, while RMSE_test and R2_test represent the values for external validation. DEmax, DE24, DE168 and DETlast represent the maximum tumor delivery efficiency (DE), DE at 24 h, 168 h, and the last sampling time, respectively. |
Feature Importance
To understand the impact of the input features on model predictions, we estimated the variable importance based on the method from Gedeon.40 As shown in Figure 6, the cancer type had a greater impact on the DL model across all endpoints (19% ~ 29%). For the variables related to the physicochemical properties of NPs, MAT (22%) significantly contributed to the DEmax, while ZP and Size had impact on the DE24, DE168 and DETlast. Overall, the importance of features related to the cancer therapy strategies was higher than the parameters related to the physicochemical properties of NPs. Among the physicochemical parameters of NPs, the ZP and MAT were the most important factors to the final model than other parameters.
 |
Figure 6 Importance percentage in the deep learning model for each feature variable. (A–D) represent results for the feature variable of DEmax, DE24, DE168 and DETlast, respectively. Individual importance is represented by colors in the stacked bars. Abbreviations: ZP, zeta potential; Type, type of nanoparticles; TS, targeting strategy; TM, tumor model; Size, log-transformed value of the hydrodynamic size; Shape, shape of nanoparticles; MAT, core material of nanoparticles; CT, cancer type; AH, allograft heterotopic; AO, allograft orthotopic; XH, xenograft heterotopic; XO, xenograft orthotopic. |
Discussion
This study reports a PBPK-based DL neural network model that can adequately predict the delivery efficiency of NPs to tumors in mice based on the NP physicochemical properties, tumor model and cancer type. This model can serve as a predictive tool to assist in the design of new NP-based drug formulations for cancer therapy. This tool is anticipated to facilitate nanomedicine development in the future by preventing NPs of low tumor delivery efficiency from entering preclinical trials, thereby helping scientists to make better informed decisions and reduce and refine animal studies. This study also represents a methodology advance by integrating ML and AI approaches with PBPK modeling in the field of cancer nanomedicine.
Low delivery efficiency of NPs to tumors has for decades been a barrier in the field of cancer nanomedicine.3–5 We recognize that a nanomedicine’s specificity and efficacy are critical factors that may overcome low delivery efficiency. However, for NP with similar pharmacodynamic activity, enhanced delivery will improve efficacy, decrease adverse effects in non-target tissues, and potentially lower total dose needed for treatment. Previous studies on delivery efficiency used traditional simple multivariate regression analysis to determine the relationship between NP physicochemical properties and tumor delivery efficiency.4,5 While some significant correlations were identified, the extent of the correlation was generally low with determination coefficients ranging only from 0.3 to 0.5. These simplified models were also not rigorously validated. In the present study, we implemented nine ML and DL models (Table 1) and compared their results (Table 3). We found that the RF model had better predictive performance than other ML models, and the DL model had the best predictive performance compared to all other methods. The DL model was also rigorously validated with internal cross-validation and external validation. This DL model is a more superior model than the simple multivariate linear regression models reported in earlier studies,4,5 and it represents the best model currently available to predict NP tumor delivery efficiency in this field.
Compared to earlier studies,4,5 the present study also improves our understanding on the relative contributions of different physicochemical properties to the tumor delivery efficiency of NPs. It is well-known that pharmacokinetics and tissue distribution (including tumor delivery), depend on multiple factors, including the dose, size, ZP, surface coating, MAT, shape and TS.8,18 Earlier studies using traditional multivariate linear regression analysis and stepwise inclusion/exclusion methods were able to identify only one or a few major factors in the determination of tumor delivery efficiency for specific NPs. The limitation of this traditional linear regression method is that the final optimal model is limited to a few major parameters, whereas other relatively minor parameters have to be excluded. Thus, the linear regression model only considers the roles of some parameters, but ignores others. As a result, the relative contributions of each of the factors in a linear regression model are unknown.4,5 In this study, the DL model considered all parameters and evaluated the relative contributions of each of the studied factors on each of the selected tumor delivery efficiency metrics (Figure 6). These results suggest that cancer type was an important contributor to the DL model in predicting tumor delivery efficiency. Among all the physicochemical properties, the ZP and MAT played a greater role than other properties, including the type, shape, and TS. These findings are consistent with earlier studies using simple linear regression models.4,5 Different types of cancers have different cancer cells with different tumor microenvironments (eg, different stromal cells and extracellular matrix components), resulting in different dynamic interactions of cancer cells with their local microenvironment and different blood flow rates; these factors can in turn lead to different tumor delivery efficiencies.46–48 ZP and MAT have been shown to be key factors in tumor delivery.3,49,50 Internalization of NPs into the tumor cells is an important step in tumor delivery as the process of binding of NPs to cell membrane is mostly affected by ZP.49 Also, different types of NPs have vastly different physicochemical properties, which can all contribute to different tumor delivery efficiencies.50
This study has several limitations. While the final DL model was evaluated extensively with internal cross-validation and external validation, the training and testing datasets were necessarily limited to the Nano-Tumor Database published two years ago.5 The model would be more rigorous if it were evaluated with newer datasets that were not included in this database at the time of its compilation. We were not able to expand it further because it would have required additional animal testing and PBPK simulations, which is out of the scope of this study; which was conducted solely to determine if ML and AI techniques can be integrated with PBPK-derived results to develop a better model to improve predictions from this data set. To facilitate model applications, in the future it will be beneficial to convert the final model to a web-based interface. This is similar with several recently published interactive physiologically based pharmacokinetic (iPBPK) interfaces.51–53 Our results are only based on data from tumor-bearing mice. The implications of these results to humans remain to be investigated. This can be addressed by extrapolating the PBPK model from tumor-bearing mice to cancer patients, and a PBPK model is an ideal model to perform this animal-to-human extrapolation.9,13,20 However, additional data on pharmacokinetics of NPs in human cancer patients are needed in order to validate the human model for use to generate data to train ML and AI models.
This study substantially advances the field of cancer nanomedicine by integrating ML and AI technologies with PBPK modeling to study cancer nanomedicine. ML and AI models are useful to predict PBPK-related parameters, such as in vitro dissolution rate, hepatic clearance, and membrane permeability of small molecular drugs;54,55 and these parameters are in turn helpful to support PBPK model development. While ML and AI methods have been applied to support PBPK model development of small molecular drugs,54,55 they have not been applied to develop PBPK models of nanomedicines. ML and AI models are known to be relatively complex and require a large amount of data to train and evaluate. There is a challenge to integrate ML and AI models with pharmacokinetic data because pharmacokinetic data are typically derived from existing animal trials that have different experimental designs, which are usually limited in terms of time points, matrix, dosing groups, etc. In this regard, once a PBPK model is validated, it can be used to predict chemical or NP plasma and tissue concentrations, as well as pharmacokinetic parameters (eg, maximum concentration [Cmax] and area under the concentration curve [AUC]) at different time points in different matrices after different exposure scenarios; thereby optimizing available datasets which were not designed to have consistent designs amenable to such a meta-analysis. This was nicely illustrated in our previous study where a PBPK model was used to predict pharmacokinetic data and tumor delivery efficiencies of different types of NPs, generating the Nano-Tumor Database that contains 376 datasets.5 This database made it possible to train and evaluate the ML and DL models in the present study. This study demonstrates that it is possible to use PBPK simulation results to inform ML and AI model development. Therefore, previous studies and our present study together suggest that ML and AI and PBPK can be well integrated to support each other. This AI-PBPK integrative approach is new and provides an advancement to the field of nanomedicine. This conclusion has wide implications considering that PBPK modeling has a number of biomedical applications, including drug discovery and development (both small molecular drugs and nanodrugs),56 environmental Health risk assessment,57,58 and animal-derived food safety assessment.59
Conclusion
Overall, this study extends our earlier study5 by developing a more robust quantitative model based on DL and PBPK approaches that can be used to predict tumor delivery efficiency of different NPs based on the physicochemical properties, cancer type and tumor model. The present study also demonstrates the feasibility of integrating ML/AI with PBPK models to support cancer nanomedicine research and development. These findings represent a methodological advancement in the field of cancer nanomedicine. The final DL model can serve as a platform to help in the future design of new cancer nanomedicines and help scientists to make informed decisions as to which NPs should enter preclinical trials, thereby, reducing and refining animal studies. This framework can be extended to other applications of PBPK modeling, including small molecular drug development, environmental health risk assessment, and animal-derived food safety assessment.
Acknowledgments
The authors would like to acknowledge funding support from the National Institute of Biomedical Imaging and Bioengineering of US National Institutes of Health (NIH) (Grant numbers: R01EB031022 and R03EB026045).
Disclosure
The authors report no conflicts of interest in this work.
References
1. Sung H, Ferlay J, Siegel RL, et al. Global cancer statistics 2020: GLOBOCAN estimates of incidence and mortality worldwide for 36 cancers in 185 countries. CA Cancer J Clin. 2021;71(3):209–249. doi:10.3322/caac.21660
2. Senapati S, Mahanta AK, Kumar S, Maiti P. Controlled drug delivery vehicles for cancer treatment and their performance. Signal Transduct Target Ther. 2018;3(1):7. doi:10.1038/s41392-017-0004-3
3. Rosenblum D, Joshi N, Tao W, Karp JM, Peer D. Progress and challenges towards targeted delivery of cancer therapeutics. Nat Commun. 2018;9(1):1410. doi:10.1038/s41467-018-03705-y
4. Wilhelm S, Tavares AJ, Dai Q, et al. Analysis of nanoparticle delivery to tumours. Nat Rev Mater. 2016;1(5):16014. doi:10.1038/natrevmats.2016.14
5. Cheng YH, He CL, Riviere JE, Monteiro-Riviere NA, Lin ZM. Meta-analysis of nanoparticle delivery to tumors using a physiologically based pharmacokinetic modeling and simulation approach. ACS Nano. 2020;14(3):3075–3095. doi:10.1021/acsnano.9b08142
6. Anselmo AC, Mitragotri S. Nanoparticles in the clinic: an update. Bioeng Transl Med. 2019;4(3):e10143. doi:10.1002/btm2.10143
7. Riviere JE. Of mice, men and nanoparticle biocoronas: are in vitro to in vivo correlations and interspecies extrapolations realistic? Nanomedicine. 2013;8(9):1357–1359. doi:10.2217/nnm.13.129
8. Lin Z, Monteiro-Riviere NA, Riviere JE. Pharmacokinetics of metallic nanoparticles. Wiley Interdiscip Rev Nanomed Nanobiotechnol. 2015;7(2):189–217. doi:10.1002/wnan.1304
9. Valic MS, Zheng G. Research tools for extrapolating the disposition and pharmacokinetics of nanomaterials from preclinical animals to humans. Theranostics. 2019;9(11):3365–3387. doi:10.7150/thno.34509
10. Price LSL, Stern ST, Deal AM, Kabanov AV, Zamboni WC. A reanalysis of nanoparticle tumor delivery using classical pharmacokinetic metrics. Sci Adv. 2020;6(29):eaay9249. doi:10.1126/sciadv.aay9249
11. Lee HA, Leavens TL, Mason SE, Monteiro-Riviere NA, Riviere JE. Comparison of quantum dot biodistribution with a blood-flow-limited physiologically based pharmacokinetic model. Nano Lett. 2009;9(2):794–799. doi:10.1021/nl803481q
12. Mager DE, Mody V, Xu C, et al. Physiologically based pharmacokinetic model for composite nanodevices: effect of charge and size on in vivo disposition. Pharm Res. 2012;29(9):2534–2542. doi:10.1007/s11095-012-0784-7
13. Bachler G, von Goetz N, Hungerbuhler K. A physiologically based pharmacokinetic model for ionic silver and silver nanoparticles. Int J Nanomedicine. 2013;8:3365–3382. doi:10.2147/IJN.S46624
14. Chen WY, Cheng YH, Hsieh NH, et al. Physiologically based pharmacokinetic modeling of zinc oxide nanoparticles and zinc nitrate in mice. Int J Nanomedicine. 2015;10:6277–6292. doi:10.2147/IJN.S86785
15. Carlander U, Li D, Jolliet O, Emond C, Johanson G. Toward a general physiologically-based pharmacokinetic model for intravenously injected nanoparticles. Int J Nanomedicine. 2016;11:625–640. doi:10.2147/IJN.S94370
16. Li D, Morishita M, Wagner JG, et al. In vivo biodistribution and physiologically based pharmacokinetic modeling of inhaled fresh and aged cerium oxide nanoparticles in rats. Part Fibre Toxicol. 2016;13(1):45. doi:10.1186/s12989-016-0156-2
17. Lin Z, Monteiro-Riviere NA, Riviere JE. A physiologically based pharmacokinetic model for polyethylene glycol-coated gold nanoparticles of different sizes in adult mice. Nanotoxicology. 2016;10(2):162–172. doi:10.3109/17435390.2015.1027314
18. Yuan D, He H, Wu Y, Fan J, Cao Y. Physiologically based pharmacokinetic modeling of nanoparticles. J Pharm Sci. 2019;108(1):58–72. doi:10.1016/j.xphs.2018.10.037
19. Price E, Gesquiere AJ. Animal simulations facilitate smart drug design through prediction of nanomaterial transport to individual tissue cells. Sci Adv. 2020;6(4):eaax2642. doi:10.1126/sciadv.aax2642
20. Lin Z, Monteiro-Riviere NA, Kannan R, Riviere JE. A computational framework for interspecies pharmacokinetics, exposure and toxicity assessment of gold nanoparticles. Nanomedicine. 2016;11(2):107–119. doi:10.2217/nnm.15.177
21. Baskin II. Machine learning methods in computational toxicology. Methods Mol Biol. 2018;1800:119–139.
22. Basile AO, Yahi A, Tatonetti NP. Artificial intelligence for drug toxicity and safety. Trends Pharmacol Sci. 2019;40(9):624–635. doi:10.1016/j.tips.2019.07.005
23. Bhhatarai B, Walters WP, Hop C, Lanza G, Ekins S. Opportunities and challenges using artificial intelligence in ADME/Tox. Nat Mater. 2019;18(5):418–422. doi:10.1038/s41563-019-0332-5
24. Singh AV, Ansari MHD, Rosenkranz D, et al. Artificial intelligence and machine learning in computational nanotoxicology: unlocking and empowering nanomedicine. Adv Healthc Mater. 2020;9(17):e1901862. doi:10.1002/adhm.201901862
25. Tu JV. Advantages and disadvantages of using artificial neural networks versus logistic regression for predicting medical outcomes. J Clin Epidemiol. 1996;49(11):1225–1231. doi:10.1016/S0895-4356(96)00002-9
26. Bourquin J, Schmidli H, van Hoogevest P, Leuenberger H. Advantages of Artificial Neural Networks (ANNs) as alternative modelling technique for data sets showing non-linear relationships using data from a galenical study on a solid dosage form. Eur J Pharm Sci. 1998;7(1):5–16. doi:10.1016/S0928-0987(97)10028-8
27. Lee S, Jung S, Lee J. Prediction model based on an artificial neural network for user-based building energy consumption in South Korea. Energies. 2019;12(4):608. doi:10.3390/en12040608
28. Lazarovits J, Sindhwani S, Tavares AJ, et al. Supervised learning and mass spectrometry predicts the in vivo fate of nanomaterials. ACS Nano. 2019;13(7):8023–8034. doi:10.1021/acsnano.9b02774
29. Hancock JT, Khoshgoftaar TM. Survey on categorical data for neural networks. J Big Data. 2020;7(1):28. doi:10.1186/s40537-020-00305-w
30. Alshdaifat E, Alshdaifat D, Alsarhan A, Hussein F, El-Salhi SMFS. The effect of preprocessing techniques, applied to numeric features, on classification algorithms’ performance. Data. 2021;6(2):11. doi:10.3390/data6020011
31. Kuhn M. Building predictive models in R using the caret package. J Stat Softw. 2008;28(5):1–26. doi:10.18637/jss.v028.i05
32. Karatzoglou A, Feinerer I. Kernel-based machine learning for fast text mining in R. Comput Stat Data Anal. 2010;54(2):290–297. doi:10.1016/j.csda.2009.09.023
33. Liaw A, Mathew W. Classification and regression by randomForest. R News. 2002;2:18–22.
34. Chen T, Guestrin C. XGBoost: a scalable tree boosting system. In
35. Bergstra J, Bengio Y. Random search for hyper-parameter optimization. J Mach Learn Res. 2012;13:281–305.
36. LeDell E, Aiello NGS, Fu A, et al. h2o: r Interface for the ‘H2O’ scalable machine learning platform. R package version 3.30.0.1; 2020: 13.
37. Schmidhuber J. Deep learning in neural networks: an overview. Neural Netw. 2015;61:85–117. doi:10.1016/j.neunet.2014.09.003
38. Srivastava N, Hinton G, Krizhevsky A, Sutskever I, Salakhutdinov R. Dropout: a simple way to prevent neural networks from overfitting. J Mach Learn Res. 2014;15:1929–1958.
39. Prechelt L. Early stopping - But when? Neural Netw. 1998;1524:55–69.
40. Gedeon TD. Data mining of inputs: analysing magnitude and functional measures. Int J Neural Syst. 1997;8(2):209–218. doi:10.1142/S0129065797000227
41. Yan XL, Sedykh A, Wang WY, Yan B, Zhu H. Construction of a web-based nanomaterial database by big data curation and modeling friendly nanostructure annotations. Nat Commun. 2020;11(1):2519. doi:10.1038/s41467-020-16413-3
42. Vitsios D, Dhindsa RS, Middleton L, Gussow AB, Petrovski S. Prioritizing non-coding regions based on human genomic constraint and sequence context with deep learning. Nat Commun. 2021;12(1):1504. doi:10.1038/s41467-021-21790-4
43. Chen R, Zhang Y, Sahneh FD, et al. Nanoparticle surface characterization and clustering through concentration-dependent surface adsorption modeling. ACS Nano. 2014;8(9):9446–9456. doi:10.1021/nn503573s
44. Aiken EL, Nguyen AT, Viboud C, Santillana M. Toward the use of neural networks for influenza prediction at multiple spatial resolutions. Sci Adv. 2021;7(25):eabb1237. doi:10.1126/sciadv.abb1237
45. Yu F, Wei C, Deng P, Peng T, Hu X. Deep exploration of random forest model boosts the interpretability of machine learning studies of complicated immune responses and lung burden of nanoparticles. Sci Adv. 2021;7(22):eabf4130. doi:10.1126/sciadv.abf4130
46. Baghban R, Roshangar L, Jahanban-Esfahlan R, et al. Tumor microenvironment complexity and therapeutic implications at a glance. Cell Commun Signal. 2020;18(1):59. doi:10.1186/s12964-020-0530-4
47. Zhang M, Gao S, Yang D, et al. Influencing factors and strategies of enhancing nanoparticles into tumors in vivo. Acta Pharm Sin B. 2021;11(8):2265–2285. doi:10.1016/j.apsb.2021.03.033
48. Fan F, Xie B, Yang L. Promoting nanoparticle delivery efficiency to tumors by locally increasing blood flow there. ACS Appl Bio Mater. 2021;4(10):7615–7625. doi:10.1021/acsabm.1c00871
49. Honary S, Zahir F. Effect of Zeta potential on the properties of nano-drug delivery systems - A review (Part 1). Trop J Pharm Res. 2013;12(2):255–264.
50. Mitchell MJ, Billingsley MM, Haley RM, Wechsler ME, Peppas NA, Langer R. Engineering precision nanoparticles for drug delivery. Nat Rev Drug Discov. 2021;20(2):101–124. doi:10.1038/s41573-020-0090-8
51. Riad MH, Baynes RE, Tell LA, et al. Development and application of an interactive Physiologically Based Pharmacokinetic (iPBPK) model to predict oxytetracycline tissue distribution and withdrawal intervals in market-age sheep and goats. Toxicol Sci. 2021;183(2):253–268. doi:10.1093/toxsci/kfab095
52. Li M, Cheng YH, Chittenden JT, et al. Integration of Food Animal Residue Avoidance Databank (FARAD) empirical methods for drug withdrawal interval determination with a mechanistic population-based interactive physiologically based pharmacokinetic (iPBPK) modeling platform: example for flunixin meglumine administration. Arch Toxicol. 2019;93(7):1865–1880. doi:10.1007/s00204-019-02464-z
53. Punt A, Pinckaers N, Peijnenburg A, Louisse J. Development of a web-based toolbox to support Quantitative In-Vitro-to-In-Vivo Extrapolations (QIVIVE) within nonanimal testing strategies. Chem Res Toxicol. 2021;34(2):460–472. doi:10.1021/acs.chemrestox.0c00307
54. Gao H, Wang W, Dong J, Ye Z, Ouyang D. An integrated computational methodology with data-driven machine learning, molecular modeling and PBPK modeling to accelerate solid dispersion formulation design. Eur J Pharm Biopharm. 2021;158:336–346. doi:10.1016/j.ejpb.2020.12.001
55. Schneckener S, Grimbs S, Hey J, et al. Prediction of oral bioavailability in rats: transferring insights from in vitro correlations to (Deep) machine learning models using in silico model outputs and chemical structure parameters. J Chem Inf Model. 2019;59(11):4893–4905. doi:10.1021/acs.jcim.9b00460
56. Jones H, Rowland-Yeo K. Basic concepts in physiologically based pharmacokinetic modeling in drug discovery and development. CPT Pharmacomet Syst Pharmacol. 2013;2(8):e63. doi:10.1038/psp.2013.41
57. Lin Z, Fisher JW. Chapter 1 - A history and recent efforts of selected physiologically based pharmacokinetic modeling topics. In: Fisher JW, Gearhart J, Lin Z, editors. Physiologically Based Pharmacokinetic (PBPK) Modeling: Methods and Applications in Toxicology and Risk Assessment.
58. Tan YM, Worley RR, Leonard JA, Fisher JW. Challenges associated with applying physiologically based pharmacokinetic modeling for public health decision-making. Toxicol Sci. 2018;162(2):341–348. doi:10.1093/toxsci/kfy010
59. Lin Z, Gehring R, Mochel JP, Lave T, Riviere JE. Mathematical modeling and simulation in animal health - Part II: principles, methods, applications, and value of physiologically based pharmacokinetic modeling in veterinary medicine and food safety assessment. J Vet Pharmacol Ther. 2016;39(5):421–438. doi:10.1111/jvp.12311
 © 2022 The Author(s). This work is published and licensed by Dove Medical Press Limited. The
full terms of this license are available at https://www.dovepress.com/terms
and incorporate the Creative Commons Attribution
- Non Commercial (unported, 3.0) License.
By accessing the work you hereby accept the Terms. Non-commercial uses of the work are permitted
without any further permission from Dove Medical Press Limited, provided the work is properly
attributed. For permission for commercial use of this work, please see paragraphs 4.2 and 5 of our Terms.
© 2022 The Author(s). This work is published and licensed by Dove Medical Press Limited. The
full terms of this license are available at https://www.dovepress.com/terms
and incorporate the Creative Commons Attribution
- Non Commercial (unported, 3.0) License.
By accessing the work you hereby accept the Terms. Non-commercial uses of the work are permitted
without any further permission from Dove Medical Press Limited, provided the work is properly
attributed. For permission for commercial use of this work, please see paragraphs 4.2 and 5 of our Terms.