
Back to Journals » International Journal of General Medicine » Volume 18
Predicting Glioma Recurrence Using 18F-FDG PET/CT, MRI, and Tumor Markers: A Combined Approach
Authors Wei J 
Received 5 February 2025
Accepted for publication 18 April 2025
Published 5 May 2025 Volume 2025:18 Pages 2429—2438
DOI https://doi.org/10.2147/IJGM.S520876
Checked for plagiarism Yes
Review by Single anonymous peer review
Peer reviewer comments 2
Editor who approved publication: Dr Ching-Hsien Chen
Jingsong Wei
Department of Neurosurgery, Northern Theater General Hospital, Shenyang, Liaoning Province, 110016, People’s Republic of China
Correspondence: Jingsong Wei, Email [email protected]
Objective: To evaluate the combined predictive value of 18F-FDG PET/CT, MRI, and tumor markers for glioma recurrence.
Methods: A retrospective analysis was conducted on the clinical data of 82 glioma patients treated at our hospital from January 2023 to April 2024. Patients were divided into Group A (n = 19, recurrence) and Group B (n = 63, no recurrence) based on whether recurrence occurred. All patients underwent 18F-FDG PET/CT to obtain maximum standardized uptake value (SUVmax) and lesion-to-normal tissue ratio (L/N). MRI was performed to measure the apparent diffusion coefficient (ADC) of the tumor parenchyma and cerebral blood flow (CBF). Serum samples were collected from all patients, and tumor markers, including monocyte-to-lymphocyte ratio (MLR) and neutrophil-to-lymphocyte ratio (NLR), were measured using an automated blood analyzer. Differences in SUVmax, L/N, ADC, CBF, MLR, and NLR levels between Groups A and B were compared. Spearman correlation analysis was used to assess the relationships between SUVmax, L/N, ADC, CBF, MLR, NLR, and glioma recurrence. Receiver operating characteristic (ROC) curves were plotted to evaluate the diagnostic value of each parameter for glioma recurrence.
Results: Recurrent patients demonstrated significantly higher SUVmax, L/N, NLR, and MLR, alongside lower ADC and CBF (all P < 0.05). These parameters correlated with recurrence (SUVmax, L/N, NLR, MLR positively; ADC and CBF negatively; all P < 0.05). ROC analysis highlighted the superiority of combined modalities, achieving an AUC of 0.856, with higher sensitivity and specificity than individual markers.
Conclusion: SUVmax, L/N, ADC, CBF, MLR, and NLR are correlated with glioma recurrence. The combined use of SUVmax, L/N, ADC, CBF, MLR, and NLR provides higher diagnostic value for glioma recurrence.
Keywords: 18F-FDG PET/CT, MRI, tumor markers, glioma, recurrence, correlation, predictive value
Introduction
Gliomas are among the most common malignant tumors of the central nervous system in adults, characterized by high invasiveness and recurrence rates.1 Despite advancements in imaging techniques and therapeutic approaches, gliomas remain highly prone to recurrence, posing significant challenges in clinical management.2 Glioma recurrence is closely associated with patients’ survival and prognosis.3 Therefore, accurately predicting the timing and risk of recurrence is crucial for improving treatment outcomes and quality of life in glioma patients.
Currently, imaging modalities play an increasingly important role in the early diagnosis, staging, therapeutic monitoring, and recurrence prediction of gliomas. Commonly used imaging techniques include fluorodeoxyglucose (18F-FDG) positron emission tomography/computed tomography (PET/CT) and magnetic resonance imaging (MRI). Among them, 18F-FDG PET/CT, a highly sensitive and specific functional imaging technique, evaluates the biological characteristics of tumors by detecting metabolic activity.4,5 However, its utility in glioma recurrence may be limited by the high physiological glucose uptake in normal brain tissue, potentially reducing specificity compared to amino acid PET tracers (eg, FET, MET, or DOTATATE PET), which exhibit lower background uptake and higher tumor-to-background contrast in gliomas.6
MRI, on the other hand, provides critical insights into tumor morphology, structure, and lesion extent, offering essential guidance for clinical treatment.7,8 In addition, tumor markers have emerged as valuable adjunctive diagnostic tools, offering novel perspectives for assessing the risk of glioma recurrence.9,10 Recently, markers such as monocyte-to-lymphocyte ratio (MLR) and neutrophil-to-lymphocyte ratio (NLR) have shown promise in prognostic evaluations for various malignancies. Studies11,12 indicate that changes in these markers are closely associated with tumor biology, inflammatory responses, and immune evasion mechanisms. While amino acid PET tracers are increasingly recognized for their superior specificity in glioma recurrence detection,6 18F-FDG PET/CT remains widely accessible in clinical practice due to its cost-effectiveness and established protocols. This highlights the need to optimize existing modalities through complementary approaches.
While individual diagnostic modalities have demonstrated utility in predicting glioma recurrence, their limitations in fully reflecting tumor biology necessitate a combined approach for enhanced accuracy and comprehensiveness. This study retrospectively analyzed clinical data from 82 glioma patients to explore the relationships between 18F-FDG PET/CT, MRI, tumor markers (MLR, NLR), and glioma recurrence. Furthermore, the predictive value of combining these parameters was evaluated to provide precise prognostic tools for clinical decision-making, optimize treatment strategies, and improve the survival outcomes of glioma patients.
Materials and Methods
Basic Information
A retrospective analysis was conducted on the clinical data of 82 patients with brain glioma treated at our hospital from January 2023 to April 2024. Patients were selected based on the following criteria: Inclusion of glioma grades I–III (32 grade I, 27 grade II, 23 grade III), representing a spectrum of recurrence risks.13 Exclusion of grade IV gliomas (glioblastomas) due to their distinct recurrence patterns and short survival timelines.14 Among the 82 patients, 43 were male and 39 were female; the age ranged from 31 to 70 years, with an average age of (55.13 ± 7.26) years. The mean body mass index (BMI) was (21.43 ± 2.15) kg/m², and the average time from onset to admission was (8.27 ± 1.41) days. Clinical staging included 32 cases at grade I, 27 cases at grade II, and 23 cases at grade III. The lesion sites were distributed as follows: frontal lobe (31 cases), temporal lobe (30 cases), parietal lobe (16 cases), and occipital lobe (5 cases). Disease types were classified as anaplastic astrocytoma (48 cases), glioblastoma (21 cases), and anaplastic oligodendroglioma (13 cases). Based on whether the disease recurred, the patients were divided into Group A (n=19, recurrence) and Group B (n=63, no recurrence). This study was approved by the Medical Ethics Committee of Northern Theater General Hospital, (Approval No.: NKZD-2400012) and adhered strictly to the ethical guidelines outlined in the Declaration of Helsinki throughout the research process.
Inclusion and Exclusion Criteria
Inclusion Criteria: (1) All patients were pathologically diagnosed with brain glioma via surgery or stereotactic biopsy. (2) All patients underwent 18F-FDG PET/CT and MRI examinations, with complete data available. (3) Patients underwent serum tumor marker testing, with measurable indicators such as MLR and NLR available. (4) Patients aged ≥18 years, regardless of sex. (5) Complete and authentic clinical data were available for analysis. (6) Patients had at least 6 months of follow-up records providing information on glioma recurrence. (7) Written informed consent was obtained from all participants or their legal guardians, agreeing to participate and comply with relevant tests and follow-ups.
Exclusion Criteria: (1) Patients who had previously received treatment for other types of tumors. (2) Patients with other severe diseases or comorbidities. (3) Patients who recently underwent radiotherapy or chemotherapy for other conditions. (4) Patients whose primary glioma site was unclear, thereby affecting imaging evaluation. (5) Incomplete/poor-quality imaging or biomarker data (excluded n = 6). (6) Patients with incomplete or abnormal tumor marker data. (7) Pregnant or breastfeeding women. (8) Patients with cognitive, communication, or functional impairments and/or mental illnesses.
Research Methods
18F-FDG PET/CT Examination
A Biograph HR16 PET/CT scanner (Siemens) was used for the examinations. Patients fasted for at least 6 hours before the procedure to stabilize glucose metabolism, ensuring blood glucose levels were within the normal range (≤7.0 mmol/L). Before the scan, patients rested in a supine position and were intravenously injected with the radioactive tracer 18F-FDG at a dose of 740.47±10.32MBq. Post-injection, patients remained at rest to minimize non-specific uptake and maintain image quality. Sixty minutes after the injection, patients were guided to the PET/CT scanning bed, maintaining a supine position. The scan covered the head and neck region to ensure complete visualization of brain tissues and surrounding structures. Low-dose CT scanning was performed first for attenuation correction and anatomical reference, followed by PET scanning at 2–3 minutes per bed position, adjusted based on patient physique and equipment parameters. Images were reconstructed in axial, coronal, and sagittal planes and analyzed using specialized software. Regions of interest (ROI) were manually delineated in metabolically active areas, recording SUVmax and L/N. The calculation formula for SUVmax is as follows: SUVmax = (Radioactivity concentration within the target ROI) / (Injected dose / Body weight). L/N = Average SUV value of the lesion area / Average SUV value of the contralateral gray matter area. Thresholds: SUVmax >2.5 and L/N >1.5 were predefined based on prior glioma studies.15
Observer Agreement: Two nuclear medicine physicians independently analyzed images; inter-observer variability assessed via intraclass correlation coefficient (ICC = 0.89). Discrepancies resolved by consensus.
MRI Examination
A 3.0 T M750 Silence superconducting MRI scanner (GE) with a dedicated head coil was used for the examination. Patients fasted for at least 4 hours and received a detailed explanation of the procedure to alleviate anxiety. During the scan, patients lay supine with arms placed naturally at their sides, minimizing motion artifacts. When necessary, intravenous sodium phenobarbital (5 mg/kg) was administered for sedation to improve patient cooperation and image quality. For enhanced scanning, Gd-DTPA contrast (Bayer) was injected via the antecubital vein using a high-pressure injector at a dose of 0.1 mmol/kg and a speed of 2.5–3 mL/s, followed by a 10 mL saline flush. Enhanced scans started 15 seconds post-injection. T1-weighted imaging (T1WI): Spin-echo sequence (SE-T1WI) with TR = 200 ms, TE = 2.46 ms, slice thickness = 5 mm, interslice gap = 30%, field of view (FOV) = 250 mm, matrix = 256 × 320, 18 slices. Fluid-attenuated inversion recovery (FLAIR): TR = 8500 ms, TE = 93 ms, inversion time (TI) = 2000 ms. T2-weighted imaging (T2WI): Turbo spin-echo sequence (TSE-T2WI) with TR = 4394 ms, TE = 96 ms; other parameters identical to T1WI. Diffusion-weighted imaging (DWI): Echo-planar imaging (EPI) sequence with TR = 2150 ms, TE = 56 ms, gradient applied in x, y, z axes, b-value = 700 s/mm², matrix = 512 × 512, FOV = 220 mm × 220 mm, slice thickness = 3 mm. Perfusion-weighted imaging (PWI): Gradient-echo sequence with TR = 1400 ms, TE = 32 ms, single excitation, 50 phases collected, FOV = 250 mm, slice thickness = 5 mm, matrix = 128 × 128, scan time = 77s. For post-processing, ROI delineation avoided necrotic and hemorrhagic areas to reduce bias. ADC and CBF values were measured three times for each patient, with the average used for analysis. Thresholds: ADC <1.2 ×10⁻³ mm²/s and CBF <35 mL/100g/min derived from glioma literature.16 Observer Protocol: Two radiologists independently delineated ROIs; ICC for ADC = 0.85, CBF = 0.82.
Tumor Marker Testing
Morning fasting venous blood samples (5 mL) were collected using sterile vacuum tubes and promptly sent to the laboratory. Blood samples were stored at 4°C and analyzed within 2 hours using an automated blood analysis system. Indicators included NLR and MLR. All tests adhered to the device instructions and laboratory SOPs to ensure accuracy and reliability.
Recurrence Assessment
All patients underwent 6-month postoperative follow-ups to assess recurrence. Criteria for recurrence included: Imaging Evidence: Enhanced MRI showed progressive enlargement of lesions with significant mass effects in two or more consecutive scans. Imaging evaluations were independently performed by two experienced radiologists, with a third-party review when necessary. Histopathological Confirmation: For suspected recurrence, brain tissue biopsy or repeat surgery was recommended to obtain lesion samples. Pathological confirmation of active tumor cells served as the gold standard. Clinical Symptoms and Auxiliary Tests: Comprehensive assessment included symptoms (eg, headache, seizures, neurological deficits), cerebrospinal fluid analysis, and dynamic changes in metabolic markers.
Statistical Analysis
GraphPad Prism 8 was used for data visualization, and SPSS 25.0 was employed for statistical analysis. Categorical data were expressed as percentages (%) and analyzed using the χ²-test, while continuous data were expressed as ( ) and compared using independent-sample t-tests. The correlation between SUVmax, L/N, ADC, CBF, MLR, NLR, and glioma recurrence was analyzed using Spearman correlation. Receiver operating characteristic (ROC) curves were plotted to evaluate the diagnostic value of various parameters for glioma recurrence. A P-value <0.05 was considered statistically significant.
Results
Comparison of Baseline Data
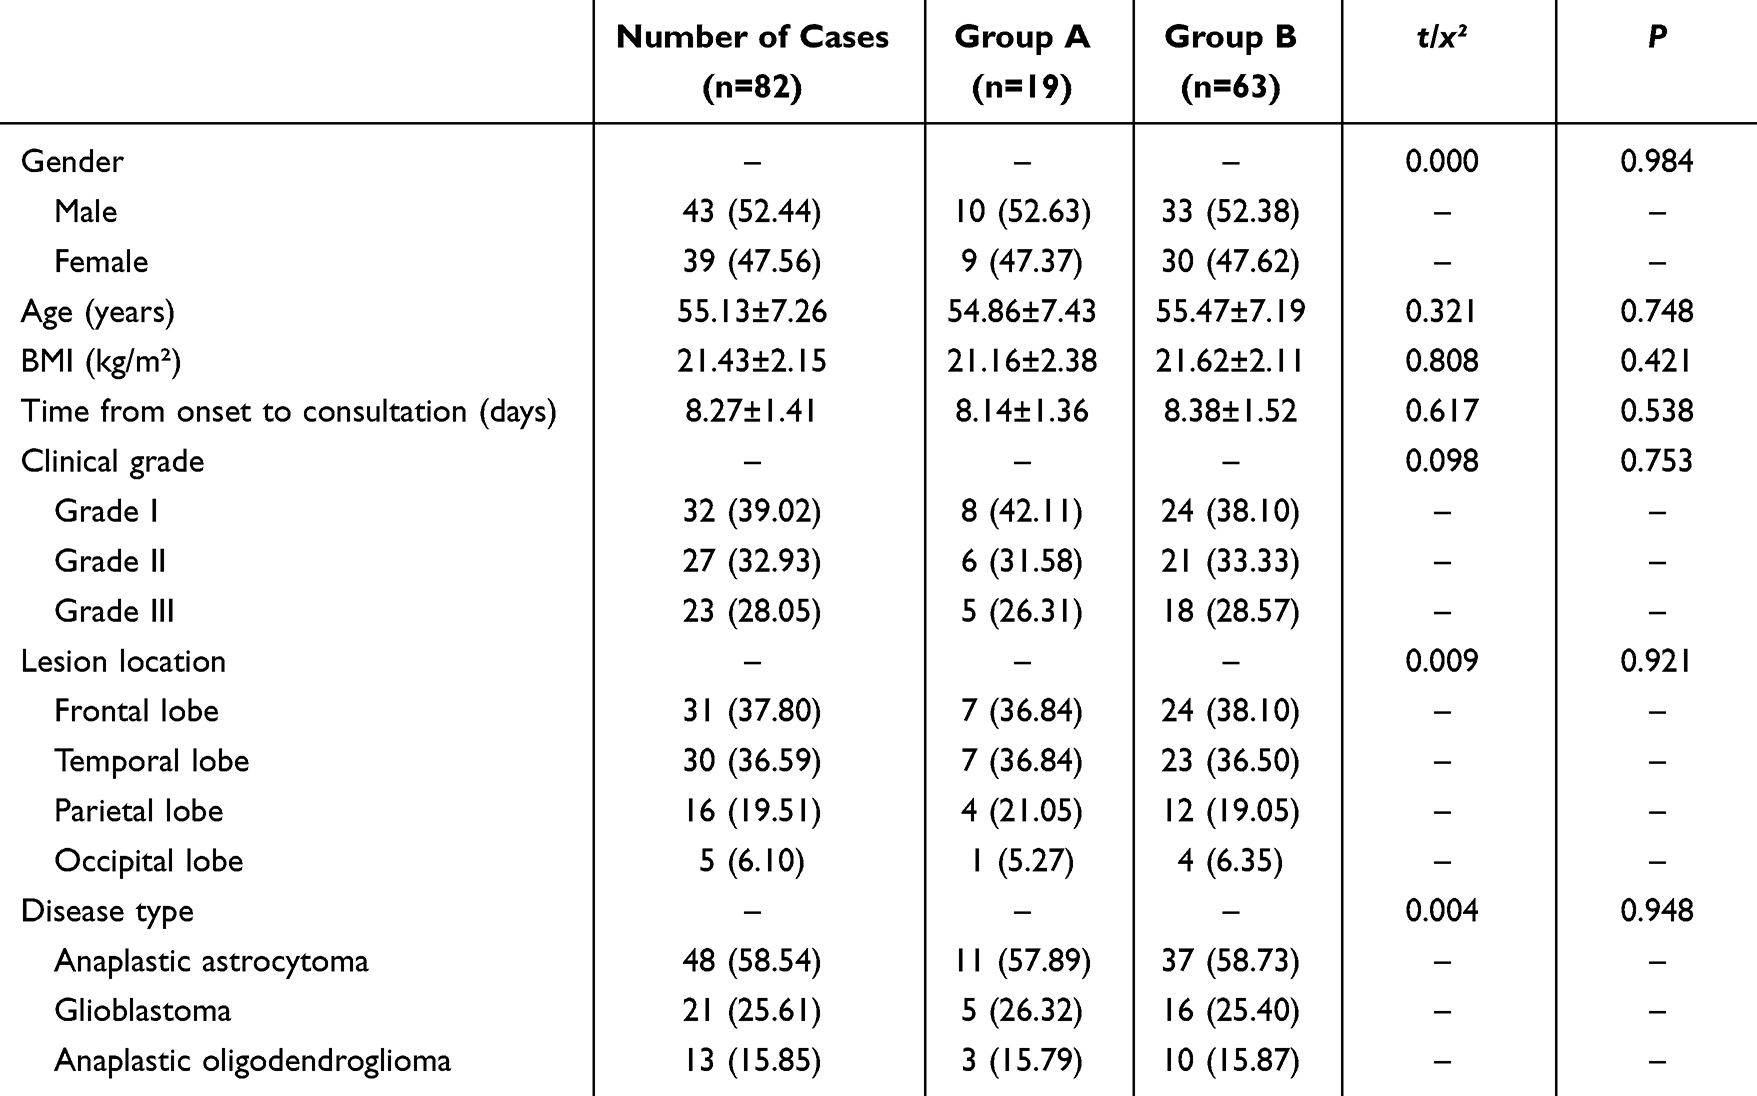
A comparison of baseline data, including gender, age, BMI, time from onset to consultation, clinical grade, and lesion location between the two groups, showed no statistically significant differences (P > 0.05), indicating comparability. See Table 1.
 |

Comparison of 18F-FDG PET/CT Indicators
Group A exhibited significantly higher SUVmax (10.06 ± 1.21 vs 6.79 ± 0.27) and L/N ratio (2.16 ± 0.35 vs 0.97 ± 0.14) compared to Group B (P < 0.05) (Figure 1). See Figure 1.
 |
Figure 1 Comparison of 18F-FDG PET/CT indicators ( Note: Inter-group comparison, *P < 0.05. |

Comparison of MRI Indicators
Group A demonstrated lower ADC (0.91 ± 0.04 vs 1.29 ± 0.13 ×10⁻³ mm²/s) and CBF (86.27 ± 4.05 vs 92.79 ± 5.67 mL/100g/min) compared to Group B (P < 0.05). See Figure 2.
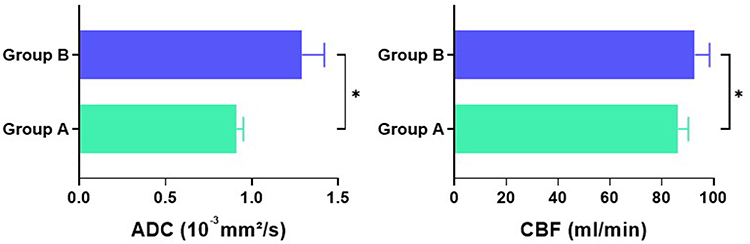 |
Figure 2 Comparison of MRI indicators ( Note: Inter-group comparison, *P < 0.05. |

Comparison of Tumor Marker Indicators
The NLR and MLR levels in Group A were 2.68 ± 0.12 and 0.29 ± 0.06, respectively, while those in Group B were 1.85 ± 0.19 and 0.20 ± 0.05, respectively. Both NLR and MLR levels in Group A were significantly higher than those in Group B (P < 0.05). See Figure 3. All tumor marker measurements were performed in both groups, with no missing data.
 |
Figure 3 Comparison of tumor marker indicators ( Note: Inter-group comparison, *P < 0.05. |

Correlation of 18F-FDG PET/CT, MRI, and Tumor Marker Indicators with Glioma Recurrence
Spearman’s analysis revealed: Positive correlations: SUVmax (r = 0.623, 95% CI: 0.52–0.71), L/N (r = 0.597, 0.48–0.69), NLR (r = 0.502, 0.37–0.62), MLR (r = 0.516, 0.39–0.63). Negative correlations: ADC (r = −0.559, 95% CI: −0.66–-0.44), CBF (r = −0.498, −0.60–-0.38) (all P < 0.05) (Table 2 and Figure 4).
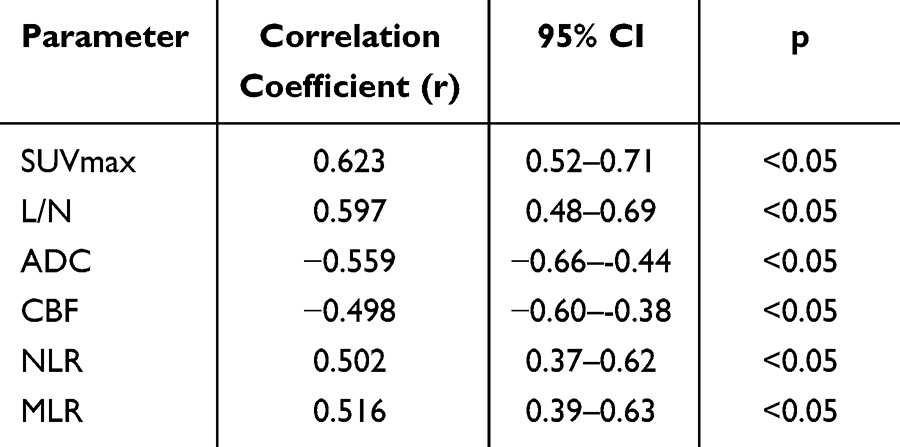 |
Table 2 Correlation of 18F-FDG PET/CT, MRI, and Tumor Marker Indicators with Glioma Recurrence |
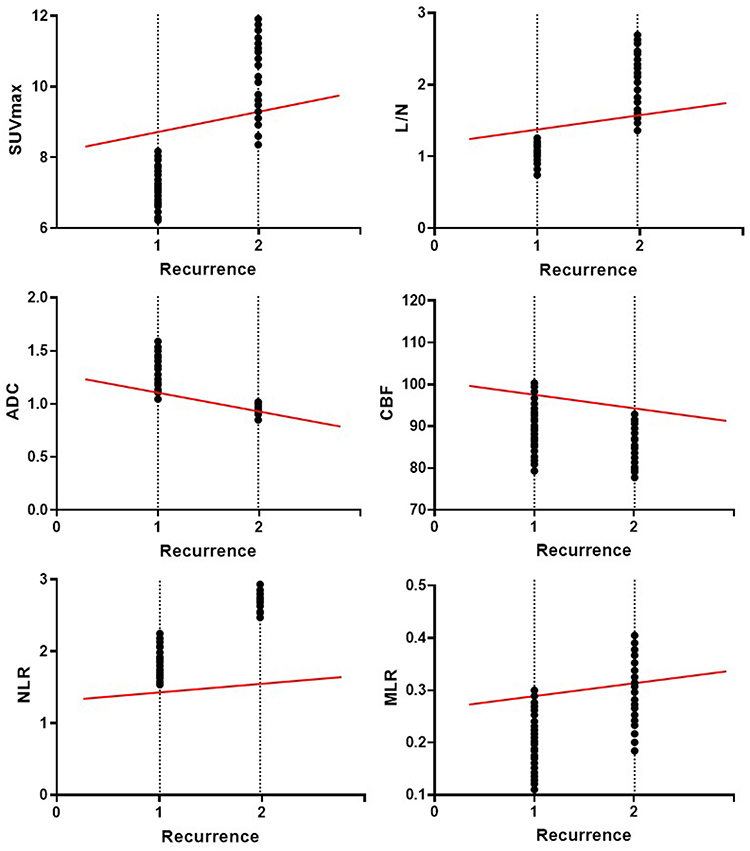 |
Figure 4 Scatter plot of correlations between 18F-FDG PET/CT, MRI, tumor marker indicators, and glioma recurrence. |
Predictive Value of SUVmax, L/N, ADC, CBF, MLR, NLR, and Combined Diagnosis for Glioma Recurrence
ROC curve analysis showed that the area under the curve (AUC) for SUVmax, L/N, ADC, CBF, NLR, MLR, and combined diagnosis were 0.745, 0.703, 0.672, 0.594, 0.615, 0.628, and 0.856, respectively. The combined diagnosis had higher AUC, sensitivity, and specificity than any individual diagnostic parameter. See Table 3 and Figure 5.
 |
Table 3 Predictive Value of SUVmax, L/N, ADC, CBF, MLR, NLR, and Combined Diagnosis for Glioma Recurrence |
 |
Figure 5 ROC curve for predictive value of SUVmax, L/N, ADC, CBF, MLR, NLR, and combined diagnosis for glioma recurrence. |
Discussion
The recurrence of gliomas remains one of the greatest challenges in their treatment. Although existing treatment modalities, such as surgical resection, radiotherapy, and chemotherapy, can alleviate the condition to a certain extent, the recurrence rate remains high due to the tumor’s high invasiveness and heterogeneity.17 Glioma recurrence often occurs at the site of residual tumor cells or microscopic foci that may not have been completely removed during surgery or may exhibit biological characteristics post-treatment, rendering them resistant to radiotherapy and chemotherapy.18 The mechanism of recurrent glioma is closely related to changes in the tumor microenvironment, including angiogenesis, immune evasion, cell proliferation, and metabolic disorders.19,20 Recurrent tumor cells often exhibit higher metabolic activity, more complex signaling pathways, and increased invasiveness, providing clues for early identification through imaging and biomarkers.21 18F-FDG PET/CT is a functional imaging technique that reflects differences in tumor cell metabolic activity, providing critical evidence for early tumor detection and recurrence prediction.22 Studies23 have shown that tumor cells typically exhibit more vigorous glucose metabolism compared to normal tissues, allowing 18F-FDG PET/CT to effectively identify metabolically active tumor lesions. Particularly during tumor recurrence and progression, metabolic activity often increases. In this study, the SUVmax and L/N ratios in Group A (recurrence) were significantly higher than those in Group B (non-recurrence), and SUVmax and L/N levels were positively correlated with glioma recurrence (P < 0.05), indicating higher metabolic activity in recurrent gliomas and enhanced uptake of 18F-FDG by tumor cells. This finding is consistent with previous studies,24,25 which have demonstrated that regions of glioma recurrence are often associated with higher SUVmax values, and SUVmax is closely correlated with glioma malignancy.26,27 However, while 18F-FDG PET/CT has high sensitivity in detecting metabolically active tumor cells, its diagnostic performance for low-metabolism or low-grade gliomas remains limited, particularly in early-stage recurrences where 18F-FDG uptake may not sufficiently reflect the tumor’s true condition.
MRI, with its excellent soft tissue contrast and high spatial resolution, has become the gold standard for brain tumor diagnosis, playing an indispensable role in the postoperative and post-radiotherapy follow-up of gliomas.28 MRI precisely delineates the tumor’s morphology, boundaries, blood flow, and microvascular structures, making it an important tool for monitoring glioma recurrence.29 Recent studies have further highlighted the role of volumetric analysis on post-contrast T1-weighted MRI (T1WCE) in distinguishing tumor progression from pseudoprogression (PsP), a critical challenge in post-radiotherapy assessment.30 In this study, ADC and CBF values in Group A were significantly lower than those in Group B, and ADC and CBF levels were negatively correlated with glioma recurrence (P < 0.05), suggesting higher tumor cell density and increased blood flow in the recurrence group. ADC values reflect the diffusion of water molecules within tumor tissue, and recurrent gliomas typically exhibit increased cell density and restricted water diffusion,31 resulting in lower ADC values. Conversely, CBF values reflect blood flow in the tumor region. Recurrent tumors are often accompanied by abnormal blood flow dynamics, with certain recurrent tumor regions showing reduced blood flow due to microvascular changes,32 leading to lower CBF values. These results further validate the importance of MRI in evaluating glioma recurrence, particularly its ability to visually display the tumor’s anatomical features and microenvironmental changes. However, despite its advantages, MRI faces challenges in distinguishing postoperative scar tissue from recurrence lesions, especially in regions of low metabolism or reduced blood flow.
In recent years, increasing research33,34 has focused on the application of tumor markers in predicting brain glioma recurrence. MLR and NLR are common inflammatory markers reflecting the state of the body’s immune response. Elevated systemic inflammatory indices such as NLR and SII have been shown to differentiate true tumor progression (TTP) from PsP, underscoring their potential in refining recurrence prediction models.30 Tumor recurrence is often accompanied by changes in the immune system, and the immune-inflammatory response is closely related to tumor occurrence, progression, and metastasis.35 Elevated MLR and NLR levels usually indicate tumor immune evasion mechanisms and chronic inflammatory states,36 which may be closely associated with an increased risk of glioma recurrence. This study found that MLR and NLR levels in Group A were significantly higher than those in Group B, and both were positively correlated with glioma recurrence (P < 0.05), suggesting that NLR and MLR are important prognostic indicators for glioma patients, closely related to tumor recurrence, invasiveness, and survival. Detection of tumor markers can provide early warning signals for glioma recurrence.
A single imaging modality or tumor marker detection has certain limitations in the early diagnosis of glioma recurrence. While 18F-FDG PET/CT provides information on tumor metabolic activity, it may not sufficiently detect low-metabolism recurrent lesions. MRI offers morphological insights but can be influenced by postoperative scars or tumor location ambiguities. Tumor markers, though biologically significant, may be affected by other systemic factors. Relying solely on one technique may not achieve high accuracy in recurrence prediction. The combined analysis results of this study showed that when 18F-FDG PET/CT, MRI, and tumor markers (MLR, NLR) were used together, the AUC, sensitivity, and specificity were significantly higher than when any single method was used, confirming the high accuracy and practicality of the combined application in predicting glioma recurrence. Comprehensive diagnosis allows for a multidimensional assessment of tumor recurrence risk, providing a more precise diagnostic basis for clinical practice.
Limitations
The study has several limitations that should be considered. Firstly, its retrospective design and small recurrence cohort (n = 19) may introduce selection bias and limit statistical power. Additionally, the lack of external validation means that the model’s performance was not tested in independent cohorts or diverse clinical settings, which restricts its generalizability. The relatively short follow-up period of a minimum of 6 months is insufficient to capture late recurrences, particularly in low-grade gliomas. Furthermore, tumor marker variability, such as fluctuations in NLR and MLR levels due to non-tumor factors (eg, infections, medications), could potentially confound the results. The study also did not compare 18F-FDG PET/CT with amino acid PET tracers (eg, FET, DOTATATE), which may offer higher specificity in glioma recurrence detection. To address these limitations, future research should focus on multicenter prospective studies with larger cohorts and extended follow-up periods. Additionally, external validation of the combined model across institutions is necessary, as well as head-to-head comparisons of 18F-FDG PET/CT versus amino acid PET for recurrence prediction. Integrating advanced biomarkers, such as circulating tumor DNA and radiomics, may further enhance the robustness of the model.
Conclusion
This study proposes a potential multimodal approach combining 18F-FDG PET/CT, MRI, and tumor markers (NLR, MLR) for glioma recurrence prediction. While the combined model demonstrated promising diagnostic performance (AUC = 0.856) in our cohort, its clinical generalizability requires cautious interpretation due to the lack of external validation and limited sample size. These findings suggest that integrating metabolic, anatomical, and inflammatory biomarkers could enhance recurrence risk stratification, but further validation in diverse populations is essential before clinical translation. Future advancements in imaging technologies and biomarker discovery may refine early prediction strategies, ultimately improving survival and quality of life for glioma patients.
Disclosure
The author reports no conflicts of interest in this work.
References
1. Quan YC, Wang LY, Wang ZY, et al. [Effect of REG3A on proliferation and invasion of glioma cells by regulating PI3K/Akt signaling pathway]. Zhonghua Zhong Liu Za Zhi. 2023;45(8):642–650. doi:10.3760/cma.j.cn112152-20220210-00086 Polish
2. Jiang WY, Lei QY, Liu SS, et al. [The effect of HOXC10 gene on biological behaviors of glioma cells and mechanism in tumor microenvironment]. Zhonghua Zhong Liu Za Zhi. 2022;44(3):228–237. doi:10.3760/cma.j.cn112152-20200326-00266 Polish
3. Xu H, Shen J, Xie LJ. [Effect of miR-148b-3p on invasion and migration of glioma cells by regulating Wnt signaling pathway]. Zhonghua Zhong Liu Za Zhi. 2020;42(7):565–569. doi:10.3760/cma.j.cn112152-20200422-00367 Polish
4. Peng P, Wu N, Tao XL, et al. [Pretreatment evaluation of (18)F-FDG PET-CT in extranodal NK/T-cell lymphoma]. Zhonghua Zhong Liu Za Zhi. 2022;44(4):370–376. doi:10.3760/cma.j.cn112152-20200525-00485 Polish
5. Guo Y, Yao ZM, Chen M, Chen CX. [The correlation between metabolic parameters in (18)F-FDG PET-CT and solid and micropapillary histological subtypes in lung adenocarcinoma]. Zhonghua Zhong Liu Za Zhi. 2022;44(6):555–561. doi:10.3760/cma.j.cn112152-20200804-00710 Polish
6. Zwirtz K, Hardt J, Acker G, et al. Comparison of choi, RECIST and somatostatin receptor PET/CT based criteria for the evaluation of response and response prediction to PRRT. Pharmaceutics. 2022;14(6):1278.PMID: 35745849; PMCID: PMC9227135. doi:10.3390/pharmaceutics14061278
7. Li JR, Xu Q, Liu GP, et al. [Characteristics of the white matter involvement sites on MRI in patients with multiple gliomas]. Zhonghua Yi Xue Za Zhi. 2022;102(17):1311–1314. doi:10.3760/cma.j.cn112137-20220223-00374 Danish
8. Cui J, Yao L, Wang SP, et al. [Construction and analysis of functional network of hemi-brain in patients with brain tumors before and after anesthesia based on resting-state functional magnetic resonance imaging]. Zhonghua Yi Xue Za Zhi. 2023;103(3):186–191. doi:10.3760/cma.j.cn112137-20220519-01112 Danish
9. Kopylov AM, Antipova OA, Pavlova GV. Molecular markers of neuro-oncogenesis in patients with glioblastoma. Zh Vopr Neirokhir Im N N Burdenko. 2022;86(6):99–105. doi:10.17116/neiro20228606199
10. Jia Y, Wang G, He X. [Bioinformatic analysis of immune correlation and prognostic value of SERPINs in glioma]. Xi Bao Yu Fen Zi Mian Yi Xue Za Zhi. 2022;38(2):122–130. Wolof
11. Wang X, Wang Z, Lu WL, et al. [Study on the prognostic influencing factors of esophageal squamous cell carcinoma and the predictive value of inflammatory reaction indexes on its postoperative recurrence]. Zhonghua Zhong Liu Za Zhi. 2023;45(2):160–164. doi:10.3760/cma.j.cn112152-20210326-00268 Polish
12. Yang WH, Sun Y-Q, Zhang Q-K, et al. [value of neutrophil/lymphocyte ratio and monocyte/lymphocyte ratio in the prognosis of patients with multiple myeloma]. Zhongguo Shi Yan Xue Ye Xue Za Zhi. 2021;29(1):122–130. doi:10.19746/j.cnki.issn.1009-2137.2021.01.020 Hausa
13. Weller M, Reifenberger G. Beyond the World Health Organization classification of central nervous system tumors 2016: what are the new developments for gliomas from a clinician’s perspective? Curr Opin Neurol. 2020;33(6):701–706.PMID: 33177376. doi:10.1097/WCO.0000000000000871
14. Poon MTC, Sudlow CLM, Figueroa JD, Brennan PM. Longer-term (≥ 2 years) survival in patients with glioblastoma in population-based studies pre- and post-2005: a systematic review and meta-analysis. Sci Rep. 2020;10(1):11622.PMID: 32669604; PMCID: PMC7363854. doi:10.1038/s41598-020-68011-4
15. Verger A, Langen KJ. PET imaging in glioblastoma: use in clinical practice. In: De Vleeschouwer S. editor Glioblastoma [Internet]. Brisbane (AU): Codon Publications; 2017. PMID: 29251869.
16. Barnes A, Alonzi R, Blackledge M, et al. UK quantitative WB-DWI technical workgroup: consensus meeting recommendations on optimisation, quality control, processing and analysis of quantitative whole-body diffusion-weighted imaging for cancer. Br J Radiol. 2018;91(1081):20170577.PMID: 29076749; PMCID: PMC5966219. doi:10.1259/bjr.20170577
17. Huang J, Ma ML, Li MX, et al. [Analysis of the difference in MGMT promoter status in gliomas and its significance in prognosis assessment]. Zhonghua Yi Xue Za Zhi. 2023;103(7):526–529. doi:10.3760/cma.j.cn112137-20221017-02158 Danish
18. Sheng YJ, Jiang QQ, Liu L, et al. [Characteristics and regulatory mechanisms of lipid metabolism remodeling after malignant transformation of glioma-associated macrophages]. Zhonghua Yi Xue Za Zhi. 2022;102(39):3134–3142. doi:10.3760/cma.j.cn112137-20220127-00203 Danish
19. Li JM, Ma XR, Peng T, et al. [Clinical features and outcomes in relapsing and monophasic patients with anti-leucine-rich glioma-inactivated 1 encephalitis]. Zhonghua Yi Xue Za Zhi. 2020;100(25):1947–1951. doi:10.3760/cma.j.cn112137-20200330-01001 Danish
20. Osinov IK, Kostjuchenko VV, Kobyakov GL, et al. [Radiosurgery for recurrent glioblastoma]. Zh Vopr Neirokhir Im N N Burdenko. 2021;85(6):76–82. doi:10.17116/neiro20218506176 Hungarian
21. Moiseenko VL, Antipova OM, Pavlova SA, et al. [Is it possible to detect surface antigen CD133 on patient-derived glioblastoma continuous cell cultures using fluorescent aptamers?]. Zh Vopr Neirokhir Im N N Burdenko. 2024;88(1):56–62. doi:10.17116/neiro20248801156 Hungarian
22. Zhao CY, Deng XY, Wang HS, et al. [Value of (18)F-FDG PET-CT imaging to predict epidermal growth factor receptor mutations in patients with lung squamous cell carcinoma]. Zhonghua Zhong Liu Za Zhi. 2021;43(7):795–800. doi:10.3760/cma.j.cn112152-20190111-00006 Polish
23. Xue DD, Xu JL, Shi DP. [The (18)F-FDG positron emission tomography integrated computed tomography associate with intravoxel incoherent motion in prediction of EGFR expression in lung cancer]. Zhonghua Yi Xue Za Zhi. 2020;100(15):1159–1163. doi:10.3760/cma.j.cn112137-20190912-02016 Danish
24. Zhao T, Bai M, Wang R, et al. [Prognostic value and imaging features of (18)F-FDG PET-CT in follicular lymphoma with different histopathology grade]. Zhonghua Xue Ye Xue Za Zhi. 2024;45(8):776–780. doi:10.3760/cma.j.cn121090-20240208-00059 Polish
25. Jiang XY, Zou DM, Zhang YQ, et al. [Utility and prognostic value of PET/CT, bone marrow biopsy and aspirate for detection of bone marrow involvement in diffuse large B-cell lymphoma]. Zhonghua Xue Ye Xue Za Zhi. 2022;43(8):663–667. doi:10.3760/cma.j.issn.0253-2727.2022.08.008 Polish
26. Kunikowska J, Czepczyński R, Pawlak D, et al. Expression of glutamate carboxypeptidase II in the glial tumor recurrence evaluated in vivo using radionuclide imaging. Sci Rep. 2022;12(1):652. doi:10.1038/s41598-021-04613-w
27. Xiong M, Chen Z, Zhou C, et al. PSMA PET/MR is a new imaging option for identifying glioma recurrence and predicting prognosis. Recent Pat Anticancer Drug Discov. 2024;19(3):383–395. doi:10.2174/1574892818666230519150401
28. Knobe S, Dzierma Y, Wenske M, et al. Feasibility and clinical usefulness of modelling glioblastoma migration in adjuvant radiotherapy. Z Med Phys. 2022;32(2):149–158. doi:10.1016/j.zemedi.2021.03.004
29. Zhou Q, Ke X, Xue C, et al. A nomogram for predicting early recurrence in patients with high-grade gliomas. World Neurosurg. 2022;164:e619–e628. doi:10.1016/j.wneu.2022.05.039
30. Satragno C, Schiavetti I, Cella E, et al.; disease management team on Neuroncology of IRCCS Ospedale Policlinico San Martino. Systemic inflammatory markers and volume of enhancing tissue on post-contrast T1w MRI images in differentiating true tumor progression from pseudoprogression in high-grade glioma. Clin Transl Radiat Oncol. 2024;49:100849. PMID: 39318678; PMCID: PMC11419878. doi:10.1016/j.ctro.2024.100849
31. Lee J, Wang N, Turk S, et al. Discriminating pseudoprogression and true progression in diffuse infiltrating glioma using multi-parametric MRI data through deep learning. Sci Rep. 2020;10(1):20331. doi:10.1038/s41598-020-77389-0
32. Moltoni G, Romano A, Capriotti G, et al. ASL, DSC, DCE perfusion MRI and 18F-DOPA PET/CT in differentiating glioma recurrence from post-treatment changes. Radiol Med. 2024;129(9):1382–1393. doi:10.1007/s11547-024-01862-3
33. Shi S, Liang H, Huang Q, et al. Identification of novel prognostic signature of recurrent low-grade glioma. World Neurosurg. 2024;191:e20–e31. doi:10.1016/j.wneu.2024.07.147
34. Sung KS, Roh TH, Moon JH, et al. Treatment results for recurrent glioblastoma and alteration of programmed death-ligand 1 expression after recurrence. World Neurosurg. 2020;135:e459–e467. doi:10.1016/j.wneu.2019.12.028
35. Lisi L, Olivi A, Ciotti GMP, et al. A topographic approach to the markers of macrophage/microglia and other cell types in high grade glioma. Neurochem Int. 2024;183:105922. doi:10.1016/j.neuint.2024.105922
36. Zheng F, Meng Q, Zhang L, et al. Prognostic roles of hematological indicators for the efficacy and prognosis of immune checkpoint inhibitors in patients with advanced tumors: a retrospective cohort study. World J Surg Oncol. 2023;21(1):198. doi:10.1186/s12957-023-03077-8
 © 2025 The Author(s). This work is published and licensed by Dove Medical Press Limited. The
full terms of this license are available at https://www.dovepress.com/terms
and incorporate the Creative Commons Attribution
- Non Commercial (unported, 4.0) License.
By accessing the work you hereby accept the Terms. Non-commercial uses of the work are permitted
without any further permission from Dove Medical Press Limited, provided the work is properly
attributed. For permission for commercial use of this work, please see paragraphs 4.2 and 5 of our Terms.
© 2025 The Author(s). This work is published and licensed by Dove Medical Press Limited. The
full terms of this license are available at https://www.dovepress.com/terms
and incorporate the Creative Commons Attribution
- Non Commercial (unported, 4.0) License.
By accessing the work you hereby accept the Terms. Non-commercial uses of the work are permitted
without any further permission from Dove Medical Press Limited, provided the work is properly
attributed. For permission for commercial use of this work, please see paragraphs 4.2 and 5 of our Terms.
Recommended articles
The Predictive Value of the Combination of Serum RBP4, ALP, IL-1β for Postoperative Recurrence of Intrahepatic Bile Duct Stones
Tang W, Kang X, Zhou C, Chen C
Therapeutics and Clinical Risk Management 2025, 21:1277-1285
Published Date: 15 August 2025

MRI-Based Classification Systems Combined with Serum CA125 for Predicting Symptom Recurrence After Ultrasound-Guided High-Intensity Focused Ultrasound Ablation Surgery for Adenomyosis: A Retrospective Cohort Study
Tang Y, Tian HD, Chen XM, Wang H, Shen LM, Ni SQ, Su B, Jiang ZJ, Zhu LJ, Luo YX, Shi Q
International Journal of Women's Health 2026, 18:575413
Published Date: 17 April 2026