Back to Journals » Journal of Inflammation Research » Volume 17
Predicting Diagnostic Biomarkers Associated with Pyroptosis in Neuropathic Pain Based on Machine Learning and Experimental Validation
Authors Tian S ![]() , Zheng H
, Zheng H ![]() , Wu W, Wu L
, Wu W, Wu L ![]()
Received 3 November 2023
Accepted for publication 13 February 2024
Published 20 February 2024 Volume 2024:17 Pages 1121—1145
DOI https://doi.org/10.2147/JIR.S445382
Checked for plagiarism Yes
Review by Single anonymous peer review
Peer reviewer comments 2
Editor who approved publication: Dr Tara Strutt
Sheng Tian,1,2 Heqing Zheng,1,2 Wei Wu,1,2,* Lanxiang Wu1,2,*
1Department of Neurology, the Second Affiliated Hospital, Jiangxi Medical College, Nanchang University, Nanchang, 330006, People’s Republic of China; 2Institute of Neuroscience, Nanchang University, Nanchang, 330006, People’s Republic of China
*These authors contributed equally to this work
Correspondence: Wei Wu; Lanxiang Wu, Email [email protected]; [email protected]
Purpose: Previous studies have shown that pyroptosis plays a vital role in the progress of neuropathic pain (NP), but the molecular mechanisms have not been fully elucidated. The aim of this study was to identify crucial pyroptosis-related genes (PRGs) in NP.
Methods: We identified pyroptosis-related differentially expressed genes (PRDEGs) in NP by machine learning analysis of the GSE24982 and GSE60670 datasets. Furthermore, these PRDEGs were subjected to Gene Ontology (GO), Kyoto Encyclopedia of Genes and Genomes (KEGG) enrichment analysis, Gene Set Enrichment Analysis (GSEA) and Friends analysis, respectively. Meanwhile, receiver operator characteristic (ROC) analysis was performed to assess the diagnostic value of PRDEGs in NP. Finally, we performed immune infiltration analysis of key PRDEGs using CIBERSORTR R package.
Results: We found that 5 PRDEGs by least absolute shrinkage and selection operator (LASSO) regression and random forest and verified by RT-qPCR. GO, KEGG and GSEA revealed that these PRDEGs were mainly enriched in regulation of neuron death, IL-4 signaling, IL-23 pathway, and NF-κB pathway. ROC analysis revealed that most of the PRDEGs performed well in diagnosing NP. We also revealed transcription factors, miRNA regulatory networks and drug interaction networks of PRDEGs. For immune infiltration analysis, PRDEGs were mainly correlated with dendritic cells, monocytes and follicular T helper cells, suggested that it might be involved in the regulation of neuroimmune-related signaling.
Conclusion: A total of five PRDEGs were can be employed as NP biomarkers, particularly Tlr4, Il1b and Casp8, and provide additional evidence for a vital role of pyroptosis in NP.
Keywords: pyroptosis, machine learning, neuropathic pain, neuroinflammation, bioinformatic analysis
Introduction
Neuropathic pain (NP) is primarily caused by disease or injury of the somatosensory system.1 This pain is usually characterized by spontaneous pain, touch-induced pain, nociceptive hyperalgesia, and sensory abnormalities. The majority of patients with chronic neuropathic pain have had the disease for more than 3 months. NP, one of the most common forms of chronic pain, is experienced by 6.9% to 10% of the world’s population, with epidemiological surveys in France and the United Kingdom showing a prevalence of 7% to 8%.2,3 Most of these patients’ mental health and social functioning are severely and adversely affected, resulting in a reduced quality of life for the patient, which places a heavy burden on the individual, family and society.4 However, the pathogenesis of NP is not fully understood, and there is still a lack of effective treatment methods. In the face of such a large population of patients, the existing clinical treatments cannot effectively relieve the clinical symptoms of most patients with NP, for example, the commonly used opioids and NSAIDs have limited effects on the treatment of NP, in addition to inducing a variety of adverse effects.5 Currently, the incidence of NP is still on the rise, and the medical costs are increasing year by year, which has become one of the major public health problems in the world.6 Therefore, there is an urgent need to further elucidate the potential pathogenesis of neuropathic pain and provide new insights and theoretical basis for effective treatment.
Pyroptosis, also known as inflammatory cell necrosis, is a newly discovered mode of cell death that is mainly characterized by cell swelling, cell membrane rupture, and release of inflammatory factors and cell contents.7 Pyroptosis is dependent on caspase-1 activation, a unique inflammatory mechanism that regulates cell death.8 Furthermore, Gasdermin D (GSDMD) promotes the formation of pyroptosomes and caspase-1-mediated pyroptosis and forms membrane pores in the cell membrane, inducing the release of large amounts of pro-inflammatory factors IL-1β and IL-18 as well as cell death.9 Pyroptosis is closely related to neurodegenerative diseases, stroke, epilepsy and other central nervous system diseases, and has become a hot topic of research on the pathogenesis of nervous system diseases.10 Researchers have revealed that inflammatory and immune mechanisms in the peripheral and central nervous system exert a crucial role in NP, such as infiltration of inflammatory cells and activation of innate immune cells in response to neurological injury leading to the subsequent production and secretion of various inflammatory mediators.11 These mediators promote neuroimmune activation, sensitize primary afferent neurons and cause hypersensitivity to pain. Pyroptosis mediated by the NLRP3/GSDMD axis is an important factor in the inflammatory activation of immune cells in chronic pain.12 In addition, Hua et al found that inhibition of pyroptosis could effectively suppress the neuroinflammatory response and ultimately provide significant relief from NP through in vivo and in vitro experiments.13 Therefore, pyroptosis might be a potential target for intervention in neuropathic pain. However, the molecular mechanisms underlying the interaction between pyroptosis and NP remain unclear. Thus, further studies are necessary.
Most recent research on key biomarkers of neuropathic pain has focused on inflammatory changes in the spinal cord and dorsal root ganglia.14,15 Unfortunately, due to time and cost constraints, all investigators did not include a large enough sample size and did not analyze the spinal cord and dorsal root ganglia (DRG) simultaneously as a way to validate each other, so these might not fully elucidate the key genes for neuropathic pain. At present, we selected two spinal cord and DRG gene datasets separately for secondary analysis to verify each other and identify crucial biomarkers of neuropathic pain.16,17 Moreover, this study explored the association between pyroptosis-related genes and NP at the gene level, with pyroptosis gene extraction, machine learning (LASSO regression and Random Forest) screening, and logistic regression to construct pyroptosis-related gene signatures to obtain key pyroptosis-related biomarkers. Finally, we constructed related regulatory networks, revealed potential therapeutic agents, obtained information on the correlation between key pyroptosis-related genes and immune infiltrating cells and verified the expression levels of pyroptosis-related genes using RT– qPCR. Through this research, we hope to provide a reference for pyroptosis as a therapeutic target for NP and these pyroptosis-related biomarkers might be used for disease diagnosis and treatment monitoring.
Materials and Methods
Microarray Data Collection
Microarray data (GSE24982 and GSE60670) were obtained from the Gene Expression Omnibus (GEO) database (https://www.ncbi.nlm.nih.gov/geo/) through GEOquery R package.18 Due to the lack of NP-related microarray data and the high degree of homology between rat and mice genes, we selected rat and mice gene datasets for bioinformatics analyses.19 As shown in Table 1, GSE24982 consisted of the expression profiles of 20 rats in the NP group and 20 control rats.20 GSE60670 consisted of the expression profiles of 6 mice in the NP group and 6 mice in the control group.21 The GeneCards database (http://www.genecards.org/) provides comprehensive information on human genes, and we used the word “Pyroptosis” as a search term and only retained the genes with “Protein Coding” and “Relevance score >0.500”, and finally obtained 308 PRGs from the GeneCards database.22 Subsequently, we included 62 PRGs from the published literature, and we converted PRGs from the GeneCards database and published literature into mice genes via the homologene R package.23,24 In addition, “Pyroptosis” was used as a search term in Molecular Signatures Database (MSigDB) (https://www.gsea-msigdb.org/) to obtain the BUFFA_HYPOXIA_ METAGENE reference gene set, resulting in a total of 21 PRGs.25 Finally, a total of 252 PRGs were obtained after merging and de-duplication, and the specific gene names are shown in Table S1.
 |
Table 1 List of Neuropathic Pain Datasets Information |
Identification of Differentially Expressed Genes
The GSE24982 and GSE60670 datasets were first normalized using the limma R package.26 Then, differential analysis was performed by using the limma R package for different groups of genes in the GSE24982 and GSE60670 datasets. The genes selected by the criteria of |logFC| >0 and p value <0.05 were identified as differentially expressed genes (DEGs).27,28 In order to obtain the PRDEGs for neuropathic pain, we first intersected all the DEGs obtained from the differential analysis of GSE24982 and GSE60670 datasets and draw a Venn diagram to obtain the common differentially expressed genes (Co-DEGs) of both datasets. Then, we took the intersection of these Co-DEGs with the PRGs and draw a Venn diagram. Finally, the results of differential analysis were presented by ggplot2 R package for volcano plotting and pheatmap R package for heat map plotting.
GO and KEGG Enrichment Analysis
GO analysis is a generalized method for conducting large-scale functional enrichment studies, including biological process (BP), molecular function (MF) and cellular component (CC).29 The KEGG is a widely used database for storing information about genomes, biological pathways, diseases and drugs.30 We used the clusterProfiler R package to perform GO annotation analysis and KEGG pathway enrichment analysis on PRDEGs.31 The screening criterion for item was P. adj. <0.05 was considered statistically significant, and the P-value correction method was Benjamini–Hochberg (BH).
Gene Set Enrichment Analysis (GSEA)
GSEA is an algorithm that analyzes whether a specific gene set is statistically different between two biological states and is commonly used to assess the activity of pathways and biological processes in expression datasets.32 We used the clusterProfiler R package to perform GSEA on the GSE24982 and GSE60670 datasets. The parameters used for this GSEA were as follows: the seeds were 2023, the number of calculations was 100,000, the number of genes containing at least 10 and a maximum of 500 genes per gene set, and the P-value correction method was BH. We acquired the c2.all.v2022.1.Hs.symbols.gmt gene set from the Molecular Signatures Database (MSigDB), and the screening criterion for significant enrichment was P. adj. <0.05 and FDR value <0.25.
Construction of Diagnostic Models for Common Pyroptosis Related Differentially Expressed Genes
RandomForest (RF) is an algorithm that integrates multiple decision trees through the idea of integration learning, and belongs to the bagging integration algorithm (bootstrap aggregation) of integration algorithms, which is a combination of multiple algorithms.33 We used RF R package to construct a model with the expression of PRDEGs in the expression matrix of GSE24982 with parameters set.seed (234) and ntree = 1000.34

To obtain the logistic diagnostic model of GSE24982, we performed logistic regression analysis on PRDEGs. The logistic diagnostic model was constructed by screening the PRDEGs with p value <0.05, and then the gene expression of the PRDEGs included in the logistic regression model was displayed by forest plot. We performed LASSO regression analysis based on PRDEGs by glmnet R package with set.seed (500), family = “binomial” as parameters, resulting in a logistic-LASSO regression model.35,36 To avoid overfitting, the run period was 200. LASSO regression analysis was based on linear regression analysis by adding a penalty term (absolute value of lambda × slope) to reduce the overfitting of the model while improving the generalization ability of the model. Finally, we visualized the results of the LASSO regression analysis by diagnostic model plots and variable trajectory plots.

We intersected the PRDEGs contained in the logistic-LASSO regression model and the PRDEGs contained in the RF model to obtain the common pyroptosis related differentially expressed genes (Co-PRDEGs). Then, we obtained the Co-PRDEGs diagnostic model, and the corresponding riskscores based on the coefficients of Co-PRDEGs in the logistic-LASSO regression model and the gene expression in the GSE24982 dataset. Finally, we used the results of the Co-PRDEGs diagnostic model obtained from the logistic-LASSO regression analysis and then used the rms R package to draw a nomogram to demonstrate the interrelationship of the Co-PRDEGs included in the Co-PRDEGs diagnostic model.37
Receiver Operating Characteristic Curve (ROC) Analysis
The ROC, a coordinate graphical analysis tool, can be used to select the best model, discard the secondly best model or set the best threshold in the same model.38 The interrelationship between sensitivity and specificity and the area under the ROC curve generally has values between 0.5 and 1. We used the pROC R package to plot the ROC curves of Co-PRDEGs between different subgroups in the GSE24982 and GSE60670 datasets and calculated the area under curve (AUC) to evaluate the diagnostic effect of Co-PRDEGs on individuals with disease.
PPI Network Construction
Protein–protein interaction (PPI) network is composed of individual proteins that interact with each other to participate in various aspects of life processes such as biological signaling, regulation of gene expression, energy and material metabolism, and cell cycle regulation. GeneMANIA database (http://genemania.org) is a website for analysis of gene functions in input gene lists, prediction and generation of gene priorities.39 We used the GeneMANIA database to construct and visualize protein–protein interaction networks associated with Co-PRDEGs. Tightly linked local regions in the PPI network might represent molecular complexes with specific biological functions. We treat Co-PRDEGs in PPI networks as hub genes.
Establishment of TFs-Co-PRDEGs, miRNAs – Co-PRDEGs, Drugs – Co-PRDEGs Regulatory Networks
The miRDB database was used for miRNA target gene prediction and functional annotation.40 We used the miRDB database to predict miRNAs that interact with Co-PRDEGs and then selected data with target score >80 from the miRDB database and constructed miRNA–mRNA interaction networks.
The CHIPBase database (version 3.0) (https://rna.sysu.edu.cn/chipbase/) identifies thousands of binding motif matrices and their binding sites from ChIP-seq data of DNA-binding proteins and predicts the transcriptional regulatory relationships between millions of transcription factors (TFs) and genes.41 The hTFtarget database (http://bioinfo.life.hust.edu.cn/hTFtarget) is a comprehensive database containing data on TFs and their regulatory targets.42 We used the CHIPBase database and the hTFtarget database to find TFs that bind to Co-PRDEGs and visualized them using Cytoscape software. In addition, we used the Comparative Toxicogenomics Database (CTD) (http://ctdbase.org/) to predict potential drugs or small-molecule compounds interacting with Co-PRDEGs.43
Immune Infiltration Analysis
CIBERSORT is an immune infiltration analysis algorithm based on the principle of linear support vector regression to deconvolute the transcriptome expression matrix to estimate the composition and abundance of immune cells in a mixture of cells.44 We used the CIBERSORTR R package to filter through the expression matrices of the 2 datasets and the LM22 signature gene matrix to identify data with immune cell enrichment scores greater than zero and then visualized the results of the immune cell infiltration abundance matrix.45 The correlation between different immune cells in the samples of two dataset was calculated by the spearman algorithm and visualized by the ggplot2 R package. We then calculated the correlations of immune cells with Co-PRDEGs through the gene expression matrix of both datasets and plotted the correlation points diagram using the ggplot2 R package.
Animals and Ethics
All animal experiments were approved by the Ethics Committee of Nanchang University (Number: NCULAE-20221031057). Specific pathogen-free (SPF) Sprague–Dawley male rats (6–8 weeks) were purchased from Charles River (Beijing, China) and cared for in accordance with the National Institutes of Health Guidelines for the use of laboratory animals. All rats were individually maintained on controlled temperature (22±2 °C) with a 12 h light–dark cycle. At the same time, the animals were given enough water and food.
Construction of the CCI Rat Model
All rats were randomly divided into sham group and NP group, with 5 rats in each group. For the NP animal model, rats were treated with chronic constriction injury (CCI) surgery according to our previous study.46 We measured mechanical withdrawal threshold (MWT) value on the injured side of the rats with a set of von frey filaments, and thermal withdrawal latency (TWL) was measured using the hot-plate test.47 A study has shown that the CCI model is often chosen as the most general NP model to confirm gene expression compared to other peripheral nerve injuries that cause neuropathic pain, such as spinal nerve ligation (SNL) and spared nerve injury (SNI).48 Therefore, we chose the CCI model over other peripheral nerve injury models to validate the expression of Co-PRDEGs. The rats were rapidly anesthetized by a 5% isoflurane and oxygen mixture, and then full anesthesia was achieved by continuous input of a 2% isoflurane and oxygen mixture through the face mask. Finally, CO2 inhalation resulted in sacrificing the animals. Then, homogenized ipsilateral L4 and L5 DRG tissue of rat were isolated, and stored at −80°C until further processing.
RT-qPCR Analysis
Total RNA was isolated using RNAiso Plus RNA Extraction Lysate (Japan TAKARA, TKR-9109). The PRDEGs were verified by RT-qPCR using TB Green Premix Ex Taq™ Tli RNaseH Plus (Japan TAKARA, TKR-RR420) and ABI StepOnePlus (USA, KR116-02). The primer sequences were designed through using Primer 3.0 and described in Table 2. β-actin was employed as an internal control. All reactions run in triplicate and the relative gene expression was calculated using the 2−ΔΔCt method.
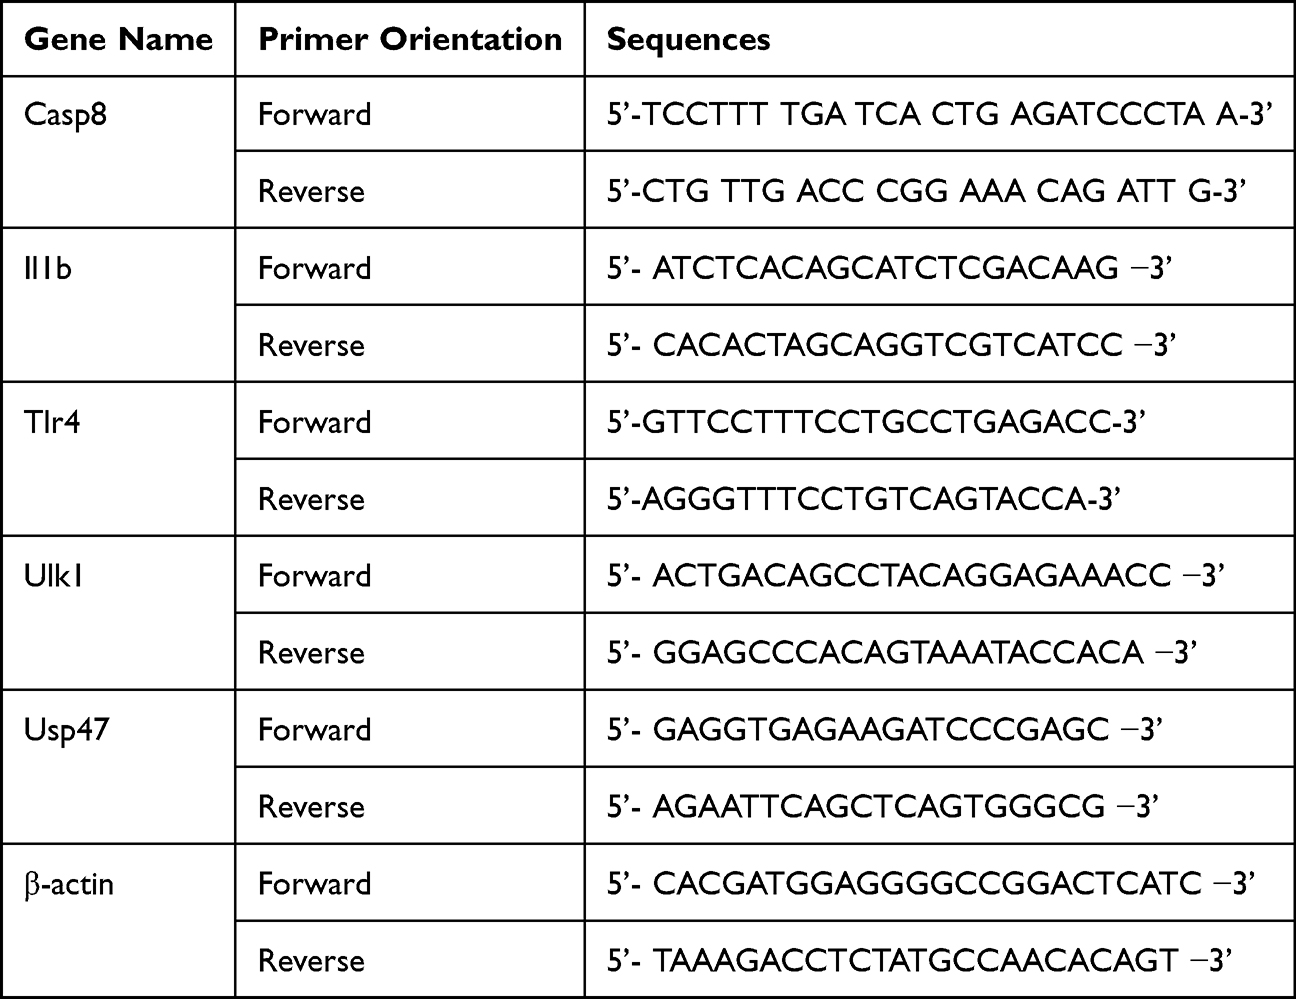 |
Table 2 The Primer Sequences for PCR |
Statistical Analysis
All data processing and analysis in this article were based on Graph Pad Prism 9.0 or R software (Version 4.1.2), and continuous variables were presented as mean ± standard deviation. Comparisons between two groups were made using the Wilcoxon rank sum test or two-tailed t-test. If not specified, correlation coefficients between different molecules were calculated by Spearman correlation analysis, and all results were considered significantly different with a p-value less than 0.05.
Results
Identification of DEGs and PRDEGs
The analysis flow of this study is shown in Figure 1. We first normalized the GSE24982 and GSE60670 datasets and plotted boxplots showing the gene expression profiles before and after processing (Figure 2A–D). During the normalization process, the data is transformed into a standard normal distribution with a mean of 0 and a variance of 1. Therefore, the range of values of the vertical coordinates in the boxplot should be close to the vicinity of 0 and relatively small. The range of values for the vertical coordinates of this boxplot is relatively small, so it was determined that the normalization was successful. The normalized expression matrix was subjected to principal component analysis (Figure 3A and B), which further ensured the accuracy of the subsequent data analysis. The differential expression analysis of the GSE24982 dataset was shown in Figure 3C, and a total of 7869 DEGs were obtained, including 4195 up-regulated genes and 3674 down-regulated genes. The differential expression analysis of GSE60670 was shown in Figure 3D, and a total of 1350 DEGs were obtained, including 702 up-regulated genes and 648 down-regulated genes. Then, we intersected the DEGs obtained from the GSE24982 and GSE60670 datasets and obtained a total of 453 Co-DEGs (Figure 3E). We also intersected the Co-DEGs and the PRGs in the datasets and obtained a total of 7 PRDEGs for neuropathic pain (Figure 3F). Finally, the results of differential expression analysis of 7 PRDEGs in the GSE24982 and GSE60670 datasets were shown in Figure 3G and H.
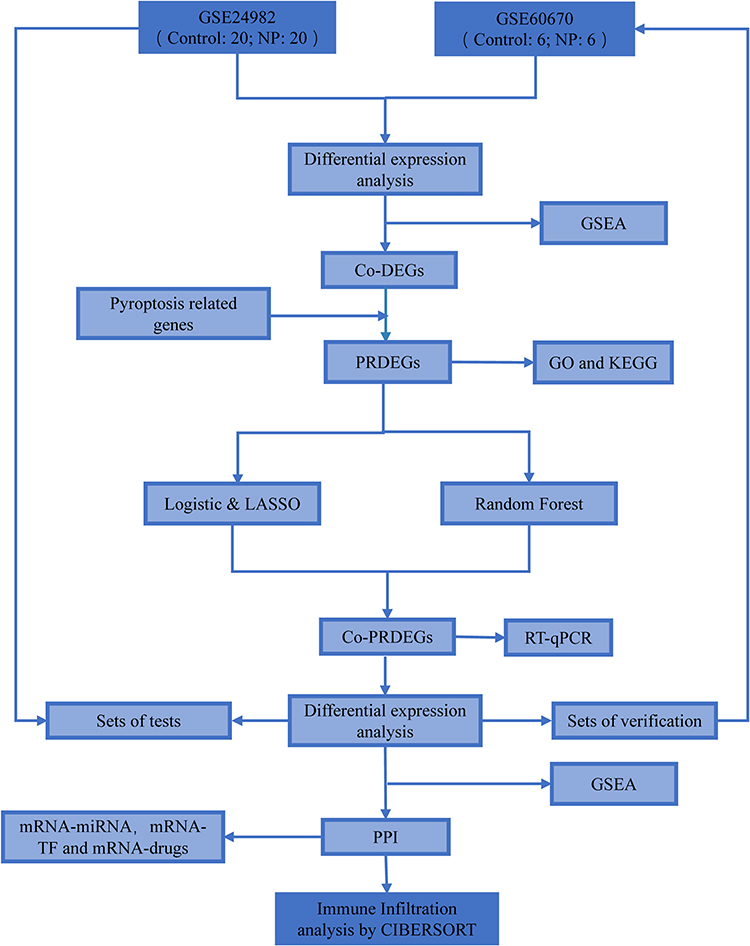 |
Figure 1 Analysis flowchart. |
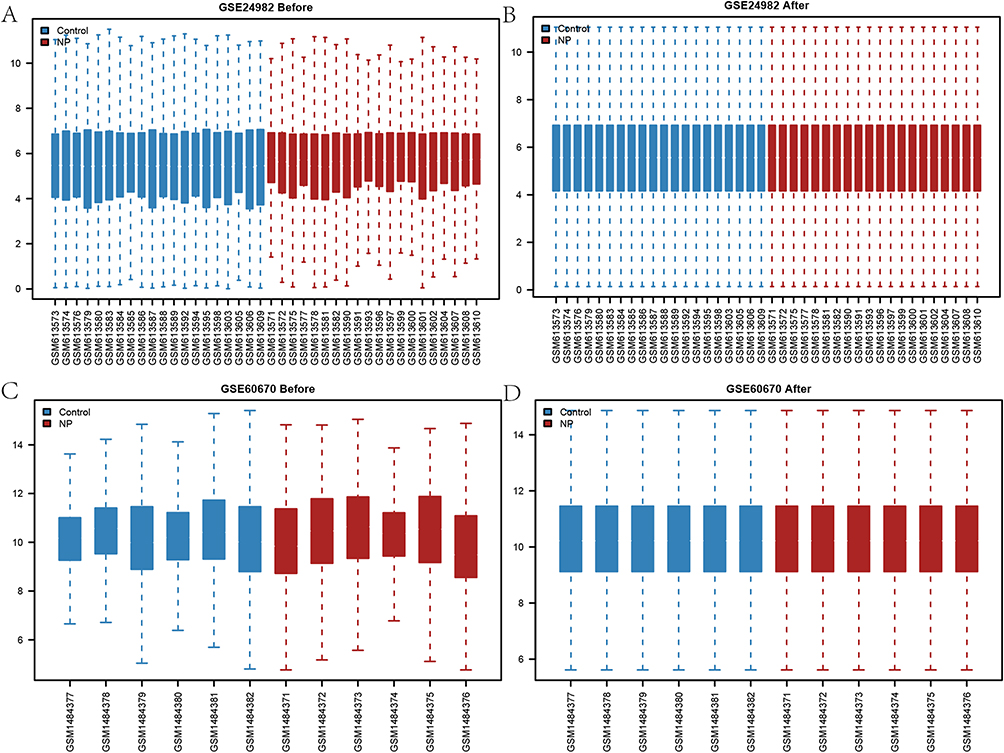 |
Figure 2 Datasets normalization. (A) GSE24982 dataset before normalization. (B) GSE24982 dataset after normalization. (C) GSE60670 dataset before normalization. (D) GSE60670 dataset after normalization. |
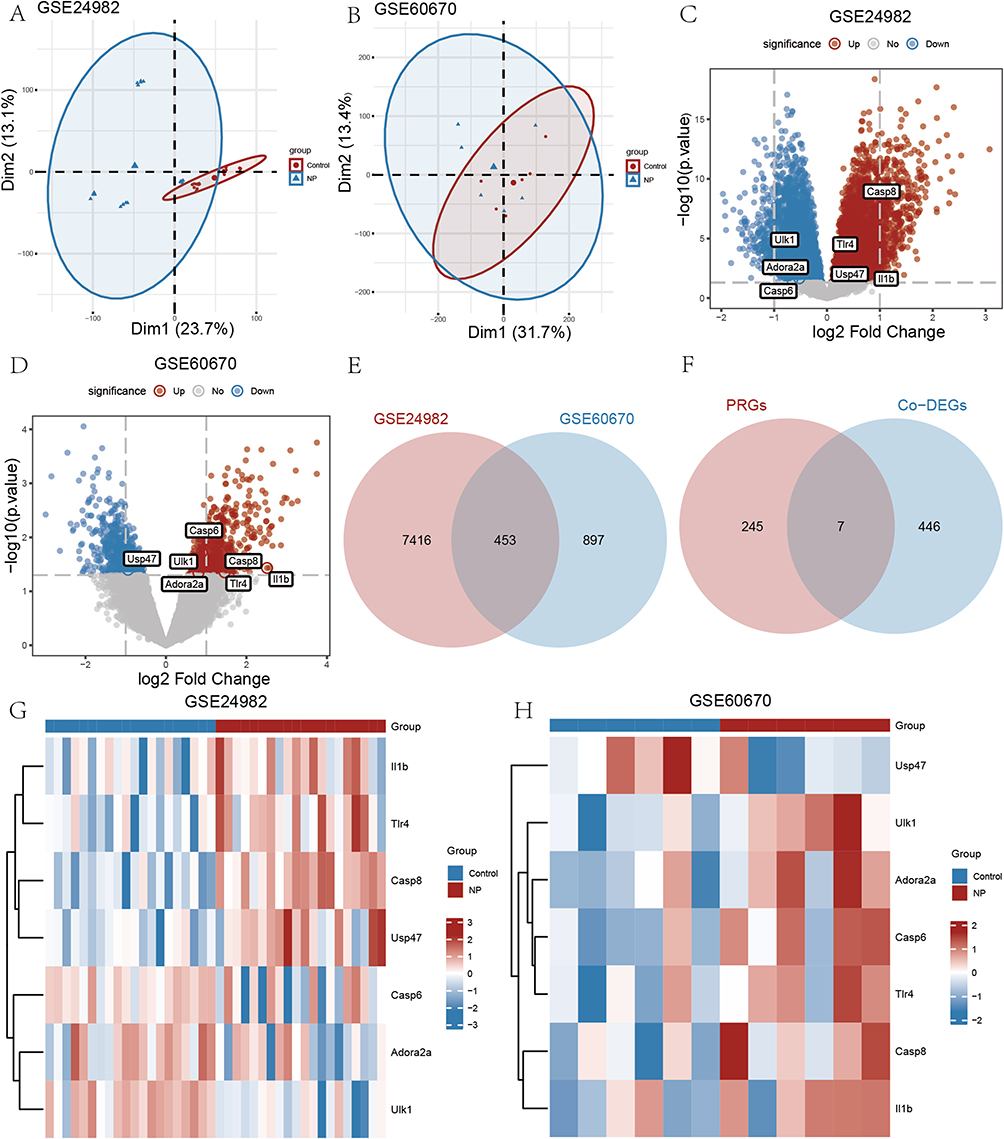 |
Figure 3 Identification of PRDEGs. (A and B) Principal component analysis of the GSE24982 and GSE60670 datasets. (C) The DEGs between NP and control group in the GSE24982 dataset. (D) The DEGs between NP and control group in the GSE60670 dataset. (E) Co-DEGs between GSE24982 and GSE60670 datasets. (F) PRDEGs between PRGs and Co-DEGs. (G and H) Expression levels of PRDEGs in the GSE24982 and GSE60670 datasets. |
Diagnostic Value of Pyroptosis -Related Biomarkers in NP
We first plotted chord diagram showing the correlations between the 7 PRDEGs based on their specific expression in the GSE24982 dataset (Figure 4A), and the results showed that the number of genes with positive and negative correlations between the 7 PRDEGs accounted for half of them, respectively. We then plotted chord diagrams based on the specific expressions of the 7 PRDEGs in the GSE60670 dataset to show the correlations among the 7 PRDEGs (Figure 4B), and the results showed that the 7 PRDEGs were mainly positively correlated with each other. ROC monofactor analysis was conducted in different datasets to assess the diagnostic value of 7 PRDEGs biomarkers in NP. As a result, the accuracy of Adora2a, Casp6, Casp8, Il1b, Tlr4, Ulk1 and Usp47 in the diagnosis of NP was 0.695, 0.638, 0.958, 0.749, 0.805, 0.917 and 0.823, respectively, in the GSE24982 dataset (Figure 4C–I). The ROC diagnostic accuracy of 7 PRDEGs biomarkers for NP was 0.806, 0.917, 0.833, 0.806, 0.806, 0.892 and 0.889, respectively, in the GSE60670 dataset (Figure 4J–P).
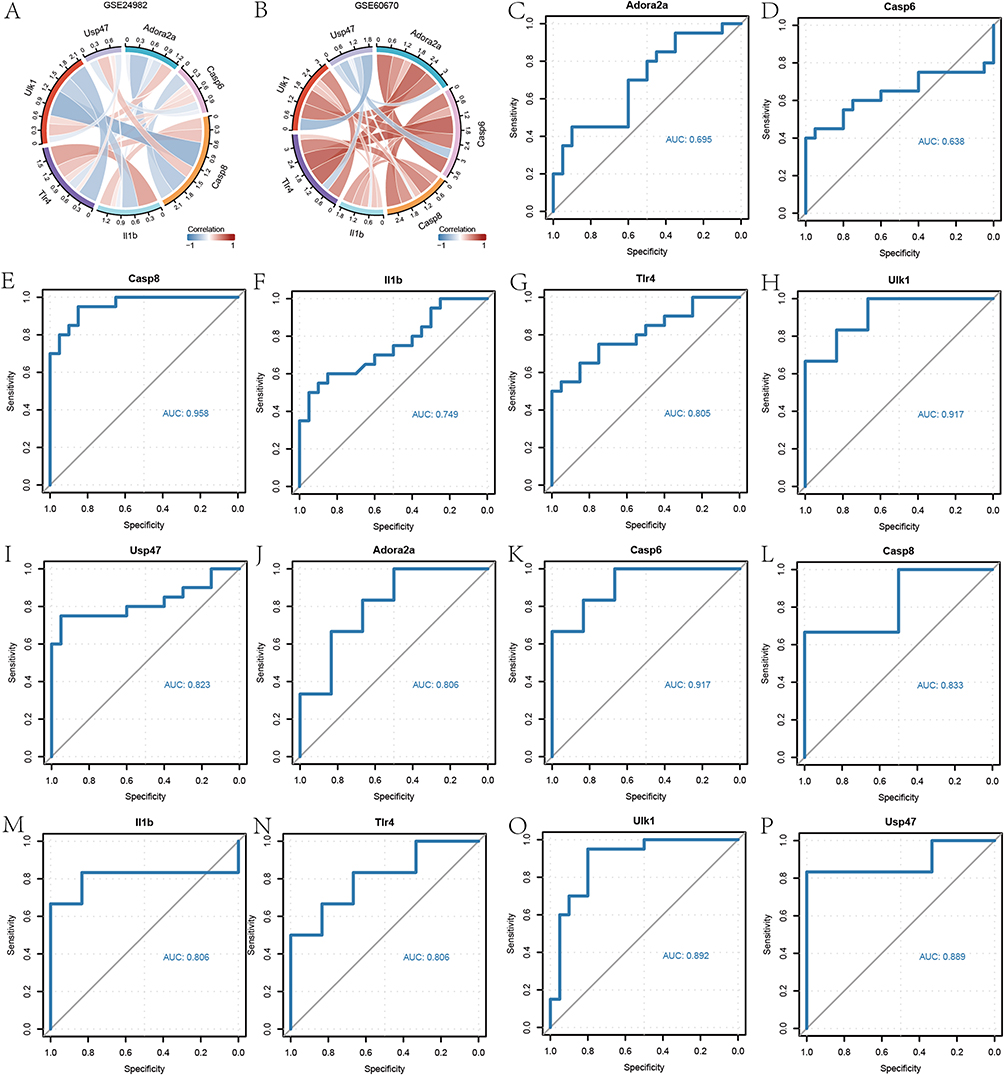 |
Figure 4 Diagnostic value of pyroptosis-related biomarkers in NP. (A and B) Correlation between 7 PRDEGs in the GSE24982 and GSE60670 datasets. (C–I) The AUC of pyroptosis-related biomarkers in the diagnosis of NP in ROC analysis in the GSE24982 dataset. (J–P) The AUC of pyroptosis -related biomarkers in the diagnosis of NP in ROC analysis in the GSE60670 dataset. |
GO and KEGG Enrichment Analysis of PRDEGs
The GO-enriched entries and enrichment pathways were listed in Tables 3 and 4. The results of GO enrichment analysis were shown in Figure 5A. According to the GO-BP category analysis, 7 PRDEGs were mainly related to regulation of neuron death, positive regulation of neuron death, neuron death, astrocyte development, and glial cell activation (Figure 5B). The GO-CC items showed that these 7 PRDEGs were mainly located in caspase complex, endopeptidase complex, peptidase complex, phagophore assembly site membrane, and membrane raft (Figure 5C). According to the GO-MF category analysis, these 7 PRDEGs were involved in cysteine-type endopeptidase activity, cysteine-type endopeptidase activity involved in apoptotic process, cysteine-type peptidase activity, endopeptidase activity, and cytokine receptor binding (Figure 5D). In the pathway enrichment analyses, 7 PRDEGs were mainly related to lipid and atherosclerosis, legionellosis, Toll-like receptor signaling pathway, chagas disease, and alcoholic liver disease (Figure 5E and F).
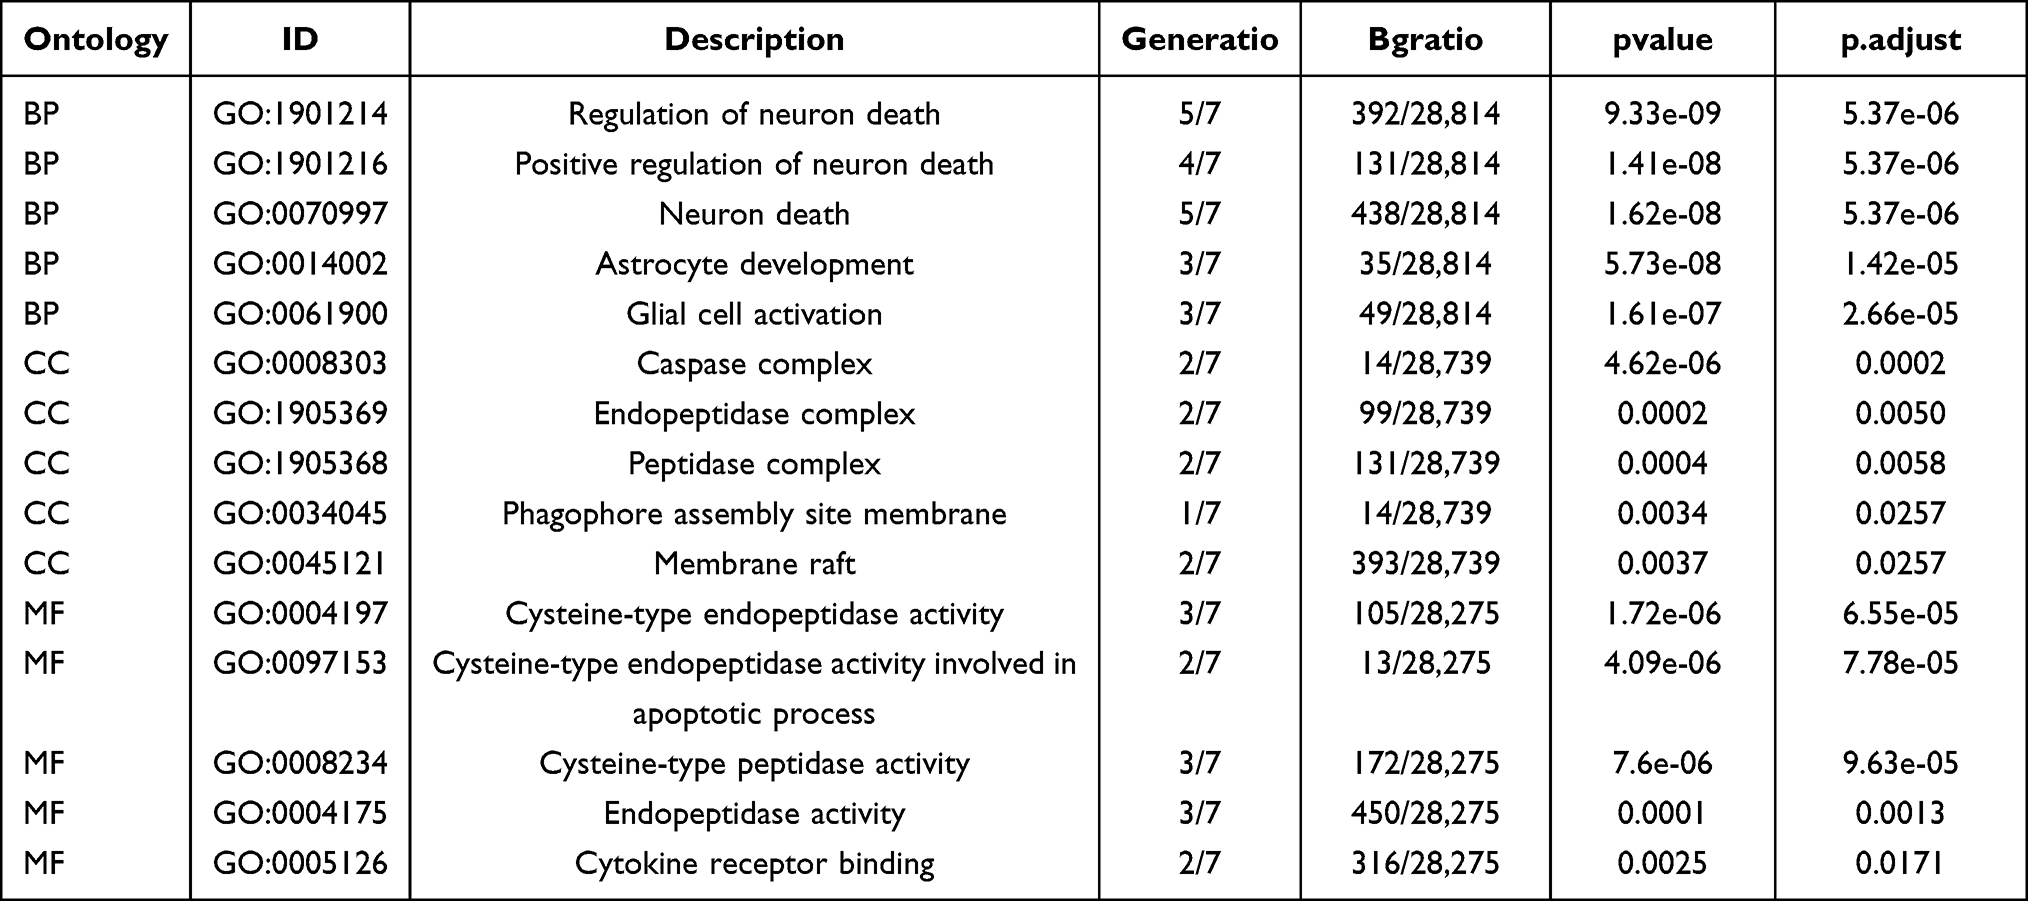 |
Table 3 GO Enrichment Analysis Results of Pyroptosis Related Differentially Expressed Genes |
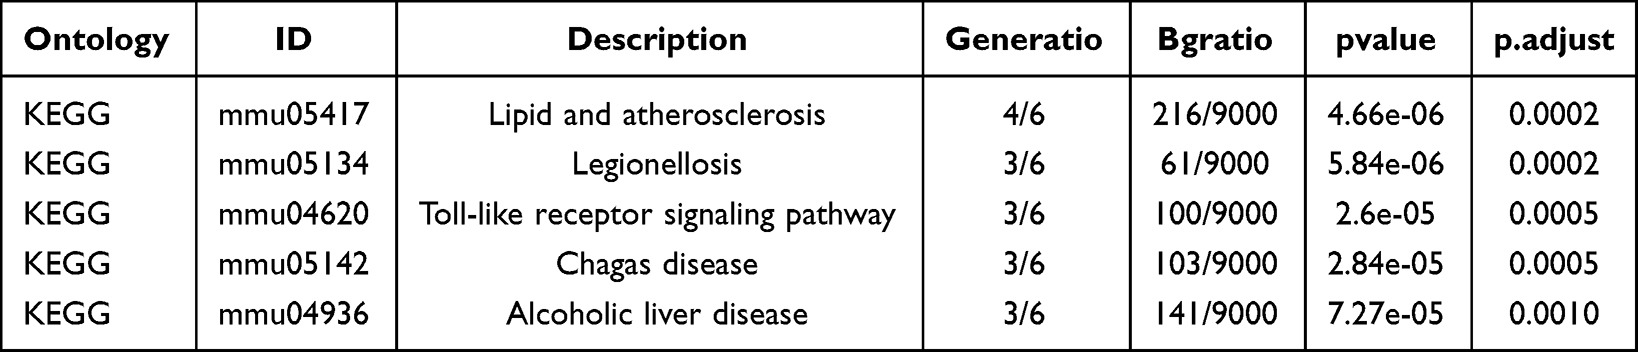 |
Table 4 KEGG Enrichment Analysis Results of Pyroptosis Related Differentially Expressed Genes |
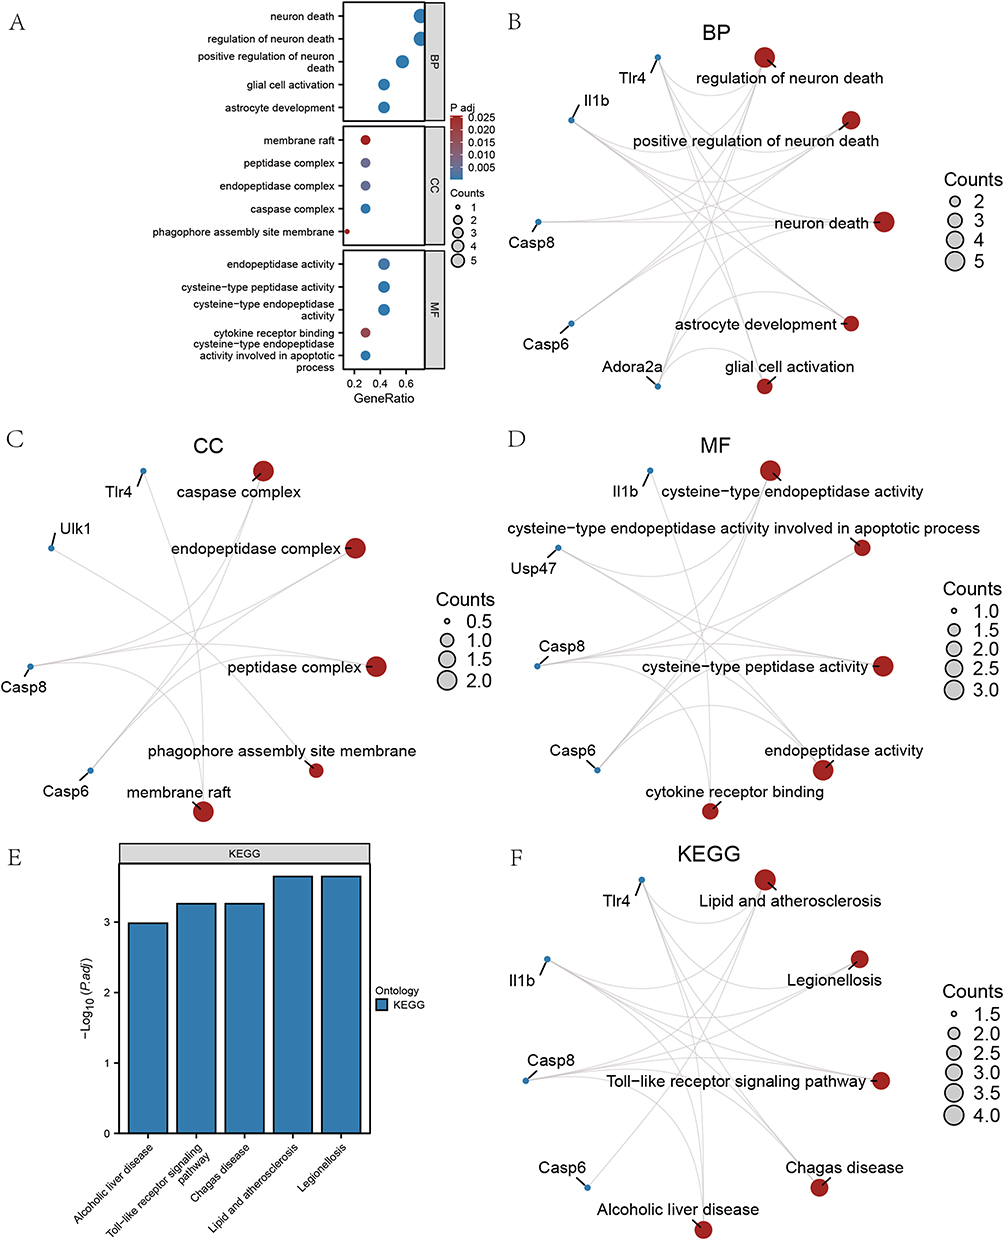 |
Figure 5 GO and KEGG enrichment analysis for PRDEGs. (A) Histogram of GO analysis of PRDEGs. (B–D) Network diagram of BP, CC, MF category of PRDEGs. (E) Histogram of KEGG enrichment analysis of PRDEGs. (F) Network diagram of KEGG enrichment analysis of PRDEGs. |
Results of GSEA for Two Datasets
The GSEA results for GSE24982 and GSE60670 datasets were presented in Table 5 and Table S2. The top 4 pathways enriched in the GSE24982 dataset were drawn as ridge plot (Figure 6A). The results showed that genes were significantly enriched in Schoen NF-κB signaling (Figure 6B), TP53 signaling (Figure 6C), IL-12 Pathway (Figure 6D), TNF signaling via NF-κB (Figure 6E). The top 4 pathways enriched in the GSE60670 dataset were drawn as ridge plot (Figure 6F). The results showed that genes were significantly enriched in Rutella response to hgf vs csf2rb and IL-4 up (Figure 6G), IL-4 signaling (Figure 6H), overview of proinflammatory and profibrotic mediators (Figure 6I), Rutella response to csf2rb and IL-4 (Figure 6J). In addition, we took the intersection of all functional pathways significantly enriched by GSEA for the GSE24982 and GSE60670 datasets and plotted the Venn diagram (Figure 6K), which showed that a total of 68 pathways were significantly enriched by both datasets.
 |
Table 5 GSEA Analysis of GSE24982 Dataset Between NP and Control Groups |
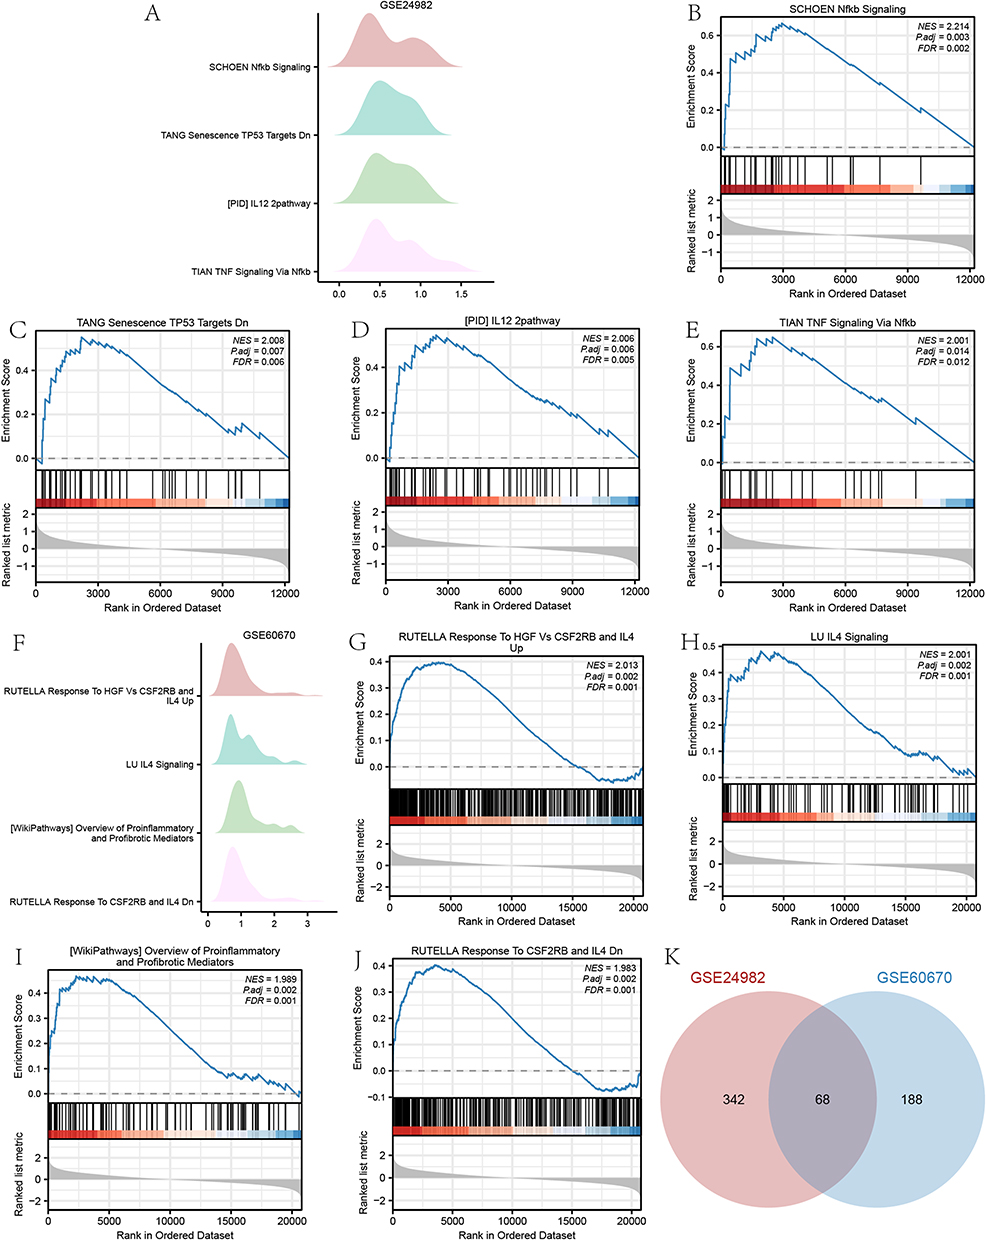 |
Figure 6 Results of GSEA enrichment analysis. (A) Ridge plot of top 4 pathways of GSE24982. (B–E) Enrichment plot of top 4 pathways of GSE24982. (F) Ridge plot of top 4 pathways of GSE60670. (G–J) Enrichment plot of top 4 pathways of GSE60670. K Overlapping enrichment pathways in the GSE24982 and GSE60670 datasets. |
Construction of Diagnostic Models for PRDEGs and Its Diagnostic Value
To further determine the diagnostic value of the 7 PRDEGs in GSE24982 dataset, we first constructed logistic regression models based on the expression of the 7 PRDEGs in the GSE24982 dataset and the grouping information (NP/Control) of the GSE24982 dataset. We then visualized the expressions of the 7 PRDEGs by forest plot (Figure 7A). We also analyzed the expression of 7 PRDEGs in GSE24982 dataset using RF algorithm (Figure 7B), and IncNodePurity >0.3 was used as a criterion for screening. The results showed that all 7 PRDEGs met the criteria (Figure 7C).
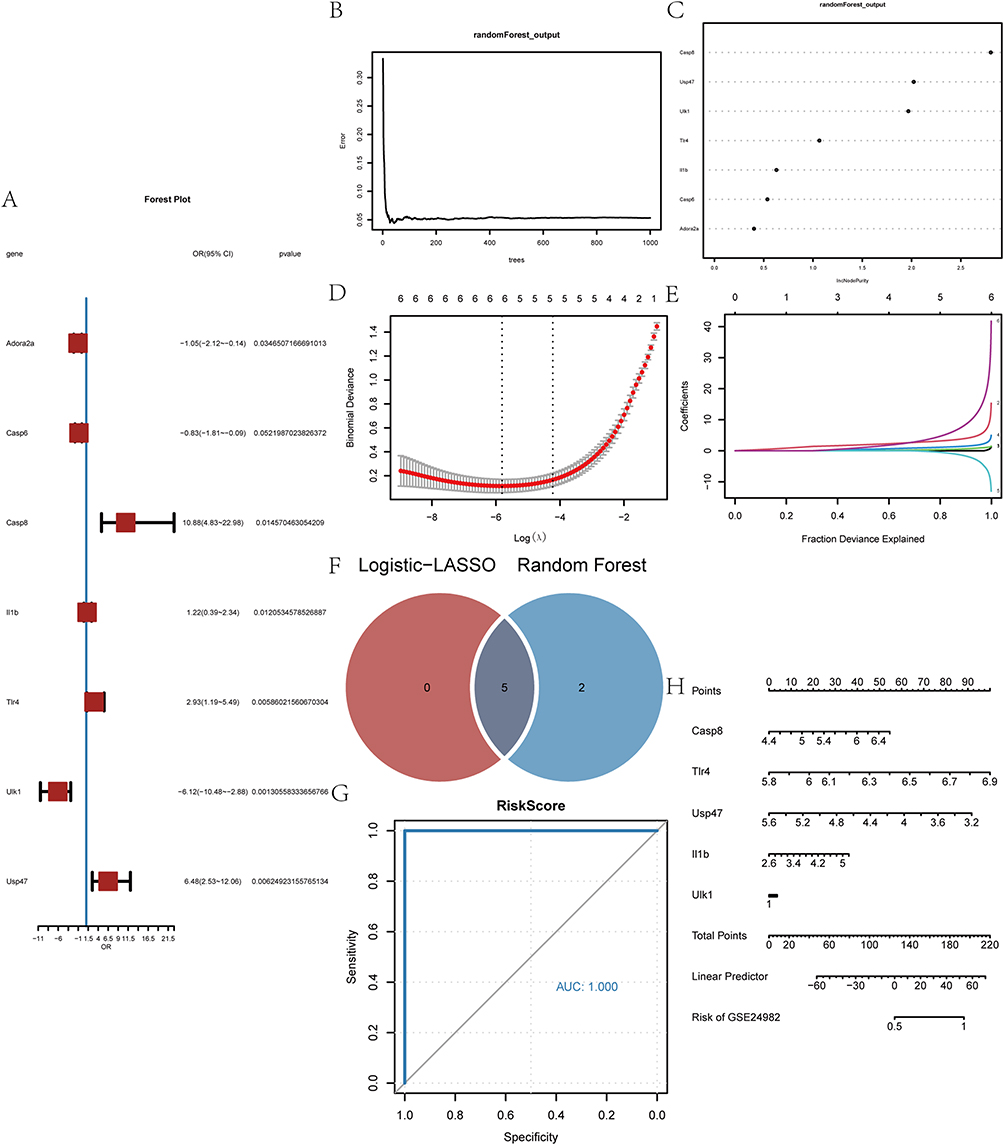 |
Figure 7 Construction of diagnostic models for PRDEGs and its diagnostic value. (A) Forest plot of logistic regression model for PRDEGs. (B) Model training error plot for random forest algorithm. (C) IncNodePurity values for PRDEGs in RF models. (D and E) Diagnostic model plot of LASSO regression model and trajectory of variables. (F) Overlapping PRDEGs in Logistic-LASSO regression models and RF models. (G) ROC curves of Co-PRDEGs model in GSE24982 dataset. (H) Nomogram of 5 Co-PRDEGs in the Co-PRDEGs model. |
Next, we constructed diagnostic models based on the expression level of 7 PRDEGs in the GSE24982 dataset by LASSO regression analysis. The results of the analysis were visualized by plotting the LASSO regression model (Figure 7D) and the LASSO regression variable trajectory (Figure 7E). The results showed that the diagnostic model contains a total of 5 PRDEGs, namely, Casp8, Il1b, Tlr4, Ulk1, and Usp47. We took the intersection of PRDEGs from Logistic-LASSO regression and PRDEGs from RF model to obtain a total of 5 Co-PRDEGs (Figure 7F), which were: Casp8, Il1b, Tlr4, Ulk1, Usp47. Finally, we obtained the diagnostic model of Co-PRDEGs and the corresponding riskscores based on the following equation.

To further validate the diagnostic value of the Co-PRDEGs model, we plotted ROC curves based on the riskscore of Co-PRDEGs and the grouping information (NP/control) of the GSE24982 dataset. As shown in Figure 7G, the expression levels of riskscores of Co-PRDEGs model in the GSE24982 dataset were found to have high accuracy for the diagnostic results of both groups. We also plotted nomogram showing the contribution of the 5 Co-PRDEGs to the Co-PRDEGs diagnostic model (Figure 7H). The results showed that the utility of Tlr4 and Casp8 on the Co-PRDEGs diagnostic model was significantly higher than that of the other Co-PRDEGs.
ROC Analysis in the High-and Low-Risk Groups and Friends Analysis of Co-PRDEGs
We divided the NP group sample in the GSE24982 dataset into high- and low-risk groups based on the median risk score. As shown in Figure 8A–E, there was certain accuracy in the diagnostic value of Casp8 (AUC = 0.835, Figure 8A), Il1b (AUC = 0.889, Figure 8B), Tlr4 (AUC = 0.778, Figure 8C) expression level for the high- and low-risk groups of the GSE24982 dataset, while the diagnostic value of Ulk1 (AUC = 0.650, Figure 8D) and Usp47 (AUC = 0.650, Figure 8E) expression level existed only with lower accuracy for the diagnostic value of the high- and low-risk groups of the GSE24982 dataset. Similarly, we perform the same grouping analysis for the GSE60670 dataset. As shown in Figure 8F–J, the expression level of Casp8 (AUC = 1.000, Figure 8F) had a high accuracy for the diagnostic value of the GSE60670 dataset in the high- and low-risk group, while the expression level of Il1b (AUC = 0.520, Figure 8G), Tlr4 (AUC = 0.450, Figure 8H), Ulk1 (AUC = 0.667, Figure 8I), and Usp47 (AUC = 0.778, Figure 8J) had diagnostic values for the high- and low-risk groups of the GSE60670 dataset with certain accuracy.
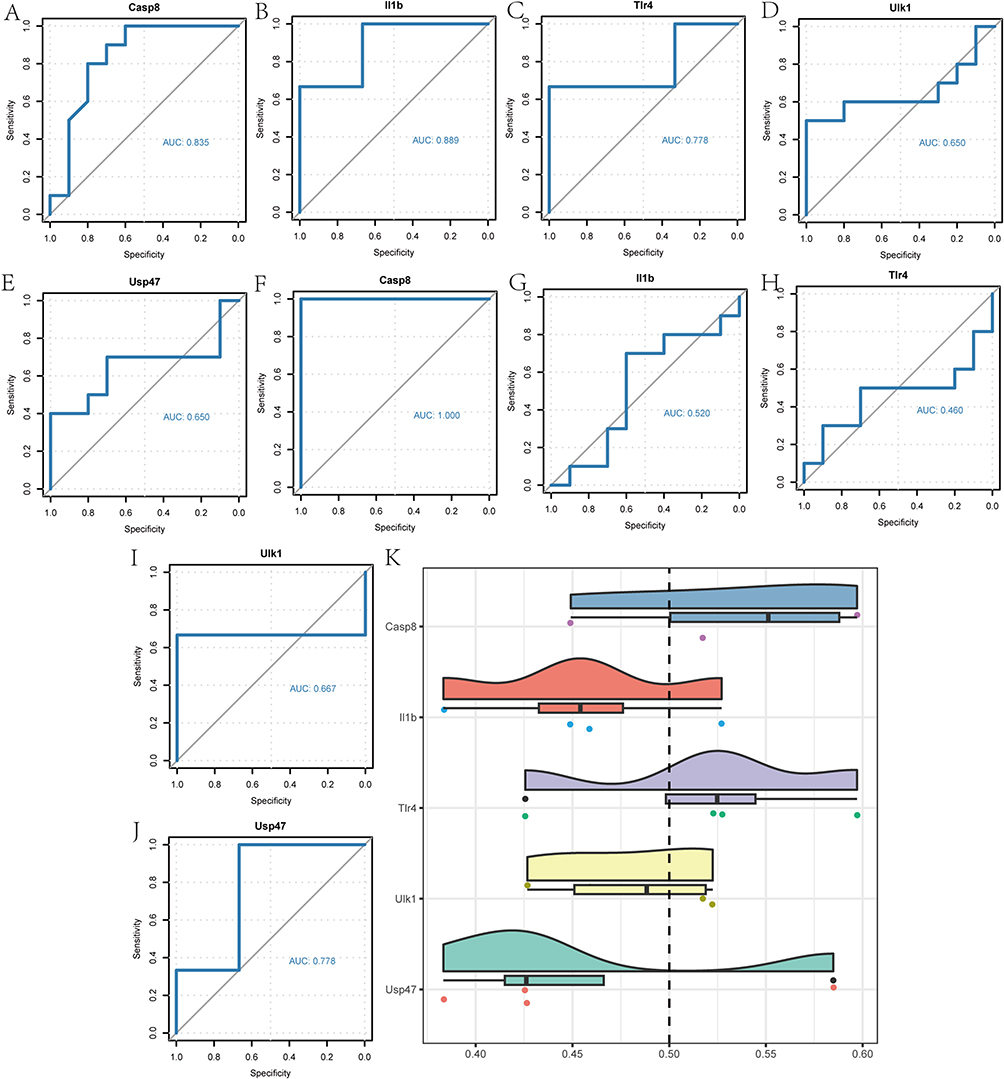 |
Figure 8 ROC analysis in the high-and low-risk groups and Friends analysis of Co-PRDEGs. (A–E) ROC curves of 5 Co-PRDEGs in the GSE24982 dataset. (F–J) ROC curves of 5 Co-PRDEGs in the GSE60670 dataset. (K) Friends analysis of 5 Co-PRDEGs. |
Finally, we calculated the semantic similarity between GO terms, sets of GO terms, gene products and gene clusters by the GOSemSim R package. The results of the functional similarity analysis between the 5 Co-PRDEGs were visualized by cloud-rain diagram (Figure 8K), which showed that among the 5 Co-PRDEGs, Casp8, Tlr4 had the highest functional similarity values with the other Co-PRDEGs.
Results of GSEA in the High-and Low-Risk Groups
The GSEA results for high- and low-risk groups in the GSE24982 and GSE60670 datasets were presented in Table 6 and Table S3. The top 4 pathways enriched in the GSE24982 dataset were drawn as ridge plot (Figure 9A). The results showed that genes of different groups were significantly enriched in Meissner brain with H3k27me3 (Figure 9B), Reactome-ECM-proteoglycans (Figure 9C), IL-12 pathway (Figure 9D), Foroutan-integrated TGFB-EMT (Figure 9E). The top 4 pathways enriched in the GSE60670 dataset were drawn as ridge plot (Figure 9F). The results showed that genes of different groups were significantly enriched in Reactome regulation of TP53 expression and degradation (Figure 9G), Reactome pyroptosis (Figure 9H), Reactome regulation of TP53 activity (Figure 9I), NF-κB signaling (Figure 9J). In addition, we took the intersection of all functional pathways significantly enriched by GSEA for high- and low-risk groups in the GSE24982 and GSE60670 datasets and plotted the Venn diagram (Figure 9K), which showed that a total of 5 pathways were significantly enriched by both datasets.
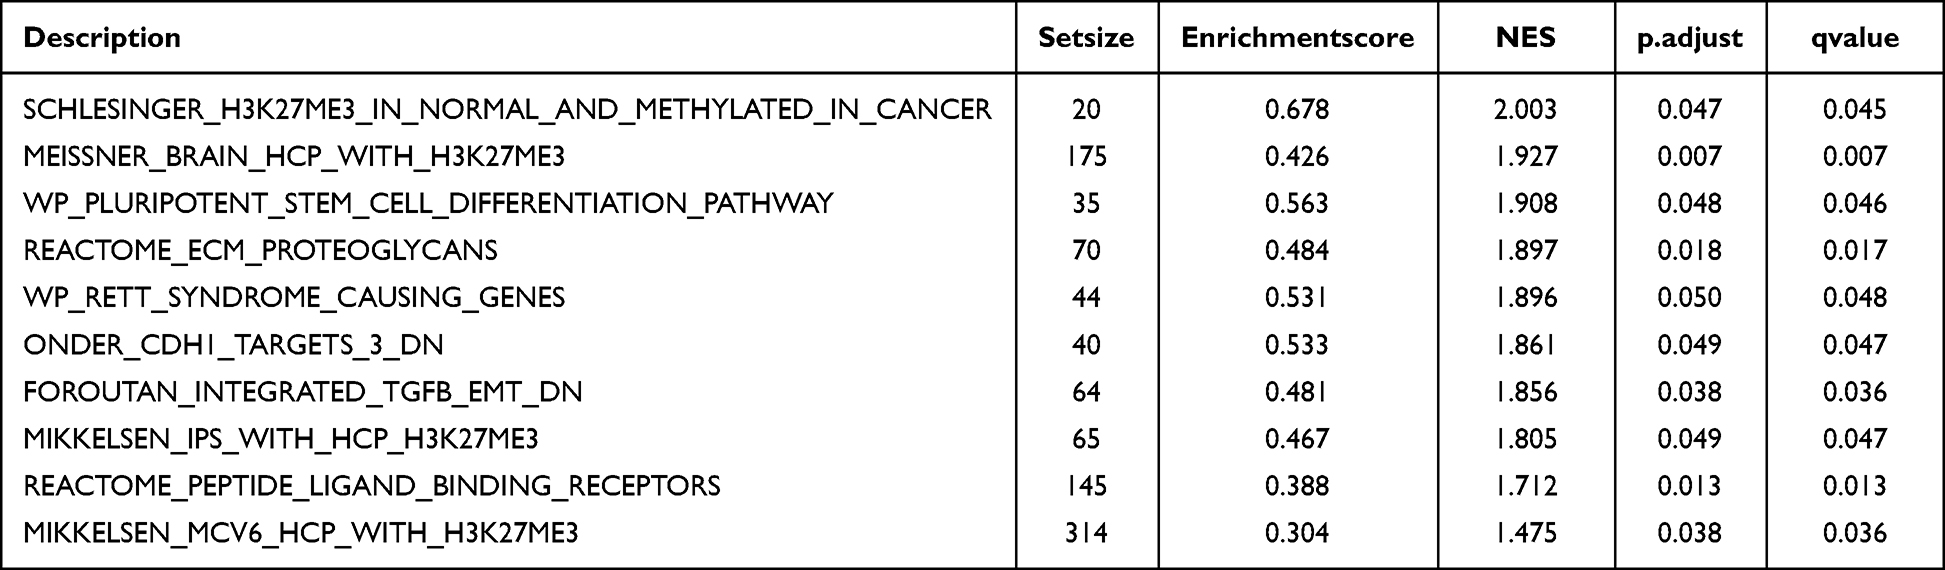 |
Table 6 GSEA Analysis of GSE24982 Dataset Between High- and Low-Riskscore Groups |
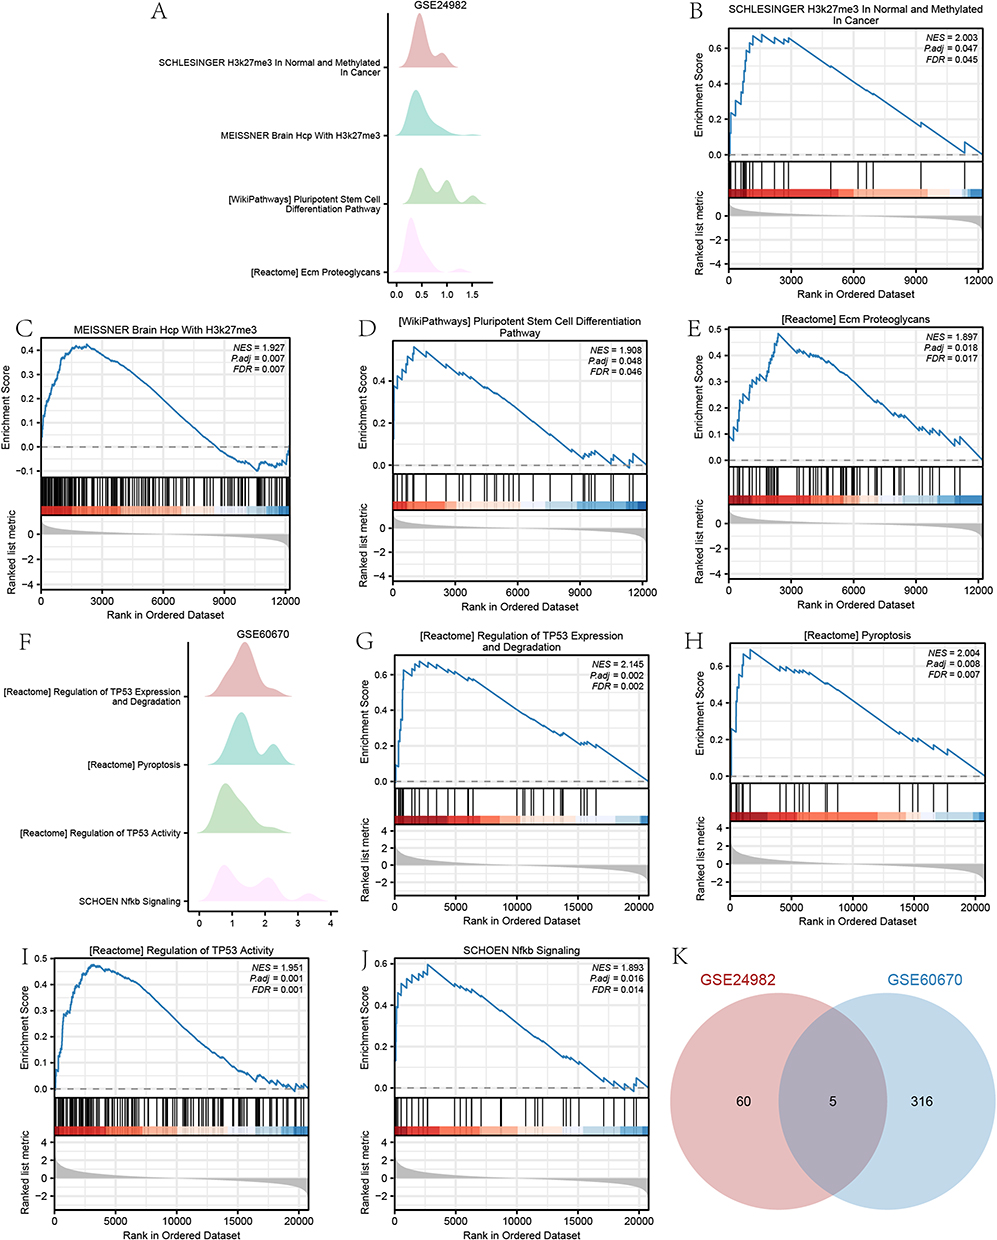 |
Figure 9 Results of GSEA in the high and low-risk groups. (A) Ridge plot of top 4 pathways of different risk group in GSE24982. (B–E) Enrichment plot of top 4 pathways of different risk group in GSE24982. (F) Ridge plot of top 4 pathways of different risk group in GSE60670. (G–J) Enrichment plot of top 4 pathways of different risk group in GSE60670. (K) Overlapping enrichment pathways in the GSE24982 and GSE60670 datasets. |
PPI Network and TFs-Co-PRDEGs, miRNA-Co-PRDEGs, Drugs-Co-PRDEGs Regulatory Network
We constructed a PPI network for Co-PRDEGs by using the GeneMANIA database to analyze the protein–protein interactions of the 5 Co-PRDEGs and retaining the nodes with links to the 5 Co-PRDEGs (Figure 10A). We treated the Co-PRDEGs in the PPI network as hub genes.
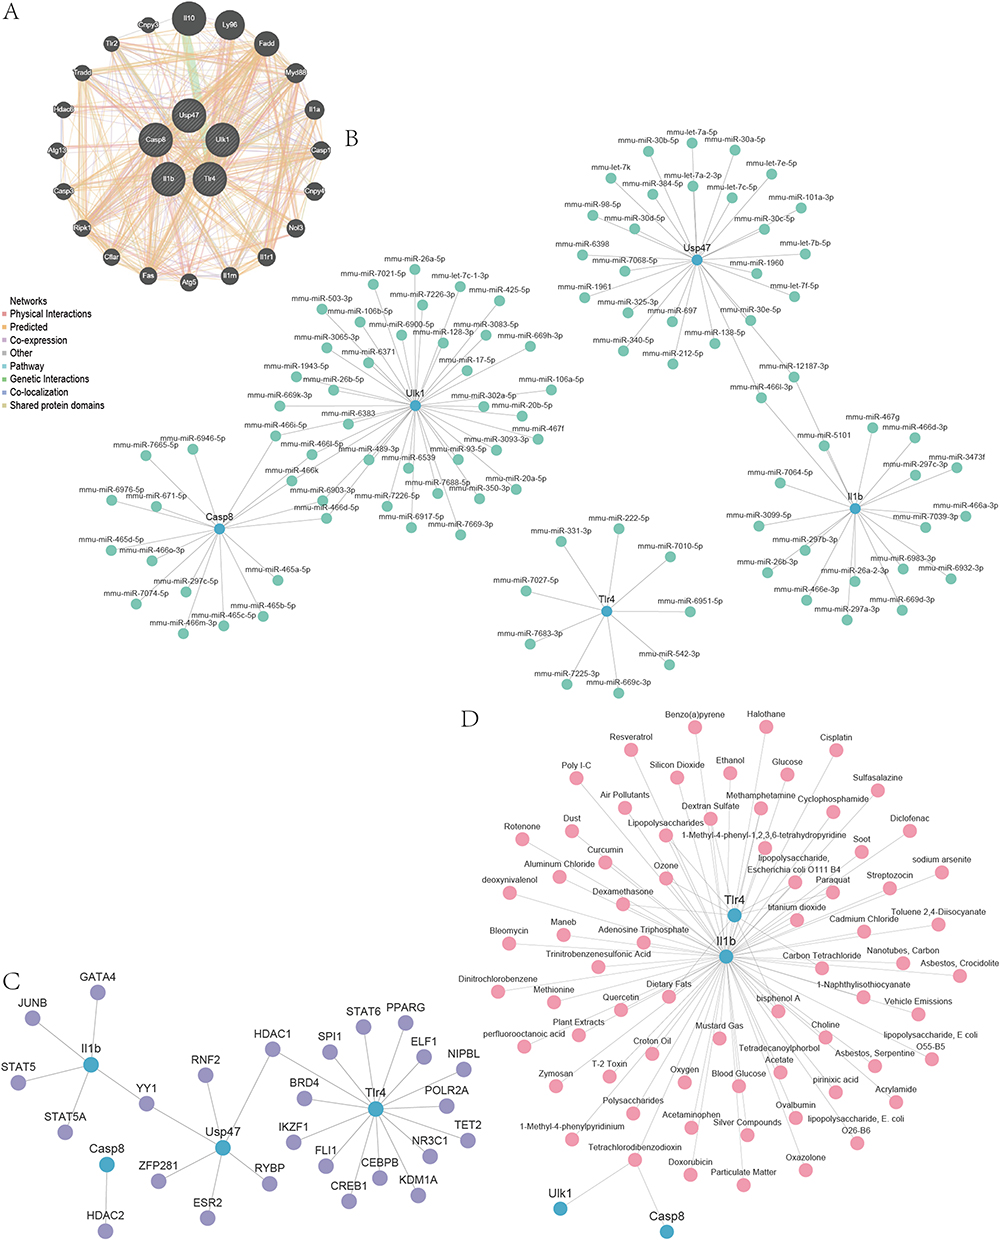 |
Figure 10 PPI Network, TFs-Co-PRDEGs, miRNA-Co-PRDEGs, drugs-Co-PRDEGs interaction network. (A) The PPI network of Co-PRDEGs. (B) The miRNA–mRNA interaction network of Co-PRDEGs. (C) The TFs–mRNA interaction network of Co-PRDEGs. (D) The drugs-Co-PRDEGs interaction network of Co-PRDEGs. |
We predicted the miRNAs interacting with 5 Co-PRDEGs by using the miRDB database (Figure 10B). As shown by the mRNA–miRNA interaction network, our mRNA–miRNA interaction network consisted of 5 Co-PRDEGs, 101 miRNA molecules, which constituted a total of 108 pairs of mRNA–miRNA interaction relationships, and the specific mRNA–miRNA interaction relationships are shown in Table S4.
Furthermore, we searched the CHIPBase database (version 2.0) and hTFtarget database for transcription factors (TFs) that bind to the 5 Co-PRDEGs. Then, we intersected the transcription factors found in both databases and finally obtained 4 Co-PRDEGs and 25 transcription factors (TFs) (Figure 10C). mRNA–TF interaction network had the most interactions between Tlr4 and transcription factors (TFs), and there were 15 pairs of mRNA–TF interactions for Tlr4 gene. The specific mRNA–TF interaction relationships are shown in Table S5.
Finally, the CTD database was used to identify potential drugs or molecular compounds targeting the 5 Co-PRDEGs. We obtained 69 potential drugs or molecular compounds corresponding to the 4 Co-PRDEGs (Casp8, Il1b, Tlr4, Ulk1) (Figure 10D). Among them, we found the largest number of drugs or molecular compounds targeting Il1b. The specific mRNA–drug interaction relationships are shown in Table S6.
Immune Infiltration Analysis in Two Datasets
First, we calculated the correlation between 22 immune cell species and the expression profile data in the GSE24982 dataset. Based on the results of immune infiltration analysis, we plotted the immune cell infiltration of 18 immune cells with infiltration abundance greater than 0 in each sample in the GSE24982 dataset in the form of a bar chart (Figure 11A).
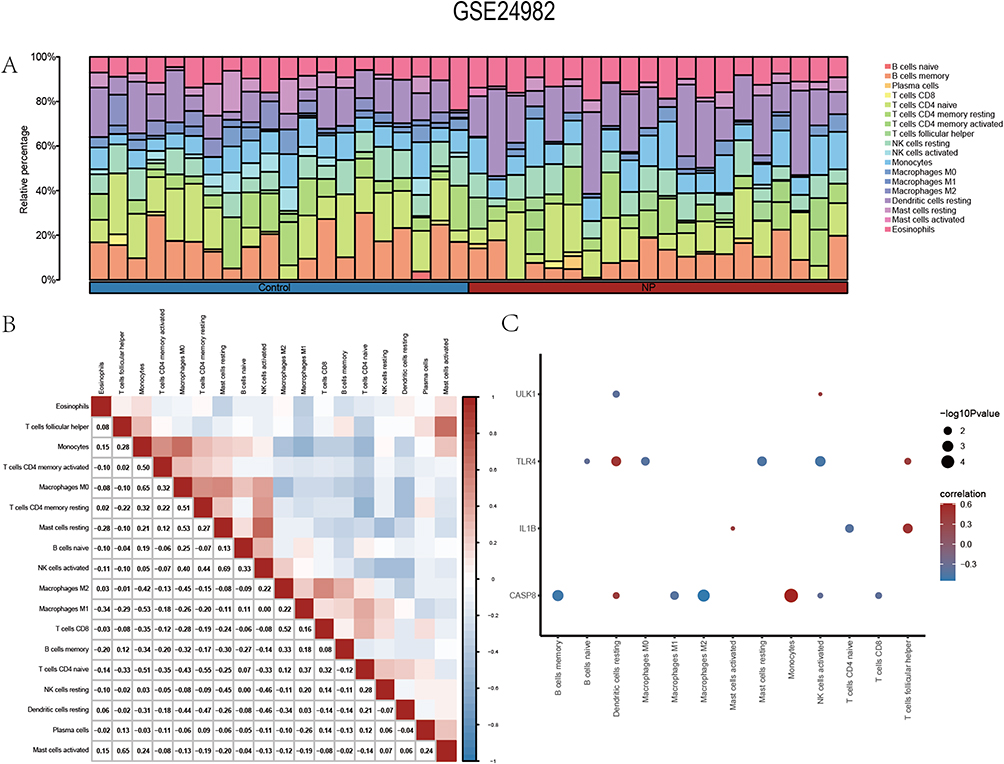 |
Figure 11 Immune infiltration analysis of the GSE24982 dataset. (A) Histogram of immune infiltration of immune cells in the GSE24982 dataset. (B) Correlation of the abundance of immune cell infiltration in the GSE24982 dataset. (C) Heat map of immune cell correlations with Co-PRDEGs in the GSE24982 dataset. |
We calculated the correlation between the abundance of the 18 immune cell infiltrates in the samples in the GSE24982 dataset (Figure 11B), and the results showed that the abundance of the 18 immune cell infiltrates were mostly negatively correlated. The positive correlation (r = 0.69) was greatest between NK cells activated and Mast cells resting; the negative correlation (r = −0.53) was greatest between M1 type Macrophages and Monocytes.
Meanwhile, we calculated the correlation between the infiltration abundance of 18 immune cell types and the expression levels of 5 Co-PRDEGs. The results showed a significant correlation (P < 0.05) between the infiltration abundance of only 13 immune cells and the expression levels of 4 Co-PRDEGs (Figure 11C). Among them, positive correlations were more pronounced between dendritic cells resting and Casp8, Tlr4; Monocytes and Casp8; follicular T helper cells and Il1b, Tlr4. memory B cells and Casp8; M2 type Macrophages and Casp8; NK cells activated with Casp8, Tlr4 were more significantly negatively correlated.
Moreover, we calculated correlations between 22 immune cells and expression profile data in the GSE60670 dataset and visualized the immune infiltration of 19 immune cells with infiltration abundance greater than 0 (Figure S1A). We also calculated the correlation between the abundance of these immune cell infiltrations (Figure S1B), and the results showed that the abundance of the 19 immune cell infiltrations were mostly negatively correlated. The positive correlation (r = 0.89) was greatest between NK cells resting and monocytes; the negative correlation (r = −0.72) was greatest between memory B cells and dendritic cells resting.
Finally, the results showed a significant correlation (P < 0.05) between the infiltration abundance of only 6 immune cells and the expression level of 4 Co-PRDEGs (Figure S1C). Among them, positive correlations were more pronounced between memory B cells and Il1b, dendritic cells activated and Usp47, CD4 memory T cells activated and Tlr4. Monocytes and Tlr4, NK cells resting and Casp8, follicular T helper cells and Tlr4 were more significantly negatively correlated.
Results of RT-qPCR
Compared with the sham group, the MWT and TWL were both significantly reduced in the NP group (Figure S2A and B), indicating that the NP model was successfully constructed. To verify the reliability of our analysis, we selected these five Co-PRDEGs of the DRG differentially changed at CCI rat model for RT-qPCR validation. We found that only the expression levels of Tlr4, Il1b and Casp8 were consistent with changes in transcriptomics. The results were shown in Figure 12A–C, and the expression level of all three Co-PRDEGs were significantly upregulated (P<0.0001).
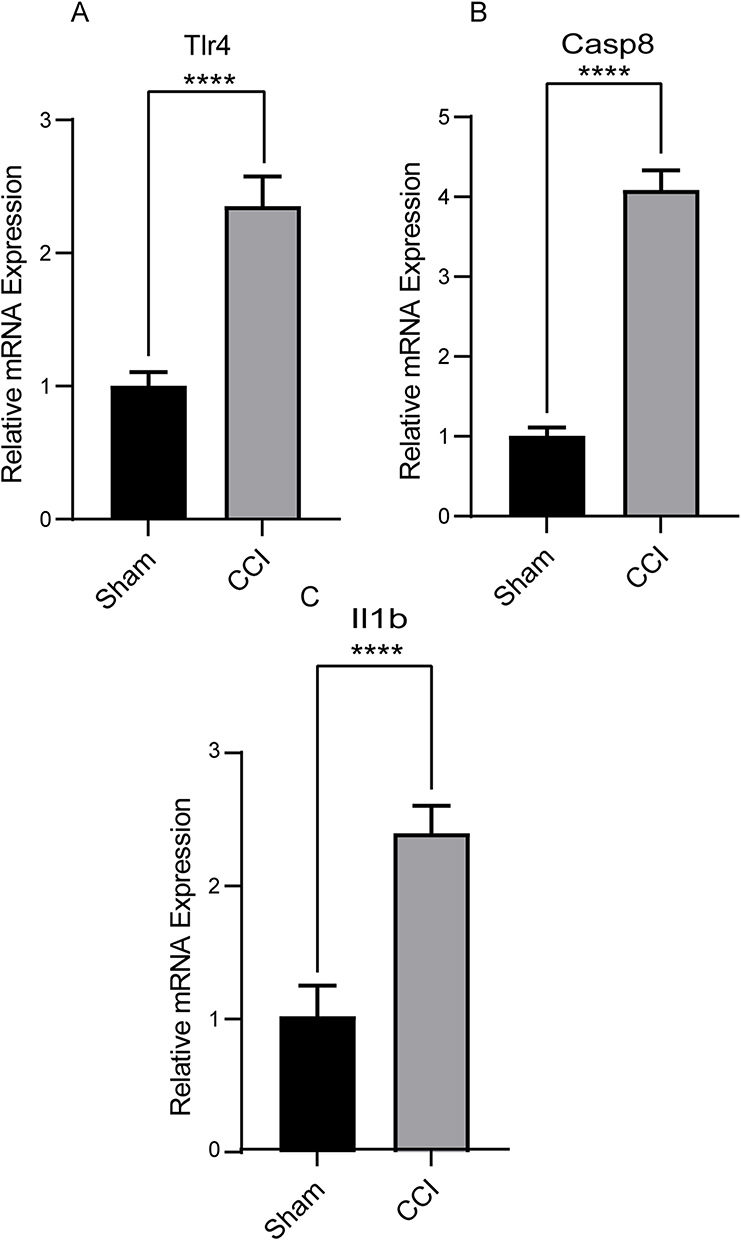 |
Figure 12 The relative expression level of Co-PRDEGs. (A–C) The expression level of Tlr4, Casp8 and Il1b by RT-qPCR. ****P < 0.0001. |
Discussion
Neuropathic pain, one of the most common and complex health problems, can lead to insomnia, depression, and increase the incidence of suicide.49 In addition, neuropathic pain brings about vast social and economic burden. Recent evidence has shown that neuroinflammation plays a dominant role in the pathology of neuropathic pain.50 However, the specific neuroinflammatory mechanisms of neuropathic pain are still not fully understood, leading to a lack of effective treatment. Pyroptosis is a novel type of cellular necrosis, characterized by the massive release of inflammatory factors and the formation of bubble-like morphology. There is growing evidence that nerve injury induced a significant upregulation of pyroptosis activation in damaged nerves, dorsal root ganglion, and spinal cord and exerts a crucial role in the development of neuropathic pain.13,15 Therefore, uncovering the relationship between pyroptosis and neuropathic pain might provide novel biomarkers and new insights for the treatment and diagnosis of neuropathic pain.
In this study, we identified 3 differentially expressed PRGs including Tlr4, Il1b and Casp8 based on bioinformatics analysis as well as RT-qPCR experimental validation. Toll-like receptor 4 (Tlr4), a key player in the innate immune response at the peripheral and central nervous system levels, is an alarm target for inflammatory cells in the infected or adaptive environment.51 A previous study showed that N-palmitoyl-D-glucosamine, a Tlr4 antagonist, might alleviate NP through its potent anti-inflammatory activity.52 Also, Xu et al found that TLR4/MyD88 could trigger microglial pyroptosis and exacerbate neuroinflammation through the PI3K/AKT pathway, which was consistent with the results of the present study.53 Therefore, Tlr4 might be a potential target for intervention in NP. Il1b is important pro-inflammatory cytokines in pyroptosis, and ASC and caspase-1 could form the AIM2 inflammasome, which in turn activates caspase-1 and processes Il1b and IL-18, leading to pyroptosis.54 In addition, a bioinformatics study suggests that Casp8, a newly identified pyroptosis -related gene, plays a key role in the development of renal cell carcinoma.55 However, the molecular mechanisms by which Casp8 is involved in neuropathic pain onset through regulation of pyroptosis are not yet clear. Nevertheless, we believe it is still necessary to further investigate its specific function in NP, which will help to elucidate the pathogenesis of NP.
The results of GO and KEGG enrichment analysis of PRDEGs showed that they were mainly associated with the regulation of neuron death, positive regulation of neuron death, glial cell activation and Toll-like receptor signaling pathway. In the results of GSEA, we mainly found that IL-4 signaling, IL-23 pathway, IL-12 pathway and NF-κB pathway were related to NP. Sun et al revealed that TIPE2 further ameliorates neuroinflammation and neuropathic pain by decreasing TAK1 expression, thereby inhibiting the activation of NF-kB and JNK pathways,56 and overexpression of CX3XL1 could promote NP progression by activating the NF-κB pathway in the dorsal root ganglion.57 Moreover, Xu et al also revealed that resveratrol enhances the IL-4 receptor-mediated anti-inflammatory response in the spinal cord and therefore might contribute to the reduction of neuropathic pain after peripheral nerve injury.58 In a rat model of neuropathic pain, tetanic stimulation of the sciatic nerve -induced abnormal pain was attenuated by inhibition of IL-23 signaling.59 In sum, these PRDEGs might play crucial roles in NP through these pathways.
It is well known that TFs and microRNAs are key regulatory factors in the development of NP. Therefore, we established regulatory networks between TF-mRNA and microRNA-mRNA, respectively, to reveal the potential interactions between TFs, PRDEGs and microRNA in neuropathic pain states. As exhibited in Figure 10, YY1 and HDAC1 were connected to several PRDEGs, suggesting its importance in NP. Zheng et al reported that YY1 could regulate pyroptosis by upregulating Caspase-1 in COVID-19 combined with RA patients.60 Cai et al also revealed that puerarin inhibited pyroptosis by modulating the HDAC1-NLRP3 pathway in acute lung injury.61 A study showed that the HDAC1 inhibitor LG325 could significantly alleviate neuropathic pain by reversing the increase in HDAC1 expression, thereby suggesting that selective targeting of HDAC1 might have good therapeutic potential in the treatment of neuropathic pain.62 Currently, there is no direct evidence for a role of miR-12187-3p, miR-466L-3p, miR-466i-5p, miR-466L-5p, miR-466k, miR-6903-3p and miR-466d-5p in NP. However, the present study combined with related literature supposes that these microRNAs may be involved in NP through regulatory actions at the post-transcriptional level. First, in cerebral hemorrhage, knockdown of LncRNA-PEAK1 reduces interleukin-1β and tumor necrosis factor-alpha levels, promotes cell proliferation, and attenuates apoptosis through the miR-446i-5p/Caspase8 axis.63 Second, another study showed that miRNA-466L-3p inhibits microglia-mediated neuroinflammation by targeting calmodulin.64 And, one of our previous studies has shown that inflammatory factors, especially those secreted during microglia-mediated neuroinflammation, greatly contribute to the progression of NP.46 Therefore, miR-446i-5p and miR-466L-3p may be involved in the occurrence and development of NP by regulating neuroinflammation, and the clear molecular mechanisms need to be further investigated.
In the results of immune infiltration analysis, we found significantly positive correlations between dendritic cells and Casp8, Tlr4; Monocytes and Casp8; follicular T helper cells and Il1b, Tlr4; memory B cells and Il1b; CD4 memory T cells activated and Tlr4. Ferrara et al have revealed that inhibition of dendritic cell migration in the central nervous system (CNS) down-regulates the pathogenic T cell inflammatory response and thus delays the onset of experimental autoimmune encephalomyelitis.65 The hippocampus of patients with dementia consisted mainly of more active dendritic cells compared to control samples in a case–control study. This revealed that there was a distinct immune profile in the hippocampal region of Alzheimer's disease (AD) patients and dendritic cells might play a key role in the pathogenesis of AD.66 Another study has shown that monocytes promote acute inflammatory responses and might become pathological microglia long after the neonatal LPS/HI insult.67 Furthermore, inhibition of monocyte influx might alleviate neuroinflammation. Also, a study showed that during the peak of autoimmune encephalitis, an increased frequency of follicular T helper cells in the CNS was observed and paralleled chronic disease activity, revealing a non-static role of follicular T helper cells in neuroinflammation.68 Meanwhile, we found that PRDEGs were positively correlated with these immune cells, respectively, and the expression of PRDEGs was upregulated in NP, suggesting that these PRDEGs might be promoters of neuroinflammation and involved in immune-related signaling regulation.
There are a number of limitations that must be considered in this study. First of all, because of the lack of microarray data in the field of neuropathic pain, the sample size included in our study might be insufficient. Moreover, pyroptosis‑related genes were involved in this study might be incomplete. Finally, although we conducted experiments that confirmed high pyroptosis‑related gene expression in dorsal root ganglion, the specific molecular functions of these PRDEGs remain undetermined. In the future, we will conduct further experimental validation and active exploration of the complexity of the molecular mechanisms. Despite these limitations, the present transcriptomic study, which has so far been rare, could provide reliable pyroptosis‑related biomarkers for the diagnosis and prognosis of NP. It also prepares for the exploration of new therapeutic targets for NP.
Conclusion
In a word, we identified Tlr4, Il1b and Casp8 as potential diagnostic biomarkers for neuropathic pain, providing additional evidence about the vital role of pyroptosis in neuropathic pain. The miR-446i-5p, miR-466L-3p and several transcription factors, such as YY1 and HDAC1, are important regulators of post-transcriptional and transcriptional levels in the molecular mechanism of neuropathic pain. Immune cell infiltration might play a crucial role in the progression of neuropathic pain, particularly dendritic cells, monocytes and follicular T helper cells. However, more studies and experiments are needed to clarify the function of these PRDEGs.
Data Sharing Statement
The datasets used and/or analyzed during the current study are available from the corresponding author (Lanxiang Wu) on reasonable request.
Ethics Approval Statement
This study was conducted according to the National Institutes of Health Guidelines for the use of laboratory animals. The experimental design was approved by Ethics Committee of Nanchang University.
Acknowledgments
Wei Wu and Lanxiang Wu are co-last authors for this study.
Funding
This work was supported by the National Natural Science Foundation of China (Grant numbers: 82160227, 82360234), Natural Science Foundation of Jiangxi Province (Grant numbers:20224BAB206036), Jiangxi Provincial Department of Education Science and Technology Program Project (Grant numbers: GJJ210125), National Natural Science Foundation incubation program of the Second Affiliated Hospital of Nanchang University (Grant numbers: 2023YNFY12019) and Jiangxi Province Postgraduate Innovation Special Fund (Grant numbers: YC2022-B065).
Disclosure
The authors declare that there are no conflicts of interest in this work.
References
1. Finnerup NB, Kuner R, Jensen TS. Neuropathic pain: from mechanisms to treatment. Physiol Rev. 2021;101(1):259–301. doi:10.1152/physrev.00045.2019
2. Bouhassira D. Neuropathic pain: definition, assessment and epidemiology. Rev Neurol. 2019;175(1–2):16–25. doi:10.1016/j.neurol.2018.09.016
3. Hall GC, Morant SV, Carroll D, et al. An observational descriptive study of the epidemiology and treatment of neuropathic pain in a UK general population. BMC Fam Pract. 2013;14(1):28. doi:10.1186/1471-2296-14-28
4. van Hecke O, Austin SK, Khan RA, et al. Neuropathic pain in the general population: a systematic review of epidemiological studies. Pain. 2014;155(4):654–662. doi:10.1016/j.pain.2013.11.013
5. Baldo BA. Toxicities of opioid analgesics: respiratory depression, histamine release, hemodynamic changes, hypersensitivity, serotonin toxicity. Arch Toxicol. 2021;95(8):2627–2642. doi:10.1007/s00204-021-03068-2
6. Colloca L, Ludman T, Bouhassira D, et al. Neuropathic pain. Nat Rev Dis Primers. 2017;3(1):17002. doi:10.1038/nrdp.2017.2
7. Bedoui S, Herold MJ, Strasser A. Emerging connectivity of programmed cell death pathways and its physiological implications. Nat Rev Mol Cell Biol. 2020;21(11):678–695. doi:10.1038/s41580-020-0270-8
8. McKenzie BA, Mamik MK, Saito LB, et al. Caspase-1 inhibition prevents glial inflammasome activation and pyroptosis in models of multiple sclerosis. Proc Natl Acad Sci USA. 2018;115(26):E6065–E6074. doi:10.1073/pnas.1722041115
9. Sborgi L, Rühl S, Mulvihill E, et al. GSDMD membrane pore formation constitutes the mechanism of pyroptotic cell death. EMBO J. 2016;35(16):1766–1778. doi:10.15252/embj.201694696
10. McKenzie BA, Dixit VM, Power C. Fiery cell death: pyroptosis in the central nervous system. Trends Neurosci. 2020;43(1):55–73. doi:10.1016/j.tins.2019.11.005
11. Thacker MA, Clark AK, Marchand F, et al. Pathophysiology of peripheral neuropathic pain: immune cells and molecules. Anesth Analg. 2007;105(3):838–847. doi:10.1213/01.ane.0000275190.42912.37
12. Carranza-Aguilar CJ, Hernández-Mendoza A, Mejias-Aponte C, et al. Morphine and fentanyl repeated administration induces different levels of NLRP3-dependent pyroptosis in the dorsal raphe nucleus of male rats via cell-specific activation of TLR4 and opioid receptors. Cell Mol Neurobiol. 2022;42(3):677–694. doi:10.1007/s10571-020-00957-5
13. Hua T, Yang M, Song H, et al. Huc-MSCs-derived exosomes attenuate inflammatory pain by regulating microglia pyroptosis and autophagy via the miR-146a-5p/TRAF6 axis. J Nanobiotechnology. 2022;20(1):324. doi:10.1186/s12951-022-01522-6
14. Zhang Y, Jiang S, Liao F, et al. A transcriptomic analysis of neuropathic pain in the anterior cingulate cortex after nerve injury. Bioengineered. 2022;13(2):2058–2075. doi:10.1080/21655979.2021.2021710
15. Cui CY, Liu X, Peng MH, et al. Identification of key candidate genes and biological pathways in neuropathic pain. Comput Biol Med. 2022;150:106135. doi:10.1016/j.compbiomed.2022.106135
16. Verma-Gandhu M, Herbert TA, Barrett L, et al. T-cell infiltration and signaling in the adult dorsal spinal cord is a major contributor to neuropathic pain-like hypersensitivity. J Neurosci. 2009;29(46):14415–14422. doi:10.1523/JNEUROSCI.4569-09.2009
17. Yu X, Liu H, Hamel KA, et al. Dorsal root ganglion macrophages contribute to both the initiation and persistence of neuropathic pain. Nat Commun. 2020;11(1):264. doi:10.1038/s41467-019-13839-2
18. Davis S, Meltzer PS. GEOquery: a bridge between the Gene Expression Omnibus (GEO) and bioconductor. Bioinformatics. 2007;14(14):1846–1847. doi:10.1093/bioinformatics/btm254
19. Gu Y, Qiu Z, Cheng N, et al. Identification of potential mechanism and hub genes for neuropathic pain by expression-based genome-wide association study. J Cell Biochem. 2019;120(4):4912–4923. doi:10.1002/jcb.27766
20. von Schack D, Agostino MJ, Murray BS, et al. Dynamic changes in the microRNA expression profile reveal multiple regulatory mechanisms in the spinal nerve ligation model of neuropathic pain. PLoS One. 2011;6(3):e17670. doi:10.1371/journal.pone.0017670
21. Jeong H, Na YJ, Lee K, et al. High-resolution transcriptome analysis reveals neuropathic pain gene-expression signatures in spinal microglia after nerve injury. Pain. 2016;157(4):964–976. doi:10.1097/j.pain.0000000000000470
22. Stelzer G, Rosen N, Plaschkes I, et al. The genecards suite: from gene data mining to disease genome sequence analyses. Curr Protoc Bioinformat. 2016;54(1):1.30.1–1.30.33. doi:10.1002/cpbi.5
23. Dong Z, Bian L, Wang M, et al. Identification of a pyroptosis-related gene signature for prediction of overall survival in lung adenocarcinoma. J Oncol. 2021;2021:6365459. doi:10.1155/2021/6365459
24. Wu J, Zhu Y, Luo M, et al. Comprehensive analysis of pyroptosis-related genes and tumor microenvironment infiltration characterization in breast cancer. Front Immunol. 2021;12:748221. doi:10.3389/fimmu.2021.748221
25. Liberzon A, Birger C, Thorvaldsdóttir H, et al. The Molecular Signatures Database (MSigDB) hallmark gene set collection. Cell Syst. 2015;1(6):417–425. doi:10.1016/j.cels.2015.12.004
26. Ritchie ME, Phipson B, Wu D, et al. limma powers differential expression analyses for RNA-sequencing and microarray studies. Nucleic Acids Res. 2015;43(7):e47. doi:10.1093/nar/gkv007
27. Tian S, Wu L, Zheng H, et al. Identification of autophagy-related genes in neuropathic pain through bioinformatic analysis. Hereditas. 2023;160(1):8. doi:10.1186/s41065-023-00269-w
28. Deng YX, He WG, Cai HJ, et al. Analysis and validation of hub genes in blood monocytes of postmenopausal osteoporosis patients. Front Endocrinol. 2022;12:815245. doi:10.3389/fendo.2021.815245
29. Yu G. Gene ontology semantic similarity analysis using Gosemsim. Methods Mol Biol. 2020;2117:207–215.
30. Kanehisa M, Goto S. KEGG: Kyoto encyclopedia of genes and genomes. Nucleic Acids Res. 2000;28(1):27–30. doi:10.1093/nar/28.1.27
31. Yu G, Wang LG, Han Y, et al. clusterProfiler: an R package for comparing biological themes among gene clusters. OMICS. 2012;16(5):284–287. doi:10.1089/omi.2011.0118
32. Subramanian A, Tamayo P, Mootha VK, et al. Gene set enrichment analysis: a knowledge-based approach for interpreting genome-wide expression profiles. Proc Natl Acad Sci USA. 2005;102(43):15545–15550. doi:10.1073/pnas.0506580102
33. Gruber HE, Hoelscher GL, Ingram JA, et al. Genome-wide analysis of pain-, nerve- and neurotrophin -related gene expression in the degenerating human annulus. Mol Pain. 2012;8:63. doi:10.1186/1744-8069-8-63
34. Liu Y, Zhao H. Variable importance-weighted random forests. Quant Biol. 2017;5(4):338–351. doi:10.1007/s40484-017-0121-6
35. Engebretsen S, Bohlin J. Statistical predictions with glmnet. Clin Clin Epigenet. 2019;11(1):123. doi:10.1186/s13148-019-0730-1
36. Cai W, van der Laan M. Nonparametric bootstrap inference for the targeted highly adaptive least absolute shrinkage and selection operator (LASSO) estimator. Int J Biostat. 2020;3:10.
37. Park SY. Nomogram: an analogue tool to deliver digital knowledge. J Thorac Cardiovasc Surg. 2018;155(4):1793. doi:10.1016/j.jtcvs.2017.12.107
38. Mandrekar JN. Receiver operating characteristic curve in diagnostic test assessment. J Thorac Oncol. 2010;5(9):1315–1316. doi:10.1097/JTO.0b013e3181ec173d
39. Franz M, Rodriguez H, Lopes C, et al. GeneMANIA update 2018. Nucleic Acids Res. 2018;46(W1):W60–W64. doi:10.1093/nar/gky311
40. Chen Y, Wang X. miRDB: an online database for prediction of functional microRNA targets. Nucleic Acids Res. 2020;48(D1):D127–D131. doi:10.1093/nar/gkz757
41. Zhou KR, Liu S, Sun WJ, et al. ChIPBase v2.0: decoding transcriptional regulatory networks of non-coding RNAs and protein-coding genes from ChIP-seq data. Nucleic Acids Res. 2017;45(D1):D43–D50. doi:10.1093/nar/gkw965
42. Zhang Q, Liu W, Zhang HM, et al. hTFtarget: a comprehensive database for regulations of human transcription factors and their targets. Genomics Proteomics Bioinf. 2020;18(2):120–128. doi:10.1016/j.gpb.2019.09.006
43. Davis AP, Grondin CJ, Johnson RJ, et al. Comparative Toxicogenomics Database (CTD): update 2021. Nucleic Acids Res. 2021;49(D1):D1138–D1143. doi:10.1093/nar/gkaa891
44. Newman AM, Liu CL, Green MR, et al. Robust enumeration of cell subsets from tissue expression profiles. Nat Methods. 2015;12(5):453–457. doi:10.1038/nmeth.3337
45. Chen B, Khodadoust MS, Liu CL, et al. Profiling tumor infiltrating immune cells with CIBERSORT. Methods Mol Biol. 2018;1711:243–259.
46. Gui X, Wang H, Wu L, et al. Botulinum toxin type A promotes microglial M2 polarization and suppresses chronic constriction injury-induced neuropathic pain through the P2X7 receptor. Cell Biosci. 2020;10(1):45. doi:10.1186/s13578-020-00405-3
47. Sui P, Watanabe H, Ossipov MH, et al. Proteomics of neuropathic pain: proteins and signaling pathways affected in a rat model. J Proteome Res. 2014;13(9):3957–3965. doi:10.1021/pr500241q
48. LaCroix-Fralish ML, Austin JS, Zheng FY, et al. Patterns of pain: meta-analysis of microarray studies of pain. Pain. 2011;152(8):1888–1898. doi:10.1016/j.pain.2011.04.014
49. Jiang BC, Liu T, Gao YJ. Chemokines in chronic pain: cellular and molecular mechanisms and therapeutic potential. Pharmacol Ther. 2020;212:107581. doi:10.1016/j.pharmthera.2020.107581
50. Baral P, Udit S, Chiu IM. Pain and immunity: implications for host defence. Nat Rev Immunol. 2019;19(7):433–447. doi:10.1038/s41577-019-0147-2
51. Li Y, Yin C, Li X, et al. Electroacupuncture alleviates paclitaxel-induced peripheral neuropathic pain in rats via suppressing TLR4 signaling and TRPV1 upregulation in sensory neurons. Int J Mol Sci. 2019;20(23):5917. doi:10.3390/ijms20235917
52. Iannotta M, Belardo C, Trotta MC, et al. N-palmitoyl-D-glucosamine, a natural monosaccharide-based glycolipid, inhibits TLR4 and prevents LPS-induced inflammation and neuropathic pain in mice. Int J Mol Sci. 2021;22(3):1491. doi:10.3390/ijms22031491
53. Xu S, Wang J, Jiang J, et al. TLR4 promotes microglial pyroptosis via lncRNA-F630028O10Rik by activating PI3K/AKT pathway after spinal cord injury. Cell Death Dis. 2020;11(8):693. doi:10.1038/s41419-020-02824-z
54. Chen K, Shang S, Yu S, et al. Identification and exploration of pharmacological pyroptosis-related biomarkers of ulcerative colitis. Front Immunol. 2022;13:998470. doi:10.3389/fimmu.2022.998470
55. Li T, Liu N, Zhang G, et al. CASP4 and CASP8 as newly defined autophagy-pyroptosis-related genes associated with clinical and prognostic features of renal cell carcinoma. J Cancer Res Ther. 2022;18(7):1952–1960. doi:10.4103/jcrt.jcrt_126_22
56. Sun X, Li X, Zhou Y, et al. Exogenous TIPE2 Inhibit TAK1 to improve inflammation and neuropathic pain induced by sciatic nerve injury through inactivating NF-κB and JNK. Neurochem Res. 2022;47(10):3167–3177. doi:10.1007/s11064-022-03671-4
57. Liu C, Zhang F, Liu H, et al. NF-kB mediated CX3CL1 activation in the dorsal root ganglion contributes to the maintenance of neuropathic pain induced in adult male Sprague Dawley rats1. Acta Cir Bras. 2018;33(7):619–628. doi:10.1590/s0102-865020180070000007
58. Xu M, Cheng Z, Ding Z, et al. Resveratrol enhances IL-4 receptor-mediated anti-inflammatory effects in spinal cord and attenuates neuropathic pain following sciatic nerve injury. Mol Pain. 2018;14:1744806918767549. doi:10.1177/1744806918767549
59. Bian C, Wang ZC, Yang JL, et al. Up-regulation of interleukin-23 induces persistent allodynia via CX3CL1 and interleukin-18 signaling in the rat spinal cord after tetanic sciatic stimulation. Brain Behav Immun. 2014;37:220–230. doi:10.1016/j.bbi.2013.12.011
60. Zheng Q, Lin R, Chen Y, et al. SARS-CoV-2 induces ”cytokine storm” hyperinflammatory responses in RA patients through pyroptosis. Front Immunol. 2022;13:1058884. doi:10.3389/fimmu.2022.1058884
61. Cai D, Zhao Y, Yu F. Puerarin ameliorates acute lung injury by modulating NLRP3 inflammasome-induced pyroptosis. Cell Death Discov. 2022;8(1):368. doi:10.1038/s41420-022-01137-8
62. Sanna MD, Guandalini L, Romanelli MN, et al. The new HDAC1 inhibitor LG325 ameliorates neuropathic pain in a mouse model. Pharmacol Biochem Behav. 2017;160:70–75. doi:10.1016/j.pbb.2017.08.006
63. Chen JX, Zhi JW, Wang YP, et al. LncRNA-PEAK1 promotes neuronal apoptosis after intracerebral hemorrhage by miR-466i-5p/caspase 8 axis. Heliyon. 2023;9(4):e15091. doi:10.1016/j.heliyon.2023.e15091
64. Brown PN, Yin H. PNA-based microRNA inhibitors elicit anti-inflammatory effects in microglia cells. Chem Commun. 2013;49(39):4415–4417. doi:10.1039/C2CC36540E
65. Ferrara G, Benzi A, Sturla L, et al. Sirt6 inhibition delays the onset of experimental autoimmune encephalomyelitis by reducing dendritic cell migration. J Neuroinflammation. 2020;17(1):228. doi:10.1186/s12974-020-01906-1
66. Batchu S. In silico analysis of the immunological landscape of hippocampi in alzheimer’s disease. Dement Geriatr Cognit Disord. 2020;49(3):252–254. doi:10.1159/000508283
67. Chen HR, Chen CW, Kuo YM, et al. Monocytes promote acute neuroinflammation and become pathological microglia in neonatal hypoxic-ischemic brain injury. Theranostics. 2022;12(2):512–529. doi:10.7150/thno.64033
68. Baniahmad A, Birkner K, Görg J, et al. The frequency of follicular T helper cells differs in acute and chronic neuroinflammation. Sci Rep. 2020;10(1):20485. doi:10.1038/s41598-020-77588-9
 © 2024 The Author(s). This work is published and licensed by Dove Medical Press Limited. The
full terms of this license are available at https://www.dovepress.com/terms
and incorporate the Creative Commons Attribution
- Non Commercial (unported, 3.0) License.
By accessing the work you hereby accept the Terms. Non-commercial uses of the work are permitted
without any further permission from Dove Medical Press Limited, provided the work is properly
attributed. For permission for commercial use of this work, please see paragraphs 4.2 and 5 of our Terms.
© 2024 The Author(s). This work is published and licensed by Dove Medical Press Limited. The
full terms of this license are available at https://www.dovepress.com/terms
and incorporate the Creative Commons Attribution
- Non Commercial (unported, 3.0) License.
By accessing the work you hereby accept the Terms. Non-commercial uses of the work are permitted
without any further permission from Dove Medical Press Limited, provided the work is properly
attributed. For permission for commercial use of this work, please see paragraphs 4.2 and 5 of our Terms.