Back to Journals » Diabetes, Metabolic Syndrome and Obesity » Volume 15
Predicting Diabetes in Patients with Metabolic Syndrome Using Machine-Learning Model Based on Multiple Years’ Data
Authors Li J ![]() , Xu Z
, Xu Z ![]() , Xu T
, Xu T ![]() , Lin S
, Lin S
Received 25 July 2022
Accepted for publication 16 September 2022
Published 26 September 2022 Volume 2022:15 Pages 2951—2961
DOI https://doi.org/10.2147/DMSO.S381146
Checked for plagiarism Yes
Review by Single anonymous peer review
Peer reviewer comments 2
Editor who approved publication: Prof. Dr. Juei-Tang Cheng
Jing Li1 *, Zheng Xu2 *, Tengda Xu,1 Songbai Lin1
1Department of Health Management, Peking Union Medical College Hospital, Beijing, People’s Republic of China; 2Department of AI Research, Digital Health China Technologies Co. Ltd, Beijing, People’s Republic of China
*These authors contributed equally to this work
Correspondence: Songbai Lin, Department of Health Management, Peking Union Medical College Hospital, 1# Shuaifuyuan, Dongcheng District, Beijing, 100730, People’s Republic of China, Tel +86 10 6915 9901, Fax +86 10 6915 9901, Email [email protected]
Purpose: To evaluate the performance of machine-learning models based on multiple years of continuous data to predict incident diabetes among patients with metabolic syndrome.
Patients and Methods: The dataset comprises the health records from 2008 to 2020 including 4510 nondiabetic participants with metabolic syndrome (MetS) at baseline and with at least 6 years of records. MetS was defined according to the International Diabetes Federation (IDF) criteria. Overall, 332 patients developed incident diabetes during the 7± 1.4 years of follow-up. Three popular classification algorithms were evaluated on the dataset: logistic regression, random forest, and Xgboost. Five models including single-year models (year 1, year 2, and year 3) and multiple-year models (year 1– 2 and year 1– 3) were developed for each algorithm.
Results: The model performances improved with the increasing longitudinal dataset as the area under the receiver operating characteristic curve (AUROC) was boosted for both random forest (year 1– 3: AUROC=0.893; year 3: AUROC=0.862; year 1– 2: AUROC=0.847; year 2: AUROC=0.838) and Xgboost (year 1– 3: AUROC=0.897; year 3: AUROC=0.833; year 1– 2: AUROC=0.856; year 2: AUROC=0.823) model. In the multiple-year models, the highest fasting plasma glucose, followed by the mean or lowest level of HbA1c and BMI had the most important predictive value for the onset of diabetes. In the “ 1– 3” year model, “delta weight” which reflects the fluctuations of yearly change of weight was the fourth-most important feature.
Conclusion: This study demonstrated improved performance with the accumulation of longitudinal data when using machine learning for diabetes prediction in MetS patients. For individuals with similar clinical parameters, the variation trends of these parameters could change the risk of future diabetes. This result indicated that models based on longitudinal multiple years’ data may provide more personalized assessment tools for risk evaluation.
Keywords: diabetes, metabolic syndrome, machine-learning method, prevention
Introduction
Diabetes has become a major public health burden in China in the 21st century. The prevalence of diabetes in China had increased to 12.8% in 2017.1 Reportedly, China had the highest number of adults with diabetes (140.9 million) in 2021; this number has been projected to increase to 174 million by 2045.2 Since most patients have type 2 diabetes, which is preventable by early interventions, efficient identification of controllable risk factors is crucial to implement prevention and intervention strategies.
Metabolic syndrome (MetS) is defined as a cluster of risk factors for type 2 diabetes and atherosclerotic cardiovascular disease. MetS has become increasingly prevalent worldwide.3,4 Asians are generally considered to have a lower prevalence of MetS as reported to be 24% in China versus 33% in the USA.5,6 However, the MetS prevalence in China has doubled from 2002 to 2012,7 as economic development has changed the lifestyle both in urban and rural areas and resulted in more people being overweight.8 The rapidly increasing prevalence of MetS is leading to more cases of diabetes and medical costs. Lifestyle intervention was proven to be efficient for individuals with MetS to prevent the onset of diabetes,9,10 while unregulated MetS was the strongest risk for new-onset diabetes.11 More aggressive intervention should be carried out in the MetS population.
Traditional risk models have been developed to identify people at high risk and have shown a potential for detecting the onset of diabetes.12 Recently, the successful implementation of information technologies has enhanced the efficiency of the healthcare system. Machine-learning models have been used in the prediction of many common diseases.13 Numerous studies have utilized machine-learning techniques to predict the onset of diabetes and improve diagnostic accuracy.14–18 Machine-learning techniques have become a vital instrument in diabetes management for healthcare providers.
In previous studies that used the above-mentioned machine-learning methods, only “single time data” was used for the models, either for simultaneous diagnosis or for prediction of incident diabetes during follow-up. Only a few studies have used multiple years’ data or trends of variables to predict diabetes.19,20 To our knowledge, the history of lifestyle changes or different health trajectories may contribute to the risk of future diabetes. By using machine-learning methods with multiple years data, we could construct a more accurate model by taking trajectories into account for a more personalized assessment.
This study focused on individuals with MetS who were at relatively high risk of developing diabetes. By using multiple years’ data from the annual health examination database, machine-learning models for diabetes prediction were constructed and the prediction performance was compared between multiple-year and single-year models.
Materials and Methods
Data Summary
This study was conducted in the Health Management Center of Peking Union Medical College Hospital. All physical examination data from subjects were retrospectively gathered from 2008 to 2020 and securely stored in the Peking Union Medical College Hospital Health Management database (PUMCH-HM). The database comprised all participants’ annual examination records including demographic information, vital signs, laboratory tests, and medical history. The target population in this study were patients with MetS that was defined based on the International Diabetes Federation (IDF) criteria (Table 1).21 Diabetes was diagnosed based on one or more of the following criteria from the American Diabetes Association (ADA):22 fasting plasma glucose (FPG)≥7.0 mmol/L or glycated hemoglobin (HbA1c) ≥6.5% or self-reported diabetes diagnosis per healthcare professionals’ diagnosis. The inclusion criteria were: (1) no diabetes was detected when subjects were diagnosed with MetS in the first year, and (2) the participant had at least 6 years’ records in the dataset since the first year of MetS diagnosis. A total of 4510 participants (follow-up years: 7±1.4 years) were extracted from the database and 332 patients developed incident diabetes during the follow-up period. The dataset was comprised of 15 variables from three sessions: demographic information including age, sex, height, weight, body mass index (BMI), waist circumference (WC); vital signs including systolic blood pressure (SBP) and diastolic blood pressure (DBP); and laboratory tests including FPG, HbA1c, high-density lipoprotein cholesterol (HDL-C), low-density lipoprotein cholesterol (LDL-C), triglyceride (TG), thyroid-stimulating hormone (TSH), and uric acid (UA). The study was conducted in accordance with the Declaration of Helsinki and was approved by the Peking Union Medical College Hospital Ethics Committee. Informed consent was obtained from all patients included in the study.
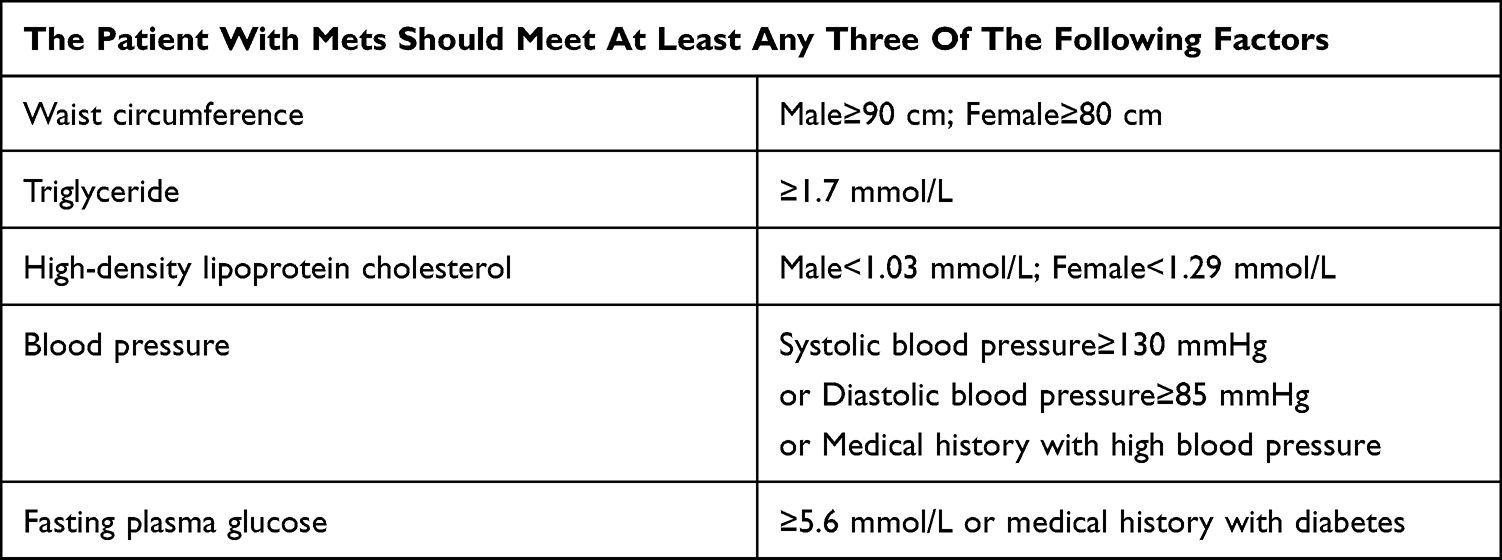 |
Table 1 The Criteria of the International Diabetes Federation (IDF) for the Definition of Metabolic Syndrome (MetS) |
The missing percentages of each variable were presented in Table 2. Three variables including WC, HbA1c, and TSH lost data above 30% because they were not collected during the annual health examination until 2014. HDL-C, LDL-C, and UA lost data from 1% to 10% mainly because some participants refused to test them. The other variables were missing at random due to human error and their missing percentages were below 1%.
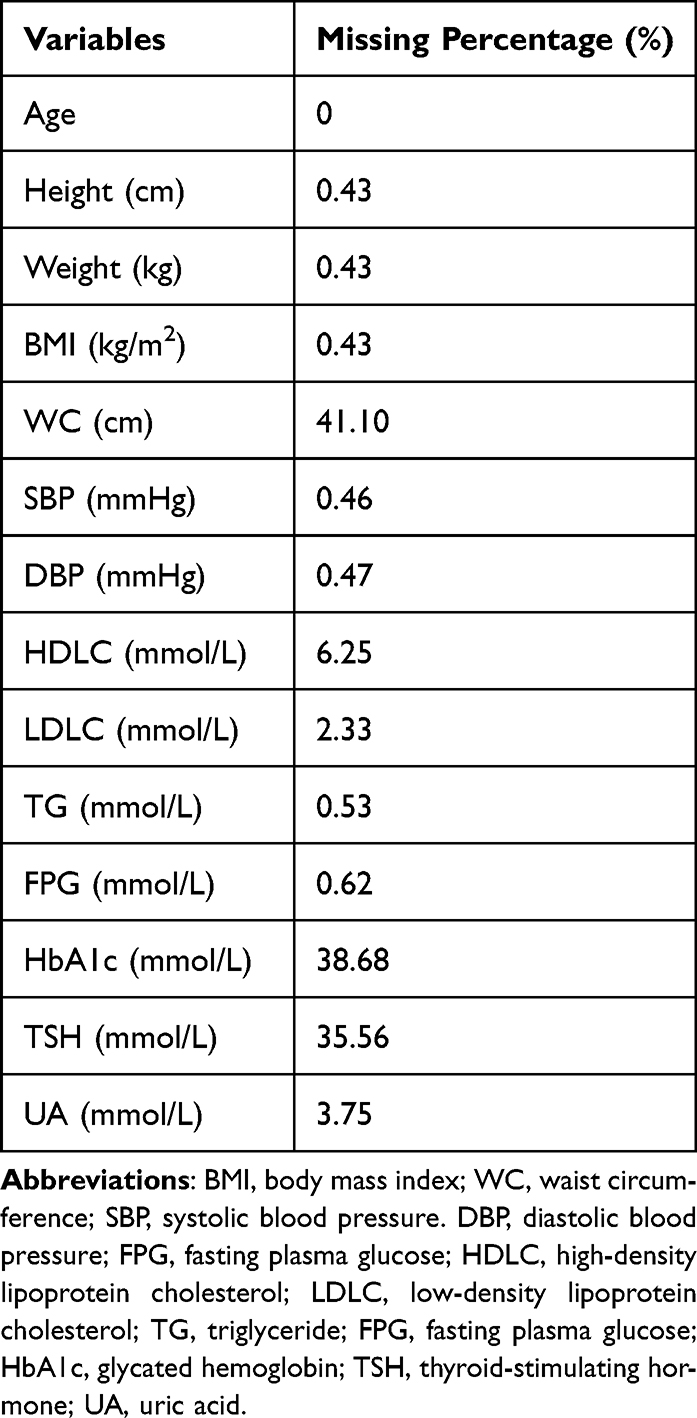 |
Table 2 The Missing Percentages of Each Variable |
Data Processing
To begin with, it is crucial to impute the missing data, which is often present in medical records. Here, a random forest-based iterative imputation method was applied to the dataset.23 It starts with imputing missing values of the targeted column with the smallest number of missing values. The other non-targeted columns with missing values were initially imputed by the column mean for columns representing numerical variables and the column mode for columns representing categorical variables. Then, a random forest model was fitted in the imputer with the targeted column set as the outcome variable and the remaining columns set as predictors over the complete rows in the targeted column. Subsequently, the missing rows of the targeted columns were predicted using the rows of non-targeted columns as input data in the fitted random forest model. After that, the imputer proceeded to the next targeted column with the second smallest number of missing values in the dataset. The process repeated itself for each column with missing values over multiple iterations until it met the stopping criterion. This stopping criterion was governed by the difference between the imputed arrays over consecutive iterations.
After the imputation of missing data, the outliers were determined through the interquartile range (IQR) method. Q1 represents the 25th percentile and Q3 represents the 75th percentile. IQR is the difference between Q1 and Q3. For the outliers, they were located outside the range between (Q1-1.5*IQR) and (Q3+1.5*IQR). Then the data were also manually examined according to the benchmarks specified by healthcare professionals. This would produce a large bias without removing outliers before the next step, ie, normalization. As each variable has entirely different units and scales, the direct input of these variables into the model will lead to biased prediction results dominated by the variable with the largest variance. Therefore, a simple method of z-score normalization standard scaling was utilized for all the features, which essentially removes the mean and scales to the unit variance. To reflect the yearly fluctuation of all the variables during the follow-up period, multiple additional features named “delta_xx” for each variable were computed by applying the first-order differential equation over the longitudinal data. Moreover, categorical variables like sex were encoded as 0 for female and 1 for male.
Model Development
The patient was labeled as 1 (positive) if they were diagnosed with diabetes in the last record; otherwise, the patient was labeled as 0 (negative). Except for the categorical features of “sex” and “height” that will remain constant for each participant, the other predictor variables were derived from the statistical values of the other 13 numerical variables. The computation of statistics here contains the average, sum, variance, minimum, and maximum value for each year “1~n” data, where n was defined as the number of times of health records starting from the year with the diagnosis of MetS.
The dataset evaluated three popular classification algorithms: logistic regression, random forest, and Xgboost. With Python 3.8, all the classifiers were computed using fixed random state value to ensure consistent results. For logistic regression, the parameter “c” defining the relative strength of regularization was set as 1 and the regularization approach is “L2”. For random forest and Xgboost algorithm, the max depth for all trees was set as 6 in the forest and the number of trees was set as 50. As the dataset is significantly biased towards the negative subjects, random down-sampling was applied to the majority class to ensure the balance of the whole dataset. Then, the new dataset was randomly divided into the training (80%) and testing (20%) data. Then least absolute shrinkage and selection operator (LASSO) method was applied to rank the feature importance. The constant “alpha” that multiplies the L1 term was set as 1 in the LASSO model.
The model was developed to predict the probability of diabetes onset using the health data of the first 3 years. As shown in Figure 1, by using different sets of health data, we developed five models including the single-year models (year 1, year 2, and year 3) and multiple-year models (year 1–2 and year 1–3). All the classification models were individually assessed by using the area under the receiver operating characteristic curve (AUROC), recall (also known as sensitivity), and precision. These assessment variables were computed from the confusion matrix—a commonly used measure when solving classification problems. Four basic concepts that originated from the confusion matrix are true positives (TP), true negatives (TN), false positives (FP), and false negatives (FN). Precision is defined by the ratio TP/(TP+FP) measuring the model’s ability to accurately predict patients developing diabetes, while recall is defined as the ratio TP/(TP+FN) evaluating the ability of the model to label diabetes onset correctly among patients who indeed develop diabetes. F1 score is the harmonic mean of precision and recall, which gives a better measure of the incorrectly classified cases than the “accuracy” metric. A five-fold stratified cross-validation method was applied to all the classifiers for internal validation, which can avoid overfitting during the training process.
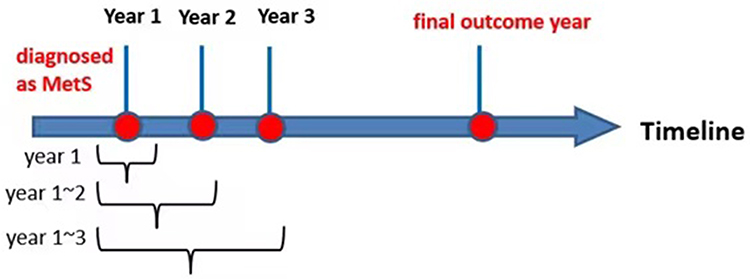 |
Figure 1 The definition of each longitudinal dataset in the timeline. |
Statistical Analysis
The numerical variables at baseline were presented as mean ± standard deviation (SD) in the summary in Table 2. t-tests were performed for each variable between sub-groups where p<0.05 was counted as a statistically significant difference. All statistical analyses were achieved using Python 3.8. The classification models come from two well-built python packages: scikit-learn and Xgboost.
Results
Baseline Characteristics of the Patient Cohort
A total of 4510 patients with MetS were included in the analysis. According to the IDF criteria, the abnormal rate at baseline were WC=48.8%, TG=43.5%, HDL-C=39.4%, SBP/DBP=40.7%, and FPG=28%. In all, 332 patients developed diabetes at the end of the follow-up. All the variables between the two sub-groups exhibited significant differences (Table 3). It is evident that patients with diabetes presented higher FPG (6.43±1.11 mmol/L) and HbA1c (6.00±0.65%) than those without diabetes (FPG: 5.37±0.45 mmol/L; HbA1c: 5.47±0.30%).
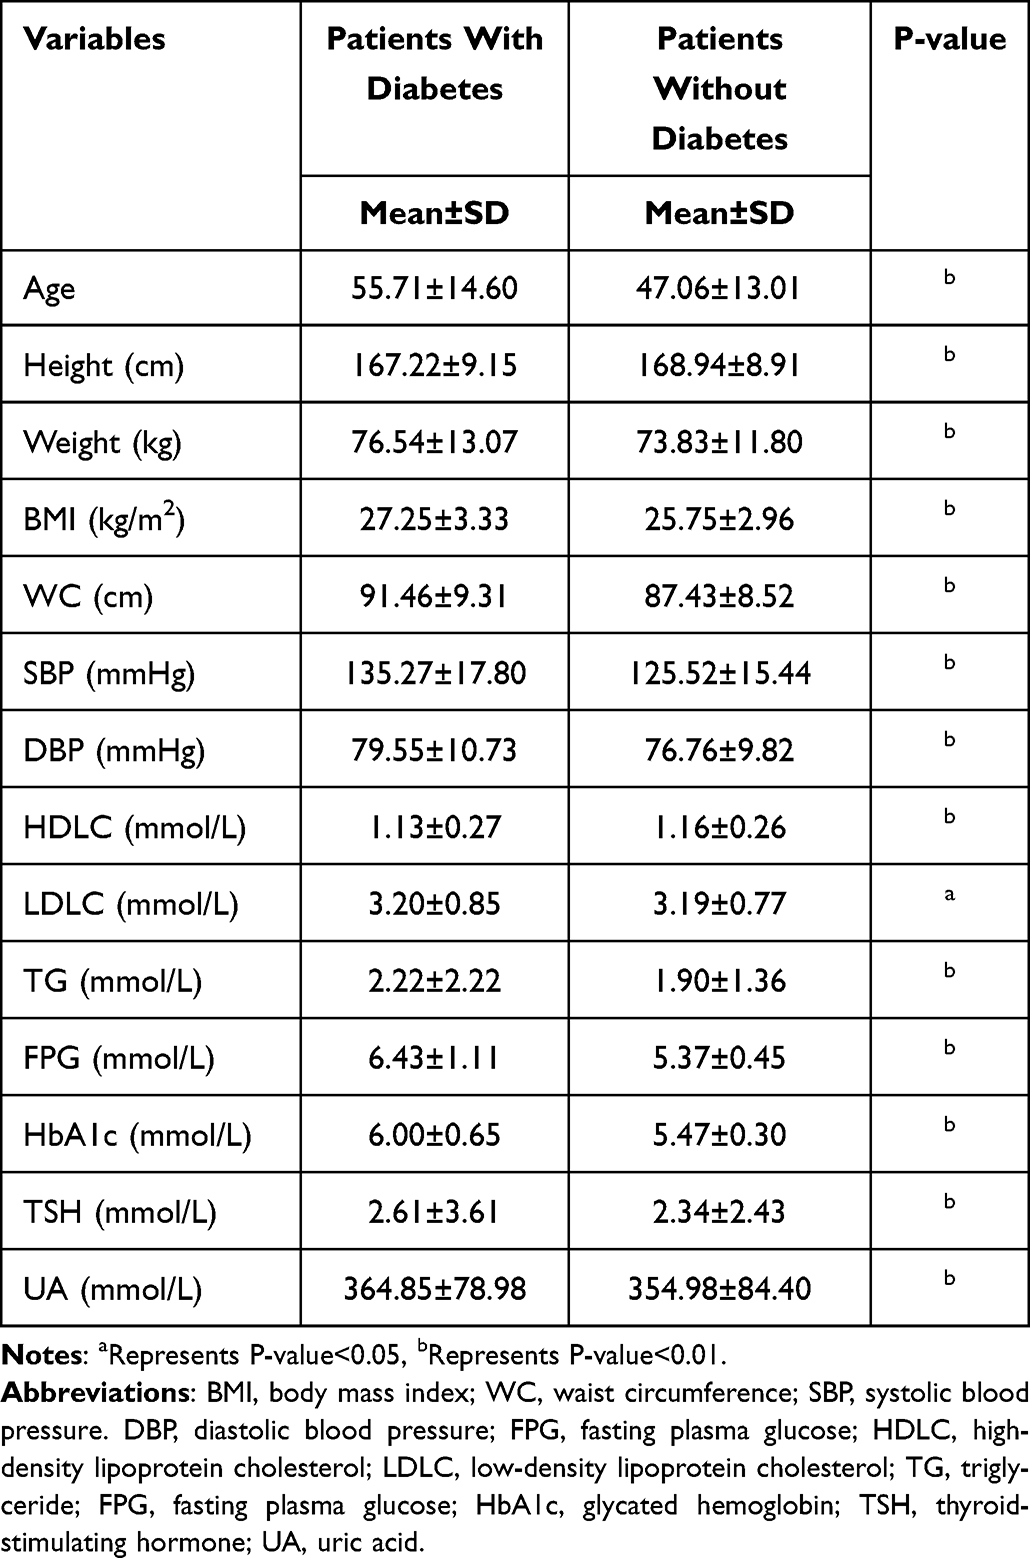 |
Table 3 Baseline Characteristics of Sub-Groups from Patient Cohorts |
Model Performance
The performance results for three single-year models and two multiple-year models are presented in Table 4 and Figure 2. Both random forest and Xgboost models over multiple-year data could achieve relatively high-performance results (mean AUROC>0.85 for two models), while the results from single-year data were slightly worse. Among the models applied to the multiple-year data, the best-performing model was Xgboost. The classification results for single-year data showed a different conclusion wherein the random forest model achieved the best performance (mean AUROC: 0.835±0.029, mean recall: 0.753±0.001, mean precision: 0.756±0.020, mean F1-score: 0.751±0.014). The combination of Xgboost model and year 1–3 dataset showed the best performance results (AUROC: 0.897, recall: 0.831, precision: 0.837, F1-score: 0.834). For both random forest and Xgboost single-year models, AUROC increased from year 1, to year 2, and to year 3 indicating that the latest data provided the best prediction power.
 |
Table 4 Performance Metrics of Machine-Learning Models Using Longitudinal Data |
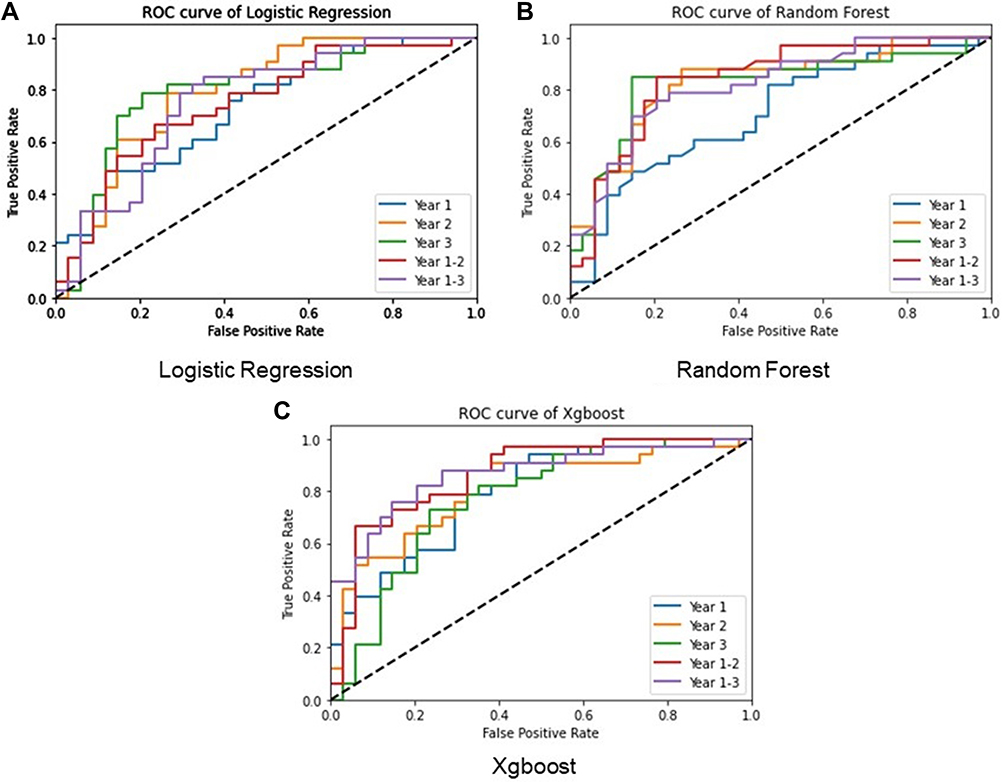 |
Figure 2 ROC curves of the three models for all the datasets. Abbreviation: ROC, receiver operating characteristic. Notes: (A) the ROC curve of logistic regression for single-year models and multiple-year models; (B) the ROC curve of random forest for single-year models and multiple-year models; (C) the ROC curve of Xgboost for single-year models and multiple-year models. |
Longitudinal Data Comparison
Among all the datasets, the year 3 dataset presented the best average prediction results for all three models (mean AUROC: 0.841±0.018, mean recall: 0.760±0.031, mean precision: 0.784±0.013, mean F1-score: 0.768±0.021). The lowest recall (0.608) and precision (0.549) rates were both from the logistic regression model for the year 1–2 dataset. The model performances exhibited evident improvement with the increasing longitudinal dataset in general, as the AUROC improved with the addition of more data for both random forest (year 1–3: AUROC=0.893; year 3: AUROC=0.862; year 1–2: AUROC=0.847; year 2: AUROC=0.838) and Xgboost (year 1–3: AUROC=0.897; year 3: AUROC=0.833; year 1–2: AUROC=0.856; year 2: AUROC=0.823) models. The other evaluation parameters including recall rate, precision rate, and F1-score also demonstrated an obvious enhancement following the accumulation of longitudinal data.
Feature Importance for Risk Prediction
The feature importance of each dataset using LASSO was shown in Figure 3. Regardless of the dataset used, the top two features that most influenced the prediction results were FPG and HbA1c or related statistical features that make sense as they were used to define diabetes. In the multiple-year models, the highest FPG had the most important predictive value for the onset of diabetes, followed by HbA1c and BMI. For both multi-year datasets, some features reflecting the fluctuations of yearly change exist among the top 15 features. For the year 1–2 dataset, the delta of UA ranked sixth, which provides another useful feature for diabetes prediction. The delta of weight ranked fourth in the year 1–3 dataset.
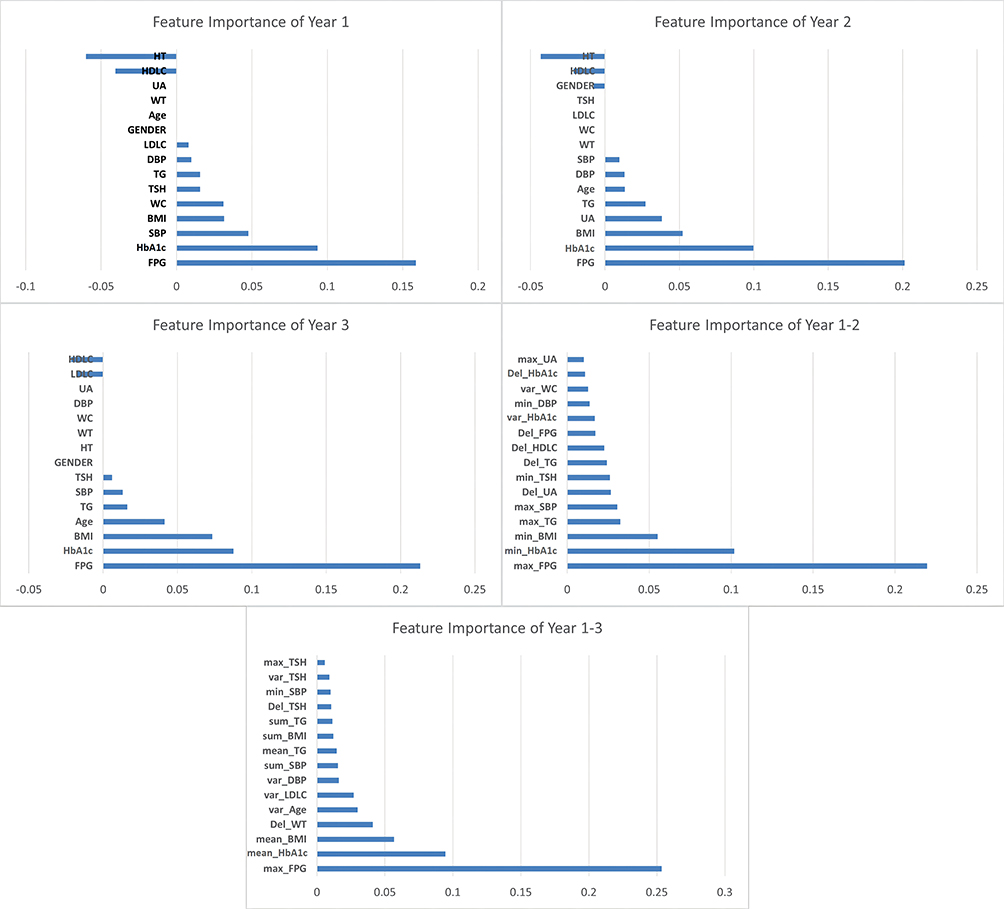 |
Figure 3 Feature importance of each dataset using LASSO. Abbreviations: BMI, body mass index; WC, waist circumference; SBP, systolic blood pressure. DBP, diastolic blood pressure; FPG, fasting plasma glucose; HDLC, high-density lipoprotein cholesterol; LDLC, low-density lipoprotein cholesterol; TG, triglyceride; FPG, fasting plasma glucose; HbA1c, glycated hemoglobin; TSH, thyroid-stimulating hormone; UA, uric acid. Notes: Parameter “Del_xx” was abbreviated from “delta_xx”. “Var_xx” was abbreviated from “Variance_xx”. |
Discussion
To our knowledge, this is the first study to use multiple years’ data to predict the risk of diabetes for patients with MetS. The average AUROC for both random forest and Xgboost models could reach >0.80, indicating the sufficient performance of both classifiers. This study demonstrated overall improved performance metrics with the accumulation of longitudinal data.
Of all the longitudinal datasets used, Xgboost model performed best with the highest AUROC. It also presented greatly similar results in recall and precision rate, which can be considered a well-balanced model. Among the three models, Xgboost was the most sensitive classifier to the longitudinal dataset as its AUROC increased with the addition of more years’ data and presented the largest variances of AUROC derived from the 3 years. Random forest model, which presented the least variance with different longitudinal datasets, achieved the most stable classification results (AUROC=0.850±0.033) through different groups of datasets. Unlike the tree-based models, the logistic regression model worsened when adding more longitudinal data as multi-year dataset inputs more features into the model that may still cause overfit. The logistic regression model may not be a good classifier for the longitudinal dataset prediction. The evidence that gradual increment of performance variables from each single year may suggest that the closer to the outcome year, the more accurate the model can be.
The average performance metrics from multiple years’ data using random forest and Xgboost were better than those of each single year; this result has clearly shown the considerable benefit of using longitudinal data when predicting the onset of diabetes. Moreover, our results indicated that for individuals with similar clinical parameters, the variation trends of these parameters could change the risk of future diabetes. Models based on longitudinal multiple years’ data may provide more personalized assessment tools for risk evaluation. Our prediction models exhibited better results than some other longitudinal studies. For instance, Lai et al demonstrated that the Gradient Boost Model (GBM) was best with an AUROC of 0.847 for diabetes prediction.24 In a recently published 13 years’ longitudinal study, the cumulative exposure of 3 years before baseline was used to predict diabetes by COX regression and the AUC was 0.802.19
In both multiple-year models, we found that the highest FPG was the strongest predictor of diabetes, followed by the mean or lowest level of HbA1c and then, BMI. Decreased thyroid function (by TSH) was also a risk factor in each single-year or multiple-year model except for the year 2 model. This result is consistent with current evidence that suggests an increased type 2 diabetes risk in people with hypothyroidism.25,26 When focusing on deltas that represent the trends of variables, we found that delta weight, delta TSH, delta UA, and delta TG were stronger predictors than delta FPG or HbA1c. Especially in the year 1–3 model, delta weight was the fourth-most important feature, suggesting that a history of gaining weight is the main risk factor for MetS patients to develop diabetes. The importance of weight loss for diabetes prevention has been proven in several prospective large-scale clinical trials such as the Diabetes Prevention Program (DPP), Finnish Diabetes Study, and the Da Qing Study.27–29 Our study provided a new perspective to include the history of weight loss or weight gain into the individualized risk of diabetes.
Our study is limited by its retrospective design and the sample size, as we focused on MetS patients having multiple years’ health records. Furthermore, our results need to be cautiously extrapolated to the general Chinese population, given that it is a single-center study, and the participants were mostly company employees with a relatively high socioeconomic status from North China. It is essential to validate our proposed model using an external dataset in the future. A good model with sufficient robustness can achieve similar results with various datasets.
Conclusion
To our knowledge, this is the first study to use machine-learning methods based on multiple years’ data to predict diabetes in MetS patients. This study demonstrated improved performance with the accumulation of longitudinal data. In the multiple-year models, fluctuation of weight and some biomarkers played certain roles. This showed that models based on longitudinal multiple years’ data may provide more personalized assessment tools for risk evaluation in MetS patients.
Acknowledgments
We acknowledge all the healthcare workers involved in the establishment of the PUMCH-HM database in Peking Union Medical College Hospital.
Disclosure
The authors report no conflicts of interest in this work.
References
1. Li Y, Teng D, Shi X, et al. Prevalence of diabetes recorded in mainland China using 2018 diagnostic criteria from the American Diabetes Association: national cross-sectional study. BMJ. 2020;369. doi:10.1136/BMJ.M997
2. International Diabetes Federation. IDF Diabetes Atlas [Internet].
3. Aguilar M, Bhuket T, Torres S, Liu B, Wong RJ. Prevalence of the metabolic syndrome in the United States, 2003–2012. JAMA. 2015;313(19):1973. doi:10.1001/jama.2015.4260
4. Ford ES, Giles WH, Dietz WH. Prevalence of the metabolic syndrome among US adults. JAMA. 2002;287(3):356. doi:10.1001/jama.287.3.356
5. Hirode G, Wong RJ. Trends in the prevalence of metabolic syndrome in the United States, 2011–2016. JAMA. 2020;323(24):2526. doi:10.1001/jama.2020.4501
6. Li R, Li W, Lun Z, et al. Prevalence of metabolic syndrome in mainland China: a meta-analysis of published studies. BMC Public Health. 2016;16(1):296. doi:10.1186/s12889-016-2870-y
7. He Y, Li Y, Bai G, et al. Prevalence of metabolic syndrome and individual metabolic abnormalities in China, 2002–2012. Asia Pac J Clin Nutr. 2019;28(3):621–633. doi:10.6133/apjcn.201909_28(3).0023
8. Wu Y. Overweight and obesity in China. BMJ. 2006;333(7564):362–363. doi:10.1136/bmj.333.7564.362
9. Lee MK, Han K, Kim MK, et al. Changes in metabolic syndrome and its components and the risk of type 2 diabetes: a nationwide cohort study. Sci Rep. 2020;10(1):2313. doi:10.1038/s41598-020-59203-z
10. Kim D, Yoon SJ, Lim DS, et al. The preventive effects of lifestyle intervention on the occurrence of diabetes mellitus and acute myocardial infarction in metabolic syndrome. Public Health. 2016;139:178–182. doi:10.1016/J.PUHE.2016.06.012
11. Ohnishi H, Saitoh S, Akasaka H, Furukawa T, Mori M, Miura T. Impact of longitudinal status change in metabolic syndrome defined by two different criteria on new onset of type 2 diabetes in a general Japanese population: the Tanno-Sobetsu Study. Diabetol Metab Syndr. 2016;8(1). doi:10.1186/S13098-016-0182-0
12. Abbasi A, Peelen LM, Corpeleijn E, et al. Prediction models for risk of developing type 2 diabetes: systematic literature search and independent external validation study. BMJ. 2012;345(sep182):e5900. doi:10.1136/bmj.e5900
13. Dinh A, Miertschin S, Young A, Mohanty SD. A data-driven approach to predicting diabetes and cardiovascular disease with machine learning. BMC Med Inform Decis Mak. 2019;19(1). doi:10.1186/s12911-019-0918-5
14. Pei D, Gong Y, Kang H, Zhang C, Guo Q. Accurate and rapid screening model for potential diabetes mellitus. BMC Med Inform Decis Mak. 2019;19(1):41. doi:10.1186/s12911-019-0790-3
15. Kavakiotis I, Tsave O, Salifoglou A, Maglaveras N, Vlahavas I, Chouvarda I. Machine learning and data mining methods in diabetes research. Comput Struct Biotechnol J. 2017;15:104–116. doi:10.1016/j.csbj.2016.12.005
16. Talaei-Khoei A, Wilson JM. Identifying people at risk of developing type 2 diabetes: a comparison of predictive analytics techniques and predictor variables. Int J Med Inform. 2018;119:22–38. doi:10.1016/j.ijmedinf.2018.08.008
17. Upadhyaya SG, Murphree DH, Ngufor CG, et al. Automated diabetes case identification using electronic health record data at a tertiary care facility. Mayo Clin Proc. 2017;1(1):100–110. doi:10.1016/j.mayocpiqo.2017.04.005
18. Alghamdi M, Al-Mallah M, Keteyian S, Brawner C, Ehrman J, Sakr S. Predicting diabetes mellitus using SMOTE and ensemble machine learning approach: the Henry Ford ExercIse Testing (FIT) project. PLoS One. 2017;12(7):e0179805. doi:10.1371/journal.pone.0179805
19. Simon GJ, Peterson KA, Castro MR, Steinbach MS, Kumar V, Caraballo PJ. Predicting diabetes clinical outcomes using longitudinal risk factor trajectories. BMC Med Inform Decis Mak. 2020;20(1):6. doi:10.1186/s12911-019-1009-3
20. Oh W, Kim E, Castro MR, et al. Type 2 diabetes mellitus trajectories and associated risks. Big Data. 2016;4(1):25–30. doi:10.1089/big.2015.0029
21. Alberti KGMM, Eckel RH, Grundy SM, et al. Harmonizing the metabolic syndrome: a joint interim statement of the International Diabetes Federation Task Force on Epidemiology and Prevention; National Heart, Lung, and Blood Institute; American Heart Association; World Heart Federation; International Atherosclerosis Society; and International Association for the Study of Obesity. Circulation. 2009;120(16):1640–1645. doi:10.1161/CIRCULATIONAHA.109.192644
22. American Diabetes Association. 2. Classification and diagnosis of diabetes: standards of medical care in diabetes—2022. Diabetes Care. 2022;45(Supplement_1):S17–S38. doi:10.2337/dc22-S002
23. Stekhoven DJ, Bühlmann P. MissForest--non-parametric missing value imputation for mixed-type data. Bioinformatics. 2012;28(1):112–118. doi:10.1093/BIOINFORMATICS/BTR597
24. Lai H, Huang H, Keshavjee K, Guergachi A, Gao X. Predictive models for diabetes mellitus using machine learning techniques. BMC Endocr Disord. 2019;19(1). doi:10.1186/s12902-019-0436-6
25. Roa Dueñas OH, van der Burgh AC, Ittermann T, et al. Thyroid function and the risk of prediabetes and type 2 diabetes. J Clin Endocrinol Metab. 2022;107(6). doi:10.1210/CLINEM/DGAC006
26. Rong F, Dai H, Wu Y, et al. Association between thyroid dysfunction and type 2 diabetes: a meta-analysis of prospective observational studies. BMC Med. 2021;19(1). doi:10.1186/S12916-021-02121-2
27. Diabetes Prevention Program Research Group. 10-year follow-up of diabetes incidence and weight loss in the Diabetes Prevention Program Outcomes Study. Lancet. 2009;374(9702):1677–1686. doi:10.1016/S0140-6736(09)61457-4
28. Lindström J, Ilanne-Parikka P, Peltonen M, et al. Sustained reduction in the incidence of type 2 diabetes by lifestyle intervention: follow-up of the Finnish Diabetes Prevention Study. Lancet. 2006;368(9548):1673–1679. doi:10.1016/S0140-6736(06)69701-8
29. Li G, Zhang P, Wang J, et al. Cardiovascular mortality, all-cause mortality, and diabetes incidence after lifestyle intervention for people with impaired glucose tolerance in the Da Qing Diabetes Prevention Study: a 23-year follow-up study. Lancet Diabetes Endocrinol. 2014;2(6):474–480. doi:10.1016/S2213-8587(14)70057-9
 © 2022 The Author(s). This work is published and licensed by Dove Medical Press Limited. The
full terms of this license are available at https://www.dovepress.com/terms
and incorporate the Creative Commons Attribution
- Non Commercial (unported, 3.0) License.
By accessing the work you hereby accept the Terms. Non-commercial uses of the work are permitted
without any further permission from Dove Medical Press Limited, provided the work is properly
attributed. For permission for commercial use of this work, please see paragraphs 4.2 and 5 of our Terms.
© 2022 The Author(s). This work is published and licensed by Dove Medical Press Limited. The
full terms of this license are available at https://www.dovepress.com/terms
and incorporate the Creative Commons Attribution
- Non Commercial (unported, 3.0) License.
By accessing the work you hereby accept the Terms. Non-commercial uses of the work are permitted
without any further permission from Dove Medical Press Limited, provided the work is properly
attributed. For permission for commercial use of this work, please see paragraphs 4.2 and 5 of our Terms.
Recommended articles
Understanding the Role of Metabolic Syndrome as a Risk Factor for Hepatocellular Carcinoma
Chavez-Tapia NC, Murúa-Beltrán Gall S, Ordoñez-Vázquez AL, Nuño-Lambarri N, Vidal-Cevallos P, Uribe M
Journal of Hepatocellular Carcinoma 2022, 9:583-593
Published Date: 5 July 2022
The Effectiveness of Indigenous Knowledge-Based Lifestyle Interventions in Preventing Obesity and Type 2 Diabetes Mellitus in Indigenous Children in Canada: A Systematic Review
Kshatriya M, Wang KW, Hildebrand J, Crawford R, Nadarajah A, Youssef M, Rivas A, Kaushal A, Banfield LE, Thabane L, Samaan MC
Adolescent Health, Medicine and Therapeutics 2023, 14:175-193
Published Date: 28 September 2023
Evaluating Glycemic Control Efficacy and Safety of the Oral Small Molecule Glucagon-Like Peptide 1 Receptor Agonist Danuglipron in Type 2 Diabetes Patients: A Systemic Review and Meta-Analysis
Fatima H, Rangwala HS, Mustafa MS, Shafique MA, Abbas SR, Rizwan A, Fadlalla Ahmed TK, Arshad A
Diabetes, Metabolic Syndrome and Obesity 2023, 16:3567-3578
Published Date: 7 November 2023
Design and Protocol of the Biobank for Metabolic Syndrome Consequences (BMSC): A Prospective Cohort Study in Northwest China
Yang X, Li Q, He Y, Yin G, Li M, Zhu W, Fan X, Gong Y, Wang Y, Qiang W, Wang Y, Willems van Dijk K, Rensen PCN, Guo H, Shi B, Wang Y
Clinical Epidemiology 2025, 17:823-835
Published Date: 14 October 2025
Modulating Metabolic Health and Physiological Functions: Advances in Dietary Interventions Targeting Gut Microbiota
Rabbani SA, El-Tanani M, Janić M, Janež A, Tanani YE, Hajeer E, Matalka MI, Rizzo M, Kumar R
Therapeutics and Clinical Risk Management 2025, 21:1701-1733
Published Date: 13 December 2025