Back to Journals » Drug Design, Development and Therapy » Volume 12
Preclinical pharmacokinetics, interspecies scaling, and pharmacokinetics of a Phase I clinical trial of TTAC-0001, a fully human monoclonal antibody against vascular endothelial growth factor 2
Authors Lee WS, Shim SR ![]() , Lee SY, Yoo JS, Cho SK
, Lee SY, Yoo JS, Cho SK
Received 29 August 2017
Accepted for publication 18 December 2017
Published 8 March 2018 Volume 2018:12 Pages 495—504
DOI https://doi.org/10.2147/DDDT.S150241
Checked for plagiarism Yes
Review by Single anonymous peer review
Peer reviewer comments 2
Editor who approved publication: Dr Sukesh Voruganti
Weon Sup Lee,1 Sang Ryeol Shim,1 Seon Young Lee,1 Jin San Yoo,1 Sung Kweon Cho2
1PharmAbcine, Inc., Daejeon, Republic of Korea; 2Department of Health Sciences and Technology, SAIHST, Sungkyunkwan University, Seoul, Republic of Korea
Background: VEGF is a highly selective mitogen that serves as the central regulator of tumor angiogenesis by mediating endothelial proliferation, permeability, and survival. Tanibirumab (TTAC-0001) is a fully human IgG1 monoclonal antibody derived from a fully human naïve single-chain variable fragment (ScFv) phage library that was developed to inhibit the effects of VEGF in the treatment of solid tumors, especially those of the brain.
Methods: In the present study, we conducted intravenous pharmacokinetic studies of TTAC-0001 in mice, rats, and cynomolgus monkeys. At the doses studied (3 mg/kg, 10 mg/kg, 30 mg/kg), TTAC-0001 exhibited dose proportionality in mice and monkeys. At a dose of ~10 mg/kg, the clearance of TTAC-0001 from serum was 0.017 mL/h in mice, 0.35 mL/h in rats, and 2.19 mL/h in cynomolgus monkeys, and the terminal half-life ranged from 20–30 h among the three species. Pharmacokinetic data in mice, rats, and cynomolgus monkeys were used to predict the pharmacokinetics of TTAC-0001 in humans using allometric scaling. The predicted serum clearance of TTAC-0001 in humans was 102.45 mL/h and the terminal half-life was 27.52 h.
Results: The maximum life span-corrected clearance value was 72.92 mL/h. The observed clearance in humans was more similar to the predicted scaled clearance.
Conclusion: We investigated the pharmacokinetics of TTAC-0001 in mice, rats, and cynomolgus monkeys after intravenous administration. At the doses studied, TTAC-0001 exhibited dose proportionality in mice and monkeys. The scaled pharmacokinetics of TTAC-0001 reported here was useful for designing first-in-human studies. Allometric scaling in the therapeutic antibody is feasible.
Keywords: VEGF2, tanibirumab, pharmacokinetics, allometry, clearance, biodistribution
Introduction
Angiogenesis is a crucial aspect of cancer cell survival, local tumor growth, and development of distant metastases, as well as endothelial cell-mediated degradation.1–3 Among the factors involved in tumor angiogenesis,4 VEGF is a key positive regulator of tumor angiogenesis and endothelial proliferation.5 Specifically, tumor cells secrete VEGF to promote angiogenesis and maintain survival of the existing tumor vasculature. The correlation between increased VEGF expression and tumor activity has been established previously.6,7 VEGF family members can be classified into VEGF-A (also termed VEGF), VEGF-B, VEGF-C, VEGF-D, and VEGF-E.8 Likewise, there are three VEGF receptors, namely, VEGFR-1 (fms-like tyrosine kinase receptor 1[Flt-1]), VEGFR-2 (kinase insert domain-containing receptor [KDR]), and VEGFR-3 (Flt-4). VEGFR-1 and VEGFR-2 are the main receptors associated with tumor vasculature and facilitate a high level of angiogenesis activity, whereas VEGFR-3 is involved in lymph angiogenesis.9,10 VEGFR-2 is expressed on the surface of endothelial cells and is a key mediator of the mitogenic and angiogenic effects of VEGF signaling. Binding of VEGF to VEGFR-2 triggers receptor dimerization, resulting in activation through transphosphorylation and downstream signaling including phosphatidylinositol 3-kinase (PI3K) and mitogen-activated protein kinase (MAPK).11 In addition, VEGFR-2 is overexpressed during tumor growth, and is generally three- to fivefold higher in tumor vasculature compared to normal vasculature.5
Various anti-angiogenic drugs have been developed to target the VEGF-2 pathway, and two small molecular inhibitors targeting the VEGF-2 pathway are currently available. Nexavar® (sorafenib; Bayer, Whippany, NJ, USA) has beneficial effects in patients with advanced hepatocellular carcinoma,12 while Sutent® (sunitinib; Pfizer Inc., New York, NY, USA) can be used to treat advanced renal cell carcinoma. However, appropriate management of the toxicities associated with these agents is necessary in order to maintain patients on treatment.13 In addition to sorafenib and sunitinib, Cyramza® (ramucirumab; Eli Lilly and Company, Indianapolis, IN, USA), a monoclonal antibody to VEGFR-2, has been reported to produce a survival benefit when used in combination with conventional chemotherapy for patients with metastatic colorectal carcinoma.14 Hypertension is a commonly reported adverse event during treatment with ramucirumab, and other adverse drug reactions have restricted its use in some patients.15
Tanibirumab (TTAC-0001; PharmAbcine, Daejeon, Korea) is a fully human IgG1 monoclonal antibody derived from a fully human naïve single-chain variable fragment (ScFv) phage library. TTAC-0001 neutralizes the biological activity of VEGFR-2 by inhibiting angiogenesis and tumor growth. TTAC-0001 exhibits robust antitumor activity with an efficacious dose range of 0.1–10 mg/kg in colorectal, breast, lung, and glioblastoma tumor models.11 In addition, TTAC-0001 has been shown to inhibit VEGF-mediated signaling pathways in a dose-dependent manner in a mouse model.11
In the present study, we investigated the time-dependent tissue distribution of TTAC-0001 in mice implanted with K-562 cells. Pharmacokinetic studies were conducted in mice, rats, and cynomolgus monkeys after intravenous (IV) administration of TTAC-0001. The pharmacokinetic data in animals were used to predict the disposition of TTAC-0001 in humans using allometric scaling. Simple allometric scaling has been successfully applied based on the interspecies pharmacokinetic extrapolations.16 The estimated volume of distribution and clearance using allometric scaling was used to select the starting dose in the Phase I trial17 and blood sampling point for pharmacokinetic analysis.
Last, we compared the pharmacokinetic results of a Phase I clinical trial17 of TTAC-0001 to scaled data from animal models, and assessed the feasibility of allometric scaling in the therapeutic antibody for future studies.
Methods
Materials
TTAC-0001 manufactured using recombinant DNA technology was expressed in a genetically engineered Chinese hamster ovary cell line. CHO-DG 44 (Dihydrofolate reductase [dhfr] deficient CHO) used in cell line development for TTAC-0001 production was used by purchasing CHO-DG44 cGMP MCB (Bank No 233) from Thermo Fisher Scientific, Waltham, MA, USA. The protein was available as a clear-to-slightly-opalescent sterile liquid at a concentration of 20 mg/mL. Male BALB/c mice (17–22 g) were housed as a group, male Sprague Dawley rats (189–197 g) were housed individually, and male cynomolgus monkeys (Macaca fascicularis) weighing between 1.9 and 2.4 kg were acclimated for 3–4 weeks. All animals were provided ad libitum access to food and water. These studies were conducted in compliance with all regulations that can be applied to the management and use of laboratory animals and monitored by the Institutional Animal Care and Use Committee of Korea Institute of Toxicology, KRICT (AAALAC International Accreditation in 1998). All studies were approved by the Institutional Animal Care KIT Study (No: G11008, G11009, and G11079) and Use Committee and were performed in accordance with the guidelines.
TTAC-0001 distribution study in K562 cell-implanted mice
K562 melanoma cells were injected subcutaneously in athymic female BALB/c mice. Tumor xenograft-bearing mice were selected 14 days after injection (tumor volume: 200–300 mm3). A biodistribution study was performed with mice injected via the tail vein with 125I-labeled TTAC-0001 at 15 mg/kg. After 24, 48, 72, 120, and 168 h, the tumor, blood, and major organs from each of three mice were removed, weighed, and counted in a gamma scintillation counter to determine the %ID (isotope distribution)/g.
IV administration of TTAC-0001 in rats and mice
Mice were treated with 3, 10, or 30 mg/kg of TTAC-0001. In each group, the treatment (n=3 at every time point; total n=45) was administered through a single IV injection in the tail vein. Blood was collected on day 1 pre-dose, after dosing at 0.25, 0.5, 1, 2, 6, 12, and 24 h, and on post-dose days 2, 3, 5, 7, 10, 14, and 21. At each sampling time three mice were sacrificed, blood was collected via cardiac puncture, and serum was harvested. For rat studies, the animals received 3, 10, or 30 mg/kg TTAC-0001 as a single IV bolus injection via a femoral vein catheter. Blood samples (0.4 mL) were collected via a jugular vein cannula. Samples were collected before dosing on day 1, post-dose at 0.25 and 0.5 h, and on post-dose days 2, 3, 5, 7, 10, 14, and 28.
Intravenous administration of TTAC-0001 in cynomolgus monkeys
Animals were randomized into three groups (n=6 per group). Each monkey received a single IV injection of 3, 10, or 30 mg/kg TTAC-0001 via the saphenous vein. Blood samples (1 mL) were collected from the cephalic vein pre-dose and post-dose at 0.5, 1, 2, 6, 12, and 24 h, and on post-dose days 2, 3, 5, 7, 10, 14, 21, 28, 35, and 42. Serum was harvested and stored below 60°C until analyzed.
Intravenous administration of TTAC-0001 in humans
A Phase I clinical trial of TTAC-0001 was previously conducted in patients with refractory solid tumors, and the clinical outcomes of this study have been published.17 The study was approved by the Institutional Review Board at Samsung Medical Center and registered with ClinicalTrial.gov under the identifier NCT#01660360. For the study, the first 1-hour infusion of TTAC-0001 was used for pharmacokinetic analysis. After infusion, blood was collected at 0, 0.5, 2, 4, 24, and 72 h. According to the dose escalation scheme, TTAC-0001 was infused for 1 h at nine different dose levels ranging from 1 to 28 mg/kg in three patients per dose level.
Pharmacokinetics
Concentration versus time data from mice, rats, and cynomolgus monkeys were calculated by non-compartmental analysis using Phoenix WinNonlin 6.1 (Pharsight Corporation, Mountain View, CA, USA). Clearances, volumes of distribution, maximum concentration (Cmax), and area under the plasma concentration-time curves from zero to the last measurable point (AUClast) were determined. The elimination rate constant (ke) was estimated from the slope of the best-fit line determined by linear regression analysis of a log-transformed concentration-time curve. The elimination half-life (t1/2) was then calculated by the equation t1/2= ln(2)/ke. Clearance was calculated as the dose divided by the AUC from time zero to infinity (AUCinf).
Determination of TTAC-0001 concentration by enzyme-linked immunosorbent assay
The concentration of TTAC-0001 in serum samples from mice, rats, cynomolgus monkeys and humans were analyzed by ELISA. To measure the serum concentrations of TTAC-0001, each well in a MaxiSorp 96-well microtiter plate was coated with 100 μL of 2.5 μg/mL recombinant KDR-extracellular domain (Ig 1–3) (Pharmabcine, Daejeon, Korea) in 1× phosphate buffered saline (PBS), a pH 7.4 solution, incubated at 4°C for more than 12 h, and washed three times with a PBS/0.05% Tween-20 solution. Next, plates were incubated with 200 μL of blocking buffer per well (1× PBS, 0.5% bovine serum albumin (BSA), 0.05% Tween 20, 0.05% Proclin300, 0.25% CHAPS, 0.2% BGG, 5 mM EDTA, 0.35 M NaCl, pH 7.7) for 1 h. After washing the plate, assay calibrators were prepared by serial dilution of TTAC-0001 in blank serum (Biochemed Services, Winchester, VA, USA). Likewise, quality control solutions representing the LLOQ (lower limit of quantification), LQC (low quality control), MQC (middle quality control), HQC (high quality control), and ULOQ (upper limit of quantification) were prepared by diluting TTAC-0001 in blank serum. Serum samples were serially diluted from 1 to 50,000-fold in blank serum. Next, the prepared calibrators, quality controls, serum blanks, and samples were diluted with pre-determined factors of the minimum required dilution in dilution buffer (1× PBS, 0.5% BSA, 0.05% Tween 20, 0.05% Proclin300, 0.25% CHAPS, 5 mM EDTA, 0.6 M NaCl, pH 8.9). A total of 100 μL of each component was then aliquoted in duplicate and incubated at 25°C for 2 h. After washing, the plate was incubated with 100 mL of a detection antibody solution consisting of a horseradish peroxidase-conjugated goat anti-human IgG (heavy and light chains) antibody (Bethyl Laboratories, Montgomery, TX, USA) at a 1:2,000 dilution in a PBS/0.05% Tween-20 solution at 25°C for 2 h in dark conditions. After five washes with a PBS/0.05% Tween-20 solution, plates were incubated with 100 μL/well of freshly mixed 3,30,5,50-tetramethylbenzidine chromogenic solution (BD Biosciences, San Jose, CA, USA) at 25°C for 5–20 min. Once the color changes were observed, the reaction was quenched by adding 50 μL of a 2N H2SO4 stop solution to each well. Optical density was measured at 450 nm using a microplate reader (Molecular Devices, Sunnyvale, CA, USA), and the data were processed using Softmax Pro 5 G×P software (version 5.4.1; Molecular Devices). Serum concentrations of TTAC-0001 were interpolated from a 4-parameter logistic fit of the standard curve on the same plate.
The quantification range of the assay was 1.95–100 ng/mL for rat and cynomolgus monkey serum, 3.91–500 ng/mL for mouse serum, and 2.5–100 μg/mL for human serum. The minimum required dilution for the assay was 1:10 for serum from mice, Sprague Dawley rats, and cynomolgus monkeys, and 1:1,000 for human serum. The immunoassays for TTAC-0001 described earlier have been previously validated, either fully or partially, and were performed in accordance with good laboratory practice regulations and Guidance for Industry: Bioanalytical Method Validation.
Allometric scaling
Pharmacokinetic data from mice, rats, and cynomolgus monkeys after IV administration were used to predict the pharmacokinetics of TTAC-0001 in humans using allometric scaling.18,19 Pharmacokinetic data were scaled using simple allometry based on species body weight:
|

where Y is the pharmacokinetic parameter of interest (eg, clearance and volume of distribution elimination t1/2), W is the species body weight, a is the allometric coefficient, and b is the allometric exponent. The mean data from 3, 10, and 30 mg/kg doses of TTAC-0001 in mice, rats, and cynomolgus monkeys for clearance, volumes of distribution and elimination t1/2 data, and species weight were plotted on log coordinates. Linear regression was performed to fit the log-transformed data in order to estimate parameters a and b according to the aforementioned equation. Simple allometric relationships were used to predict the pharmacokinetics of TTAC-0001 in humans based on a body weight of 70 kg. The predicted and observed pharmacokinetics of TTAC-0001 in humans were also compared. We also calculated maximum life span (MLP)-corrected clearance and volume of distribution. The clinical pharmacokinetic data for TTAC-0001 was obtained from an initial single ascending dose (SAD) study in healthy subjects (n=3 per dose).17
Results
Biodistribution studies of TTAC-0001 in mice
The concentrations of TTAC-0001 24, 48, 72, 120, and 168 h after administration in mice harboring melanoma xenografts were 1.33±0.46 ID%/g, 1.42±0.29 ID%/g, 0.80±0.46 ID%/g, 0.44±0.25 ID%/g, and 0.25±0.24 ID%/g, respectively. The tumor to blood ratios of TTAC-0001 24, 48, 72, 120, and 168 h after administration were 0.37±0.06, 0.61±0.06, 0.90±0.62, 0.76±0.35, and 0.78±0.15, respectively. The maximum tumor distribution of TTAC-0001 was reached 3 days after administration. The tumor to muscle ratios of TTAC-0001 24, 48, 72, 120, and 168 h after administration were 1.47±0.51, 2.43±0.50, 3.60±2.02, 3.28±1.28, and 3.17±1.47, respectively. The biodistribution of TTAC-0001 is shown in Figure 1.
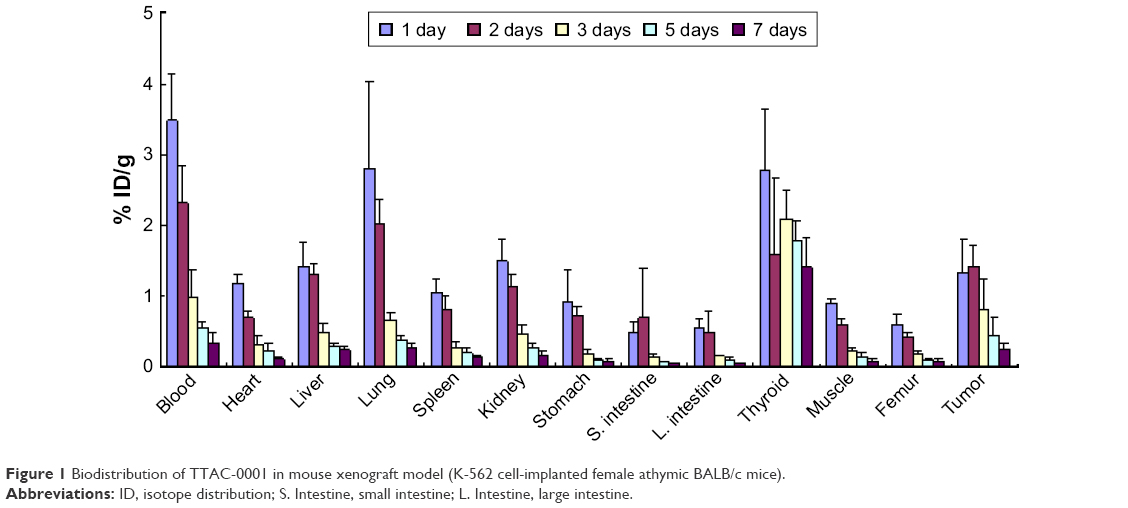 | Figure 1 Biodistribution of TTAC-0001 in mouse xenograft model (K-562 cell-implanted female athymic BALB/c mice). |
Pharmacokinetics of TTAC-0001 in mice and rats
The pharmacokinetic parameters of TTAC-0001 in mice and rats are summarized in Table 1. Figure 2 shows a plot of concentration versus time of TTAC-0001 in mice and rats. After an IV bolus administration, TTAC-0001 was eliminated in a biphasic manner. The terminal t1/2 was 20 to 30 h, which accounted for 90% of the total AUC. The volumes of distribution for 3, 10, and 30 mg/kg in mice were 0.76±0.025 mL, 0.78±0.12 mL, and 0.48±0.0067 mL, respectively. Likewise, the respective volumes of distribution for 3, 10, and 30 mg/kg doses in rats were 10.24±1.45 mL, 10.69±3.09 mL, and 14.22±3.88 mL, respectively. The clearances for 3, 10, and 30 mg/kg in mice were 0.019±0.024 mL/h, 0.017±0.0023 mL/h, and 0.020±0.0032 mL/h, respectively. Likewise, the respective clearances for 3, 10, and 30 mg/kg doses in rats were 0.37±0.021 mL/h, 0.35±0.0021 mL/h, and 0.34±0.0041 mL/h. After an IV dose of 10 mg/kg TTAC-0001, the clearance was 0.017 mL/h in mice and 0.35 mL/h in rats, with no evidence of dose-dependent influence on clearance. Dose proportionality for Cmax and AUClast was observed in both mice and rats (Figure 3).
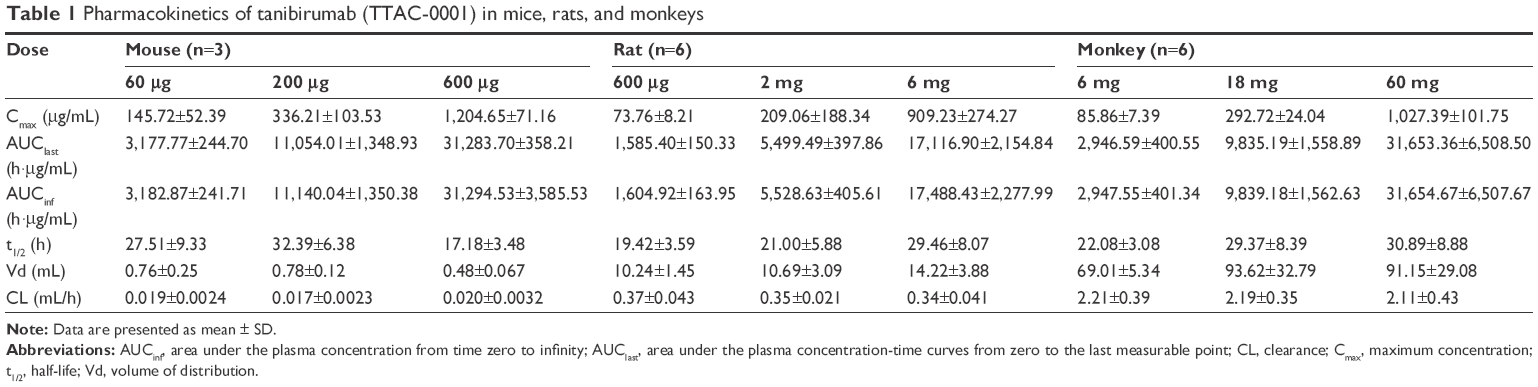 | Table 1 Pharmacokinetics of tanibirumab (TTAC-0001) in mice, rats, and monkeys |
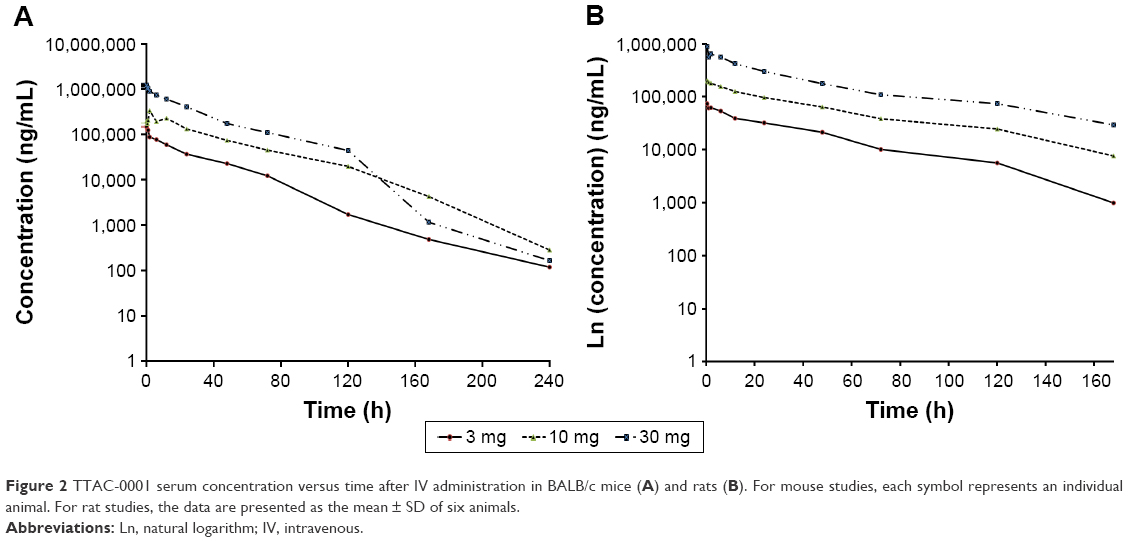 | Figure 2 TTAC-0001 serum concentration versus time after IV administration in BALB/c mice (A) and rats (B). For mouse studies, each symbol represents an individual animal. For rat studies, the data are presented as the mean ± SD of six animals. |
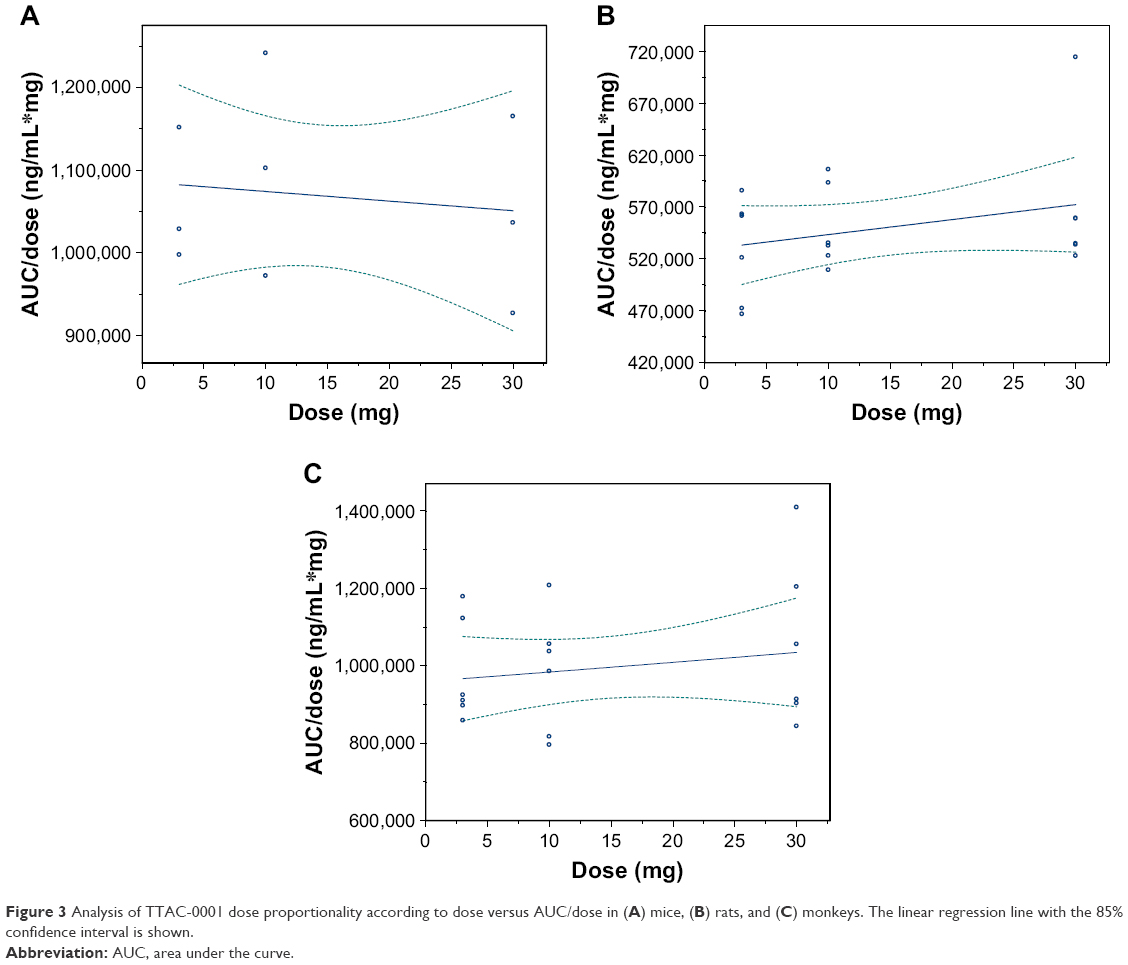 | Figure 3 Analysis of TTAC-0001 dose proportionality according to dose versus AUC/dose in (A) mice, (B) rats, and (C) monkeys. The linear regression line with the 85% confidence interval is shown. |
Pharmacokinetics of TTAC-0001 in cynomolgus monkeys
The pharmacokinetic parameters of TTAC-0001 in cynomolgus monkeys are summarized in Table 1. Figure 4 shows the concentration versus time of TTAC-0001 in cynomolgus monkeys. After IV bolus injection, the clearances for 3, 10, and 30 mg/kg of TTAC-0001 in monkeys were 2.21±0.39 mL/h, 2.19±0.35 mL, and 2.11±0.43 mL, respectively. Likewise, the respective volumes of distribution for 3, 10, and 30 mg/kg doses were 69.01±5.34 mL, 93.62±32.79 mL, and 91.15±29.08 mL. TTAC-0001 was cleared from serum in a monophasic manner, with a terminal half-life of 22.08 to 30.89 h. Dose proportionality for Cmax and AUClast was evident in monkeys (Figure 3).
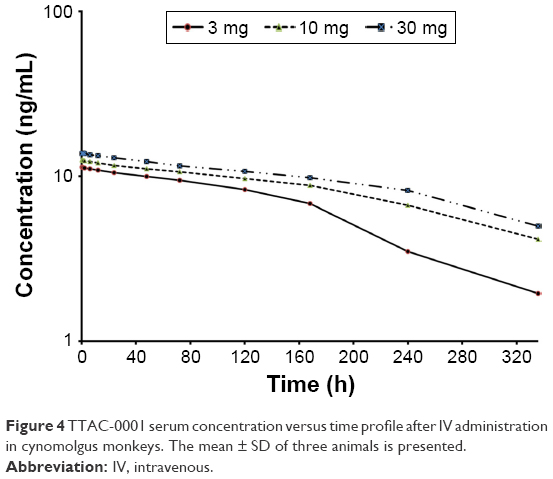 | Figure 4 TTAC-0001 serum concentration versus time profile after IV administration in cynomolgus monkeys. The mean ± SD of three animals is presented. |
Pharmacokinetics of TTAC-0001 in humans
The pharmacokinetic parameters of TTAC-0001 in humans are summarized in Table 2. The parameters in the 1, 2, 4, 8, 12, 16, 20, and 24mg/kg groups were as follows: Cmax (μg/mL) 26.34±0.70, 42.08±11.49, 86.49±21.59, 133.47±28.83, 291.66±88.69, 277.76±73.42, 363.41±51.10, and 467.32±59.90 μg/mL; AUClast (h·μg/mL) 1,017.53±76.29, 2,366.51±1,574.55, 5,558.71±1,080.13, 8,977.79±2,496.22, 16,765.24±2,311.77, 17,429.76±2,558.73, 23,220.31±3,005.24, and 34,254.49±7,375.69 h·μg/mL, respectively. Dose-proportional pharmacokinetic property was shown.
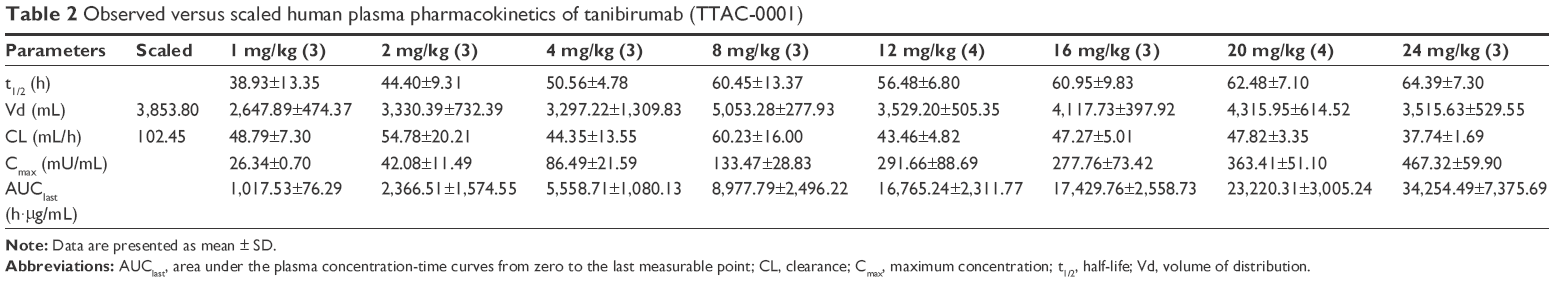 | Table 2 Observed versus scaled human plasma pharmacokinetics of tanibirumab (TTAC-0001) |
Allometric scaling
The allometric regression results are shown in Table 2 and Figure 5. The predicted pharmacokinetics of TTAC-0001 in humans are listed in Table 2. Based on allometric scaling, we predicted that the clearance of TTAC-0001 was 102.45 mL/h, with a volume of distribution of 3,853.80 mL. Using simple allometry, the values of the clearance coefficients a and b were 0.2437 and 1.0323, respectively. In the same manner, we found that the values of the a and b coefficients for volume of distribution were 3.8524 and 1.0367, respectively. MLP-corrected clearance and volume of distribution were 72.92 mL/h and 2,743.70 mL, respectively. Lastly, we showed the comparison between predicted and observed clearance termina and volume of distribution of TTAC-0001 from a Phase I study in cancer patients.17 The predicted value of volume of distribution was found to be within the range of observed value, whereas the clearance was overestimated with simple allometry.
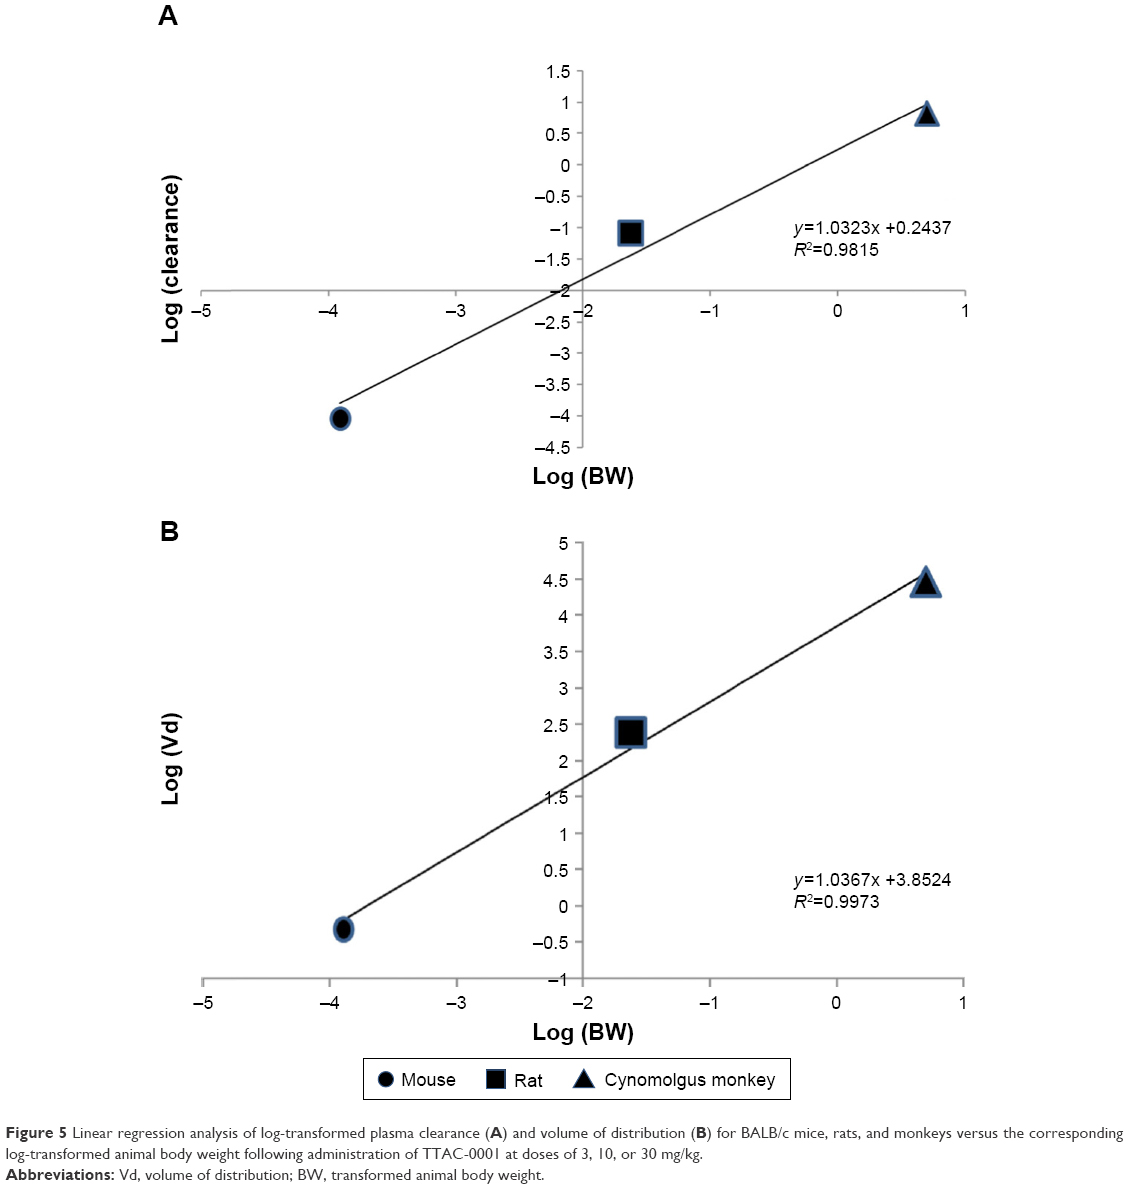 | Figure 5 Linear regression analysis of log-transformed plasma clearance (A) and volume of distribution (B) for BALB/c mice, rats, and monkeys versus the corresponding log-transformed animal body weight following administration of TTAC-0001 at doses of 3, 10, or 30 mg/kg. |
Discussion
The distribution of TTAC-0001 in tumor sites was sufficient to reach an effective dose in our study. The distribution of TTAC-0001 in lung and thyroid was relatively high. In our safety pharmacology study, we did not observe any drug-related adverse events on assessing the general behavior, body temperature, respiration rate, respiration volume, electrocardiography, heart rate, and blood pressure.11 The main aim of our study was assessing the pharmacokinetic properties of TTAC-0001 following IV administration to BALB/c mice, Sprague Dawley rats, and cynomolgus monkeys. Plasma clearance, volume of distribution, and t1/2 estimates were scaled by simple allometry. The lowest mean time to reach a maximum plasma concentration (Tmax) value of 0.25 h was observed in mice, while the highest value of 2.0 h was observed in monkeys. The highest dose-normalized AUC was observed for mice, which by approximation was 2.8-fold greater than the AUC of rats, which showed the lowest dose-normalized AUC. This observed species-specific difference in the dose-normalized AUC may have been due to differences in tissue binding.
Interspecies allometric scaling is a common method of predicting human pharmacokinetics necessary for dose selection in first-in-human studies. Mahmood and Balian reported that three or more preclinical species are adequate for reliable scaling by allometry.20 In addition, allometric scaling has been applied successfully with several antibodies.21 In the current study, we utilized estimates from three different species. Allometric exponents generally range from 0–1, but in some cases may be higher12,15 or even negative.19
The simple allometric exponent for the clearance of TTAC-0001 in the present study was 1.0323, which is different from the mechanistically similar drug rhuMAb VEGF.19 Alternatively, compared to the values of other antibody-derived drugs predicted by allometry, scaling has not been useful for bevacizumab, which has a reported CL, volume of distribution, and t1/2 of 0.21 mL/h, 0.077 L, and 0.053 h, respectively. Indeed, while the predicted value of bevacizumab clearance is 2.4 mL/day, the observed value in humans is 4.3 mL/day. Returning to TTAC-0001, allometry analysis gave a predicted value of 102.45 mL/h, while the observed value in humans was half of this value. However, we applied a correction by multiplying CL by MLP, which we considered may improve the human CL determination. The MLP-corrected CL value was 72.92 mL/h, which closely approximated the corresponding observed values. Based on the rule of exponents, the clearance using MLP-corrected allometric scaling is preferred. We considered both values in designing the first-in-human study to prevent the adverse drug events. In the past reports, human clearance was about twofold slower than the corresponding cynomolgus monkey clearance.22 Applying this rule to our study, this gives more accurate predicted value of clearance (0.504 mL/h). The observed clearance per weight was 0.69 mL/(h*kg). We can consider this rule in a future study.
In conclusion, we investigated the pharmacokinetics of TTAC-0001 in mice, rats, and cynomolgus monkeys after IV administration. At the doses studied, TTAC-0001 exhibited dose proportionality in mice and monkeys. The scaled pharmacokinetics of TTAC-0001 reported here was useful for designing first-in-human studies. Allometric scaling in the therapeutic antibody is feasible.
Acknowledgments
This research was partially supported by a grant (NRF-2016R1A6A3A11933380) from the Basic Science Research Program through the National Research Foundation of Korea (NRF) funded by the Ministry of Education, Republic of Korea and the Korea Health Technology R & D Project through the Korea Health Industry Development Institute (KHIDI), funded by the Ministry of Health & Welfare, Republic of Korea (Grant Number: HI17C2372). This research was also partially supported by Korea Drug Development Fund funded by Ministry of Science and ICT, Ministry of Trade, Industry, and Energy, and Ministry of Health and Welfare (KDDF-201210-14), Republic of Korea).
Author contributions
Participated in research design: Weon Sup Lee, Sang Ryeol Shim, Jin-San Yoo, and Sung Kweon Cho. Conducted the study: Sang Ryeol Shim and Seon Young Lee. Performed data analysis: Weon Sup Lee, Jin-San Yoo, and Sung Kweon Cho. Wrote or contributed to the writing of the manuscript: Weon Sup Lee, Jin-San Yoo, and Sung Kweon Cho. All authors contributed toward data analysis, drafting and critically revising the paper and agree to be accountable for all aspects of the work.
Disclosure
The authors have no conflicts of interest to declare.
References
Folkman J. Angiogenesis in cancer, vascular, rheumatoid and other disease. Nat Med. 1995;1(1):27–31. | ||
Carmeliet P. Angiogenesis in life, disease and medicine. Nature. 2005;438(7070):932–936. | ||
Ferrara N, Kerbel RS. Angiogenesis as a therapeutic target. Nature. 2005;438(7070):967–974. | ||
Blume Jensen P, Hunter T. Oncogenic kinase signalling. Nature. 2001;411(6835):355–365. | ||
Ferrara N, Gerber HP. The role of vascular endothelial growth factor in angiogenesis. Acta Haematol. 2001;106(4):148–156. | ||
Botelho F, Pina F, Lunet N. VEGF and prostatic cancer: a systematic review. Eur J Cancer Prev. 2010;19(5):385–392. | ||
Gerber H, Ferrara N. Pharmacology and pharmacodynamics of bevacizumab as monotherapy or in combination with cytotoxic therapy in preclinical studies. Cancer Res. 2005;65(3):671–680. | ||
Ferrara N. VEGF: an update on biological and therapeutic aspects. Curr Opin Biotechnol. 2000;11(6):617–624. | ||
Jussila L, Alitalo K. Vascular growth factors and lymphangiogenesis. Physiol Rev. 2002;82(3):673–700. | ||
Karkkainen MJ, Mäkinen T, Alitalo K. Lymphatic endothelium: a new frontier of metastasis research. Nat Cell Biol. 2002;4(1):E2–E5. | ||
Lee SH. Tanibirumab (TTAC0001): a fully human monoclonal antibody targets vascular endothelial growth factor receptor 2 (VEGFR-2). Arch Pharm Res. 2011;34(8):1223–1226. | ||
Cheng A, Kang Y, Chen Z, et al. Efficacy and safety of sorafenib in patients in the Asia-Pacific region with advanced hepatocellular carcinoma: a phase III randomised, double-blind, placebo-controlled trial. Lancet Oncol. 2009;10(1):25–34. | ||
Castellano D, Maroto JP, Espinosa E, et al. Experience with Sunitinib in metastatic renal cell carcinoma (mRCC) patients: pooled analysis from 3 Spanish observational prospective studies. Expert Opin Drug Saf. Epub 2017 Aug 28. | ||
Tabernero J, Yoshino T, Cohn AL, et al. Ramucirumab versus placebo in combination with second-line FOLFIRI in patients with metastatic colorectal carcinoma that progressed during or after first-line therapy with bevacizumab, oxaliplatin, and a fluoropyrimidine (RAISE): a randomised, double-blind, multicentre, phase 3 study. Lancet Oncol. 2015;16(5):499–508. | ||
van der Woude SO, van Laarhoven HW. Acute hypertension during ramucirumab infusion in two patients with advanced oesophagogastric cancer. BMJ Case Rep. Epub 2016 Aug 18. | ||
Ritschel WA, Vachharajani NN, Johnson RD, Hussain AS. The allometric approach for interspecies scaling of pharmacokinetic parameters. Comp Biochem Physiol C. 1992;103(2):249–253. | ||
Lee SJ, Lee SY, Lee WS, et al. Phase I trial and pharmacokinetic study of tanibirumab, a fully human monoclonal antibody to vascular endothelial growth factor receptor 2, in patients with refractory solid tumors. Invest New Drugs. 2017;35(6)782–790. | ||
Boxenbaum H. Interspecies scaling, allometry, physiological time, and the ground plan of pharmacokinetics. J Pharmacokinet Biopharm. 1982;10(2):201–227. | ||
Lin YS, Nguyen C, Mendoza JL, et al. Preclinical pharmacokinetics, interspecies scaling, and tissue distribution of a humanized monoclonal antibody against vascular endothelial growth factor. J Pharmacol Exp Ther. 1999;288(1):371–378. | ||
Mahmood I, Balian JD. Interspecies scaling: predicting clearance of drugs in humans. Three different approaches. Xenobiotica. 1996;26(9):887–895. | ||
Mordenti J, Chen SA, Moore JA, Ferraiolo BL, Green JD. Interspecies scaling of clearance and volume of distribution data for five therapeutic proteins. Pharm Res. 1991;8(11):1351–1359. | ||
Hotzel I, Theil FP, Bernstein LJ, et al. A strategy for risk mitigation of antibodies with fast clearance. MAbs. 2012;4(6):753–760. |
 © 2018 The Author(s). This work is published and licensed by Dove Medical Press Limited. The
full terms of this license are available at https://www.dovepress.com/terms
and incorporate the Creative Commons Attribution
- Non Commercial (unported, 3.0) License.
By accessing the work you hereby accept the Terms. Non-commercial uses of the work are permitted
without any further permission from Dove Medical Press Limited, provided the work is properly
attributed. For permission for commercial use of this work, please see paragraphs 4.2 and 5 of our Terms.
© 2018 The Author(s). This work is published and licensed by Dove Medical Press Limited. The
full terms of this license are available at https://www.dovepress.com/terms
and incorporate the Creative Commons Attribution
- Non Commercial (unported, 3.0) License.
By accessing the work you hereby accept the Terms. Non-commercial uses of the work are permitted
without any further permission from Dove Medical Press Limited, provided the work is properly
attributed. For permission for commercial use of this work, please see paragraphs 4.2 and 5 of our Terms.