Back to Journals » Neuropsychiatric Disease and Treatment » Volume 17
Power Spectral Changes of Quantitative EEG in the Subjective Cognitive Decline: Comparison of Community Normal Control Groups
Authors Jeong HT ![]() , Youn YC
, Youn YC ![]() , Sung HH
, Sung HH ![]() , Kim SY
, Kim SY ![]()
Received 27 May 2021
Accepted for publication 6 August 2021
Published 24 August 2021 Volume 2021:17 Pages 2783—2790
DOI https://doi.org/10.2147/NDT.S320130
Checked for plagiarism Yes
Review by Single anonymous peer review
Peer reviewer comments 2
Editor who approved publication: Professor Taro Kishi
Ho Tae Jeong,1 Young Chul Youn,1 Hyun-Ho Sung,2 Sang Yun Kim3
1Department of Neurology, Chung-Ang University of College of Medicine, Seoul, Korea; 2Department of Clinical Laboratory Science, Dongnam Health University, Suwon, Korea; 3Department of Neurology, Seoul National University Bundang Hospital, Seoul National University College of Medicine, Seongnam, Korea
Correspondence: Young Chul Youn
Department of Neurology, Chung-Ang University College of Medicine, 102, Heukseok-ro, Dongjak-gu, Seoul, 06973, Korea
Tel +82 2 6299 1485
Fax +82 2 6299 1493
Email [email protected]
Purpose: The purpose of this study is to compare and analyze the power spectral changes between subjective cognitive decline (SCD) subjects and normal controls (NC) while checking the preclinical stage of AD in the SCD subjects and to use the derived data for biomarker research that can diagnose early-stage AD in the future.
Methods: We recruited 23 SCD patients and 23 normal control subjects and QEEG analysis including power spectral density (PSD) and source-level analysis were performed. An automated preprocessing procedure and statistical analysis were performed by iSync Brain® (iMediSync Inc., Republic of Korea) (https://isyncbrain.com/) using the international standard 10– 20 system (19 electrodes).
Results: Absolute PSD, there was no statistically significant difference in all of the EEG power measurements of the 19 channels. In the relative PSD analysis, the average delta band power of the SCD group was significantly higher in Fp2, F4, and F8 than NC. Alpha1 band power of the O1 channel was 22.56± 16.05 for the SCD group and 33.19± 19.05 for the NC (p-value < 0.05). Source-level analysis did not show a statistically significant difference.
Conclusion: SCD subjects showed a partial increase of delta waves in the frontal lobe region and a partial decrease in alpha1, a fast wave in the occipital region, compared to the NC. SCD is considered one of the earliest clinical symptoms of AD and it is predicted to be related to minor nerve damage. We were able to observe the power spectral changes in SCD subjects in this cross-sectional study, a large number of subjects and longitudinal studies are needed to evaluate their predictability for future deterioration such as conversion to MCI.
Keywords: Alzheimer, cognitive impairment, dementia, hypertension
Introduction
Subjective cognitive decline (SCD) is defined normally by standardized neuropsychological tests, but there is often a self-perception of worsening or more frequent confusion or memory loss for the individual.1 An aging society where diversification and complexity coexist is increasing the frequency of humans experiencing forgetfulness. Nowadays, people are increasingly aware that the main symptom of dementia is a problem related to memory, so the number of patients visiting hospitals is increasing and the rate of concern over SCD is also increasing.2–4
SCD was first described for the evaluation of degenerative dementia in 1982, and has been referred to as various expressions such as subjective cognitive impairment, subjective memory impairment, subjective memory decline, and subjective memory failure. In standardized neuropsychological tests, SCD is characterized by normal performance unlike Mild Cognitive Impairment (MCI), but the optimal approach, such as having standardized criteria for diagnosis, has hardly been known. However, the number of cases that appear as the first progenitor symptom in Alzheimer’s disease (AD) has been increasing recently, and that is receiving great attention from academia and in clinical practice.1,5–9
In previous studies on SCD, low hippocampal volume, brain structural changes such as white matter changes, reduction in memory of future plans, and the presence or absence of apolipoprotein E (APOE) ε4 were reported to be associated with SCD.10–13 However, it is true that standardized criteria or biomarkers for discriminating SCD diagnosis, such as results due to emotional changes such as depression or anxiety disorders, are still insufficient.14,15
The conventional electroencephalography (EEG) test is a biological marker of brain function, and unlike other imaging tests, it has excellent temporal resolution, is non-invasive, is easy to measure, and is economical. However, it has difficulty diagnosing cognitive dysfunction and neurodegenerative diseases due to lack of objectivity because it relies only on the visual judgment of an EEG expert. These shortcomings have been supplemented by techniques such as extracting specific parameters by analyzing data of continuous variables with Quantitative EEG (QEEG), and now, studies on evaluating brain function, and early diagnosis of degenerative brain disorders, such as AD and AD-MCI are actively progressing.16–18 Power spectrum, which is one method in the analysis of QEEG signals, is a well-established core part of a general method used in clinical research. The most frequently observed spectral change so far is presumed to be related to the degree of cognitive decline due to the increase in the slow wave of EEG.19,20 However, little is known about the change in the power spectrum of SCD, which is thought to be the earliest stage of cognitive decline.
Understanding the electrophysiological characteristics of SCD subjects is expected to receive great social support as it helps in early differential diagnosis and is a relatively low cost and non-invasive method. Therefore, the purpose of this study is to compare and analyze the power spectrum differences between SCD subjects and normal controls and use them as basic information for biomarker research that can diagnose early-stage AD in the future.
Materials and Methods
This study was conducted in accordance with the Declaration of Helsinki and approved by the institutional review board of Chung-Ang University Hospital (IRB number 1802-004-16143). Written informed consent was obtained from all participants. The subjects of this study were 23 SCD patients (19 women and 4 men) and 23 normal control subjects (16 women) through medical record review of subjects who visited the memory impairment clinic at Chung-Ang University Hospital from January 1, 2014 to December 31, 2017 and 7 men were selected.
Evidence of brain disease, psychosis, epilepsy, or stroke on Magnetic Resonance Imaging (MRI) that is considered to cause cognitive impairment, drug addiction within the last 10 years, or history of alcoholism (drinking 3 or more a daily) were excluded. The selection criteria of the normal control group were suitable for the 28 normal elderly criteria of Christensen et al, and has a Korean Mini-Mental State Examination (K-MMSE) score of −1 SD (standard deviation) or higher, Korean-Instrumental Activities of Daily Living (K-IADL) was set to 0.42 or less, and Korean Dementia Screening Questionnaire (KDSQ) was set to 6 points or less.21–23 the criteria for SCD subjects were complaining of memory impairment, but were less than −1 SD in the reference mean value considering age and education in all cognitive function areas of SNSB (Seoul Neuropsychological Screening Battery), and non-dementia state as a result of DSM-IV (diagnostic and statistical manual of mental disorder, 4th edition) by the American Psychiatric Association.22–27 SNSB is a test developed in Korea to comprehensively evaluate various cognitive functions. A comprehensive and in-depth assessment of cognitive functions such as attention, language and related function, visuospatial function, memory, and frontal/executive function will be conducted (Supplementary Table 1). All diagnoses were performed by a neurologist based on neuropsychological examination and criteria.28
Resting-state EEG was conducted using the international standard 10–20 system (19 electrodes: Fp1, Fp2, F7, F3, Fz, F4, F8, T3, C3, Cz, C4, T4, T5, P3, Pz, P4, T6, O1, O2) and a digital electroencephalograph (Comet AS40 amplifier EEG GRASS; Telefactor, USA), and all electrodes were referred to linked ear references (Supplementary Figure 1).29,30 Electrode skin impedance was always below 5 kΩ. The EEG signal was analog-filtered with a band pass of 0.5–70 Hz and digitized and stored in magnetic disks for further analysis. EEG sampling was conducted for more than 15 minutes with eyes open for 30 s and with eyes closed for 30 s, 10 times, at a rate of 200 Hz. While resting-state EEG data was recorded, patients were lying down in a resting position in a sound-attenuated room. EEG noise preprocessing and group analyses were conducted using iSyncBrain®, v.1.0, 2018 (iMediSync Inc., Republic of Korea) (https://isyncbrain.com/), a cloud-based, artificial intelligence EEG analysis platform. The eyes-closed EEG segments were uploaded to iSyncBrain®. The EEG data uploaded by the user is automatically preprocessed and converted into a cleaned EEG from which noise has been removed by visual inspection and based on this, it generates key index values of QEEG and provides an analysis function between the selected comparison groups. In the detailed pre-processing process, band pass filtering is performed in the 1~45.5Hz section to check the delta-gamma region used for main EEG analysis, and a 60Hz notch filter is applied to additionally remove the noise from the power supply. After that, after applying the common average reference to remove the noise mixed throughout the measurement data, the process of removing the artifact components generated from the subject using bad epoch rejection and adaptive mixture independent component analysis (amICA) is performed to make clean EEG (Figure 1).31,32 At the sensor level, relative power at eight frequency bands (delta [1–3.99 Hz], theta [4–7.99 Hz], alpha1 [8–9.99 Hz], alpha2 [10–11.99 Hz], beta1 [12–14.99 Hz], beta2 [15–19.99 Hz], beta3 [20–29.99 Hz], and gamma [30–44.99 Hz]) was calculated using a power spectrum analysis. In the source-level analysis, the current distribution across the brain was assessed using the standardized low-resolution brain electromagnetic tomography technique,33,34 to compare relative power values in 64 regions of interests (ROIs) and the connectivity (the imaginary part of coherency) between ROIs.
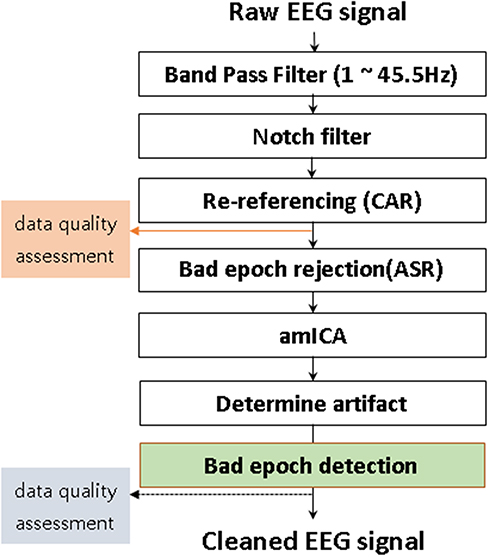 |
Figure 1 Pre-processing and artifact removal. Abbreviations: CAR, common average reference; ASR, artifact subspace reconstruction. |
Statistical Analysis
To compare demographic and cognitive assessment results between groups, Student’s t-tests for continuous variables and Chi-square test for gender difference were performed with IBM SPSS version 25 (IBM, Armonk, NY, USA). Group analysis to compare the SCD and Normal groups was performed using the Kolmogorov–Smirnov test (KS) or the Shapiro–Wilk test (SW) for normality, and if normality was satisfied, an independent t-test was used. Statistical significance was set at p < 0.05. All statistical processes for QEEG features were implanted in iSyncBrain® (iMediSync Inc., Seoul, Republic of Korea).
Results
The subjects of this study were 23 normal control subjects and 23 SCD subjects for a total of 46 subjects who satisfied the selection criteria. The average age of the normal control group was 72.02±3.13 years old, 16 females and 7 males, and the average age of SCD group 72.14±5.37 years, 19 females and 4 males. Demographic figures are presented in Table 1. In the sensor level of power spectral density (PSD) analysis, there was no statistically significant difference in all of the absolute power measured in 19 channels and the comparison analysis for each of the 8 bands were divided into 5 brain regions. In the relative PSD analysis, the average delta band power of the SCD group was significantly higher in Fp2, F4, and F8 than NC. In other channels, the average value of the SCD group was relatively higher than that of the normal control group, but it was not statistically significant (Table 2). The regional analysis showed that the delta band power in the frontal region was 0.24±0.09 of the SCD and 0.19±0.07 of the NC, which was significantly higher than in the SCD (p-value <0.05). The delta band in the other regions of the SCD group was higher, but not significant (Table 3). The topomap showed an overall increase in the bilateral frontal region of the delta band in the SCD group (Figure 2). There were no differences of the theta band power between the two groups in the channels and brain regions. Alpha1 band power of the O1 channel was 22.56±16.05 of the SCD group and 33.19±19.05 of the NC (p-value <0.05) (Table 4). Alpha 1 band of the occipital regions was 0.24±0.17 of the SCD and 0.33±0.19 of NC (p-value = 0.053) (Table 5). By topomap, an overall decrease in the occipital lobe region of the alpha 1 band was confirmed in the SCD group (Figure 3). There was no statistical difference in relative power of alpha2, beta1, beta2, and gamma band between the two groups in each channel and the entire brain region. Source-level analysis did not observe a statistically significant difference between the SCD and control groups for the source power of ROIs and the connectivity.
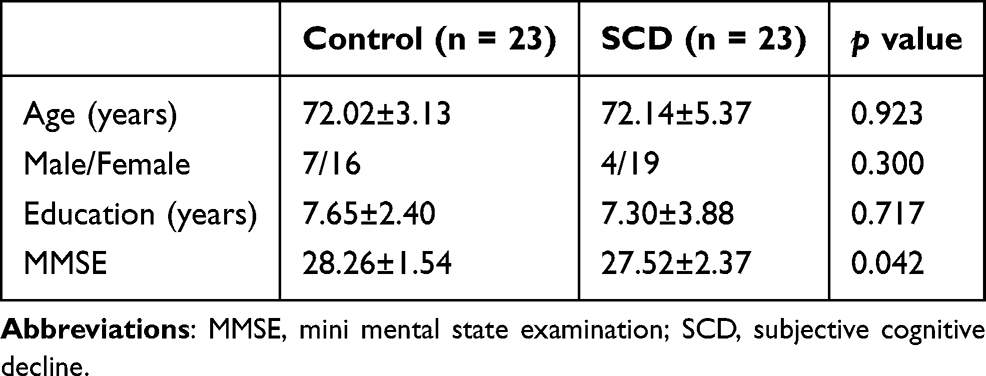 |
Table 1 Demographic Characteristics |
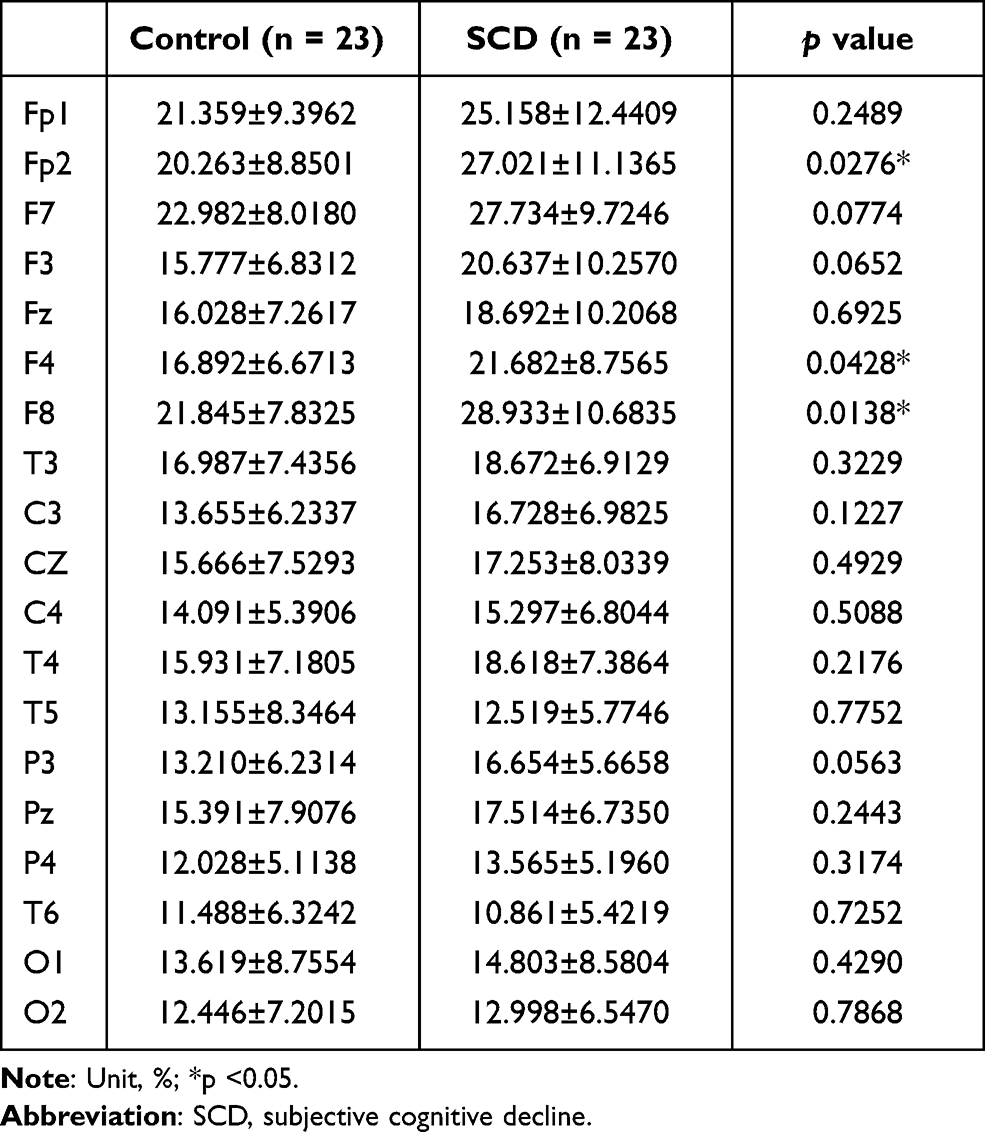 |
Table 2 Relative Power of Delta Frequency According to 19 Electrode Channels |
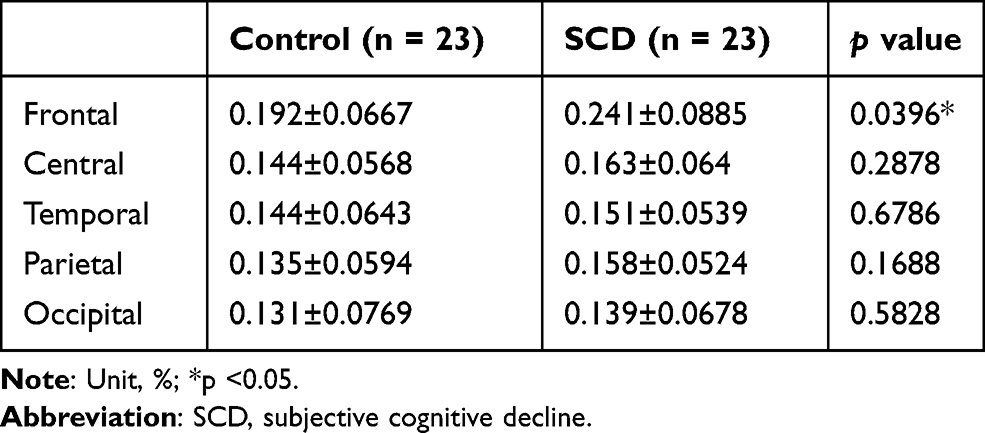 |
Table 3 Relative Power of Delta Frequency Band According to the Brain Region |
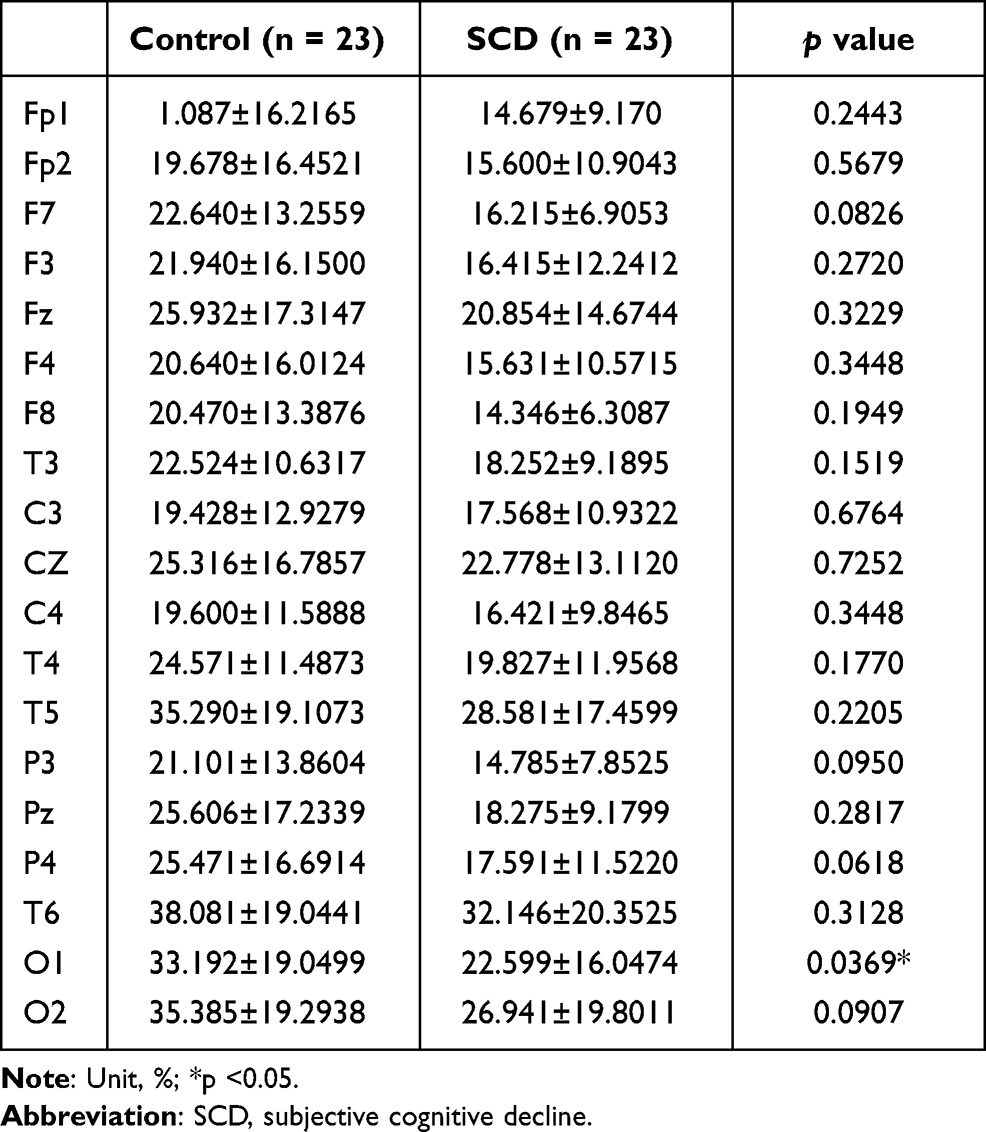 |
Table 4 Relative Power of Alpha 1 Frequency According to 19 Electrode Channels |
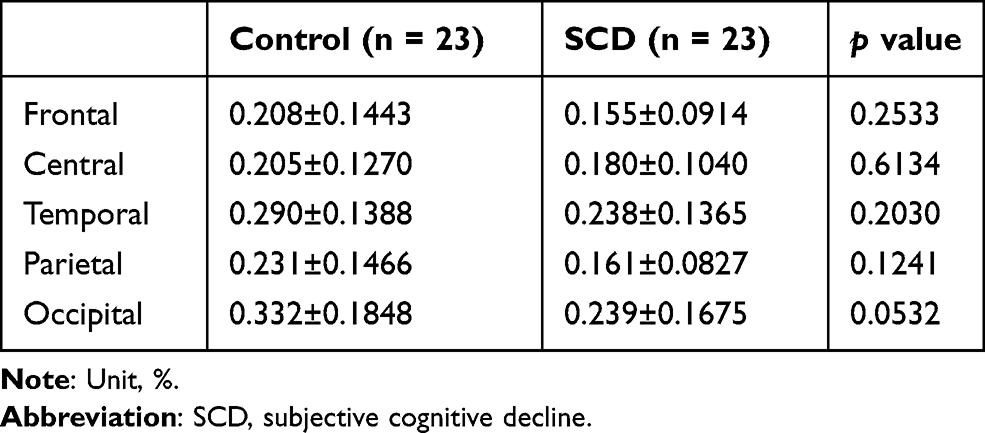 |
Table 5 Relative Power of Alpha 1 Frequency Band According to the Brain Region |
 |
Figure 2 Topomap relative power - delta band (relative power differences between SCD (G2) and control (G1)). Note: Unit: Percentage (%). |
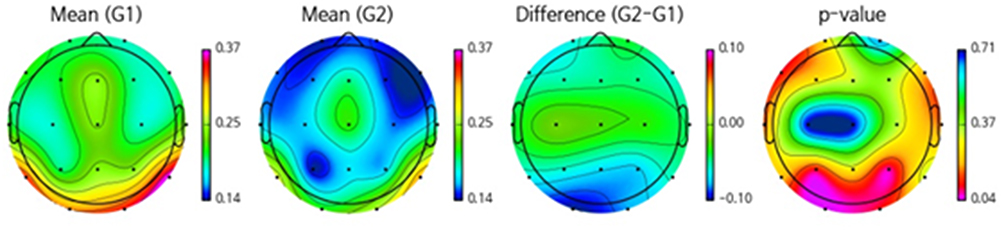 |
Figure 3 Topomap relative power - alpha 1 band (relative power differences between SCD (G2) and control (G1)). Note: Unit: Percentage (%). |
Discussion
In this study, we tried to find the difference in power spectrum between SCD subjects and community-based normal control groups, because SCDs showing normal performance in standardized neuropsychological tests have insufficient criteria or predetermined biomarkers for clinical or study purposes, and the electrophysiological characteristics of the SCD are not well known. We finally found an increase in slow wave delta waves in the frontal lobe and a decrease in the fast wave alpha 1 waves in the occipital lobe. SCD subjects showed a partial increase in delta waves in the frontal lobe region and a partial decrease in alpha1, a fast wave in the occipital region, compared to the NC. Quantitative studies to date have shown that AD slows EEG signaling as the disease progresses, and shows a significant decrease in the alpha band and an increase in the slow wave. Moreover, it has been shown that different frequency bands correlate the severity of cognitive impairment with the amount of power.35 As can be seen from our results, we were able to confirm the difference between power spectrum changes due to aging and SCD when compared with community elders, and it was estimated that SCD exists in the MCI and AD extension lines.
These results are similar to previous studies showing increased slow waves and decreased fast waves in AD and MCI.36–38 The powers of the delta and theta waves were significantly higher than that of healthy subjects in the same age group.39,40 In recent studies, the increase in slow waves and decrease in fast waves were suggested as the QEEG pattern of AD patients. In particular, an increase in theta waves and a decrease in the high-frequency band in the temporal lobe were remarkable. In recent studies, the increase in slow waves and decrease in fast waves were suggested as the power spectrum pattern of AD patients. In particular, an increase in theta waves and a decrease in the high-frequency band in the temporal lobe were remarkable.41–43 in one of the studies on AD related to the MMSE score, the lower the score, the higher the relative power of theta waves was found in the entire hemisphere.44 In the MCI study, progressors’ alpha power decreased to the stable MCI group at a 1-year follow-up, and the decrease in alpha power was greater in the posterior lead of the MCI group.45
SCD can be thought of as the preclinical stage of AD and the power spectral changes would be located on the spectrum of QEEG in MCI or AD, which showed different characteristics from community-based normal subjects in this study. However, there are very few power spectral change studies on the SCD group showing normal performance in all areas through an objective neuropsychological test. SNSB used for SCD diagnosis were standardized considering age and educational background, and normal categories were identified in five cognitive areas in our study and diagnosed by neurologists.
The power spectral changes of the SCD were similar to MCI and AD. However, a relative delta band power increased only in Fp2, F4, and F8, and relative alpha1 band power decreased only in the O1. Also, no statistically significant change in connectivity was found in the analysis at the source level. It is because SCD is considered to be one of the earlier stages of AD, and thought to be a compensable cognitive impairment with minor neuronal damage.46
Our findings have some limitations to consider. SNSB, a standardized neuropsychological test tool used in our study, is a comprehensive neuropsychological test suite developed for the purpose of evaluating MCI and AD. It consists of various subtests for various cognitive functions, but due to the long test duration and somewhat burdensome test cost, the rate of cancellations by SCD subjects was high, which led to a lack of subjects and could have involved more severe SCD subjects who were worried about memory decline.
Although we were able to observe power spectral changes in SCD subjects in this cross-sectional study, longitudinal studies are needed to evaluate the predictability of future deterioration such as conversion to MCI.47
Conclusion
Understanding the electrophysiological characteristics of SCD subjects is expected to receive great social support as it helps in early differential diagnosis while being a relatively low cost and non-invasive method. Therefore, the purpose of this study is to compare and analyze the power spectral change difference between SCD subjects and normal controls and use them as basic information for biomarker research that can diagnose early-stage AD in the future.
SCD subjects showed a partial increase of delta waves in the frontal lobe region and a partial decrease in alpha1, a fast wave in the occipital region, compared to the NC. SCD is considered one of the earliest clinical stages of AD and is predicted to be related to minor nerve damage. We were able to observe power spectral changes in SCD subjects in this cross-sectional study, a large number of subjects and longitudinal studies are needed to evaluate their predictability for future deterioration such as conversion to MCI.
Acknowledgments
This research funded by the Korean Dementia Association, Republic of Korea.
Disclosure
The authors report no conflicts of interest in this work.
References
1. Hong YJ, Lee J-H. Subjective cognitive decline and alzheimer’s disease spectrum disorder. Dementia Neurocogn Disord. 2017;16(2):40–47. doi:10.12779/dnd.2017.16.2.40
2. Tobiansky R, Blizard R, Livingston G, Mann A. The Gospel Oak Study stage IV: the clinical relevance of subjective memory impairment in older people. Psychol Med. 1995;25(4):779–786. doi:10.1017/S0033291700035029
3. Kim JM, Shin IS, Kim LJ, Yoon JS, Lee HY. Subjective memory impairment, cognitive function, and depression: a cross-sectional study in a community dwelling elderly population. J Korean Neuropsychiatr Assoc. 2002;41(4):706–712.
4. Park MH, Min JY, Min HY, Lee HJ, Lee DH, Song MS. Subjective memory complaints and clinical characteristics in elderly Koreans: a questionnaire survey. Int J Nurs Stud. 2007;44(8):1400–1405. doi:10.1016/j.ijnurstu.2006.06.001
5. Reisberg B, Ferris SH, de Leon MJ, Crook T. The Global Deterioration Scale for assessment of primary degenerative dementia. Am J Psychiatry. 1982;139(9):1136–1139.
6. Jorm AF, Christensen H, Korten A, Jacomb P, Henderson AS. Memory complaints as a precursor of memory impairment in older people: a longitudinal analysis over 7–8 years. Psychol Med. 2001;31(3):441–449. doi:10.1017/S0033291701003245
7. Wang L, Van Belle G, Crane PK, et al. Subjective memory deterioration and future dementia in people aged 65 and older. J Am Geriatr Soc. 2004;52(12):2045–2051. doi:10.1111/j.1532-5415.2004.52568.x
8. Treves T, Verchovsky R, Klimovitzky S, Korczyn A. Incidence of dementia in patients with subjective memory complaints. Int Psychogeriatr. 2005;17(2):265–273. doi:10.1017/S1041610205001596
9. Jessen F, Amariglio RE, Van Boxtel M, et al. A conceptual framework for research on subjective cognitive decline in preclinical Alzheimer’s disease. Alzheimers Dement. 2014;10(6):844–852. doi:10.1016/j.jalz.2014.01.001
10. Mosconi L, De Santi S, Brys M, et al. Hypometabolism and altered cerebrospinal fluid markers in normal apolipoprotein E E4 carriers with subjective memory complaints. Biol Psychiatry. 2008;63(6):609–618. doi:10.1016/j.biopsych.2007.05.030
11. Van Norden A, Fick W, De Laat K, et al. Subjective cognitive failures and hippocampal volume in elderly with white matter lesions. Neurology. 2008;71(15):1152–1159. doi:10.1212/01.wnl.0000327564.44819.49
12. Selnes P, Fjell AM, Gjerstad L, et al. White matter imaging changes in subjective and mild cognitive impairment. Alzheimers Dement. 2012;8(5):S112–S121. doi:10.1016/j.jalz.2011.07.001
13. Rabin LA, Chi SY, Wang C, Fogel J, Kann SJ, Aronov A. Prospective memory on a novel clinical task in older adults with mild cognitive impairment and subjective cognitive decline. Neuropsychol Rehabil. 2014;24(6):868–893. doi:10.1080/09602011.2014.915855
14. Derouesné C, Lacomblez L, Thibault S, Leponcin M. Memory complaints in young and elderly subjects. Int J Geriatr Psychiatry. 1999;14(4):291–301. doi:10.1002/(SICI)1099-1166(199904)14:4<291::AID-GPS902>3.0.CO;2-7
15. Balash Y, Mordechovich M, Shabtai H, Merims D, Giladi N. Subjective memory decline in healthy community‐dwelling elders. What does this complain mean? Acta Neurol Scand. 2010;121(3):194–197. doi:10.1111/j.1600-0404.2009.01159.x
16. Al-Qazzaz NK, Ali SHB, Ahmad SA, Chellappan K, Islam M, Escudero J. Role of EEG as biomarker in the early detection and classification of dementia. Sci World J. 2014;2014:1–16. doi:10.1155/2014/906038
17. Cassani R, Estarellas M, San-Martin R, Fraga FJ, Falk TH. Systematic review on resting-state EEG for Alzheimer’s disease diagnosis and progression assessment. Dis Markers. 2018;2018:1–26. doi:10.1155/2018/5174815
18. Smailovic U, Koenig T, Kåreholt I, et al. Quantitative EEG power and synchronization correlate with Alzheimer’s disease CSF biomarkers. Neurobiol Aging. 2018;63:88–95. doi:10.1016/j.neurobiolaging.2017.11.005
19. Czigler B, Csikós D, Hidasi Z, et al. Quantitative EEG in early Alzheimer’s disease patients—power spectrum and complexity features. Int J Psychophysiol. 2008;68(1):75–80. doi:10.1016/j.ijpsycho.2007.11.002
20. Ya M, Xun W, Wei L, Ting H, Hong Y, Yuan Z. Is the electroencephalogram power spectrum valuable for diagnosis of the elderly with cognitive impairment? Int J Gerontol. 2015;9(4):196–200. doi:10.1016/j.ijge.2014.07.001
21. Christensen KJ, Multhaup KS, Nordstrom S, Voss K. A cognitive battery for dementia: development and measurement characteristics. Psycholog Assess. 1991;3(2):168. doi:10.1037/1040-3590.3.2.168
22. Kang SJ, Choi S-H, Lee BH, et al. The reliability and validity of the Korean Instrumental Activities of Daily Living (K-IADL). J Korean Neurol Assoc. 2002;20(1):8–14.
23. Yang D-W, Cho B-L, Chey J-Y, Kim S-Y, Kim B-S. The development and validation of Korean Dementia Screening Questionnaire (KDSQ). J Korean Neurol Assoc. 2002;20(2):11–12.
24. American Psychiatric Association. Diagnostic and Statistical Manual of Mental Disorders: DSM-IV-TR. Washington, DC: American Psychiatric Association; 2000.
25. Petersen RC, Doody R, Kurz A, et al. Current concepts in mild cognitive impairment. Arch Neurol. 2001;58(12):1985–1992. doi:10.1001/archneur.58.12.1985
26. Ahn H-J, Chin J, Park A, et al. Seoul Neuropsychological Screening Battery-dementia version (SNSB-D): a useful tool for assessing and monitoring cognitive impairments in dementia patients. J Korean Med Sci. 2010;25(7):1071–1076. doi:10.3346/jkms.2010.25.7.1071
27. Hong YJ, Yoon B, Shim YS, et al. Predictors of clinical progression of subjective memory impairment in elderly subjects: data from the Clinical Research Centers for Dementia of South Korea (CREDOS). Dement Geriatr Cogn Disord. 2015;40(3–4):158–165. doi:10.1159/000430807
28. Kang Y, Na D. Seoul Neuropsychological Screening Battery (SNSB). Seoul, Korea: Human Brain Research & Consulting Co.; 2003.
29. Gouw AA, Alsema AM, Tijms BM, et al. EEG spectral analysis as a putative early prognostic biomarker in nondemented, amyloid positive subjects. Neurobiol Aging. 2017;57:133–142. doi:10.1016/j.neurobiolaging.2017.05.017
30. Shim YS, Shin H-E. Analysis of neuropsychiatric symptoms in patients with Alzheimer’s disease using quantitative EEG and sLORETA. Neurodegener Dis. 2020;20(1):12–19. doi:10.1159/000508130
31. Lakshmi MR, Prasad T, Prakash DVC. Survey on EEG signal processing methods. Int J Adv Res Comp Sci Softw Eng. 2014;4(1).
32. Jiang X, Bian G-B, Tian Z. Removal of artifacts from EEG signals: a review. Sensors. 2019;19(5):987. doi:10.3390/s19050987
33. Pascual-Marqui RD. Standardized low-resolution brain electromagnetic tomography (sLORETA): technical details. Methods Find Exp Clin Pharmacol. 2002;24(SupplD):5–12.
34. Han S-H, Pyun J-M, Yeo S, et al. Differences between memory encoding and retrieval failure in mild cognitive impairment: results from quantitative electroencephalography and magnetic resonance volumetry. Alzheimers Res Ther. 2021;13(1):1–11.
35. Wang R, Wang J, Yu H, Wei X, Yang C, Deng B. Power spectral density and coherence analysis of Alzheimer’s EEG. Cogn Neurodyn. 2015;9(3):291–304. doi:10.1007/s11571-014-9325-x
36. Coben LA, Danziger W, Storandt M. A longitudinal EEG study of mild senile dementia of Alzheimer type: changes at 1 year and at 2.5 years. Electroencephalogr Clin Neurophysiol. 1985;61(2):101–112. doi:10.1016/0013-4694(85)91048-X
37. Soininen H, Partanen J, Laulumaa V, Helkala E-L, Laakso M, Riekkinen P. Longitudinal EEG spectral analysis in early stage of Alzheimer’s disease. Electroencephalogr Clin Neurophysiol. 1989;72(4):290–297. doi:10.1016/0013-4694(89)90064-3
38. Jelic V, Johansson S, Almkvist O, et al. Quantitative electroencephalography in mild cognitive impairment: longitudinal changes and possible prediction of Alzheimer’s disease. Neurobiol Aging. 2000;21(4):533–540. doi:10.1016/S0197-4580(00)00153-6
39. Prichep LS, John ER, Ferris SH, et al. Quantitative EEG correlates of cognitive deterioration in the elderly. Neurobiol Aging. 1994;15(1):85–90. doi:10.1016/0197-4580(94)90147-3
40. Chiaramonti R, Muscas GC, Paganini M, et al. Correlations of topographical EEG features with clinical severity in mild and moderate dementia of Alzheimer type. Neuropsychobiology. 1997;36(3):153–158. doi:10.1159/000119375
41. Deslandes A, Veiga H, Cagy M, Fiszman A, Piedade R, Ribeiro P. Quantitative electroencephalography (qEEG) to discriminate primary degenerative dementia from major depressive disorder (depression). Arq Neuropsiquiatr. 2004;62(1):44–50. doi:10.1590/S0004-282X2004000100008
42. Anghinah R, Kanda PAM, Lopes HF, et al. Alzheimer’s disease qEEG spectral analysis versus coherence. Which is the best measurement? Arq Neuropsiquiatr. 2011;69(6):871–874. doi:10.1590/S0004-282X2011000700004
43. Musaeus CS, Engedal K, Hogh P, et al. EEG theta power is an early marker of cognitive decline in dementia due to Alzheimer’s disease. J Alzheimers Dis. 2018;64(4):1359–1371. doi:10.3233/JAD-180300
44. Leuchter AF, Cook IA, Newton TF, et al. Regional differences in brain electrical activity in dementia: use of spectral power and spectral ratio measures. Electroencephalogr Clin Neurophysiol. 1993;87(6):385–393. doi:10.1016/0013-4694(93)90152-L
45. Luckhaus C, Grass-Kapanke B, Blaeser I, et al. Quantitative EEG in progressing vs stable mild cognitive impairment (MCI): results of a 1-year follow-up study. Int J Geriatr Psychiatry. 2008;23(11):1148–1155. doi:10.1002/gps.2042
46. Rabin LA, Smart CM, Amariglio RE. Subjective cognitive decline in preclinical Alzheimer’s disease. Annu Rev Clin Psychol. 2017;13:369–396. doi:10.1146/annurev-clinpsy-032816-045136
47. Prichep LS, John ER, Ferris SH, et al. Prediction of longitudinal cognitive decline in normal elderly with subjective complaints using electrophysiological imaging. Neurobiol Aging. 2006;27(3):471–481. doi:10.1016/j.neurobiolaging.2005.07.021
 © 2021 The Author(s). This work is published and licensed by Dove Medical Press Limited. The
full terms of this license are available at https://www.dovepress.com/terms
and incorporate the Creative Commons Attribution
- Non Commercial (unported, 3.0) License.
By accessing the work you hereby accept the Terms. Non-commercial uses of the work are permitted
without any further permission from Dove Medical Press Limited, provided the work is properly
attributed. For permission for commercial use of this work, please see paragraphs 4.2 and 5 of our Terms.
© 2021 The Author(s). This work is published and licensed by Dove Medical Press Limited. The
full terms of this license are available at https://www.dovepress.com/terms
and incorporate the Creative Commons Attribution
- Non Commercial (unported, 3.0) License.
By accessing the work you hereby accept the Terms. Non-commercial uses of the work are permitted
without any further permission from Dove Medical Press Limited, provided the work is properly
attributed. For permission for commercial use of this work, please see paragraphs 4.2 and 5 of our Terms.