Back to Journals » OncoTargets and Therapy » Volume 12
Potential Prognostic and Diagnostic Values of CDC6, CDC45, ORC6 and SNHG7 in Colorectal Cancer
Authors Hu Y, Wang L, Li Z, Wan Z, Shao M, Wu S, Wang G ![]()
Received 21 September 2019
Accepted for publication 18 November 2019
Published 31 December 2019 Volume 2019:12 Pages 11609—11621
DOI https://doi.org/10.2147/OTT.S231941
Checked for plagiarism Yes
Review by Single anonymous peer review
Peer reviewer comments 2
Editor who approved publication: Dr William C. Cho
Yang Hu,1–4,* Liping Wang,5,* Zhixing Li,1–4 Zirui Wan,6 Mingjie Shao,4,7 Shaobin Wu,4,7 Guo Wang1–4
1Department of Clinical Pharmacology, Xiangya Hospital, Central South University, Changsha 410008, People’s Republic of China; 2Institute of Clinical Pharmacology, Central South University, Hunan Key Laboratory of Pharmacogenetics, Changsha 410078, People’s Republic of China; 3Engineering Research Center of Applied Technology of Pharmacogenomics, Ministry of Education, Changsha 410078, People’s Republic of China; 4National Clinical Research Center for Geriatric Disorders, Xiangya Hospital, Central South University, Changsha 410008, Hunan, People’s Republic of China; 5Department of Clinical Oncology, The First People’s Hospital of Chenzhou, Chenzhou 432000, Hunan, People’s Republic of China; 6Department of Pharmacy, Beijing Chao-Yang Hospital, Capital Medical University, Beijing 100020, People’s Republic of China; 7Department of Gastrointestinal Surgery, Xiangya Hospital, Central South University, Changsha 410008, People’s Republic of China
*These authors contributed equally to this work
Correspondence: Shaobin Wu; Mingjie Shao Email [email protected]; [email protected]
Background: Colorectal cancer (CRC) is a common human malignancy. The aims of this study are to investigate the gene expression profile of CRC and to explore potential strategy for CRC diagnosis, therapy and prognosis.
Methods: We use affy and Limma package of Bioconductor R to do differential expression genes (DEGs) and differential expression lncRNAs (DELs) analysis from the gene datasets (GSE8671, GSE21510, GSE32323, GSE39582 and TCGA) respectively. Then, DEGs were analyzed by GO and KEGG pathway and Kaplan-Meier survival curve and Cox regression analyses were used to find aberrantly expressed genes associated with survival outcome of CRC patients. Real-time PCR assay was used to verify the aberrantly expressed genes expression in CRC samples.
Results: 306 up-regulation and 213 down-regulation common DEGs were found. A total of 485 DELs were identified, of which 241 up-regulated and 244 down-regulated. Then, GO and KEGG pathway analyses showed that DEGs were involved in cell cycle, mineral absorption, DNA replication, and Nitrogen metabolism. Among them, Kaplan-Meier survival curve and Cox regression analyses revealed that CDC6, CDC45, ORC6 and SNHG7 levels were significantly associated with survival outcome of CRC patients. Finally, real-time PCR assay was used to verify that the CDC6, CDC45, ORC6 and SNHG7 expression were up-regulated in 198 CRC samples compared with the expression levels in individual-matched adjacent mucosa samples.
Conclusion: CDC6, CDC45, ORC6 and SNHG7 are implicated in CRC initiation and progression and could be explored as potential diagnosis, therapy and prognosis targets for CRC.
Keywords: colorectal cancer, CRC, CDC6, CDC45, ORC6, SNHG7, prognostic, diagnostic
Background
Colorectal cancer (CRC) is one of the most frequently diagnosed cancer and a leading cause of cancer-related mortality worldwide, with approximately 1.4 million cases and 693,900 deaths in 2012.1 Risk factors for colorectal cancer can be divided into two aspects: Non-modifiable risk factors and Modifiable risk factors.2 Main non-modifiable risk factors are age, sex, ethnicity, family history, hereditary syndrome, prior adenomatous or sessile serrated polyp, inflammatory bowel disease, diabetes mellitus and BRCA mutations.2,3 Unhealthy lifestyles, including consuming red and processed meat, obesity, smoking and alcohol consumption, are main modifiable risk factors.2,4
The stage of the patient at the time of diagnosis is one of the most important factors affecting the prognosis of patients with colorectal cancer. In the United States, localized stage CRC is diagnosed in 39% of patients, for which the 5-year survival rate is 90%. The survival rate declines to 71% and 14% for patients diagnosed with regional and distant-stage disease, respectively.5 Although advances in surgical techniques and adjuvant chemotherapies have improved the clinical outcomes in recent years, the prognosis of advanced-staged patients remains frustrating.6 Therefore, the study of the mechanisms of colorectal cancer is essential. It is urgent to find potential strategy for CRC diagnosis and prognosis.
With the advancement of technologies, genome-wide molecular profiling has been used to screen and identify key genes in several cancer.7,8 In this study, we aimed to identify differentially messenger RNAs (mRNAs) and expressed lncRNAs in CRC by analyzing GEO and TCGA database. 519 common differential expression genes (DEGs) were detected from four GEO datasets and 485 differential expression lncRNAs (DELs) were screened from TCGA. To provide novel information about molecular mechanisms and functional roles of mRNAs, we sent DEGs to DAVID database (https://david.ncifcrf.gov/) to perform the Gene Ontology (GO) and pathway analysis. Further analysis revealed that cell division cycle (CDC) 6, CDC45, origin recognition complex (ORC) 6 and small nucleolar RNA host gene (SNHG) 7 were significantly upregulated in malignant tissues and associated with survival outcome of colorectal cancer patients by Kaplan-Meier survival curve and Cox regression analyses. And we chose these four genes to verify the analysis results in 199 paired colorectal cancer tissues. These results suggest that CDC6, CDC45, ORC6 and SNHG7 might be associated with CRC, and serve as potential strategy for CRC diagnosis and prognosis.
Methods
Colorectal Cancer Datasets
The discovery datasets GSE8671,9 GSE21510,10 GSE3232311 and GSE3958212 were downloaded from the GEO. A total of 738 CRC samples and 93 non-cancer samples were selected from four gene expression datasets (25 normal samples and 123 cancer samples in GSE21510 from Japan, 32 pairs in GSE8671 from Switzerland, 17 pairs in GSE32323 from Japan and 19 normal samples and 566 cancer samples plus clinical information in GSE39582 from France). These gene expression datasets are based on Affymetrix Human Genome U133 Plus 2.0 Array platform (Affymetrix Inc., Santa Clara, CA, USA). The validation dataset plus clinical information was obtained from the TCGA data portal. The dataset included 622 tumor and 51 non-tumor samples. The datasets GSE 39582 and TCGA with information on clinical features were used to perform the correlation analysis and survival analysis.
Identification of DEGs
The raw data of GSE8671, GSE21510, GSE32323, GSE39582 and TCGA were separately preprocessed by affy package of Bioconductor R (http://www.bioconductororg/packages/release/bioc/html/affy.html). Expression values were achieved after background correction, quantile normalization, and the summarization of probe set values into one expression measure.13,14 The DEG analysis between tumor and non-tumor samples of the GSE8671, GSE21510, GSE32323, and GSE39582 datasets and the DELs between tumor and non-tumor of TCGA dataset were performed with the Limma package of Bioconductor R (http://www.bioconductor.org/packages/release/bioc/html/limma.html). The DEGs and DELs were selected under |log2 fold change (FC)| ≥ 1 and P < 0.05 criteria. Visualization of the identified DEGs and DELs including volcano plot and venn diagram was performed with ggplot2 (http://ggplot2.org/) and VennDiagram packages of R, respectively.15
GO and Pathway Enrichment Analysis of DEGs
GO is a framework that provides consistent and structured descriptions of the attributes of genes and gene products for the computational analysis of various biological systems. It covers three aspects of biology: molecular function, biological process and cellular component.16,17 Pathway analysis is a popular method for more detailed and specific analysis of microarray data.18,19 DAVID (Database for Annotation, Visualization and Integrated Discovery) (http://david.abcc.ncifcrf.gov/)20 is a publicly available high-throughput functional annotation tool that aim to provide functional interpretation of large lists of genes derived from genomic studies. DAVID database was used to perform GO function and pathway analysis of the common DEGs,21 using p-Value < 0.05 and count ≥ 2 as cut-off point criteria.
Patients and Tissue Specimens
CRC tissue specimens were obtained from 198 diagnosed CRC patients who underwent resection without preoperative chemotherapy or radiotherapy at Xiangya Hospital between 2014 and 2017. The adjacent mucosa samples were acquired 3–5cm away from the tumor. After excision, tissue samples were immediately frozen in liquid nitrogen and stored at −80°C until RNA extraction. The clinical-pathological data were assembled according to the classification of the National Comprehensive Cancer Network Practice Guidelines for Colon Cancer and Rectal Cancer (Version 2018). The study was approved by the Institutional Review Board of Department of Xiangya Hospital, Central South University (protocol # 2018071040). All patients provided written informed consent and the study was conducted in accordance with the Declaration of Helsinki.
RNA Isolation, Reverse Transcription and Real-Time PCR
Tissue specimens were added with TRIzol reagent (Takara) to extract the total RNA.22 After checking the RNA concentration and quality, 1~4μg of RNA was reverse transcribed into cDNA in a final volume of 20 μL with GoScript 1st Strand complementary DNA Synthesis kit (Promega). Quantitative real-time polymerase chain reaction (qRT-PCR) was performed to detect genes expression by using SYBR Premix Dimer Eraser kit (Takara) on LightCycler® 480 system (Roche Diagnostics) according to the manufacturer’s protocol, and the cycling conditions were as follows: an initial 30 s denaturation at 95°C and 45 cycles (5 s at 95°C, 30 s at 55°C and 30 s at 72°C). The results were normalized to the expression of PPIA and B2M.23 The primer sequences are shown in Supplementary Table 1. The relative expression of CDC6, CDC45, ORC6 and lncRNA SNHG7 was calculated and normalized using the 2−ΔCt method relative to PPIA and B2M.
Statistical Analysis
SPSS version 18.0 (IBM Corporation) was performed to statistical analyses and GraphPad Prism 5.0 software (GraphPad Software Inc) was used for graphing and analysis. The differences between 2 groups were analyzed with the Student’s t-test and χ2 test, as appropriate. P-values less than 0.05 were considered statistically significant. Survival analysis was performed using the Kaplan–Meier method with the log-rank test used to compare the differences between patient groups. The risk association of gene and lncRNA expressions with several known clinicopathological factors was determined using univariate and multivariate Cox regression analysis.
Results
Identification of DEGs and DELs
By applying bioinformatics analysis, we investigated DEGs between CRC and non-cancer samples of the GEO dataset (GSE8671, GSE21510, GSE32323 and GSE39582). Analysis results showed 560 up-regulated and 704 down-regulated DEGs in GSE8671 (Figure 1A), 1817 up-regulated and 1217 down-regulated DEGs in GSE21510 (Figure 1B), 1950 up-regulated and 518 down-regulated DEGs in GSE32323 (Figure 1C), and 1332 up-regulated and 785 down-regulated DEGs in GSE39582 (Figure 1D). Further analysis revealed 519 common DEGs in the four datasets, consisting of 306 up-regulated and 213 down-regulated genes (Figure 1E and F). Next, we investigated the DELs between 622 CRC and 55 normal samples of the TCGA RNA-seq dataset. Based on the cut-off point (p-Value < 0.05 and count ≥ 2), we found a total of 485 DELs, including 241 up-regulated and 244 down-regulated (Figure 1G).
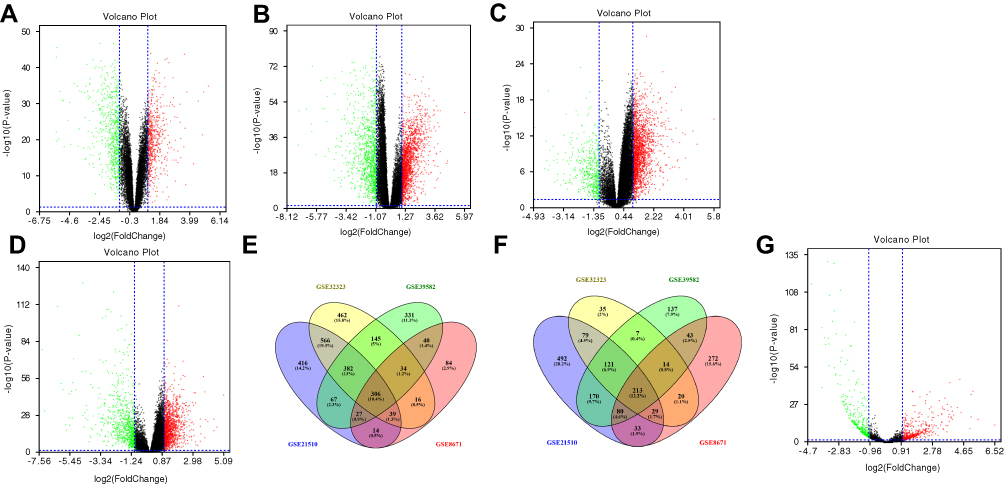 |
Figure 1 Identification of DEGs and DELs between tumor and non-tumor samples. Notes: (A–D) Volcano plot of the DEGs for datasets GSE8671, 560 up-regulated and 704 down-regulated genes (A); GSE2151, consisting of 1817 up-regulated and 1217 down-regulated genes (B); GSE32323, consisting of 1950 up-regulated and 518 down-regulated genes (C); and GSE39582, consisting of 1332 up-regulated and 785 down-regulated (D). X-axis: log2 fold change; Y-axis: -log 10 (P-value) for each probe; vertical-dotted lines: fold change ≥ 2 or ≤ 2; horizontal-dotted line: the significance cut off (P-value = 0.05). (E–F) Venn diagrams of the overlapping DEGs between different datasets, including 306 significantly up-regulated genes (E) and significantly down-regulated 213 genes (F). (G) Volcano plots of the DELs, consisting of 241 up-regulated and 244 down-regulated lncRNAs. |
Functional Enrichment Analysis of DEGs
GO analysis was performed to determine biological functions of the 519 DEGs. According to the GO analysis, DEGs were enriched in biological process, mainly involved in cell division (p=4.11E-15) and mitotic nuclear division (p=9.67E-15). Genes associated with molecular function were mainly related to protein binding (p=5.39E-06) and chemokine activity (p=4.20E-05). In cellular components, spindle pole (p=6.25E-06) and condensed chromosome kinetochore (p=9.20E-06) were the top two GO terms (Figure 2A–C and Table 1). KEGG (Kyoto Encyclopedia of Genes and Genomes) pathway analysis revealed that DEGs mainly participated in seven KEGG pathways: cell cycle (p=6.82E-10), mineral absorption (p=6.14E-05), DNA replication (p=6.66E-04), nitrogen metabolism (p=0.0014), proximal tubule bicarbonate reclamation (p=0.031), hematopoietic cell lineage (p=0.044) and ribosome biogenesis in eukaryotes (p=0.048) (Figure 2D and Table 2).
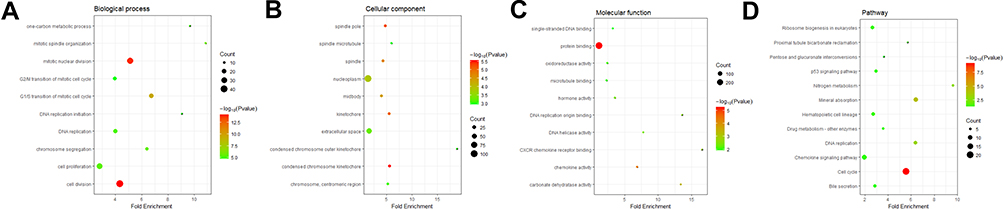 |
Figure 2 GO and KEGG pathway enrichment analysis of the DEGs. Notes: (A–C) illustrate the top 10 elements significantly enriched in the three GO categories: biological process (A), cellular component (B) and molecular function (C). (D) shows the top seven functional network/pathways associated with these DEGs through KEGG analysis with a p value of less than 0.05. Count in the X-axis represents the number of genes enriched in the network or pathway. |
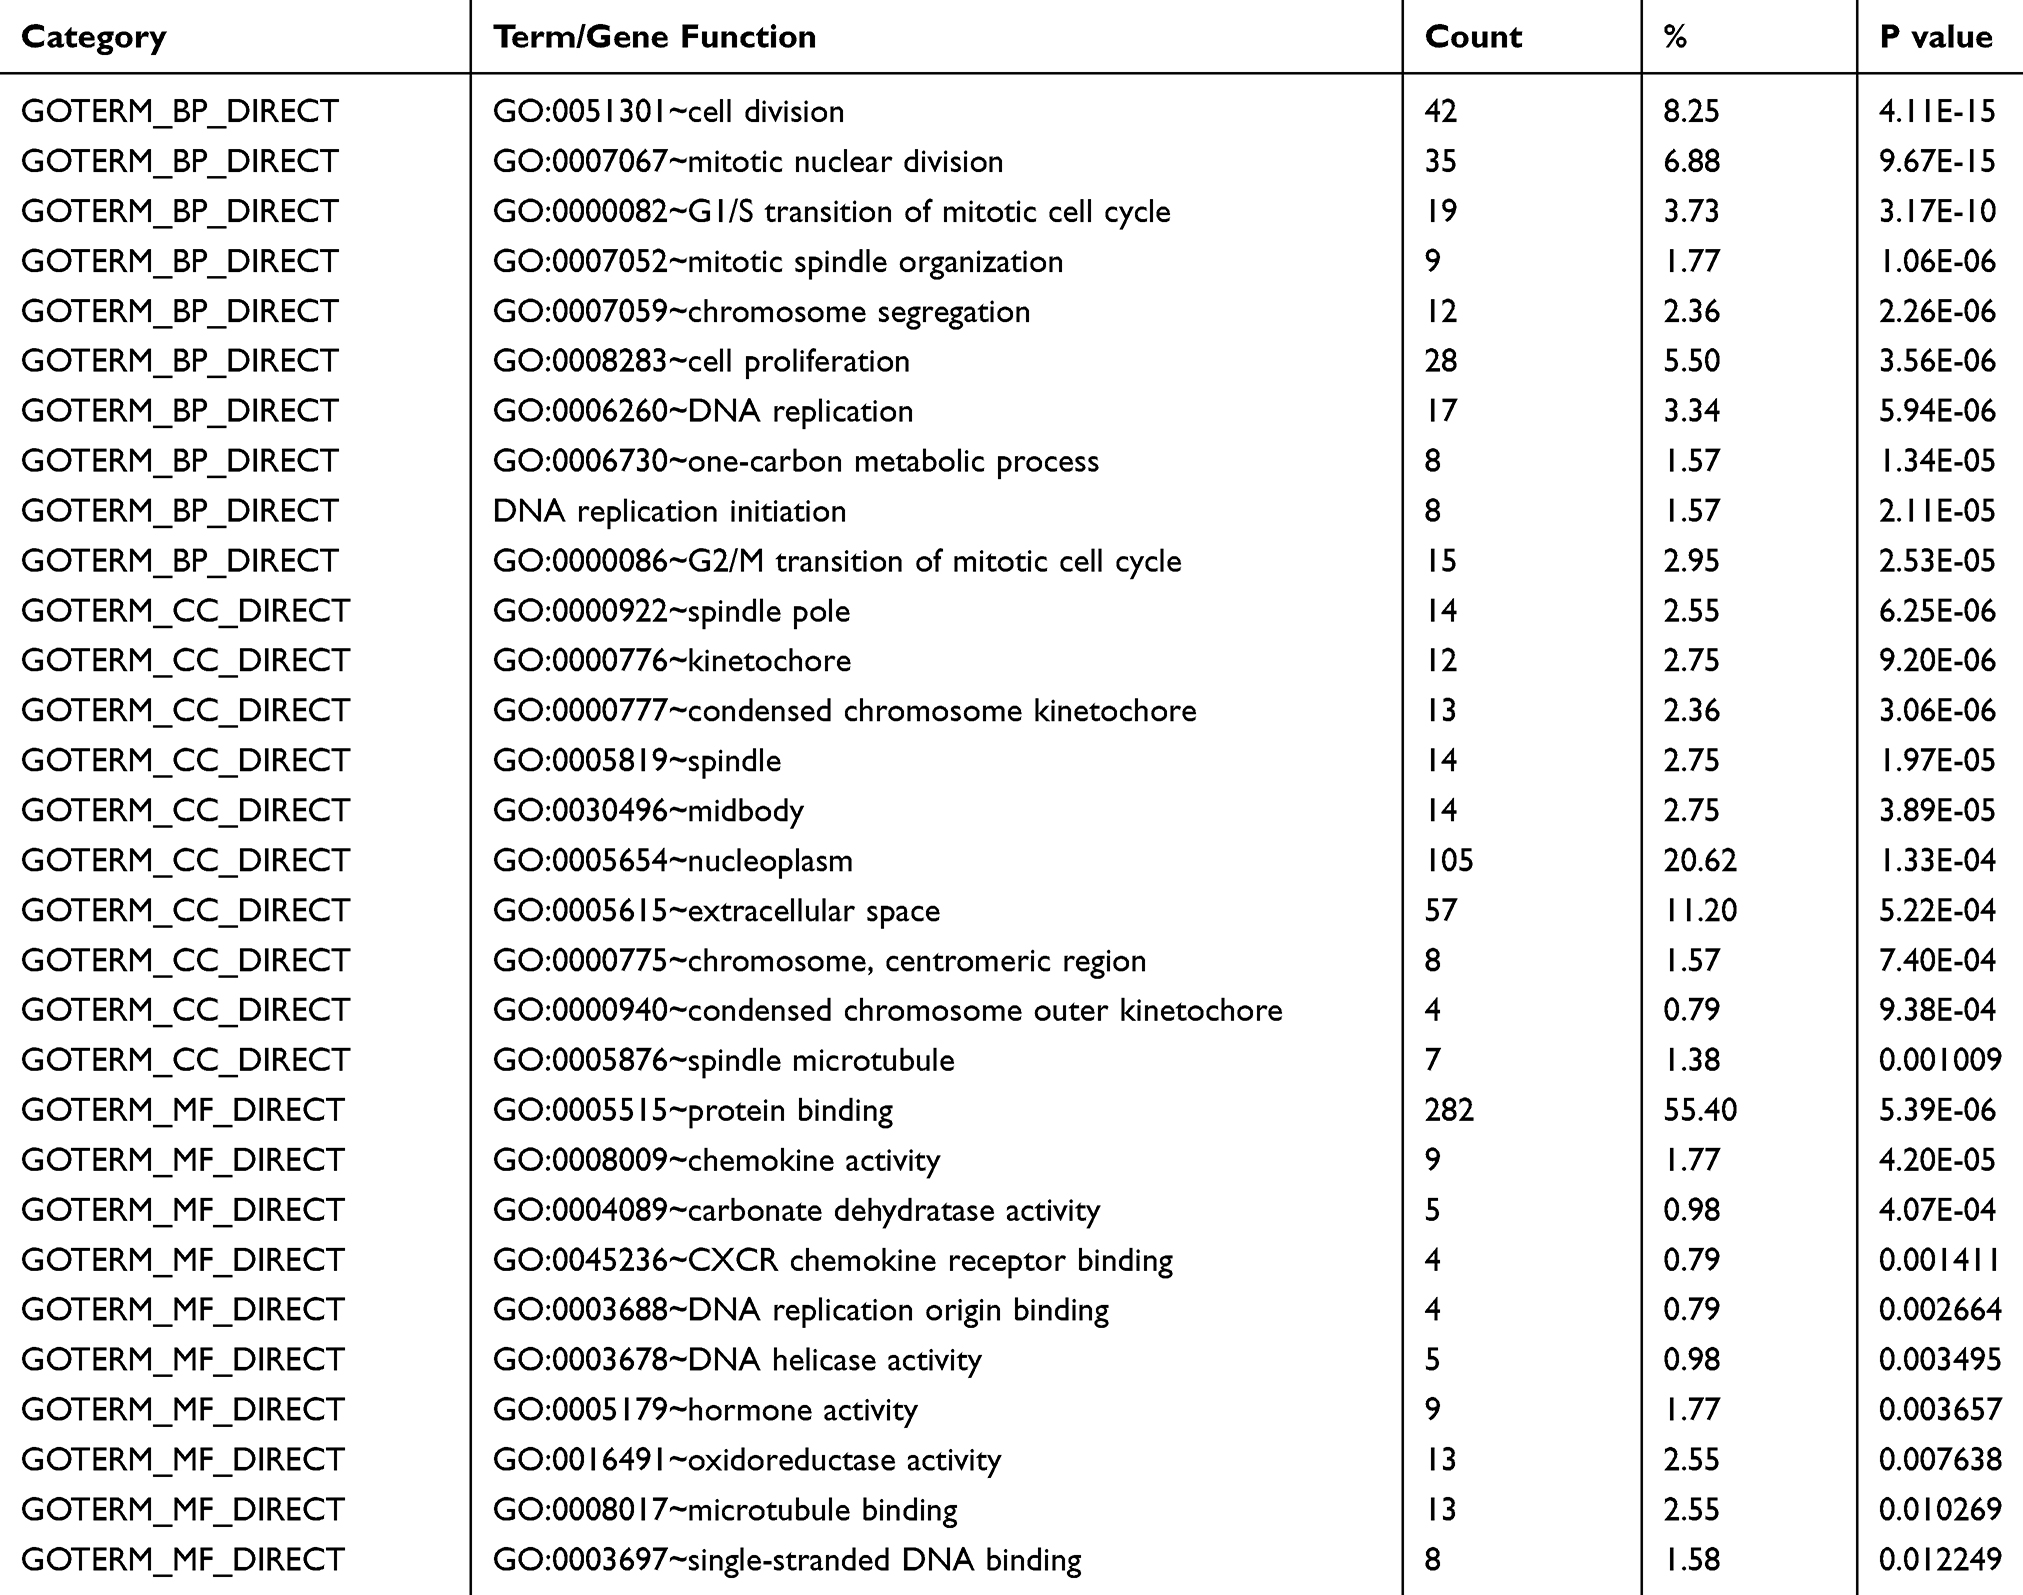 |
Table 1 GO Analysis of DEGs Between Paired Tumor and Non-Tumor Sample |
 |
Table 2 Pathway Analysis of DEGs Between Paired Tumor and Non-Tumor Samples |
The Expression of CDC6, CDC45, ORC6 and lncRNA SNHG7 in Colorectal Cancer Datasets
We chose the genes CDC6, CDC45, ORC6 and lncRNA SNHG7 for further study due to their important role in functional analysis and their prognostic value (Figure 3) in CRC patients. Analysis of the four GEO datasets revealed that CDC6, CDC45 and ORC6 were overexpressed in CRC tissues compared to non-cancerous tissues (Figure 4). Further analysis was found that CDC6 and CDC45 might be associated with TNM stage, lymph node metastasis and distant metastasis (Table 3). And the expression of ORC6 was associated with invasion depth (Table 3). High expression of CDC6, CDC45 and ORC6 in CRC tissues was further confirmed by analysis of a TCGA database with 622 CRC tissues and 51 non-cancerous tissues (Figure 5). At the same time, we found that lncRNA SNHG7 was also highly expressed in CRC tissues compared to non-tumor tissues in the TCGA dataset (Figure 5). However, we have not found the connection between the SNHG7 and TNM stage, invasion depth, lymph node metastasis and distant metastasis (Table 4).
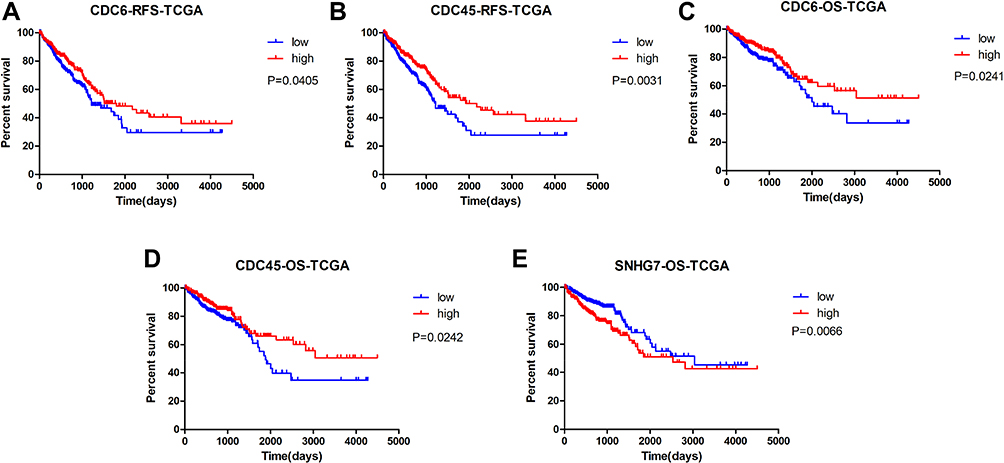 |
Figure 3 Kaplan-Meier survival curves by different levels of CDC6, CDC45 and SNHG7 expression in TCGA. Notes: (A) Relapse-free survival (RFS) by low and high CDC6 expression; (B) RFS by low and high CDC45 expression; (C) overall survival (OS) by low and high CDC6 expression; (D) OS by low and high CDC45 expression; (E) OS by low and high SNHG7 expression. The p-values were computed by the log-rank test. |
 |
Figure 4 The expression of CDC6 (A), CDC45 (B) and ORC6 (C) in GSE8671, GSE21510, GSE32323 and GSE39682 datasets. Note: ***P<0.001. |
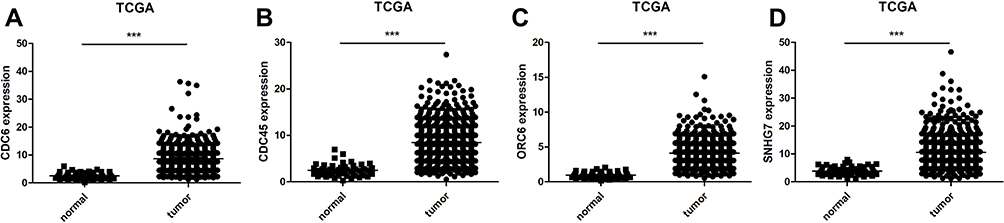 |
Figure 5 The expression of CDC6 (A), CDC45 (B), ORC6 (C), and lncRNA SNHG7 (D) in TCGA dataset. Note: ***P<0.001. |
 |
Table 3 Relationship of the Expression Levels of CDC6, CDC45, ORC6 and CRC Clinicopathologic Characteristics in GSE39582 Dataset |
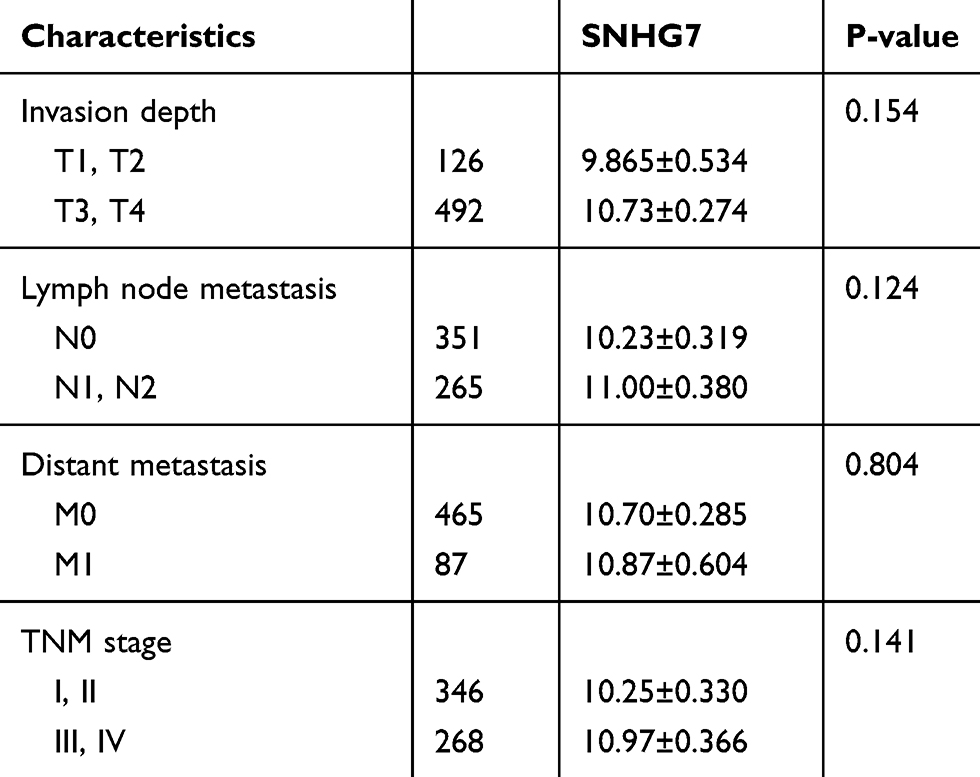 |
Table 4 Relationship of the Expression Levels of CDC6, CDC45, ORC6 and CRC Clinicopathologic Characteristics in TCGA |
CDC6, CDC45, ORC6 and lncRNA SNHG7 Expression as Prognostic Indicators for Colorectal Cancer
Next, we evaluated the correlation between the DEGs and DELs expression and CRC patient’s prognosis by Kaplan-Meier survival analysis in the GSE39582 and TCGA datasets. Patients were divided into high expression and low expression groups based on the mean value of expression. As shown in Figure 6, in CRC samples of GSE39582, patients with CDC6, CDC45 or ORC6 low expression in the tumor samples had significantly worse relapse-free survival (RFS) (P<0.001, hazard ratio 2.555, 95% CI: 1.775–3.678 for CDC6, Figure 6A; P <0.001, hazard ratio: 1.916, 95% CI: 1.380–2.659 for CDC45, Figure 6B; P =0.0168, hazard ratio: 1.490, 95% CI: 1.074–2.067 for ORC6, Figure 6C) and overall survival (OS) (P=0.0033, hazard ratio 1.543, 95% CI: 1.155–2.061 for CDC6, Figure 6D; P = 0.0459, hazard ratio: 1.341, 95% CI: 1.005–1.788 for CDC45, Figure 6E) based on a 250 days follow-up. We further analyzed the associations of CDC6, CDC45 and ORC6 expression with OS and relapse-free survival (RFS) in the TCGA dataset. As shown in Figure 3, patients with either a low CDC6 or a low CDC45 expression had significantly poorer OS and earlier recurrence. However, there was no significant association between ORC6 expression and the OS and RFS of CRC samples in TCGA (P >0.05, Supplementary Figure 1). Meanwhile, we found that the OS of CRC patients with high lncRNA SNHG7 expression was significantly worse than that with low lncRNA SNHG7 expression (Figure 3E).
Moreover, univariate Cox regression analysis of RFS of the CRC cases in GSE39582 showed that low CDC6, CDC45 or ORC6 expression (P <0.001), TNM stage (I/II vs. III/IV; P <0.001), lymph node metastasis (N0, N1/N2), as well as depth of tumor invasion (T1/T2, T3/T4) were risk factors that affect prognosis (Table 5). Subsequent multivariate analysis revealed that low CDC6, CDC45, and ORC6 expressions were the independent prognosis factors affecting RFS of CRC patients, in addition to TNM stage, lymph node metastasis, and tumor invasion depth. Furthermore, multivariate analyses of CRC samples within TCGA indicated that SNHG7 expression, distant metastasis, and TNM stage were three independent prognostic risk factors affecting the OS of patients with CRC (Table 6). These data indicated that upregulated SNHG7 and down-regulated CDC6, CDC45 and ORC6 could to predict prognosis in CRC patients.
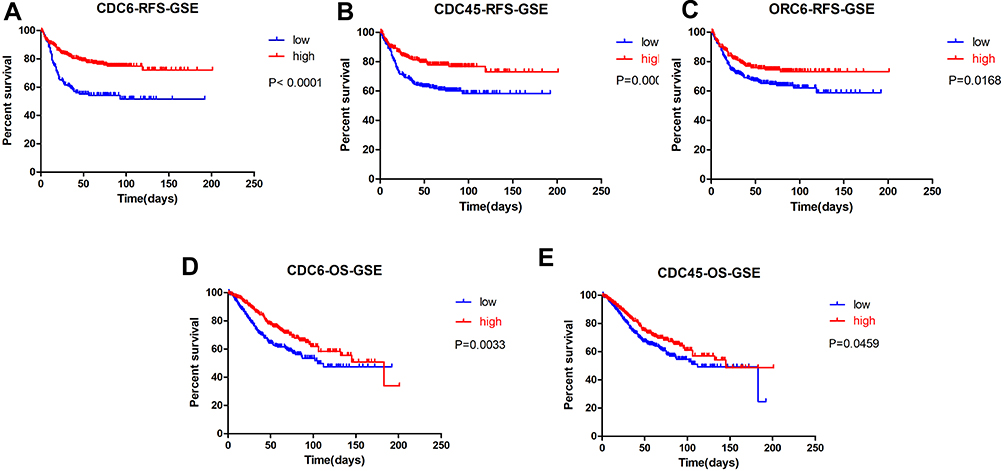 |
Figure 6 Kaplan-Meier survival curves by different levels of CDC6, CDC45 and ORC6 expression in GSE39582. Notes: (A) Relapse-free survival (RFS) by low and high CDC6 expression; (B) RFS by low and high CDC45 expression; (C) RFS by low and high ORC6 expression; (D) overall survival (OS) by low and high CDC6 expression; (E) OS by low and high CDC45 expression. The p-values were computed by the log-rank test. |
 |
Table 5 Correlations Between Gene (CDC6, CDC45 and ORC6) Expression and Pathology Parameters of CRC Specimens in GSE39582 Dataset |
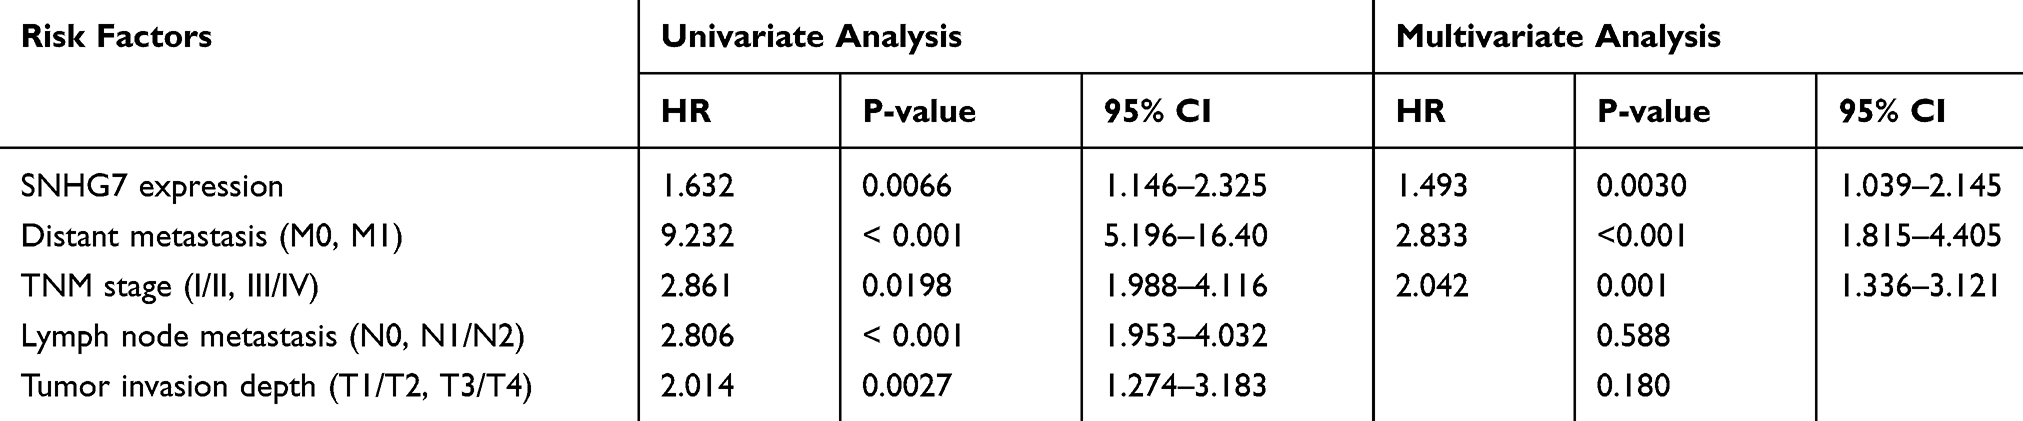 |
Table 6 Correlations Between lncRNA SNHG7 Expression and Pathology Parameters of CRC Specimens in TCGA |
Real-Time PCR Validation of DEGs and DEL
In order to verify the DEGs of the analysis, we performed RT-PCR of CDC6, CDC45, ORC6, and SNHG7 in 198 paired CRC and adjacent mucosa samples. CDC6, CDC45, ORC6, and SNHG7 expression levels in cancer samples were significantly higher than those in non-cancer samples (CDC6, P<0.0001, Figure 7A; CDC45, P<0.0001, Figure 7B; ORC6, P<0.0001, Figure 7C; SNHG7, P<0.0001, Figure 7D). Subsequently, we explored the correlation of CDC6, CDC45, ORC6, and SNHG7 expression levels with the clinicopathological factors in CRC patients. As shown in Figure 8, the CDC6 expression level was remarkably correlated with T stage, N stage, and TNM stage (Figure 8A); the CDC45 level was significantly associated with T stage and TNM stage (Figure 8B); the ORC6 level was remarkably correlated with N stage (Figure 8C); and the SNHG7 level was significantly associated with M stage (Figure 8D). In addition, a positive correlation between the lncRNA SNHG7 level and the CDC6/CDC45/ORC6 levels was observed in CRC tissues (Figure 9).
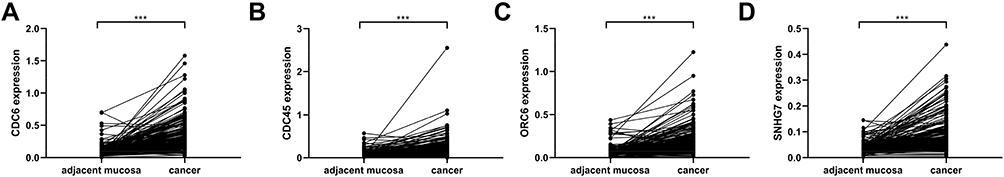 |
Figure 7 Validation of the differentially expressed genes in 198 CRC and individual-matched adjacent mucosa samples. Notes: CDC6 (A), CDC45 (B), ORC6 (C) and lncRNA SNHG7 (D) expression levels in CRC samples were significantly higher than those in adjacent mucosa samples. ***P<0.001. |
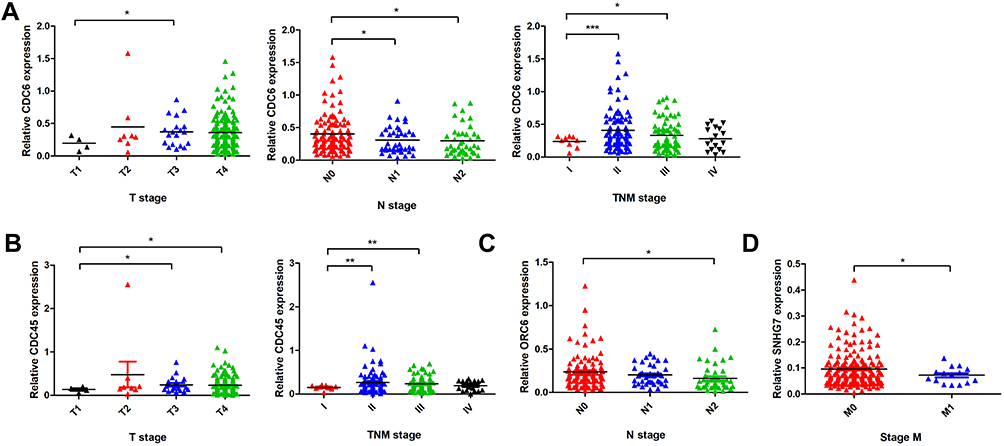 |
Figure 8 Association between clinicopathologic features and CDC6 (A), CDC45 (B), ORC6 (C) and SNHG7 (D) expression. Notes: *P<0.05; **P<0.01, ***P<0.001. |
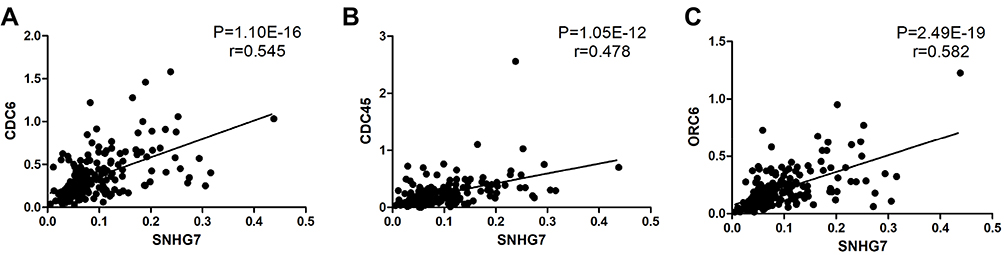 |
Figure 9 Positive correlation between the lncRNA SNHG7 levels and the CDC6 (A), CDC45 (B) and ORC6 (C) levels in 198 matched-tissues of CRC patients. |
Diagnostic Performance of mRNA and lncRNA Levels for the Differentiation of CRC Patients from Healthy Controls
The potential diagnostic utility of SNHG7, CDC6, CDC45 and ORC6 to differentiate between CRC and benign disease was assessed through generating a receiver operating characteristic (ROC) curve for SNHG7, CDC6, CDC45 and ORC6 expression. We found that the ROC area under curve (AUC) of the SNHG7 was 0.84 (95% confidence interval (CI): 0.81–0.88); the CDC6 was 0.88 (95% CI: 0.84–0.91); the CDC45 was 0.82 (95% CI: 0.78–0.86); the ORC6 was 0.85 (95% CI, 082–0.89) (Figure 10). However, we do not have serum sample to verify our point, considerable work needs to be done.
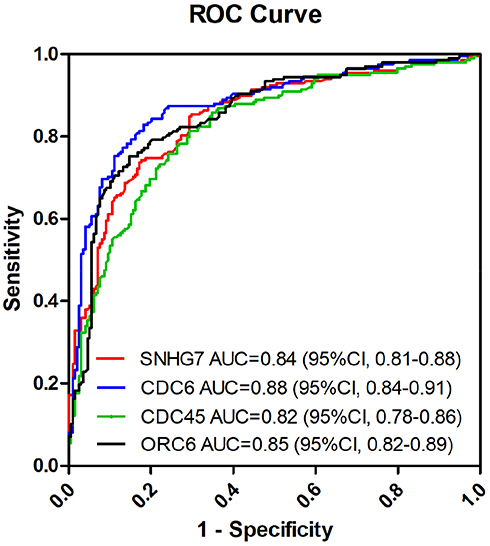 |
Figure 10 ROC analysis to analyze the ability of SNHG7, CDC6, CDC45 and ORC6 expression to distinguish CRC from benign disease. |
Discussion
In the present study, we identified the significantly differentially expressed mRNAs and lncRNAs in CRC by using GSE8671, GSE21510, GSE32323, GSE39582 and TCGA database. After analysis, 519 common DEGs and 485 DELs were screened. GO and KEGG pathway analyses showed that DEGs were associated with CRC progression. According to the GO analysis, DEGs were enriched in cell division, mitotic nuclear division, protein binding, chemokine activity, spindle and condensed chromosome kinetochore. Pathway analyses revealed that the DEGs were mainly involved in cell cycle, mineral absorption, DNA replication, nitrogen metabolism, proximal tubule bicarbonate reclamation, hematopoietic cell lineage and ribosome biogenesis in eukaryotes. Given their important roles in the prognostic value in patient with CRC, CDC6, CDC45, ORC6 and SNHG7 were selected for further study. Kaplan-Meier analysis and further univariates Cox regression analysis revealed that CDC6, CDC45, ORC6 and SNHG7 were associated with the OS or RFS of patient with CRC and might be the independent prognosis biomarkers for CRC patients.
Our analysis indicated that the dysregulated DEGs were significantly enriched in cell cycle. Cancer is characterized by deregulated proliferative signaling resulting from aberrant cell cycle activity. Therefore, cell cycle regulators have been considered as potential targets for cancer therapy.24 CDC6, CDC45, and ORC6 are three DEGs involved in cell cycle regulation.
CDC6 functions as a regulator at the early steps of DNA replication. It localizes in the nucleus during cell cycle G1 and translocates to the cytoplasm at the beginning of S phase. The subcellular translocation of this protein during cell cycle is regulated through phosphorylation by Cdks.25 CDC6 dysregulated is associated with many types of human malignancies including breast cancer,26 prostate cancer,27 ovarian cancer28 as well as lung cancer29 and osteosarcoma.30 In addition, CDC6 may be a promising target for overcoming CDDP resistance in bladder cancer,31 oxaliplatin resistance for CRC32 and paclitaxel resistance for gastric cancer.33
As a DNA replication initiation factor, Cdc45 directly interacts with MCM7 and DNA polymerase alpha in the assembly of the highly conserved multiprotein complex that includes Cdc6/Cdc18, the MCMs, and DNA polymerase; the assembly of the complex is essential for the initiation of eukaryotic DNA replication.28–30 CDC45 might be the target of miR-34a and a potential therapeutic target of CRC.34 In non-small cell lung cancer (NSCLC), downregulation of CDC45 induced G2/M phase cell cycle arrest and inhibited cell proliferation both in vitro and in vivo, which might act as an oncogene in NSCLC.35
ORC6 is one of the six subunits of the ORC, which includes a core complex consisting of ORC2, ORC3, ORC4, and ORC5, loosely interacting with ORC6 and ORC1 Reduction of ORC6 expression sensitizes human colon cancer cells to 5-fluorouracil and cisplatin. ORC6 may be a potential novel target for future anti-cancer therapy in colon cancer.36
LncRNAs, which comprise more than 200 nucleotides in length and lack a significant open reading frame, have been reported to act as critical factors in cancer development and progression.37 Our studies also identified differentially expressed lncRNAs in CRC based on gene expression profiling and focused on the lncRNAs SNHG7 for further analysis. SNHG7 is located on chromosome 9q34.3, with a length of 2157 bp, which has been known to be upregulated in several cancers. LncRNA-SNHG7 acts as a ceRNA for miR-193b and attenuates the inhibitory effect of miR-193b on FAIM2, which promotes the proliferation, migration and invasion, and inhibits apoptosis of lung cancer cells.38,39 LncRNA-SNHG7 also regulates proliferation, apoptosis, and invasion of bladder cancer cells,40 gastric cancer cells,41 and esophageal cancer cells.42 In osteosarcoma, SNHG7 promotes the tumor growth and epithelial-to-mesenchymal transition by miR-34a.43 SNHG7 promotes the proliferation, migration, and invasion of glioblastoma cells through inhibition of miR-5095 and concomitant activation of Wnt/β-catenin signaling pathway.44 It accelerates prostate cancer proliferation and cell cycle progression through cyclin D1 by sponging miR-503.45 In addition, recent studies have revealed that SNHG7 played a major role in CRC. Long non-coding RNA-SNHG7 acted as a target for miR-34a to increase the GALNT7 level46 and sponged miR-216b to upregulate GALNT147 in CRC.
According to the functional analysis and prognostic value, we chose CDC6, CDC45, ORC6 and SNHG7 to conduct real-time PCR in 198 paired CRC and adjacent mucosa samples. Results revealed that these genes levels in cancerous tissues were significantly higher than non-cancer samples and correlated with CRC T/N/M stage. In addition, the level of SNHG7 was positively correlated with the CDC6, CDC45 and ORC6 mRNA. These implied that SNHG7 might affect the cell cycle of CRC by regulating the expression of CDC6, CDC45 or ORC6. However, we do not have prognostic data for CRC samples, and the prognostic impact of CDC6, CDC45, ORC6 and SNHG7 on colorectal cancer was not verified in our samples. In addition, the expressions of CDC6, CDC45 and ORC6 were higher in cancerous samples than adjacent mucosa samples, but patients with CDC6, CDC45 or ORC6 low expression in the tumor samples had worse prognostic. These genes might play different roles at different stages of CRC.48,49 They might act as oncogenes in the early stage but have suppressor effects on cancer in the advanced stage.
Conclusion
We identified 519 DEGs and 485 DELs as candidate biomarkers for the diagnosis of CRC by gene expression profile analysis. Further study revealed that CDC6, CDC45, ORC6 and SNHG7 were up-regulated in CRC and could be the independent prognosis factors for CRC. These results implied that these four genes might involve with CRC initiation and progression and could be explored as potential diagnosis, therapeutic and prognostic targets for CRC.
Acknowledgment
We thank the Institute of Clinical Pharmacology, Central South University, Hunan Key Laboratory of Pharmacogenetics.
Disclosure
The authors report no conflicts of interest in this work.
References
1. Torre LA, Bray F, Siegel RL, Ferlay J, Lortet-Tieulent J, Jemal A. Global cancer statistics, 2012. CA Cancer J Clin. 2015;65(2):87–108. doi:10.3322/caac.21262
2. Choi Y, Sateia HF, Peairs KS, Stewart RW. Screening for colorectal cancer. Semin Oncol. 2017;44(1):34. doi:10.1053/j.seminoncol.2017.02.002
3. Lieberman DA, Williams JL, Holub JL, et al. Race, ethnicity, and sex affect risk for polyps >9 mm in average-risk individuals. Gastroenterology. 2014;147(2):351–358. doi:10.1053/j.gastro.2014.04.037
4. Torre LA, Siegel RL, Ward EM, Jemal A. Global cancer incidence and mortality rates and trends–an update. Cancer Epidemiol Biomarkers Prev. 2016;25(1):16–27. doi:10.1158/1055-9965.EPI-15-0578
5. Siegel RL, Miller KD, Fedewa SA, et al. Colorectal cancer statistics, 2017. CA Cancer J Clin. 2017;67(3):177–193. doi:10.3322/caac.21395
6. Zafar SY, Malin JL, Grambow SC, et al. Chemotherapy use and patient treatment preferences in advanced colorectal cancer: a prospective cohort study. Cancer. 2013;119(4):854–862. doi:10.1002/cncr.27815
7. Zhang L, Yang Y. Identification of common genes refers to colorectal carcinogenesis with paired cancer and noncancer samples. Dis Markers 2018;2018:3452739. doi:10.1093/database/bay090
8. Zou H, Wu LX, Yang Y, et al. lncRNAs PVT1 and HAR1A are prognosis biomarkers and indicate therapy outcome for diffuse glioma patients. Oncotarget. 2017;8(45):78767–78780. doi:10.18632/oncotarget.20226
9. Sabates-Bellver J, Van der Flier LG, de Palo M, et al. Transcriptome profile of human colorectal adenomas. Mol Cancer Res. 2007;5(12):1263–1275. doi:10.1158/1541-7786.MCR-07-0267
10. Tsukamoto S, Ishikawa T, Iida S, et al. Clinical significance of osteoprotegerin expression in human colorectal cancer. Clin Cancer Res. 2011;17(8):2444–2450. doi:10.1158/1078-0432.CCR-10-2884
11. Khamas A, Ishikawa T, Shimokawa K, et al. Screening for epigenetically masked genes in colorectal cancer using 5-Aza-2ʹ-deoxycytidine, microarray and gene expression profile. Cancer Genomics Proteomics. 2012;9(2):67–75.
12. Marisa L, de Reynies A, Duval A, et al. Gene expression classification of colon cancer into molecular subtypes: characterization, validation, and prognostic value. PLoS Med. 2013;10(5):e1001453. doi:10.1371/journal.pmed.1001453
13. Irizarry RA, Bolstad BM, Collin F, Cope LM, Hobbs B, Speed TP. Summaries of affymetrix GeneChip probe level data. Nucleic Acids Res. 2003;31(4):e15. doi:10.1093/nar/gng015
14. Parrish RS, Spencer HJ
15. Shi YX, Zhu T, Zou T, et al. Prognostic and predictive values of CDK1 and MAD2L1 in lung adenocarcinoma. Oncotarget. 2016;7(51):85235–85243. doi:10.18632/oncotarget.13252
16. Torto-Alalibo T, Purwantini E, Lomax J, Setubal JC, Mukhopadhyay B, Tyler BM. Genetic resources for advanced biofuel production described with the gene ontology. Front Microbiol. 2014;5:528. doi:10.3389/fmicb.2014.00528
17. Gene Ontology Consortium. The gene ontology project in 2008. Nucleic Acids Res. 2008;36(suppl_1):D440–D444. doi:10.1093/nar/gkm883
18. Tilford CA, Siemers NO. Gene set enrichment analysis. Methods Mol Biol. 2009;563:99–121.
19. Hung JH. Gene set/pathway enrichment analysis. Methods Mol Biol. 2013;939:201–213.
20. Huang DW, Sherman BT, Tan Q, et al. DAVID bioinformatics resources: expanded annotation database and novel algorithms to better extract biology from large gene lists. Nucleic Acids Res. 2007;35(suppl_2):W169–W175. doi:10.1093/nar/gkm415
21. Gao YF, Mao XY, Zhu T, et al. COL3A1 and SNAP91: novel glioblastoma markers with diagnostic and prognostic value. Oncotarget. 2016;7(43):70494–70503. doi:10.18632/oncotarget.12038
22. Li C, Zou H, Wang Z, et al. REST, not REST4, is a risk factor associated with radiotherapy plus chemotherapy efficacy in glioma. Drug Des Devel Ther. 2018;12:1363–1371. doi:10.2147/DDDT.S161602
23. Kheirelseid EA, Chang KH, Newell J, Kerin MJ, Miller N. Identification of endogenous control genes for normalisation of real-time quantitative PCR data in colorectal cancer. BMC Mol Biol. 2010;11:12. doi:10.1186/1471-2199-11-12
24. Otto T, Sicinski P. Cell cycle proteins as promising targets in cancer therapy. Nat Rev Cancer. 2017;17(2):93–115. doi:10.1038/nrc.2016.138
25. Huang S, Xu X, Wang G, et al. DNA replication initiator Cdc6 also regulates ribosomal DNA transcription initiation. J Cell Sci. 2016;129(7):1429–1440. doi:10.1242/jcs.178723
26. Mahadevappa R, Neves H, Yuen SM, et al. The prognostic significance of Cdc6 and Cdt1 in breast cancer. Sci Rep. 2017;7(1):985. doi:10.1038/s41598-017-00998-9
27. Kim YH, Byun YJ. CDC6 mRNA expression is associated with the aggressiveness of prostate cancer. J Korean Med Sci. 2018;33(47):e303. doi:10.3346/jkms.2018.33.e303
28. Deng Y, Jiang L, Wang Y, et al. High expression of CDC6 is associated with accelerated cell proliferation and poor prognosis of epithelial ovarian cancer. Pathol Res Pract. 2016;212(4):239–246. doi:10.1016/j.prp.2015.09.014
29. Zhang X, Xiao D, Wang Z, et al. MicroRNA-26a/b regulate DNA replication licensing, tumorigenesis, and prognosis by targeting CDC6 in lung cancer. Mol Cancer Res. 2014;12(11):1535–1546. doi:10.1158/1541-7786.MCR-13-0641
30. Jiang W, Yu Y, Liu J, et al. Downregulation of Cdc6 inhibits tumorigenesis of osteosarcoma in vivo and in vitro. Biomed Pharmacother. 2019;115:108949. doi:10.1016/j.biopha.2019.108949
31. Chen S, Chen X, Xie G, et al. Cdc6 contributes to cisplatin-resistance by activation of ATR-Chk1 pathway in bladder cancer cells. Oncotarget. 2016;7(26):40362–40376. doi:10.18632/oncotarget.9616
32. Cai J, Wang H, Jiao X, et al. The RNA-binding protein HuR confers oxaliplatin resistance of colorectal cancer by upregulating CDC6. Mol Cancer Ther. 2019;18(7):1243–1254. doi:10.1158/1535-7163.MCT-18-0945
33. Zhao B, Zhang J, Chen X, Xu H, Huang B. Mir-26b inhibits growth and resistance to paclitaxel chemotherapy by silencing the CDC6 gene in gastric cancer. Arch Med Sci Atheroscler Dis. 2019;15(2):498–503. doi:10.5114/aoms.2018.73315
34. Wang T, Xu H, Liu X, Chen S, Zhou Y, Zhang X. Identification of key genes in colorectal cancer regulated by miR-34a. Med Sci Monit. 2017;23:5735–5743. doi:10.12659/MSM.904937
35. Huang J, Li Y, Lu Z, et al. Analysis of functional hub genes identifies CDC45 as an oncogene in non-small cell lung cancer - a short report. Cell Oncol (Dordr). 2019;42:571–578. doi:10.1007/s13402-019-00438-y
36. Gavin EJ, Song B, Wang Y, Xi Y, Ju J. Reduction of Orc6 expression sensitizes human colon cancer cells to 5-fluorouracil and cisplatin. PLoS One. 2008;3(12):e4054. doi:10.1371/journal.pone.0004054
37. Deng J, Tang J, Wang G, Zhu YS. Long non-coding RNA as potential biomarker for prostate cancer: is it making a difference? Int J Environ Res Public Health. 2017;14(3):270. doi:10.3390/ijerph14030270
38. She K, Huang J, Zhou H, Huang T, Chen G, He J. lncRNA-SNHG7 promotes the proliferation, migration and invasion and inhibits apoptosis of lung cancer cells by enhancing the FAIM2 expression. Oncol Rep. 2016;36(5):2673–2680. doi:10.3892/or.2016.5105
39. She K, Yan H, Huang J, Zhou H, He J. miR-193b availability is antagonized by LncRNA-SNHG7 for FAIM2-induced tumour progression in non-small cell lung cancer. Cell Prolif 2018;51(1):e12406.
40. Zhong X, Long Z, Wu S, Xiao M, Hu W. LncRNA-SNHG7 regulates proliferation, apoptosis and invasion of bladder cancer cells assurance guidelines. J BUON. 2018;23(3):776–781.
41. Wang MW, Liu J, Liu Q, et al. LncRNA SNHG7 promotes the proliferation and inhibits apoptosis of gastric cancer cells by repressing the P15 and P16 expression. Cell Prolif. 2017;21(20):4613–4622.
42. Xu LJ, Yu XJ, Wei B, et al. LncRNA SNHG7 promotes the proliferation of esophageal cancer cells and inhibits its apoptosis. Cell Death Dis. 2018;22(9):2653–2661.
43. Deng Y, Zhao F, Zhang Z, Sun F, Wang M. Long noncoding RNA SNHG7 promotes the tumor growth and epithelial-to-mesenchymal transition via regulation of miR-34a signals in osteosarcoma. Cancer Biother Radiopharm. 2018;33(9):365–372. doi:10.1089/cbr.2018.2503
44. Ren J, Yang Y, Xue J, et al. Long noncoding RNA SNHG7 promotes the progression and growth of glioblastoma via inhibition of miR-5095. Biochem Biophys Res Commun. 2018;496(2):712–718. doi:10.1016/j.bbrc.2018.01.109
45. Qi H, Wen B, Wu Q, et al. Long noncoding RNA SNHG7 accelerates prostate cancer proliferation and cycle progression through cyclin D1 by sponging miR-503. Biomed Pharmacother. 2018;102:326–332. doi:10.1016/j.biopha.2018.03.011
46. Li Y, Zeng C, Hu J, et al. Long non-coding RNA-SNHG7 acts as a target of miR-34a to increase GALNT7 level and regulate PI3K/Akt/mTOR pathway in colorectal cancer progression. J Hematol Oncol 2018;11(1):89.
47. Shan Y, Ma J, Pan Y, Hu J, Liu B, Jia L. LncRNA SNHG7 sponges miR-216b to promote proliferation and liver metastasis of colorectal cancer through upregulating GALNT1. J Hematol Oncol. 2018;9(7):722.
48. Yang Z, Ghoorun RA, Fan X, et al. High expression of Beclin-1 predicts favorable prognosis for patients with colorectal cancer. Clin Res Hepatol Gastroenterol. 2015;39(1):98–106. doi:10.1016/j.clinre.2014.06.014
49. Tichy M, Knopfova L, Jarkovsky J, et al. High c-Myb expression associates with good prognosis in colorectal carcinoma. J Cancer. 2019;10(6):1393–1397. doi:10.7150/jca.29530
 © 2019 The Author(s). This work is published and licensed by Dove Medical Press Limited. The
full terms of this license are available at https://www.dovepress.com/terms
and incorporate the Creative Commons Attribution
- Non Commercial (unported, 3.0) License.
By accessing the work you hereby accept the Terms. Non-commercial uses of the work are permitted
without any further permission from Dove Medical Press Limited, provided the work is properly
attributed. For permission for commercial use of this work, please see paragraphs 4.2 and 5 of our Terms.
© 2019 The Author(s). This work is published and licensed by Dove Medical Press Limited. The
full terms of this license are available at https://www.dovepress.com/terms
and incorporate the Creative Commons Attribution
- Non Commercial (unported, 3.0) License.
By accessing the work you hereby accept the Terms. Non-commercial uses of the work are permitted
without any further permission from Dove Medical Press Limited, provided the work is properly
attributed. For permission for commercial use of this work, please see paragraphs 4.2 and 5 of our Terms.