Back to Journals » Infection and Drug Resistance » Volume 15
Population-Based Pharmacokinetics and Dose Optimization of Imipenem in Vietnamese Critically-Ill Patients
Authors Dinh TD, Nguyen HN, Le BH ![]() , Nguyen TTT
, Nguyen TTT ![]() , Nguyen HTL
, Nguyen HTL ![]()
Received 10 May 2022
Accepted for publication 6 August 2022
Published 17 August 2022 Volume 2022:15 Pages 4575—4583
DOI https://doi.org/10.2147/IDR.S373348
Checked for plagiarism Yes
Review by Single anonymous peer review
Peer reviewer comments 2
Editor who approved publication: Prof. Dr. Héctor Mora-Montes
Thanh D Dinh,1,2 Hung N Nguyen,1 Ba Hai Le,1 Thuy TT Nguyen,1 Huong TL Nguyen1
1Department of Clinical Pharmacy, Hanoi University of Pharmacy, Hanoi, Vietnam; 2Phu Tho General Hospital, Việt Trì, Phu Tho Province, Vietnam
Correspondence: Huong TL Nguyen, Department of Clinical Pharmacy, Hanoi University of Pharmacy, 13, 15 – Lê Thánh Tông, Hoàn Kiếm, HàNội, 100000, Vietnam, Tel +84904308406, Email [email protected]
Purpose: The purpose of this study was to characterize the population-based pharmacokinetic (POP-PK) profile of imipenem in Vietnamese adult patients and to assess the probability of target attainment (PTA) of the pharmacokinetic/pharmacodynamic (PK/PD) parameter to determine the optimal dose.
Patients and Methods: A POP-PK model of imipenem was developed in patients with severe infection from a 1500-bed general hospital in Vietnam, using MONOLIX 2019. After the initial dose infusion, 6 blood samples per patient were collected to measure plasma imipenem levels. Eight covariates (eg, age, weight) were investigated to ascertain their influence on imipenem’s PK. Monte Carlo simulations were performed to determine the PTA for the time in which the total steady-state imipenem concentrations remained above the MIC (T>MIC) for 40% and 100% of the dosing interval.
Results: The best fit to the PK data was a two-compartment model with inter-individual variability (IIV) in clearance (CL), central volume of distribution (Vc), intercompartmental clearance (Q), and peripheral volume of distribution (Vp). Only creatinine clearance was retained as a covariate on CL in the final model. The typical value of CL and Vc were estimated to be 4.79 L/h and 11.1 L, respectively. The between-subject variability in this population was noted to be high (> 38%, especially for IIV on Q at 110%). Prolonged or continuous infusion demonstrated efficacy (40% T>MIC) against bacteria with a MIC of 4mg/L. To achieve 100% T>MIC or bacteria with MIC> 4 mg/L, however, the number of doses must be increased while maintaining the same daily dose for the 3-hour prolonged infusion regimen.
Conclusion: A population pharmacokinetic model of imipenem was developed for Vietnamese adult patients with severe illness. By using Monte Carlo simulation, the appropriate dose has been suggested based on the bacterial MIC value and the targeted PK/PD goal.
Keywords: imipenem, pharmacokinetic modeling, PK/PD, Monte Carlo, carbapenem
Introduction
Carbapenem is a group of antibiotics belonging to the β-lactams antibiotics with broad-spectrum activity against Gram-negative, Gram-positive and anaerobic bacteria. With high efficacy, good tolerance, and low toxicity, carbapenem is generally reserved for treating severe infections, nosocomial infections, and infections caused by multidrug-resistant Gram-negative bacteria. Like other b-lactams, imipenem’s antibacterial pharmacodynamic (PD) effect depends on the time in which drug concentration remains above the minimum inhibitory concentration (T > MIC) against bacteria within the dosing interval.1
Imipenem is a hydrophilic molecule characterized by a half-life of about one hour, low plasma protein binding (<20%) and predominantly renal excretion unchanged at close to 70%. In healthy adults, the clearance is 12.1 L/h, and the volume of distribution (Vd) of the central compartment is 9.6 L after 1000 mg every 8 hours (q8h) with a 0.5-hour infusion. The imipenem pharmacokinetics (PK) profile in critically-ill patients is likely to be significantly altered due to the wide range of physiological factors. These changes in PK characteristics lead to a significant variation in imipenem plasma concentration.2 In addition to changing PK characteristics in critically-ill patients, there is an alarming rise in multi-resistant Gram-negative bacteria with increasing MIC values. For serious infections in critically-ill patients, T>MIC targets may require a higher value, up to 100%, as compared to the conventional target of 40% for non-severe infections.3 Therefore, antibiotic dosages in critically-ill patients with serious infections must be cautiously adjusted to ensure adequate drug exposure.
The optimal dosing regimen of imipenem, which may be obtained using Monte Carlo simulation based on a POP-PK model to derive PK/PD characteristics. In Viet Nam, there has been only one published POP-PK study on imipenem using a limited sampling strategy and evaluated in patients with acute exacerbations of chronic obstructive pulmonary.4 Thus, a POP-PK model based on a comprehensive sampling technique would give more information for Monte Carlo simulations to determine appropriate dosage regimens of imipenem in critically-ill Vietnamese patients.
Thereby, this study aimed to develop a POP-PK model of imipenem in critically-ill Vietnamese patients, taking into account the influence of various clinical and biological covariates. The T>MIC value generated from the Monte-Carlo simulation was utilized in conjunction with population pharmacokinetic parameter estimations to optimize the imipenem dosage regimen.
Materials and Methods
Study Design and Population
Critically-ill patients who were required to be admitted to the intensive care unit (ICU) of Phu Tho general hospital (level I with 1500 beds) between March and October 2018 and got imipenem per clinical indication were enrolled in this study. The protocol was approved by the Phu Tho general hospital’s ethics committee. All patients provided written informed consent in compliance with the ethical principle of the revised Declaration of Helsinki.17 Those who were allergic to imipenem, <18 years old, pregnant or breastfeeding, or receiving dialysis were excluded.
Sampling Procedure and Analytical Methods
Plasma concentrations of imipenem were determined following the initial dose infused over 30 minutes. The blood sampling schedule was optimized using PFIM interface 4.0 software and parameters from Couffignal et al’s POP-PK model.3 Six 3-mL blood samples were obtained at the following times: pre-dose, 15, 40, 90, and 420 minutes after the first dose of imipenem, and just before the second dose. Each participant’s demographic and clinical data were collected.
All blood samples were immediately centrifuged at 4000 x g for 10–15 minutes after extraction. After stabilizing plasma samples with 4-morpholine propane sulphonic acid (ratio 1:1 v/v), they were immediately frozen at −70°C. Plasma imipenem concentrations were measured using a high-performance liquid chromatography (HPLC) method with an Apollo C8 column (150x4.6 mm; 5 m) and a UV detector. Imipenem was detected at a wavelength of 298 nm. The calibration range for the imipenem bioassay was 0.5–50 mcg/L. According to the FDA guidelines, this method was validated for selectivity, accuracy, precision, recovery, lower limit of quantification, calibration curve, and stability. Blood samples were quantified by HPLC method, UV detector according to the method developed and validated by the Department of Analytical Chemistry, Hanoi University of Pharmacy.5
Population Pharmacokinetic Modeling
The MONOLIX program (Monolix version 2019R1, Antony, France: Lixoft SAS, 2019) was used to conduct this POP-PK analysis. SAEM (Stochastic Approximation Expectation-Maximization) algorithm was used to estimate the PK parameters of the population using maximum likelihood estimation.
Structural and Statistical Model
The base POP-PK model was first developed using a combination of structural and statistical models. We examined and compared structural PK models consisting of one- and two-compartment systems with first-order elimination. Between-subject variability was quantified by assuming that individual parameters followed a multivariate lognormal distribution: Pi=TVP*exp ( ); where Pi denoted the individual parameter estimate for individual i, TVP denoted the typical population parameter estimate and
  represented the BSV, which was distributed following
  . The residual error was evaluated by a combined error model (SD method):
  where Cobs or
  respectively denoted the observation or prediction; a and b denoted the additive and proportional components of the residual error, respectively; and ε fixed at 1 for the residual variability.
Discrimination between basic structural models was evaluated using the Akaike information criterion (AIC) and the Bayesian information criterion (BIC). The model with the lowest AIC and BIC values were selected for further analysis.
Covariate Analysis and Model Evaluation
From the base model, eight covariates that showed significant influences on the PK parameters in previous studies were investigated for the impact on the PK parameters in this study. These covariates were as follows: Gender (SEX), age (AGE), actual body weight (ABW), serum albumin (ALB), creatinine clearance (Clcr), UNIT (ICU/general medicine department), vasopressor (VASO) use and mechanical ventilation. The Cockcroft-Gault equation was used to calculate Clcr based on the patient’s actual body weight. The selection of covariates was determined by COSSAC method (Conditional Sampling use for Stepwise Approach based on Correlation tests). At each step, the covariate was selected based on the correlation between the covariate and the parameter.
At each stage of model development, numerical and graphical assessments were made. The likelihood information (such as objective function value [OFV] and AIC) and the precision of parameter estimates were evaluated. Additionally, the plausibility of parameter estimates, covariance matrix, and goodness-of-fit (GOF) plots were investigated. The GOF plots included observed concentrations (DV) versus predicted population (PRED) or individual (IPRED) concentrations, individual weighted residuals (IWRES), and population-weighted residuals (PWRES) versus time or concentrations. Internal model validation was evaluated using simulation-based tools such as normalized prediction distribution errors (NPDE) versus concentrations and visual predictive checks (VPC).
Monte Carlo Simulations
Monte Carlo simulations of 1000 virtual patients were performed using the final model with covariates to predict PK/PD target T>MIC for several imipenem dosage regimens at MIC values. In order to identify the optimal dosage regimen, the simulation incorporated three-hour prolonged infusion (PI) and continuous infusion (CI), including PI 0.5 g q12h, PI 0.5 g q8h, PI 1 g q12h, PI 0.5 g q6h, PI 1 g q8h, 0.5 g q4h, PI 1 g q6h, CI 3 g every 24h, 4 g every 24h. The Clcr threshold was utilized to categorize the virtual patients into four groups: <30, 30–60, 60–90, and >90 mL/min. The following MIC targets were investigated 0.125, 0.25, 0.5, 1, 2, 4, 8, 16, 32, and 64 mg/L, which ranged from susceptible bacteria with low MIC to highly resistant bacteria.
The cumulative percentage of time that the imipenem concentration remained over the MIC at a steady-state was measured, and the probability of pharmacodynamic goal attainment (PTA) was calculated as a fraction that achieved 40% or 100% T > MIC.
All simulations and calculations were conducted using R 4.0.5 with the package mlxR (Simulx, RRID: SCR 000486) version 4.1.0 (R Core Team, 2021).6
Results
Patients
The demographics of the patients are summarized in Table 1, which includes 24 patients with a mean age of 57.5 years. Due to a lack of ICU beds, most patients (20) were admitted to the ICU, while four patients were admitted to general medical service during the waiting time. Almost half of these patients received mechanical ventilation for more than 24 hours. The mean Clcr values for this patient group (mean ± SD) were 68.3±39.6 mL/min. Nineteen patients received 0.5g q8h imipenem, whereas only two received 0.5g q6h, and three received 1g q8h.
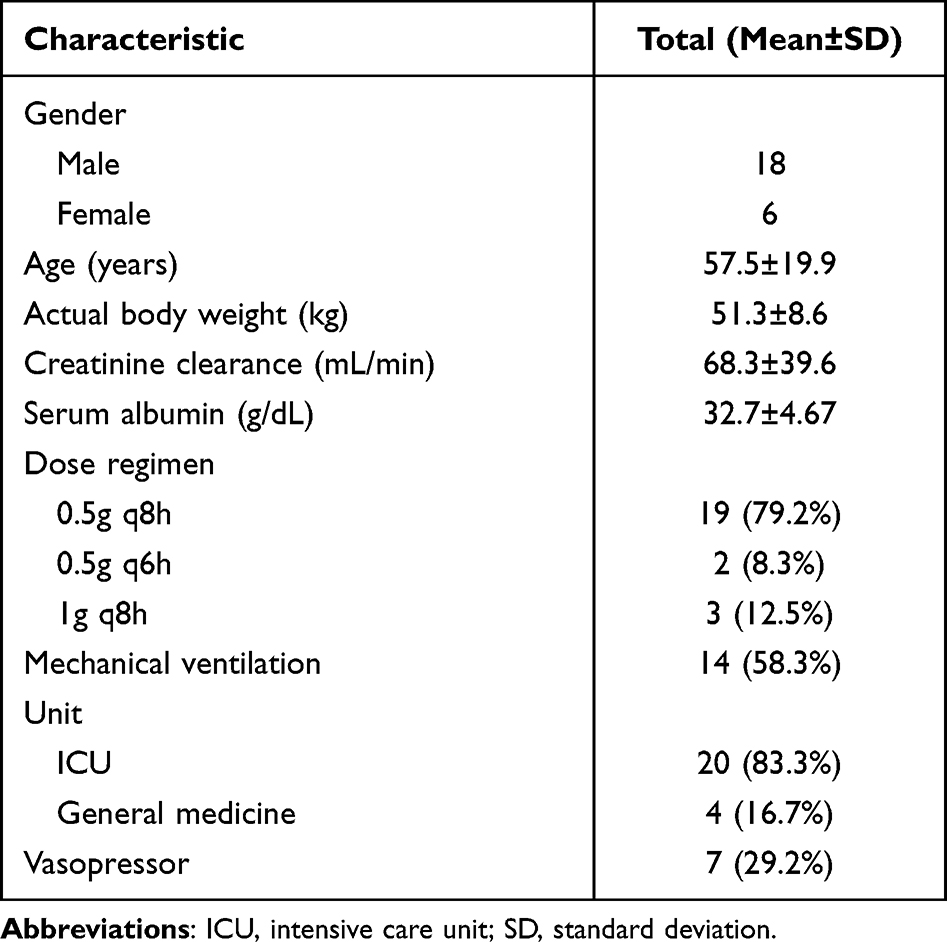 |
Table 1 Demographic Characteristics |
Population Pharmacokinetic Model
In total, 139 plasma samples were included for POP-PK analysis. Two-compartment model with first-order elimination best described the PK data. Clcr was the only significant covariate in the final model that influenced imipenem’s clearance. By including Clcr in the final model, the OFV value was reduced from 706.65 to 699.1 (p = 0.014) and the individual goodness-of-fit plots’ performance was improved. Table 2 summarizes the POP-PK parameters determined, with RSE values in the range acceptable for fixed and random effects. Typical CL, Vc, Q, and Vp values were estimated at 4.79 L/h; 11.1 L/h; 11.1 L/h; and 8.82 L/h, respectively. Between-subject variability (BSV) on PK parameters was seen at a high level, especially for Q, and Vp (CV = 110.0%, and 69.4%, respectively). Additionally, all parameter estimates fell near the median and within the 95% confidence interval of the bootstrap results (N = 1000). No significant shrinkage phenomenon was detected when the shrinkage value for any parameter was less than 11% (Supplemental Figure S1). As a result, there are no misleading modeling diagnoses based on individual-predicted concentrations or residuals.
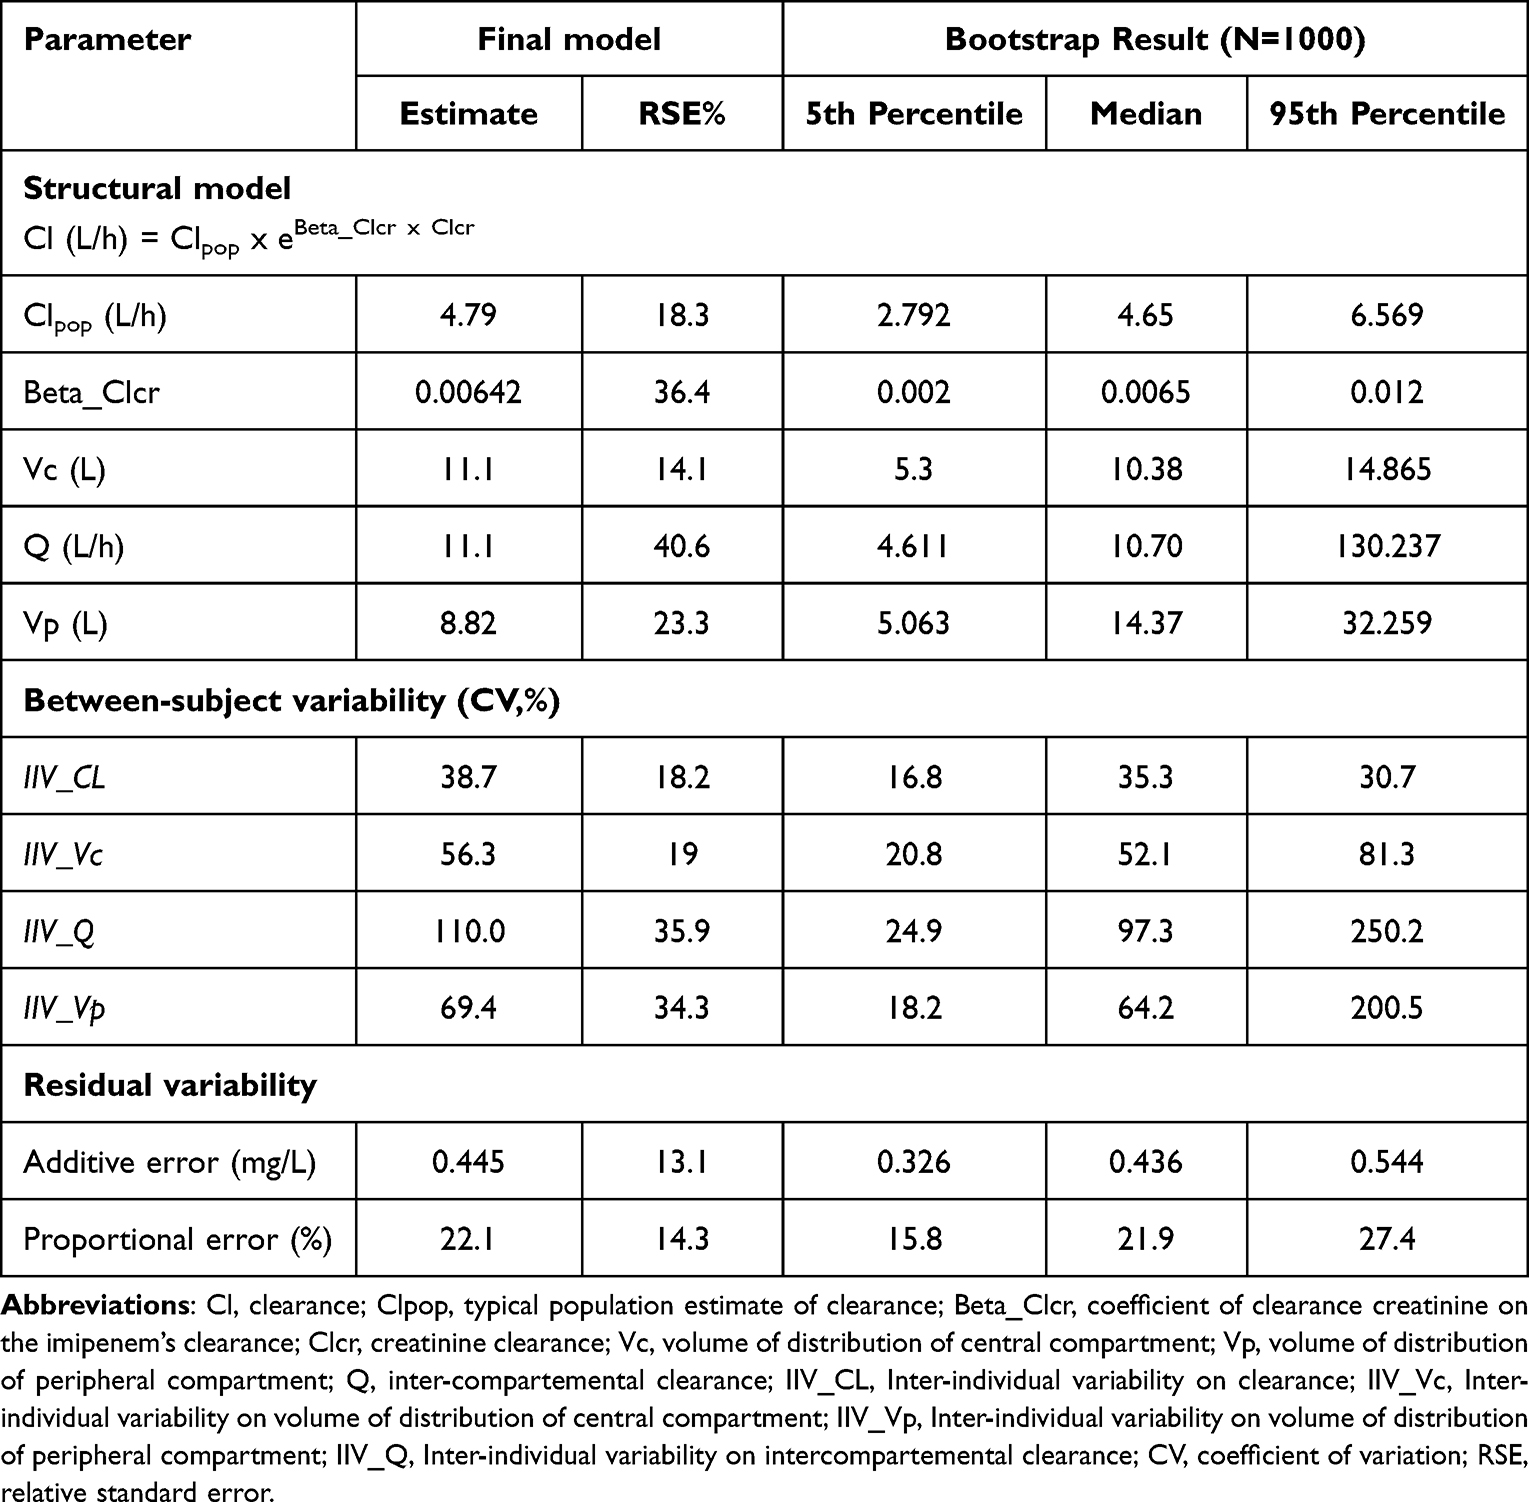 |
Table 2 Parameter Estimates of Final Population Pharmacokinetic Model for Imipenem |
Model Validation
Scatter plots of the population predicted and individual predicted imipenem concentrations are shown in Figure 1. Population predicted concentrations had a close bond with observed concentrations, even more so when random effects were taken into the plot of individuals’ predicted concentrations. Data was evenly distributed about the line of identity, indicating an appropriate structural model could be found for most patients.
 |
Figure 1 GOF plots of final models showing observed versus population predicted concentration (A), observed vs individual predicted concentration (B). |
Individual weighted residuals (IWRES) and Normalized Prediction Distribution Error (NDPE) plots showed no significant bias in Figure 2. The data are consistently distributed around zero, and most points vary between −2SD and +2SD in these plots of IWRES vs time after dose, demonstrating that there is no significant bias in the structural model. Apart from that, there was no significant bias in the residual error model in the plots of IWRES vs population-predicted concentration. The distribution of NPDE is well-confirmed by the fact that it follows a typical normal distribution [0,1] for most points.
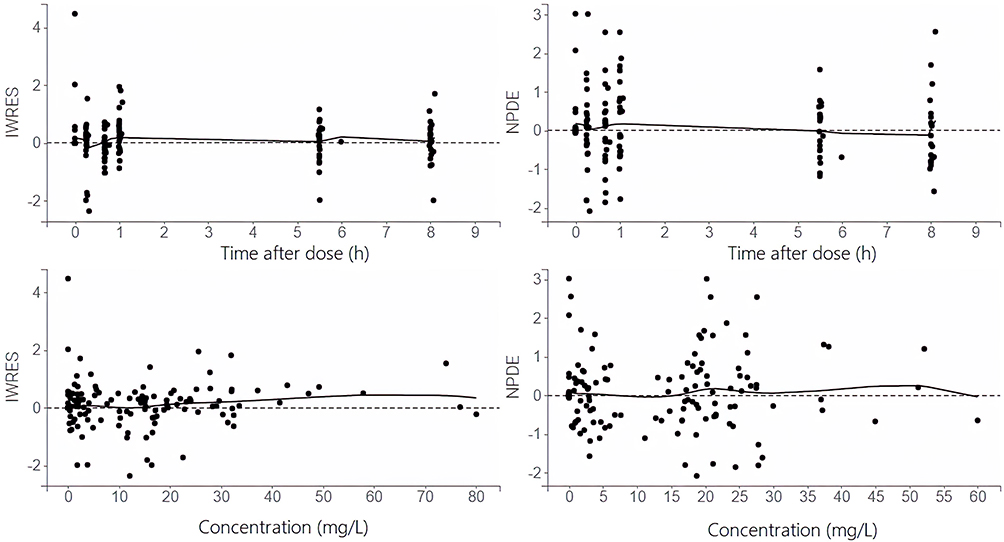 |
Figure 2 Scatter plot of the residuals: Individual weighted residuals (IWRES), seen on the left-hand side of the figure, versus time after dose (top) and concentration (bottom); Normalized Prediction Distribution Error (NDPE, 1000 replicates), seen on the right-hand side of the figure, versus time after dose (top) and concentration (bottom). |
The final model was used to simulate 1000 replicates of the original data set. Visual Predictive Check (VPC, 1000 simulations) results supportive of the model in that the median of the simulated predictions tracks very well with the median of the observed data across the entire dosing interval, and the 90% prediction interval is also fairly consistent with the corresponding percentiles based on the data (Figure 3). According to these data, VPC plots provide a clean view that the final pop-PK model was well fitted and sufficient to describe the pharmacokinetics in this population.
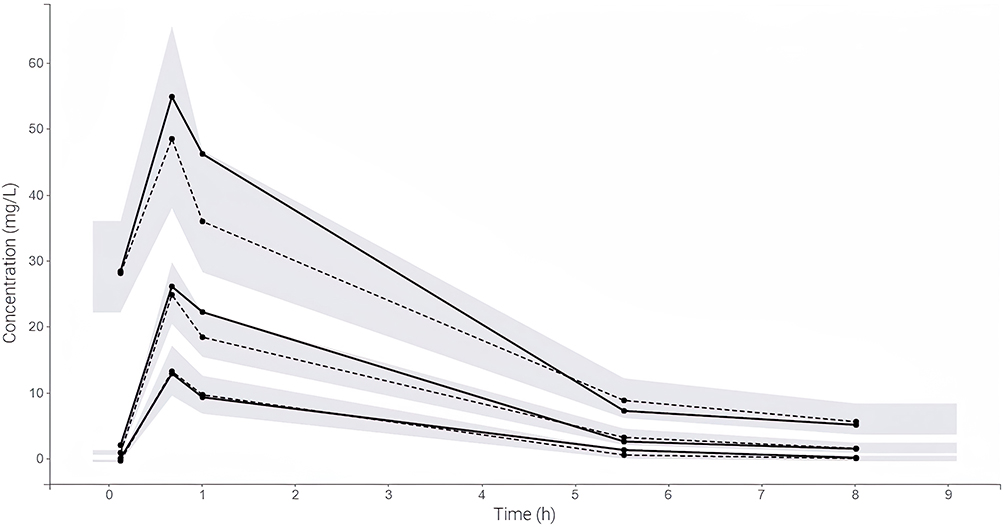 |
Figure 3 Visual Predictive Checks of observed imipenem concentrations (solid line) along with 10th, 50th and 90th percentiles overlaid on median (dashed line) and 90% prediction intervals (shaded region) of simulated concentrations generated from final model (1000 replicates). |
Monte Carlo Simulations and Dose Optimization
Figure 4 illustrates PTA values for various imipenem dose regimens using targets of 40% and 100% T>MIC. Simulations were performed and stratified based on patient renal function: <30, 30–60, 60–90, and >90 mL/min. A shorter dosing interval achieved higher PTA with the same daily dose. When targeting 100% T>MIC or high MIC values, a shorter dosing interval or continuous infusion (CI) increased the chance of obtaining 90% of PTA. A regimen of 3g imipenem per day (as a 3-hour prolonged infusion of 0.5 g every 4 hours or continuous infusion of 3g daily) was proposed against pathogens with a MIC of 4mg/L (resistant breakpoint for Enterobacteriace, intermediate breakpoint for Pseudomonas aeruginosa or Acinetobacter spp. according to CLSI 2018) in order to achieve a target of 100% T>MIC in critically-ill patients. No practical imipenem dosage regimen could cover highly resistant pathogens with MIC equal to or greater than 32 mg/L.
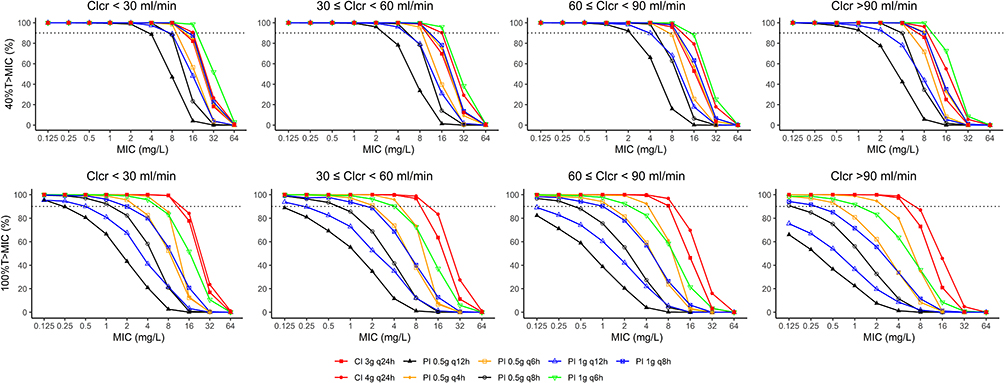 |
Figure 4 Probability of target attainment (PTA) of various imipenem dose regimens with a target of 40% (upper panels) and 100%T>MIC (lower panels), stratified based on patient renal function: <30, 30–60, 60–90, and >90 mL/min. |
Based on the results of our simulations and the selection of our model, dosing regimen recommendations were suggested as the most appropriate dosing strategy (Supplemental Table S1).
Discussion
The POP-PK model of imipenem in Vietnamese patients was developed using 139 concentrations from 24 patients in the ICU and general internal medicine department of Phu Tho general hospital. The two-compartment structural model with first-order elimination in our final model was consistent with results from earlier research on healthy people as well as patients with severe nosocomial pneumonia, patients with ventilator-associated pneumonia, and patients with severe pneumonia.3,7–9 Another model which was published for chronic obstructive pulmonary Vietnamese patients based on sparse data with only 2 samples per patient used a one-compartment structural model.4 In contrast, the rich sampling program includes 06 samples optimized by PFIM software, which was chosen to conduct our study. As a result of this sampling technique, the POP-PK obtained will be more accurate in describing the population and make fewer biased predictions than some studies due to biased sample methods (e.g, trough-only sampling).10
In general, the hydrophilic nature of imipenem makes it sensitive to changes in the distribution of body fluids. Thus, its volume of distribution is affected by all disorders increasing the extracellular compartment, such as sepsis or clinically revealed edema.16 However, we have not found an increase in the volume of distribution in our patient population. Our study calculated that the distribution volumes of the center compartment (Vc) and the peripheral compartment (Vp) were 11.1 L and 8.82 L, respectively. These findings are similar to those obtained in healthy persons (16–22 L), patients with ventilator-associated pneumonia (20.78 L),11 and patients with hospital-acquired pneumonia (18.39 L).8
The typical value of imipenem clearance in the population was calculated to be 4.79 L/h, and only Clcr was kept in the final model as a covariate on imipenem clearance: 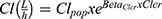 . Overall, the imipenem clearance in the study was lower (7.4 L/h, value adjusted by the covariates) than that in healthy subjects (ranged from 10.5 to 12.6 L/h).7,12 The lower imipenem clearance seen in our study might be explained by the characteristics of a large number of elderly patients with impaired renal function, including two patients with exceptionally low Clcr (9 and 18 mL/min).
Our study evaluated the ability to achieve PK/PD target of commonly used dosing regimens in current practice in Viet Nam. For example, according to the Vietnam Respiratory Society’s recommendation for HAP/VAP treatment, the recommended dosage regimen is 0.5g/6h imipenem as a prolonged infusion. According to the results of our study, this dosing regimen has a low probability of achieving PK/PD when the MIC is equal to or greater than 8 mg/L. In the context of the increasing rate of carbapenem-resistant Gram-negative organisms, these results emphasized a big challenge that infectious disease physicians in Viet Nam are facing. The findings in our study also suggest that the appropriate optimization methods should be done in the area of treating pathogens with reduced susceptibility to carbapenem, such as using doses that are higher than the recommendation in drug labels, using continuous infusion instead of prolonged infusion, or using polymyxin-based regimens. In Viet Nam, our model is also the first model with a full sampling program design optimized according to PFIM. Therefore, the simulation results will be more accurate and more persuasive to the doctors when applying.
The findings of our PK/PD simulations reveal that increasing the infusion duration or dosing frequency per day (with the same total dosage per day) raises the PTA value, most notably in the continuous infusion regimen. This finding is consistent with the characteristics of imipenem as a time-dependent antibiotic, and has also been demonstrated in prior investigations.8,9 Using a continuous infusion regimen was also recommended in
Optimization of the treatment with beta-lactam antibiotics in critically- ill patients—guidelines from the French Society of Pharmacology and Therapeutics and the French Society of Anaesthesia and Intensive Care Medicine
as a way to optimize T>MIC of b-lactam in critically-ill patients.13 However, due to imipenem chemical instability,15 continuous infusion of imipenem requires repeated preparation of a new infusion solution of imipenem every 3 hours in order to maintain the desired PK/PD of 100 T>MIC.14 Therefore, the continuous infusion regimen of imipenem is not yet widely practiced in clinical practice compared to prolonged regimens.
To optimize the infusion duration and dose interval required to accomplish the effect, we offer an imipenem dosing regimen based on renal function, the MIC value of isolated bacteria (ranging from sensitive to intermediate to resistant with extremely high MIC values), and the desired PK/PD’s goal (Supplemental Table S1). The suggested dose is the one that contains 90% of the PTA and has the lowest total daily dose. If the total dose/day for the two dosing regimens is the same, we chose the dose regimen with the simplest infusion (preferably a 3-hour infusion instead of a continuous infusion or a less frequent dosing regimen per day). The physician can use this table to select the optimal dosing regimen for each patient based on the bacteria’s MIC. An example: a regimen of 3g imipenem (3h-prolonged infusion of 0.5 g every 4 hours or continuous infusion of 3g daily) was proposed against pathogens with a MIC of 4mg/L (resistant breakpoint for Enterobacteriace, the intermediate breakpoint for Pseudomonas aeruginosa or Acinetobacter spp.– CLSI 2018) in order to achieve a target of 100% T>MIC in critically-ill patients. No dosing regimen has been found to maximize PK/PD at MIC 32 mg/L; thus, doctors should use alternative regimens instead of imipenem.
The limitation of the study was that the Monte Carlo simulation in our study to derive PK/PD characteristics did not use the local MIC distribution data. In the near future, we hope this model will be integrated with the local MIC distribution data at our hospital and other facilities with similar patient characteristics to design an imipenem dosing regimen in each institution.
In conclusion, a population pharmacokinetic model of imipenem for Vietnamese adult patients with severe illness was established. The recommended dose was determined by Monte Carlo simulation using the final model and the bacterial MIC value. More research is needed to evaluate whether imipenem dosing regimens can achieve PK/PD targets against pathogenic bacteria obtained from locally infected individuals.
Authors’ Information
Ba Hai Le: PharmD., PhD., Department of Clinical Pharmacy, Hanoi University of Pharmacy, Hanoi, Vietnam (ORCID number: 0000-0003-3301-1374).
Ethical Approval
Ethical approval was obtained from Phu Tho general hospital’s ethics committee, according to certificate 01/CN-HDKH, December 28th, 2016. Written informed consent was obtained from the patient or their appointed legal guardian.
Acknowledgments
The authors appreciate all patients participating in this study. We would like to express our deep gratitude to Professor Joseph CICCOLINI, Professor Florence GATTACCECA (SMARTc: Simulation & Modelling: Adaptive Response for Therapeutics in Cancer, Aix Marseille University-France), who provided valuable comments and scientific guidance in these final steps to complete this article. We are grateful to Professor Jenifer LE’s (University of California, San Diego) groups for their assistance in editing this paper.
Disclosure
The authors report no conflicts of interest in this work; the authors have no relevant financial or non-financial interests to disclose.
References
1. Yoshizawa K, Ikawa K, Ikeda K, Kumon H, Ohge H, Morikawa N. Optimisation of imipenem regimens in patients with impaired renal function by pharmacokinetic-pharmacodynamic target attainment analysis of plasma and urinary concentration data. Int J Antimicrob Agents. 2012;40(5):427–433. doi:10.1016/j.ijantimicag.2012.06.011
2. Chen W, Zhang D, Lian W, et al. Imipenem population pharmacokinetics: therapeutic drug monitoring data collected in critically Ill patients with or without extracorporeal membrane oxygenation. Antimicrob Agents Chemother. 2020;64(6):6. doi:10.1128/AAC.00385-20
3. Couffignal C, Pajot O, Laouenan C, et al. Population pharmacokinetics of imipenem in critically ill patients with suspected ventilator-associated pneumonia and evaluation of dosage regimens. Br J Clin Pharmacol. 2014;78(5):1022–1034. doi:10.1111/bcp.12435
4. Nguyen TM, Ngo TH, Truong AQ, et al. Population pharmacokinetics and dose optimization of ceftazidime and imipenem in patients with acute exacerbations of chronic obstructive pulmonary disease. Pharmaceutics. 2021;13:4. doi:10.3390/pharmaceutics13040456
5. Legrand T, Chhun S, Rey E, et al. Phạm. Developing a method for the quantitative determination of three carbapenem antibiotics in plasma by HPLC. Pharm Res Drug Inform. 2004;1:12–16.
6. Lavielle M. mlxR: simulation of longitudinal data. Available from: http://simulx.webpopix.org.
7. Dreetz M, Hamacher J, Eller J, et al. Serum bactericidal activities and comparative pharmacokinetics of meropenem and imipenem-cilastatin. Antimicrob Agents Chemother. 1996;40(1):105–109. doi:10.1128/AAC.40.1.105
8. Suchankova H, Lips M, Urbanek K, Neely MN, Strojil J. Is continuous infusion of imipenem always the best choice? Int J Antimicrob Agents. 2017;49(3):348–354. doi:10.1016/j.ijantimicag.2016.12.005
9. Sakka SG, Glauner AK, Bulitta JB, et al. Population pharmacokinetics and pharmacodynamics of continuous versus short-term infusion of imipenem-cilastatin in critically ill patients in a randomized, controlled trial. Antimicrob Agents Chemother. 2007;51(9):3304–3310. doi:10.1128/AAC.01318-06
10. Wicha SG, Märtson AG, Nielsen EI, et al. From therapeutic drug monitoring to model-informed precision dosing for antibiotics. Clin Pharmacol Ther. 2021;109(4):928–941. doi:10.1002/cpt.2202
11. Jaruratanasirikul S, Wongpoowarak W, Jullangkoon M, Samaeng M. Population pharmacokinetics and dosing simulations of imipenem in serious bacteraemia in immunocompromised patients with febrile neutropenia. J Pharmacol Sci. 2015;127(2):164–169. doi:10.1016/j.jphs.2014.12.003
12. Drusano GL, Standiford HC, Bustamante C, et al. Multiple-dose pharmacokinetics of imipenem-cilastatin. Antimicrob Agents Chemother. 1984;26(5):715–721. doi:10.1128/AAC.26.5.715
13. Guilhaumou R, Benaboud S, Bennis Y, et al. Optimization of the treatment with beta-lactam antibiotics in critically ill patients-guidelines from the French Society of Pharmacology and Therapeutics (Société Française de Pharmacologie et Thérapeutique-SFPT) and the French Society of Anaesthesia and Intensive Care Medicine (Société Française d’Anesthésie et Réanimation-SFAR). Crit Care. 2019;23(1):104. doi:10.1186/s13054-019-2378-9
14. Prescott WA
15. Sornsuvit C, Wientong P, Uitrakul S, Okonogi S, Katip W. Influence of concentration and temperature on stability of imipenem focused on solutions for extended infusion. Dose-Response. 2021;19(4):155932582110593. doi:10.1177/15593258211059325
16. Pea F, Viale P, Furlanut M. Antimicrobial therapy in critically ill patients: a review of pathophysiological conditions responsible for altered disposition and pharmacokinetic variability. Clin Pharmacokinet. 2005;44(10):1009–1034. PMID: 16176116. doi:10.2165/00003088-200544100-00002
17. World Medical Association. World Medical Association Declaration of Helsinki: ethical principles for medical research involving human subjects. JAMA. 2013;310(20):2191–2194. PMID: 24141714. doi:10.1001/jama.2013.281053
 © 2022 The Author(s). This work is published and licensed by Dove Medical Press Limited. The
full terms of this license are available at https://www.dovepress.com/terms
and incorporate the Creative Commons Attribution
- Non Commercial (unported, 3.0) License.
By accessing the work you hereby accept the Terms. Non-commercial uses of the work are permitted
without any further permission from Dove Medical Press Limited, provided the work is properly
attributed. For permission for commercial use of this work, please see paragraphs 4.2 and 5 of our Terms.
© 2022 The Author(s). This work is published and licensed by Dove Medical Press Limited. The
full terms of this license are available at https://www.dovepress.com/terms
and incorporate the Creative Commons Attribution
- Non Commercial (unported, 3.0) License.
By accessing the work you hereby accept the Terms. Non-commercial uses of the work are permitted
without any further permission from Dove Medical Press Limited, provided the work is properly
attributed. For permission for commercial use of this work, please see paragraphs 4.2 and 5 of our Terms.