Back to Journals » International Journal of Nanomedicine » Volume 18
Polyvinyl Alcohol (PVA)-Based Nanoniosome for Enhanced in vitro Delivery and Anticancer Activity of Thymol
Authors Abdihaji M, Mirzaei Chegeni M, Hadizadeh A, Farrokhzad N, Kheradmand Z, Fakhrfatemi P, Faress F, Moeinabadi-Bidgoli K, Noorbazargan H, Mostafavi E ![]()
Received 29 January 2023
Accepted for publication 21 June 2023
Published 27 June 2023 Volume 2023:18 Pages 3459—3488
DOI https://doi.org/10.2147/IJN.S401725
Checked for plagiarism Yes
Review by Single anonymous peer review
Peer reviewer comments 2
Editor who approved publication: Professor Lijie Grace Zhang
Mohammadreza Abdihaji,1,* Masoumeh Mirzaei Chegeni,2,* Alireza Hadizadeh,3 Negar Farrokhzad,4 Zahra Kheradmand,5 Parastoo Fakhrfatemi,6 Fardad Faress,7 Kasra Moeinabadi-Bidgoli,8 Hassan Noorbazargan,9 Ebrahim Mostafavi10,11
1Department of Biology, The Center for Genomics and Bioinformatics, Indiana University, Bloomington, IN, USA; 2Department of Biology, Science and Research Branch, Islamic Azad University, Tehran, Iran; 3Research Center for Advanced Technologies in Cardiovascular Medicine, Cardiovascular Diseases Research Institute, Tehran University of Medical Sciences, Tehran, Iran; 4Faculty of Biology, Medicine and Health, University of Manchester, Manchester, UK; 5Department of Agriculture, Islamic Azad University Maragheh Branch, Maragheh, Iran; 6Faculty of Pharmacy, Shiraz University of Medical Sciences, Shiraz, Iran; 7Department of Business, Data Analysis, The University of Texas Rio Grande Valley (UTRGV), Edinburg, TX, USA; 8Basic and Molecular Epidemiology of Gastroenterology Disorders Research Center, Shahid Beheshti University of Medical Sciences, Tehran, Iran; 9Department of Biotechnology, School of Advanced Technologies in Medicine, Shahid Beheshti University of Medical Sciences, Tehran, Iran; 10Stanford Cardiovascular Institute, Stanford University School of Medicine, Stanford, CA, USA; 11Department of Medicine, Stanford University School of Medicine, Stanford, CA, USA
*These authors contributed equally to this work
Correspondence: Ebrahim Mostafavi, Email [email protected]; [email protected]
Introduction: There is an unmet need to develop potent therapeutics against cancer with minimal side effects and systemic toxicity. Thymol (TH) is an herbal medicine with anti-cancer properties that has been investigated scientifically. This study shows that TH induces apoptosis in cancerous cell lines such as MCF-7, AGS, and HepG2. Furthermore, this study reveals that TH can be encapsulated in a Polyvinyl alcohol (PVA)-coated niosome (Nio-TH/PVA) to enhance its stability and enable its controlled release as a model drug in the cancerous region.
Materials and Methods: TH-loaded niosome (Nio-TH) was fabricated and optimized using Box–Behnken method and the size, polydispersity index (PDI) and entrapment efficiency (EE) were characterized by employing DLS, TEM and SEM, respectively. Additionally, in vitro drug release and kinetic studies were performed. Cytotoxicity, antiproliferative activity, and the mechanism were assessed by MTT assay, quantitative real-time PCR, flow cytometry, cell cycle, caspase activity evaluation, reactive oxygen species investigation, and cell migration assays.
Results: This study demonstrated the exceptional stability of Nio-TH/PVA at 4 °C for two months and its pH-dependent release profile. It also showed its high toxicity on cancerous cell lines and high compatibility with HFF cells. It revealed the modulation of Caspase-3/Caspase-9, MMP-2/MMP-9 and Cyclin D/ Cyclin E genes by Nio-TH/PVA on the studied cell lines. It confirmed the induction of apoptosis by Nio-TH/PVA in flow cytometry, caspase activity, ROS level, and DAPI staining assays. It also verified the inhibition of metastasis by Nio-TH/PVA in migration assays.
Conclusion: Overall, the results of this study revealed that Nio-TH/PVA may effectively transport hydrophobic drugs to cancer cells with a controlled-release profile to induce apoptosis while exhibiting no detectable side effects due to their biocompatibility with normal cells.
Keywords: herbal anticancer drug, thymol, cancerous cell lines, pH-dependent release, niosome, polyvinyl alcohol, apoptosis
Graphical Abstract:

Introduction
Cancer is a prominent cause of death and a significant impediment to extending life expectancy and its treatment is a global challenge.1,2 Currently, major focus areas of cancer therapy are chimeric antigen receptor (CAR) T cell therapy,3 cell-based and biologics-based immunotherapy,4,5 as well as traditional chemotherapy and radiation-based treatments. In parallel to these approaches, medicinal herbs have also been investigated for their anti-cancer properties.6–8 Availability, ease of scale-up, and potential engineering methods to obtain more potent and less toxic structures are among the favorable aspects of herbal medicine. Another beneficial facet of herbal medicine compared to classical chemotherapy is its limited acute or chronic toxic side effects.9,10
Although known to be less toxic, herbal medicine could be overdosed systematically to achieve appropriate pharmacodynamics, leading to unwanted toxicities. In addition, sustained release of therapeutic herbals is generally desired since it can address the low bioavailability of herbal medicine, mainly originating from their hydrophobic nature. A chemical therapeutic procedure faces various obstacles, including drug resistance and extreme side effects.11 Therefore, we need novel, more effective, selective, and less toxic alternative therapeutics not just for cancer prevention but also for cancer treatment. In this study, we focused our attention on a designed treatment for the three most common cancer cell lines; MCF-7 (breast cancer), AGS (stomach cancer), and HepG2 (liver cancer).
Thymol (2-isopropyl-5-methylphenol) is a significant phenolic component, a natural monoterpenoid, found in numerous plants’ essential oils, notably Thymus vulgaris. According to various experimental models, TH and its derivatives have been shown to inhibit cell growth, induce apoptosis, producing intracellular reactive oxygen species, depolarize mitochondrial membrane potential, activate the proapoptotic mitochondrial proteins, interact with cysteine aspartases (caspases), or interact with poly ADP ribose polymerase.12,13 Herbal compounds are generally hydrophobic and also not stable in the body, and they should be protected by carriers.14 Therefore, the advantages of nanoparticle (NP)-based drug delivery systems, including excellent pharmacokinetics, accurate tumor cell targeting, reduced side effects, and drug resistance are desirable.15–19
Niosomes, non-ionic surfactant-based vesicles that exhibit extraordinary behavior in encasing both hydrophilic and hydrophobic compounds, have attracted a great deal of interest in the pharmaceutical industry.20–22 These vesicles have recently been discovered to boost drug bioavailability and may function as a new technique for delivering several types of therapeutic agents, with minimal toxicity and outstanding targeting efficiency.23–25 Niosomes are considerably more stable during the formulation and storage procedure than liposomes. Surface modification or component optimization can be used to achieve the desired pharmacokinetic qualities.26,27 In this study, we implemented a novel technique in niosome formulation by utilizing Vitamin E instead of the cholesterol, and the addition of polyvinyl alcohol (PVA) which increased the stability, specificity of targeted delivery, and controlled release of the drug. Vitamin E has hydrophobic properties and attaches to the hydrophobic heads of lipids of the niosomes. As a result, hydrophobic heads may start to move toward each other, reducing the size of the niosomes. Also, TH can react from the hydrophobic part with vitamin E, resulting in improved loading efficiency. PVA is a semicrystalline biodegradable synthetic polymer that has been employed in biomedical applications for several years. PVA has long been utilized in the pharmaceutical industry to prepare solid dispersions which improve drug solubility. In addition, in vitro and in vivo research have shown that PVA is non-toxic and highly biocompatible.28 In 2018, Amiri et al delivered a synthetic chemotherapeutic drug to lung cancer cell lines using niosomes. The goal of the study was to improve the therapeutic effectiveness of vinblastine by using drug delivery systems, and the results showed that niosomes, a drug carrier, are crucial for enhancing physiochemical characteristics and therapeutic efficiency.29 The same cell lines as this study’s (ie MCF-7 and HepG2) were employed by Baranei et al in 2021 to deliver anticancer herbal drugs via niosomes. The aim was to design and introduce a new, stable plasma, pH-sensitive niosomal (Nio) formulation of green tea extract (GTE) and it was concluded that niosomes will improve bioavailability and strengthen GTE’s cytotoxic effect.30 Nevertheless, both span 60/40 and cholesterol were utilized in the synthesis of niosome. In contrast to others, this study was innovative in that it used vitamin E rather than cholesterol.
Although the delivery of Thymol via nanocarriers has been researched in the past, there is no proof that Thymol is delivered using niosomes. Taherkhani et al in 2021 have studied the application of Janus Magnetic Nanoparticle Fe3O4@SiN functionalized with beta-cyclodextrin in thymol drug delivery procedure;31 however, only in vitro studies were conducted, no bioassays were performed, and the primary focus was on the characterization of the nanoparticle. Although polymeric nanoparticle modified by oleic acid (NPMO) was employed in another work by Karimi et al in 2019,32 it was primarily focused on the angiogenic effects on rat’s olfactory ensheathing cells and it was concluded that in higher concentrations, the encapsulated thymol had shown more toxicity and resulted in increased the production of ROS. As a result, no publication has examined the cytotoxicity of thymol when it is formulated with niosomes. Moreover, niosomes were coated with PVA in this work for a more controlled release, improved biocompatibility, and stability, and there is no prior literature evidence of coating niosomes with PVA.
Based on the above reasons, the purpose of this study was to develop a niosome containing Vitamin E and Span 60 with a PVA coat and load it with TH, an herbal anticancer drug. This novel formulation of niosome enhances the loading efficiency and drug release in order to be used as a nano-carrier for topical cancer treatment. The vehicle was characterized by DLS, TEM and SEM. The effect of the anticancer drug was studied through in vitro tests on MCF-7, AGS, and HepG2 as cancer cell lines and HFF as a normal cell line.
Materials and Methods
Materials
For detailed materials see SI.
Optimization of Niosomal Formulations Using Response Surface Methodology
Response surface methodology (RSM) was used for optimization of niosomal formulations via a Box–Behnken method. To investigate the relationship between a set of independent variables and the dependent variables by fitting the data using a polynomial equation, three numerical parameters (Lipid (µmol), Hydration time (min), and Vitamin E: Span 60 (molar ratio)) were selected to study the impact of them on niosomal particle size (nm), polydispersity index (PDI), and entrapment efficacy percentage (EE %). The polynomial equation was obtained using Design-Expert software (Version 10.0.10, Stat-Ease, Inc., Minneapolis, MN, USA). The best-fitted model for the statistical analysis was considered significant when P-value<0.05 and the equations of the most accurate model were achieved.8 Data optimization was performed to obtain the smallest particle size and PDI and the highest EE%. Table S1 represented these factors and their levels.
Synthesis of Niosomal Formulations
Niosomes loaded with Thymol (Nio-TH) were prepared using the thin-layer film hydration technique.33,34 Briefly, Thymol, and lipids (The amount of lipid in three levels 200, 250, and 300 µmol) containing Vitamin E and Span® 60 (mol ratio of Vitamin E: Span 60 in three levels 0.5, 1, and 2) were dissolved in 9 mL of chloroform/methanol (2:1; v/v). The solution was transferred to a 250 mL round bottom flask. The organic solvent was evaporated under vacuum via a rotary evaporator (Heidolph Instruments, Schwabach, Germany) at 60 °C and 150 rpm for 30 min until a thin dried film was formed in the bottom of the flask. The thin film was rehydrated using PBS (1X, 10 mL, pH 7.4). The reactants were subsequently dried at 60 °C and 150 rpm for 30, 45, and 60 min to obtain dried specimens. Subsequently, the niosomal suspensions were sonicated by probe sonicator (UP50H compact laboratory homogenizer, Hielscher Ultrasonics, Teltow, Germany) for 7 min to ensure that the Nio-TH had an optimal size distribution. The specimens were kept at 4 °C for characterization of the different niosomal formulations listed in Table 1.
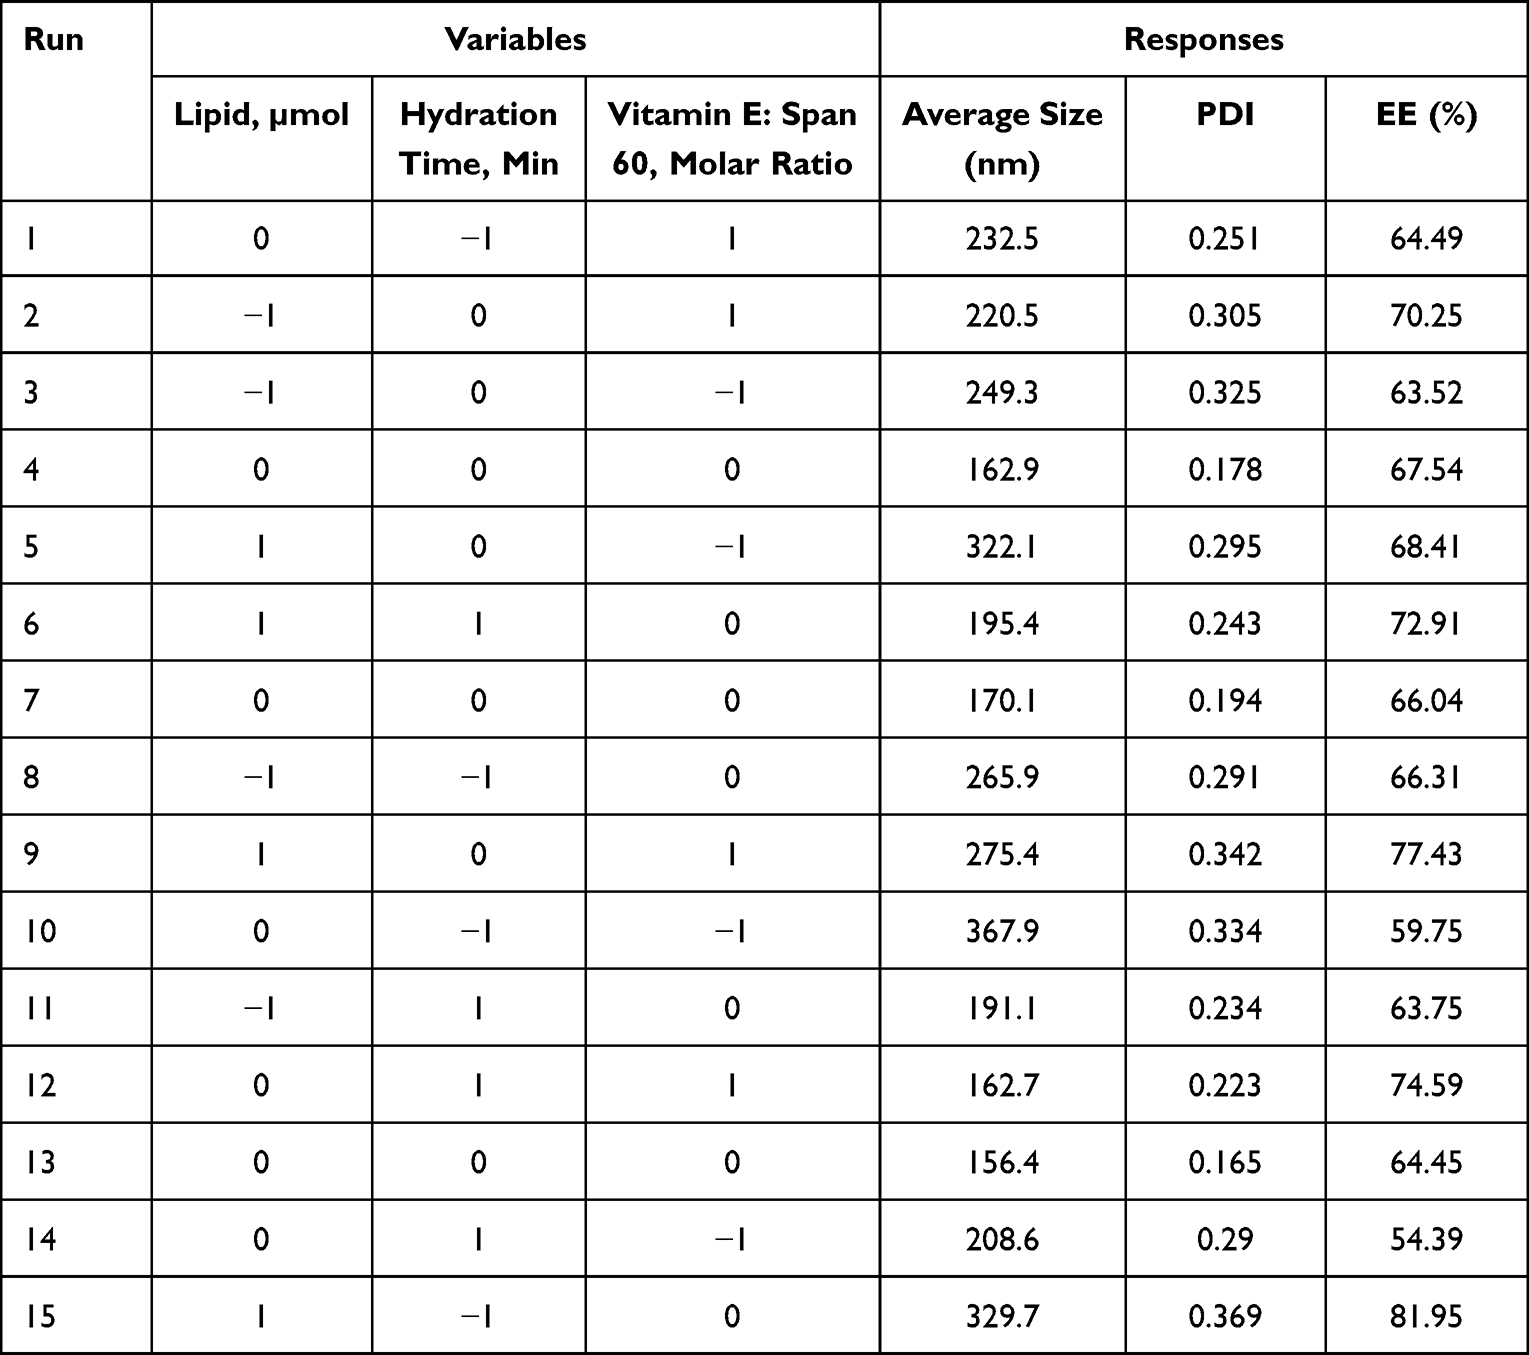 |
Table 1 Optimization of Nio-TH Using Box–Behnken Method |
Surface Functionalization of the Optimized Niosomal Formulation
Functionalized thymol loaded niosomes (Nio-TH/PVA) were made in the same way, but after the final step, Polyvinyl alcohol (PVA) were added to the Nio-TH. Niosomes coated with PVA (Nio-TH/PVA) was prepared by mixing 0.5 mg PVA into the optimized niosomal formulation (Nio-TH) and sonicating for 15 min. The sonicated solution was homogenized for 10 min at 12,000 rpm.35–37
Characterization of the Synthesized Niosomes
Size, Polydispersity Index (PDI), and Zeta Potential
The dynamic particle diameter and size distribution were determined by the dynamic light scattering method (DLS), using a computerized inspection system (Zetasizer, HAS 3000; Malvern Instruments, Malvern, United Kingdom) at 25°C and 633 nm wavelength.
Morphology
Morphology of Nio-TH and Nio-TH/PVA was visualized by using a transmission electron microscope (TEM, Zeiss EM900 Transmission Electron Microscope, Germany, accelerating voltage of 80 kV), and Scanning Electron Microscope (SEM, NOVA NANOSEM 450 FEI model). The sample for TEM observation was prepared by placing few drops of optimized samples dispersion onto a 300-mesh carbon-formvar grid and allowed 2 minutes to absorb. Then the extra liquid is removed by filter paper. Next, the grade was washed and stained with ten drops of 2% uranyl acetate. For imaging by SEM, a thin layer of gold or graphite is deposited on the surface to make the surface conductive, and fine samples spread on a conductive film such as aluminium and thoroughly dried.
Entrapment Efficacy
The niosomal formulations were ultra-filtered (Eppendorf® 580R centrifuge, Hamburg, Germany) at 4000×g for 20 min using an Amicon Ultra-15-membrane at 4°C. The non-entrapped TH was separated from entrapped TH to determine the percentage entrapment efficacy (EE%). The niosomes containing drug remained in the top chamber during filtering, while free drugs passed through the filter membrane. The free drug concentration was calculated at 260 nm using a UV-Visible light spectrophotometer (UV-1700 PharmaSpec, Shimadzu, Kyoto, Japan). The following equation was used to calculate EE%.38

Where (A) denotes the initial TH concentration for niosomal preparation and (B) denotes the concentration of non-entrapped TH after centrifugation.
In vitro Drug Release and Kinetic Study
The release of TH from Nio-TH and Nio-TH/PVA was investigated using in vitro dialysis. To begin, 2 mL of each sample (The concentration of thymol in free form, as well as Nio-TH and Nio-TH/PVA, was considered 0.5 mg/mL) was placed in a 12 kDa dialysis membrane and placed in 50 mL of PBS-SDS (0.5% w/v; release medium) solution at 37°C with stirring at pH = 5.4 and 7.4. (50 rpm) for 72 h. At a specific time (1, 2, 4, 8, 24, 48, and 72 h), 1 mL of the release medium was withdrawn and replenished with the same volume of fresh PBS-SDS.39 The amount of released drug at pre-determined intervals was estimated at 260 nm using an ultraviolet light spectrophotometer. The test was repeated using a free drug as control, in which the drug concentration was equivalent inside and outside the dialysis bag.
Different mathematical models were used to evaluate the release kinetics of TH from the samples: the Korsmeyer-Peppa model (log cumulative % drug release vs log time), the Higuchi model (cumulative % drug release vs square root of time), first-order model (cumulative % drug remaining vs time) and zero-order model (cumulative % drug release vs time).40
Stability
The Nio-TH and Nio-TH/PVA samples (suspension) were stored at 25 ± 1°C (room temperature) or 4 ± 1°C (refrigeration temperature), at 60 ± 5% relative humidity for two month. After storage, the samples were analyzed for particle size, PDI, and percentage of drug remaining at certain time intervals (0, 30 and 60 days) for evaluation of the stability of the formulations. The samples were maintained undisturbed (no shaking or mixing) for the stability test.
Culture of MCF-7, AGS, HepG2 and HFF Cell Lines
The MCF-7, AGS, HepG2 and HFF cell lines were purchased from Pasteur Institute Cell Bank (Tehran, Iran) and cultured at 37 °C in an atmospheric supplemented with 5% CO2. The culture medium consisted of RPMI-1640 fresh medium supplemented with 10% FBS and 1% penicillin/streptomycin (complete growth medium). The medium was aspirated after the cells reached 85–95% confluence. Detachment of the cell monolayer was performed using 0.25% (w/v) trypsin-EDTA. A complete growth medium was used for resuspend the detached cells, which were then labeled trypan blue and counted using a hemocytometer.
Cell Viability
The cytotoxicity and viability of the drug delivery system were evaluated using the MTT assay on three different cancer cell lines (MCF-7, AGS, and HepG2) and one normal cell line (HFF). The cells (2 × 10⁵ cells per well) were seeded onto 96-well culture plates and treated with various concentrations (0, 10, 20, 40, 80 and 160 μg/mL) of TH, Nio-TH, and Nio-TH/PVA for 48 h. The HFF cell line was used as a control and exposed to the same concentrations of the drug delivery system as well as different dilutions of the vehicle. After 48 h of incubation, the cells were incubated with 0.5 mg/mL of MTT for another 4 h. The MTT assay is based on the reduction of the yellow tetrazolium salt MTT to purple formazan crystals by the mitochondrial dehydrogenases of viable cells. The formazan crystals were then dissolved in 100 μL of DMSO and the absorbance was measured at 570 nm using a microplate reader. The absorbance reflects the oxidoreductase enzymatic activity of the cells, which is proportional to their viability and proliferation. Quantification was performed using the formula:
Percentage cell viability (%) = Optical Density 570 treatment/Optical Density 570 control × 100%
Quantitative Real-Time Polymerase Chain Reaction (qRT-PCR)
MCF-7, AGS, and HepG2 cancer cells (1 × 10⁸ cells per well in 96-well plate) were treated with IC50 concentration of Vehicle, TH, Nio-TH, and Nio-TH/PVA for 48 h. Ice-cold RNX TM–PLUS solution was added to tubes containing the treated cells, vortexed, and incubated at room temperature for 5 min. Chloroform was then added to the tubes. After incubating the cells on ice for 5 min, the samples were centrifuged at 12,000 rpm at 4 °C for 15 min. The contents were transferred to RNase-free 1.5 mL tubes that contained an equal volume of isopropanol and centrifuged. The pellet of extracted RNA was re-suspended in 75% ethanol, re-centrifuged, and resuspended in diethylpyrocarbonate (DEPC)-treated H2O.
Complementary DNA (cDNA) was prepared from the extracted RNA by adding 10 μL of reaction buffer (2X), 5 μg of the extracted RNA, 2 μL of Enzyme-Mix to enough DEPC-treated water in RNase-free tubes to make up 20 μL of solution. The mixture was incubated for 10 min at 25 °C and 60 min at 47 °C. The reaction was stopped by heating at 85 °C for 5 min and the mixture was kept on ice until use.
The primers for Caspase 3, Caspase 9, MMP-2, MMP-9, CyclinD, CyclinE, and ß-actin were designed using the National Center for Biotechnology Information database. Forward and reverse primer sequences for the aforementioned genes are listed in Table S2. The qRT-PCR was performed with the sense and antisense primers using a 7500 Real-time PCR System (Applied Biosystems, Carlsbard, CA, USA). ß-actin was used as the housekeeping gene. The 2–ΔΔCT method was used to determine fold changes relative to the control group. Experiments were conducted in triplicate.
Flow Cytometry
The induction of apoptosis in MCF-7, AGS, and HepG2 cells by the drug delivery system was assessed using flow cytometry assay. The cells were cultured and exposed to the IC50 concentration of Vehicle, TH, Nio-TH, and Nio-TH/PVA for 48 h. Then, the cells were harvested and washed twice with PBS. The cell suspension was adjusted to 5 ×10⁵ cells/mL (seeded onto 6-well) in 1X binding buffer. The Apoptosis Quantitation Kit was employed to stain the cells with annexin V-FITC and propidium iodide. Annexin V-FITC binds to phosphatidylserine on the surface of apoptotic cells and emits green fluorescence. Propidium iodide penetrates the compromised membranes of necrotic cells and intercalates with DNA, emitting red fluorescence. The stained cells were analyzed using a benchtop flow cytometer (FACSCalibur, D Biosciences, Franklin Lakes NJ, USA) to determine the percentage of apoptotic and necrotic cells in each sample.
Cell Cycle
Evaluation of cell proliferation was estimated utilizing propidium iodide (PI) staining. The binding of PI to DNA is proportional to the DNA content, which is used to determine the cell cycle stage. Cells were seeded at a density of 1×10⁶ cells per well in complete medium in 6-well plates and incubated overnight. After plating and washing the cells three times with PBS, then they were treated with the drug-loaded patches for 48 hours in complete medium. After incubation, the cells were detached and fixed with 70% cold ethanol overnight at 4°C, then stained in the dark for 20 minutes at room temperature with 500μL of PI solution (including RNase) and evaluated by flow cytometry. This procedure was repeated three times. All of these experiments were conducted using IC50 concentration.
Caspase Activity Evaluation
The activity of Caspase-3 and Caspase-9 enzymes, which play a crucial role in the apoptotic pathway, was assessed by employing the enzyme-linked immunosorbent assay (ELISA) technique. This technique enables the detection and quantification of specific molecules in a liquid sample by utilizing antibodies that specifically recognize them and enzymes that catalyze a colorimetric reaction. The protocol supplied by the manufacturer of the ELISA kits (Roche, Germany) was strictly adhered to by the researchers. Samples from three distinct cancer cell lines (MCF-7, AGS, HepG2) that were exposed to a particular concentration of a drug (IC50) that was anticipated to trigger apoptosis were applied by them. The impact of the drug was evaluated by contrasting the enzyme activity in the exposed samples with the control sample.
Reactive Oxygen Species
The culture of both types of cancer cells, namely MCF-7, AGS, and HepG2 was carried out by placing coverslips inside a 4-well plate that contained RPMI-1640 medium, which is a nutrient-rich solution that supports the growth of cells. After the culture process was completed, the cells were incubated with a fluorescent dye called 2′,7′-dichlorodihydrofluorescein diacetate (H2DCFDA) at a temperature of 37 °C for a duration of 30 minutes. This dye is used to measure the level of reactive oxygen species (ROS) in the cells, which are molecules that can cause oxidative stress and damage. The cells were then washed with a solution of buffered saline, which is a salt solution that maintains the pH and osmolarity of the cells, and subsequently treated with different compounds, namely Vehicle, TH, Nio-TH, and Nio-TH/PVA, for 48 hours. The cells were washed again in phosphate-buffered saline (PBS), which is another salt solution that stabilizes the cells, before being incubated for another 30 minutes at 37 °C with 80 mM of H2DCFDA. This was done to measure the change in ROS level after the treatment. A microplate reader was used to determine the fluorescence intensity at a wavelength of 530 nm. This intensity reflects the amount of ROS in the cells, which indicates the level of oxidative stress and cell death.
Cell Migration
The effect of the drug delivery system on cell migration and invasion was evaluated using the scratch assay. The MCF-7, AGS, and HepG2 cells were cultured until they reached 70% confluence. Then, a sterile 200 μL pipette tip was used to create a linear “wound” across the cell monolayers. The cells were washed with serum-free culture medium to remove any detached cells. The wounded cell monolayers were incubated with IC50 concentration of Vehicle, TH, Nio-TH, and Nio-TH/PVA for 48 h. After the incubation period, the cells were washed with PBS and observed under a microscope. The images of the scratched area were captured and analyzed using the Image Processing and Analysis Java (ImageJ) software (National institutes of health, Bethesda, MD, USA). The extent of cell migration and invasion was quantified by measuring the area of open scratch in each image.
DAPI Staining
The nuclear morphology of apoptotic cells was investigated using DAPI staining. MCF-7, AGS, and HepG2 cells were plated onto a 24-well plate and exposed to the IC50 concentration of formulations for 48 h. The MCF7 and 4T1 cells were then fixed with 4% paraformaldehyde. The cells were then washed in PBS and permeated for 10 minutes with 0.1% Triton X-100. The cells were stained with DAPI for 10 minutes after being washed in PBS. Ultimately, the cell morphologies were studied using an Olympus IX81 inverted fluorescence microscope with a DP72 digital camera (Olympus, Hamburg, Germany).41
Statistical Analysis
For detailed statistical analysis see SI.
Results and Discussion
Optimization of Niosomal Formulations Using Box–Behnken Method
We first attempted to optimize the formulation by modeling and verifying the design outputs. We simulated the interdependent impact of three numerical parameters ie, the content of lipid (A), the hydration duration (B), and the molar ratio of Vitamin E: Span60 (C) on an average size, PDI, and EE for the optimization process. According to Table 1, which displays the output of the Box–Behnken trials, niosomal formulations’ average size ranges from 156.4 nm to 367.9 nm, PDI varies between 0.165 and 0.369 and the EE% in Nio-TH ranges from 54.39% to 81.95%. Figures 1A and S1A and B represent the 3D surface plot of the average size of Nio-TH. Figure S1A shows that an increase in the lipid content leads to a slight decrease in average size followed by an increase, whereas the average size is inversely related to hydration duration. Figure 1A displays how average size is a function of lipid content and the Vitamin E: Span60 ratio. Lipid content slightly reduces the average size but higher lipid contents eventually increase the average size. Size is inversely proportional to the molar ratio of Vitamin E: Span60. Figure S1B illustrates the impacts of hydration duration and the molar ratio of Vitamin E: Span60, where both parameters are inversely related to the average size. Figures 1B and S1C and D demonstrate the 3D response surface plot of PDI of niosomal formulations. Figure S1C shows how lipid content and the hydration duration affect polydispersity index (PDI), where the lipid content initially had a reducing effect on PDI but, with its further increase, PDI increases whereas hydration duration decreases the PDI. Figure 1B demonstrates lipid content and the molar ratio of Vitamin E: Span60 initially reduces PDI followed by increasing the PDI. Figure S1D indicates a reduction in PDI with the increase in hydration duration, and shows that the molar ratio of Vitamin E: Span60 decreases PDI up to a certain point, after which the higher molar ratio increases the PDI. Figures 1C and S1E and F illustrate the 3D response surface plot of entrapment efficiency in Nio-TH as a function of lipid content, the molar ratio of Vitamin E: Span60, and hydration duration. Figure S1E represents the increase in EE% with increasing lipid content and a reduction in EE% with increasing hydration duration. Figure 1C shows a rise in EE% by increasing lipid content and the molar ratio of Vitamin E: Span60. Figure S1F represents that as the duration of hydration increases, EE% decreases, but an increase in the Vitamin E: Span60 ratio elevates EE%. In summary, lipid content is directly proportional to average size, PDI, and EE%, whereas the hydration duration is inversely related to these three factors. Also, the higher the Vitamin E: Span60 molar ratio the lower the average size and PDI, and the higher the EE%.
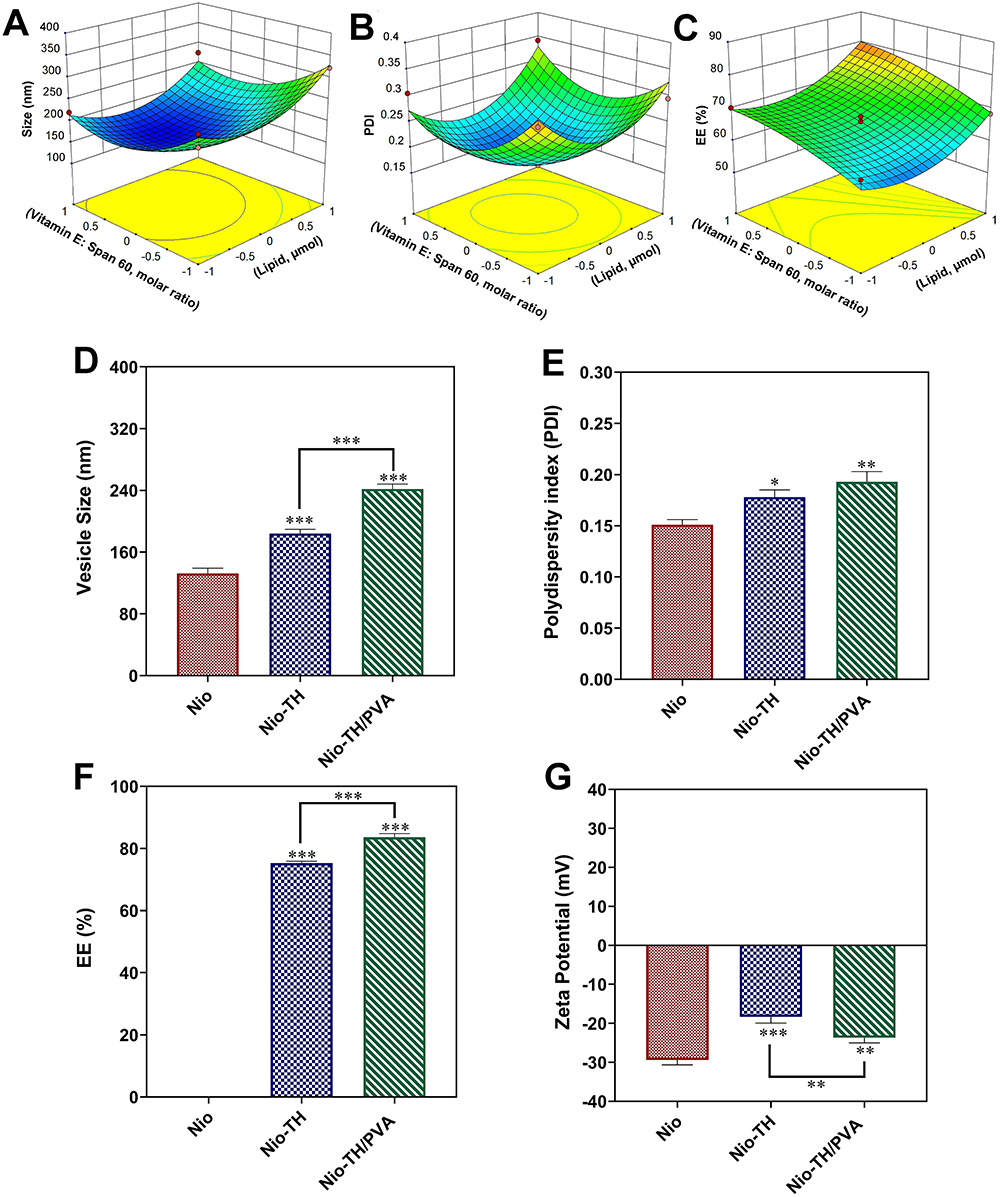 |
Figure 1 (A–C) Box–Behnken method for size (A), PDI (B), and EE (C) as a function of the lipid content and molar ratio of Vitamin (E) Span 60; (D–G) The optimized responses obtained by Box–Behnken design method under the optimum conditions: (D) Vesicle size, (E) PDI, (F) EE (%), and (G) Zeta potential. Data are represented as mean ± SD and n=3; ***p<0.001, **p<0.01, *p<0.05. |
An increase in the lipid content could expand the bilayer, which leads to the increase in the average size of the niosome.42 This increase in turn could elevate the EE% where more content could be loaded.43 Longer hydration duration could compromise the integrity of the niosomes structure, which may lead to the outward secretion of the drug, and reduction in the size and EE%.44 The higher amount of Vitamin E could reduce the niosome size, since the hydrophobic–hydrophobic interaction between the Vitamin E and lipid tails may shrink the niosome. Hydrophobic sections of TH could interact with vitamin E, which leads to an increase in the amount of TH loading. It has been shown that the formulations’ vesicle sizes grew by increasing the lipid amount, resulting in the vesicle’s physical stability and the rigidity of its membrane.45 Another explanation would be that an extended number of bilayers may be used to absorb vitamin E. Moreover, the niosomal size declines with increased hydration time, which may be caused by the breakdown of the vesicular structure and drug leakage from the vesicles as hydration time increases.44 It is crucial to consider the method by which the cholesterol was integrated with the bilayer membrane to explain the increased particle size of niosomes with increasing cholesterol (Vitamin E) concentration. Since cholesterol (Vitamin E) is amphipathic, it will enter the bilayer membrane via its hydrophilic head directed towards the aqueous layer and its aliphatic chain is arranged parallel with the center of the hydrocarbon chains forming the bilayer. Cholesterol (Vitamin E) is thought to give rise to the liquid-state order of the bilayer chain and improve the non-ionic nonpolar tail of the surfactant.46 Low cholesterol (Vitamin E) concentrations cause surfactant monomers to pack tightly together, which increases curvature and causes size reduction. Yet, increasing the amount of lipophilic cholesterol (Vitamin E) and reducing the amount of non-ionic surfactant may grow the hydrophobicity of the bilayer membrane, rupture the vesicular membrane, increase the vesicle radius, and create a more thermodynamically stable state.47 To clarify the elevated particle size of niosomes with enhancing vitamin E content, it is necessary to consider the process by which the vitamin E was integrated with the bilayer membrane. Since vitamin E is amphipathic, it will enter into the bilayer membrane via its hydrophilic head directed towards the aqueous layer and its aliphatic chain arranged parallel with the center of the hydrocarbon chains of the bilayer.46 At low vitamin E concentrations, vitamin E-induced surfactant monomers pack closely together, leading to increased curvature and size shrinkage. However, raising vitamin E content, which is a lipophilic structure, and reducing non-Ionic surfactant content may improve bilayer membrane hydrophobicity and disrupt the vesicular membrane, therefore, increasing vesicle radius and establishing a more thermodynamic stable state.48
The PDI demonstrates particle size uniformity and criterion to check the size distribution.49 The PDI value is between 0 and 1, and homogeneity increases as the number approaches zero. Particles with more uniformity have a narrower size distribution and less aggregation.50 In Table 2, the analysis of variance for the average size is shown. The response was a quadratic model, and p-value <0.05 was defined as the threshold of significance. The average size was affected by all 3 variables. Table 3 demonstrates the results from the regression analysis of size, which shows a significant inverse relation between the average size and variables B and C and significant proportional relation between variable A and the average size of vesicles. These results are also evident in Figures 1A and S1A and B. Moreover, the formation of reduced negative charge in niosomes with an increase in lipid molecules accounts for the increase in PDI with growing in the lipid value. As a result, nanoparticles have a greater propensity to aggregate, which raises the PDI value.51
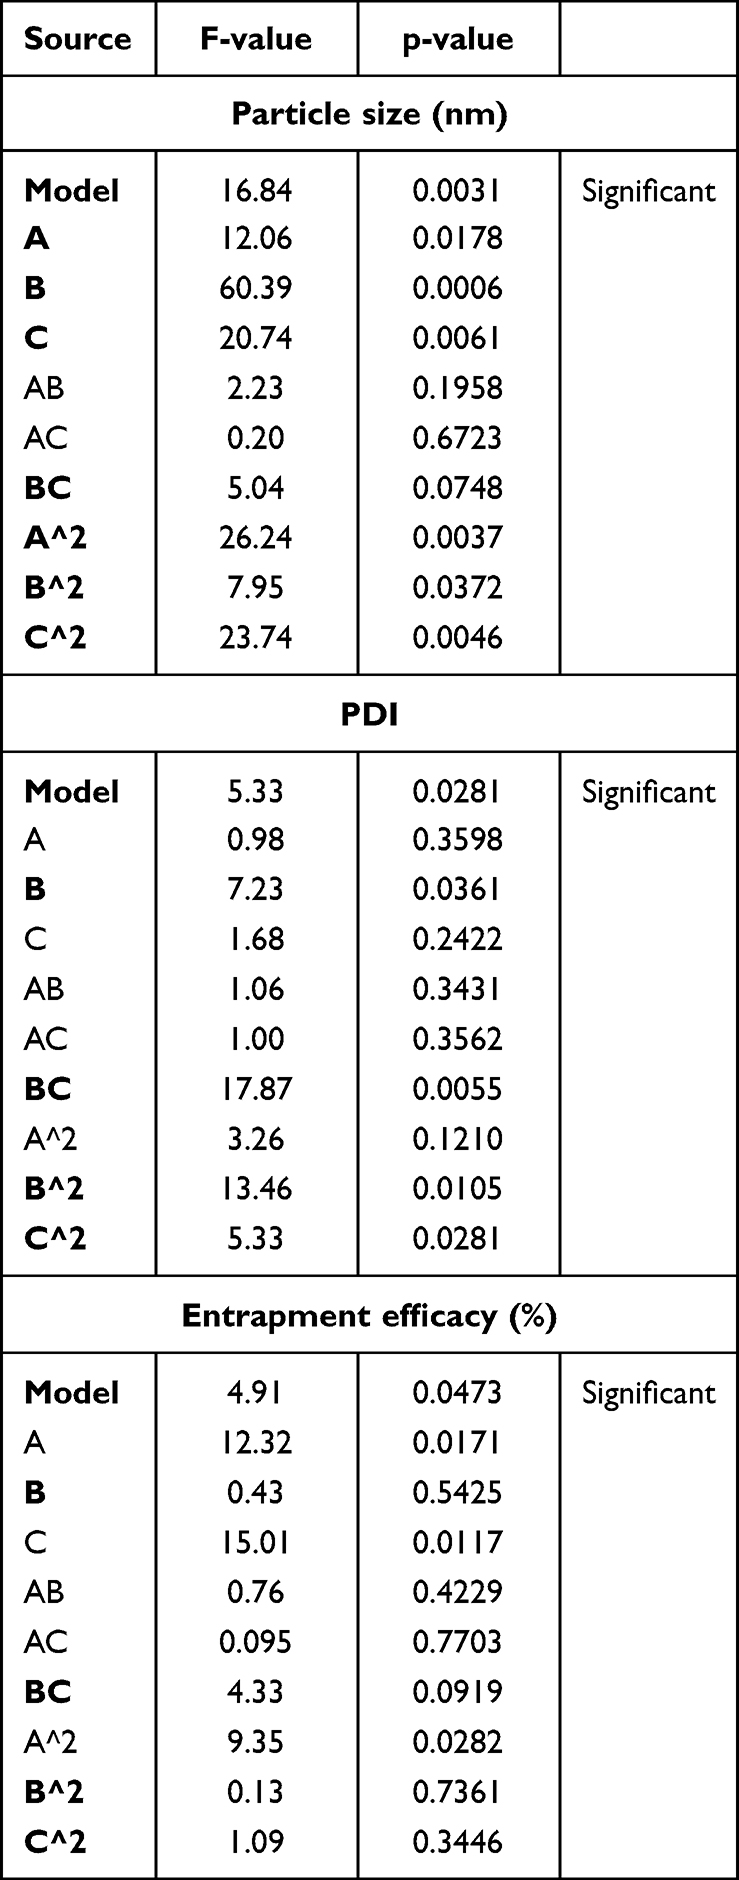 |
Table 2 ANOVA Statistical Analysis for the Quadratic Polynomial Model for Particle Size, PDI, and Entrapment Efficiency |
 |
Table 3 Predicted Models of Nio-TH |
The ANOVA analysis for PDI is provided in Table 2. As demonstrated, variations in PDI are dependent on lipid content, Vitamin E/Span60 ratio, and hydration duration as independent variables. PDI was significantly affected by variable B, and it is likewise visible in Figures 1B and S1C and D, and the quadratic model’s F-value was substantial. Table 3 indicates the predicted model for PDI based on the regression analysis. Variable A is a positive coefficient; therefore, the PDI value as the dependent variable increases with an increase in variable A, while PDI decreases with enhancement in variables B and C (Figures 1B and S1C and D).
Table 2 shows the statistical analysis data of entrapment efficiency in niosomal formulations. Variables A and C had a crucial effect on EE%. According to Table 3, which illustrates regression analysis results for EE%, it is evident that variables A and C remarkably affected EE% and augmented it; however, variable B is inversely proportional to EE%, Figures 1C and S1E and F also proves these results. The results demonstrated that rising lipid content is associated with a significant rise in EE%. The percentage of encapsulation efficiency increases and the niosomal membrane becomes less permeable when the amount of surfactant cholesterol (Vitamin E) is increased.52 Increasing the surfactant concentration also enhances the entrapment performance. The capacity to effectively entrap hydrophobic molecules in bilayers as the vesicles mature was further diminished by an increase in the cholesterol content (Vitamin E), which can be ascribed to an improvement in bilayer hydrophobicity and stability that lowers bilayer permeability.53 Furthermore, the findings demonstrated that the quantity of EE% rose linearly as cholesterol (Vitamin E) content decreased, which is consistent with earlier research and most likely arises from cholesterol intercalation in the bilayer structure.54 Niosome hydrophobicity, stability, and permeability increase while cholesterol (Vitamin E) levels rise, resulting in the effective encapsulation of hydrophobic drugs into the bilayer structure of the vesicle. As the amphiphiles assemble into vesicles, more cholesterol (Vitamin E) might compete with the drug for encapsulation in the bilayer, resulting in excluding the drug.55 Another study contends that the linear structure of the vesicular membrane can be disrupted by an increase in cholesterol (Vitamin E) over a specific concentration, leading to a drop in EE% with an increase in cholesterol (Vitamin E) to a certain amount.56 The entrapment performance also improved by increasing surfactant content. Furthermore, a rise in the vitamin E content reduced the entrapment efficiency which can be attributed to an increased vitamin E variable which improved the bilayer hydrophobicity and stability while decreasing bilayer permeability, resulting in effective entrapment of hydrophobic molecules in bilayers as the vesicle developed.57
The quadratic model was significant due to the notable F-value. To be sure that this model could be used to negative the design space, the signal/noise ratio was measured with adequate accuracy. Desired values were obtained for all three responses (ratio greater than 4). To evaluate the values of the predicted responses, the predicted R-squared was calculated. For this purpose, the model’s predictive power was evaluated by the degree of proximity of predicted R-squared values to Adj R-squared values. A logical agreement can be seen from the two R-squared in all the responses (Table 4).
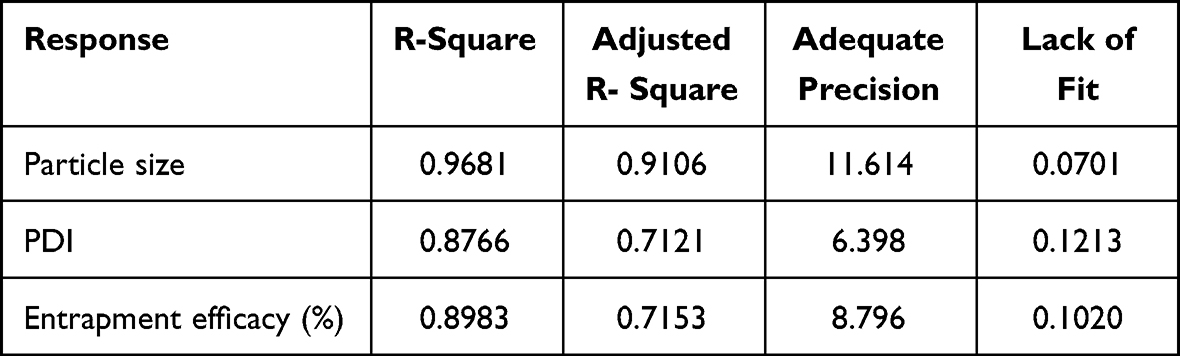 |
Table 4 Summary of the Results of Regression Analysis for the Various Parameters (Size, PDI, and Entrapment Efficiency) Employed for Fitting to the Quadratic Model |
The optimization process of niosomal formulations was specified based on desirability criteria in which lipid content, hydration time, and Vitamin E: Span60 values were 282 µmol, 43.70 min, and 40:60, respectively. This process was performed efficiently (Table 5). RSM projection for an average size, PDI, and EE% was 199.747 nm, 0.228, and 73.183%, respectively.
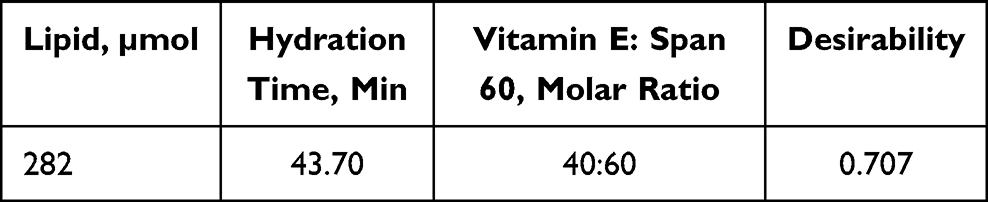 |
Table 5 Desirability Criteria and Predicted Values for the Variables |
Experimental data was obtained from desirability criteria, and the identified response was compatible with Box–Behnken predictions (Table S3). Accordingly, the optimized formulation was applied for the later experiments. The average size enlarged from 184.17 nm to 241.93 nm, PDI increased from 0.178 to 0.193, EE% raised from 75.32% to 83.64%, and zeta potential changed from −18.35 mv to −23.64 mv (Table S3). Figure 1D–G indicates a statistical comparison of Nio/PVA, Nio-TH, and Nio-TH/PVA. Figure 1D compares these samples in terms of size. The average size of the niosome without TH was about 133.13 nm which increased to 184.17 nm and 241.93 nm after drug loading and PVA coating, respectively. This increase in average size after TH loading can be due to the penetration of TH to the core and the niosome’s bilayer, which leads to more space in the bilayer and reduces the surface tension of niosomes.58,59 A larger average size after coating can indicate the formation of a polymer layer on the surface of the niosomes.60 The p-value of this increase was less than 0.001, so it was significant. Figure 1E illustrates the statistical changes in the PDI of these three samples. The size distribution enhanced after drug loading and PVA coating from about 0.15 to 0.178 and 0.193, respectively. PDI was considered appropriate as it remained less than 0.2.
The zeta potential comparison of niosomal vesicles is shown in Figure 1G. The zeta potential indicates the degree of repulsion between nanoparticles with the same charge and is related to the degree of aggregation and stability.61 The absolute zeta potential value of the free niosome was about 29 mv, which by TH loading decreased to 18.35 mv. The absolute zeta potential value with a p-value of less than 0.01 increased by coating PVA on Nio-TH to 23.64. This increase can be attributed to the similar charge that PVA coating adds to the niosomes. An increase in surface charge leads to stronger repulsive forces between particles as shown by higher absolute zeta potential and prevents aggregation which retains vesicles stability.62 Figure 1F provides a comparison of EE% between TH-loaded niosome and TH-loaded niosome coated with PVA. After coating, EE% increased from 75.32 to 83.64. The p-value was <0.001, so changes were considered notable. This increase may be due to that PVA coating leads to augmentation in active hydroxyl groups on the surface of the niosomes and results in more interactions between TH and vesicle.63 Also, adding PVA increases the concentration and viscosity of the solution, which can lead to more efficient trapping of TH.64
Characterization of the Synthesized Niosomes
Size, Polydispersity Index (PDI), and Zeta Potential
We then studied the size and PDI of optimized Nio-TH and Nio-TH/PVA using DLS. After coating, the size of the niosomes changed from 184.17 ± 5.40 nm to 241.93 ± 6.37 nm and PDI increased from 0.178 ± 0.007 to about 0.193 ± 0.010 (Figure 2A). The zeta potential of the empty niosome was about −29.40 ± 1.25, and drug loading and PVA coating changed it to −18.35 ± 1.58 and −23.68 ± 1.34, respectively (Figure 1G).
 |
Figure 2 (A) Particle size distribution of Vehicle (Nio/PVA), Nio-TH, and Nio-TH/PVA by Dynamic Light Scattering (DLS). (B and C) Morphological analysis by SEM; (B) optimum Nio-TH, (C) Nio-TH/PVA. (D and E) Morphological analysis by TEM. (D) optimum Nio-TH, (E) Nio-TH/PVA. |
Morphology
Scanning electron microscopy (SEM) and transmission electron microscopy (TEM) were used to conduct morphology analysis of optimum Nio-TH and Nio-TH/PVA. Figure 2B and C represent the SEM analysis of Nio-TH and Nio-TH/PVA, respectively. In both samples, it is observed that the morphology is homogeneous and aggregation artifacts are also visible. Both are roughly spherical in shape with smooth surfaces. The Nio-TH/PVA sample appears more porous than the Nio-TH sample, which may be due to the presence of PVA that raised stability and prevented compression. Figure 2D and E indicate the inner shape of Nio-TH and Nio-TH/PVA by TEM. They both have spherical or oval morphology, and PVA coating has increased the size of the niosomes (Figure 1D and 2A). Compared to the DLS results, both electron microscopies showed smaller sizes of the niosomes. One explanation is that dried particles are being measured in electron microscopy, while in DLS, hydrodynamic size is calculated as the particle size with each molecule that is adsorbed or attached to its surface, such as ions and water molecules.65,66 Similar observations have been reported elsewhere.67
In vitro Drug Release and Kinetic Study
We sought to understand the TH release profile from our niosome. Figure 3A illustrates the drug release profile of the free drug, optimized Nio-TH and Nio-TH/PVA at two pH values (5.4 and 7.4) for more than 72 h. We chose an acidic pH of 5.4 which is consistent with the pH of the tumor microenvironment. The release was performed at two stages according to the drug release profiles. At the first 8 h, the release began at a higher rate (a phenomenon also known as burst release), followed by a low or constant rate. The high release rate in the first 8 h could be partly due to drugs being released and sediment on the surface after saturation of the niosomes. In Nio-TH/PVA, the rapid release of drugs adsorbed to the polymer could be an additional reason for the higher burst release.62,68 The slower release rate in the secondary phase could be a consequence of resistance to digestion. More than 99% of the TH was cumulatively released within the 72 h of the experiment. For the optimal Nio-TH sample, we observed that over the first 8 h at pH 7.4, about 24.42% of the release occurred and this value reached 48.36% at the end of the experiment, while at pH 5.4, the release was 35.25% in the first 8 h and increased to 71.1% in 72 h. The same experiment was repeated for the Nio-TH/PVA sample, and the results indicate that at pH 7.4, 31.74% of TH gets released during the first 8 h, and increased to 38.74% within 72 h. At pH 5.4, 37.21% was released which increased to 44.56% by 72 h. In summary, a reduction in pH from neutral to acidic enhances the release of the drug. The hydrolysis rate of the surfactant is higher in acidic pH, which might compromise the structure of the niosome to enhance the drug release rate.69 PVA coating could reduce the release rate, as PVA creates a denser molecular network and a physical barrier for drug diffusion. An increase in PVA concentration also increases the active hydroxyl groups at the surface since hydroxyl groups have physical bonding with the drug. Collectively the PVA influence on drug release reduction can be supported by the mentioned attributes for PVA.63
 |
Figure 3 (A) In vitro release of TH from Nio-TH and Nio-TH/PVA at pH 7.4 and pH 5.4; (B and C) Size stability evaluation of Nio-TH (B), and Nio-TH/PVA (C); (D and E) PDI stability evaluation of Nio-TH (D), and Nio-TH/PVA (E); (F and G) EE (%) stability evaluation of Nio-TH (F), and Nio-TH/PVA (G) after two months of storage at 4 ± 2°C and 25 ± 2 °C. Data are represented as mean ± SD and n=3; ***P<0.001, **P<0.01, *P<0.05. |
To obtain the kinetics model of drug release at pH 7.4 and 5.4, four release models, Zero-order, First-order, Korsmeyer-Peppas, and Higuchi, were evaluated as listed in Table 6. In these kinetic modeling’s, R2 represents the coefficient of determination. R2 values closer to one indicate that the corresponding model fits the evaluated sample better. According to the results presented in the table, First-order kinetics was more appropriate for the release rate of free drug. For Nio-TH release at pH = 5.4, the Higuchi model with R2 = 0.9622 seemed more suitable The Korsmeyer-Pappas model was the most proper kinetics model for the Nio-TH sample at pH = 7.4 and the Nio-TH/PVA sample at both pH = 5.4 and pH = 7.4 with R2, 0.9389, 0.9411, and 0.9713, respectively. In the Korsmeyer-Pappas model, n represents the release exponent (related to the drug release mechanism), and n for all three samples which pursued the Korsmeyer-Pappas model was between 0.45 and 0.89; hence, the drug release mechanism is anomalous transport.70 AbuElfadl et al used niosomes coated with chitosan for Candesartan Cilexetil delivery.71 Akbarzadeh et al applied Curcumin-Loaded Niosome@calcium alginate nanocarrier for breast cancer treatment.68 In a study to provide concurrent improvement of sustained-release, curcumin loading efficiency, and apoptosis induction on MCF-7 breast cancer cells, the release kinetic from the fabricated pH-responsive niosomes was anomalous according to the Korsmeyer-Peppas model.14 In these studies, the model of Korsmeyer-Pappas was selected as the best-fitting model to define the release kinetics of drugs.
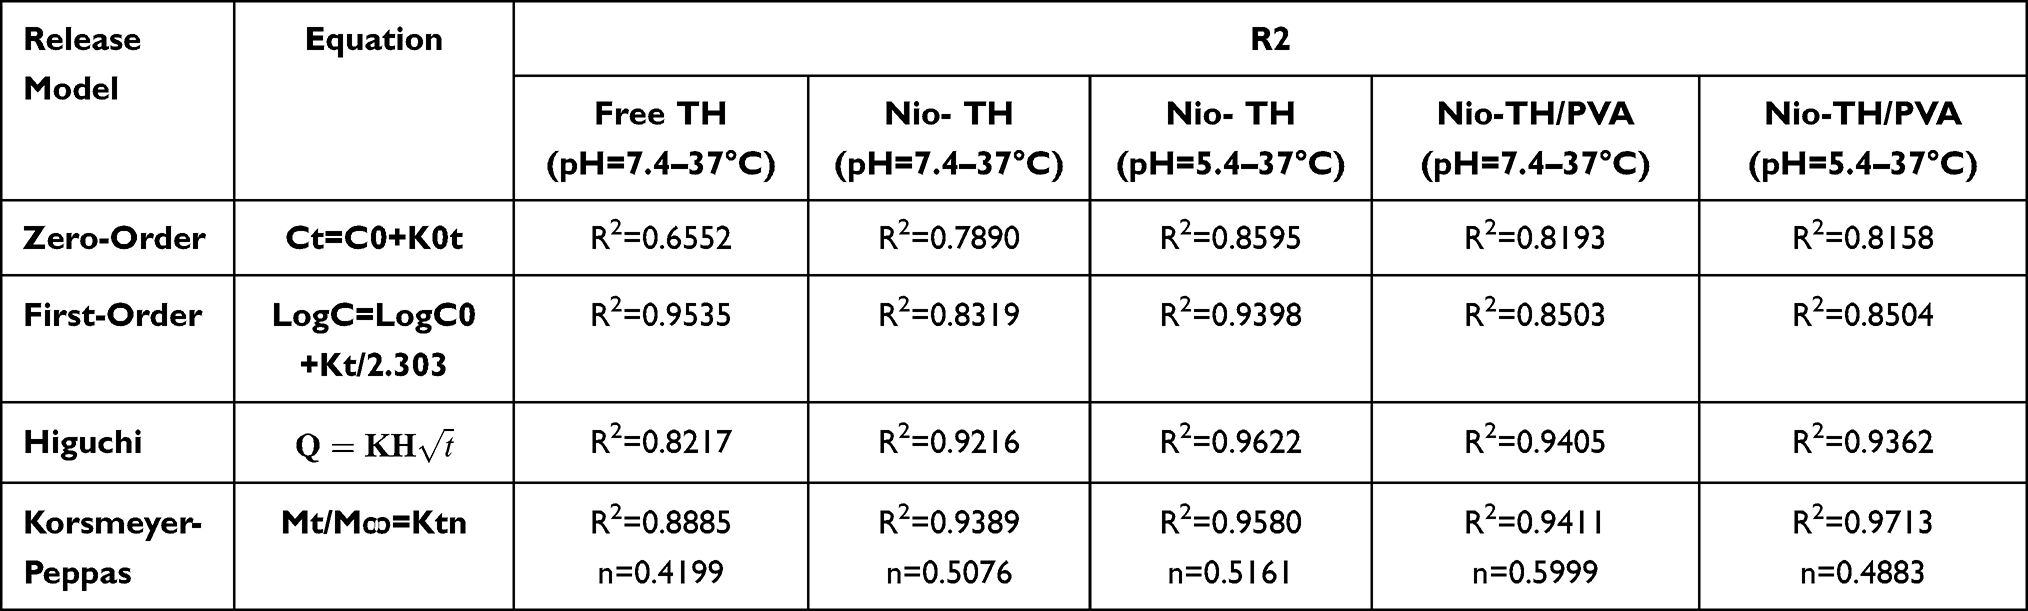 |
Table 6 The Kinetic Release Models and the Parameters Obtained for Optimum Niosomal Formulation |
Stability
The stability of optimum Nio-TH and Nio-TH/PVA was assessed by storing the samples at 4° C and 25° C and changes in average vesicle size, PDI, and EE% after 0, 14, 30, and 60 days were perused (Figure 3B–G). On the day of making the niosomal formulations, for Nio-TH vesicles, the size was 184.17 nm (minimum value), PDI was 0.178 (maximum value), and EE% was 75.32% (maximum value). For Nio-TH/PVA, the average size was 241.93 nm, PDI was 0.193, and EE% was 83.64%. The temperature did affect the rate of change of these parameters over time, up to two months. As the temperature increased, the average size of the particles’ pores enhanced, and as a result, the average size of the niosomes and PDI augmented. Also, increasing the average size of pores augmented the secretion of the drug out of the carrier. As a result, the amount of drug remaining in the niosomes was reduced, resulting in a reduction in EE%. The average size of Nio-TH at 25 °C finally increased by 126.73% after 60 days, while at 4 °C it augmented by 84.29%. The PDI of this formulation increased by 123.03% at 25 °C and 87.64% at 4 °C after this period. The percentage of EE also decreased by 20.46% at 25 °C and 14.03% at 4 °C. For Nio-TH/PVA at 25 °C, the average size and PDI raised by 72.6% and 103.62%, respectively, and at 4 °C by 39.89% and 61.65%, respectively. EE% at 25 °C diminished by 15.5%, and at 4 °C reduced by 10.85%. It is clear that niosomes represent more stability at lower temperatures, and this can be due to the stiffness of the hydrophobic portion of niosomes at lower temperatures.68, The reason for more changes in size, PDI, and EE% at 25 °C can be due to incidents that are noted in the following. At higher temperatures, the fluidity of lipid vesicles increases and causes more drug leakage from the carrier. With increasing fluidity, the fusion of vesicles enhances. During fusion, some large and unstable vesicles suffer from rupture, causing more outflow of drugs and a decrease in EE. Furthermore, at higher temperatures, the fatty acid chains of surfactants tend to take irregular structures so that the thickness of the bilayer reduces and the penetration rate of the membrane increases.72
More precisely, the average size of both niosomal samples had a significant increase after 14, 30, and 60 days. PDI variations for Nio-TH/PVA were considerable after 30 and 60 days, while for Nio-TH, only after 60 days, there were remarkable changes in PDI. Variations in entrapment efficiency percentages in both samples were striking after 30 and 60 days. Overall, Nio-TH@ PVA samples showed fewer alterations than Nio-TH sample, which could be due to higher zeta potential and higher electrostatic repulsion between particles in Nio-TH/PVA, which prevent aggregation.73
Cytotoxicity Evaluation
A prominent colorimetric method for assessing the preliminary cytotoxicity of both synthetic and natural compounds against a variety of cell lines is the 3-(4,5-Dimethylthiazol-2-Yl)-2,5-Diphenyltetrazolium Bromide (MTT) assay. To investigate the cytotoxicity of the as-developed candidate treatment in this study, MTT assay was used to calculate the IC50 value for cytotoxicity of the vehicle, TH, Nio-TH and the developed Nio-TH/PVA formulation against cancerous cell lines (ie, MCF-7, AGS and HepG2) and a non-tumorigenic cell line for control (ie, HFF). For this study, 2 × 10⁵ cells per well were seeded onto 96-well. In various dilutions (0, 10, 20, 40, 80 and 160 μg/mL) of Nio-TH/PVA on the HFF cell line, no significant change in viability was observed, supporting the safety of the fabricated Nio-TH/PVA platform for normal cells. Though in MCF-7 there was a significant decrease in cell viability at 1/4 and 1/2 (p < 0.05) and 1/1 dilution (p < 0.001). In AGS, cell viability decrease was in 1/2 (p < 0.05) and 1/1 dilution (p < 0.001) and in HepG2 there was a slight decrease in cell viability in 1/2 and 1/1 dilution (p < 0.05) (Figure 4A). On the non-cancerous cell line, HFF, all three samples led to a meaningful decrease at 80 and 160 μg/mL (p < 0.001) (Figure 4B). In the investigated cancerous cell lines, raising the concentration of the aforementioned samples significantly reduced cell viability in all samples as compared to the control (p < 0.001). In addition, the results indicate a greater reduction of cell viability in Nio-TH compared to TH and Nio-TH/PVA compared to Nio-TH in the three cancer cell lines at all concentrations (p < 0.001) (Figure 4C–E). At 160 μg/mL concentration, cell viability of Nio-TH/PVA treated sample was 92.7 ± 1.03% for HFF, while it was 10.88 ± 1.64% for MCF-7, 24.27 ± 1.77% for AGS and 39.64 ± 1.29% for HepG2 cell line. The IC50 results show that IC50 concentration in the Nio-TH/PVA group has decreased significantly compared to Nio-TH and TH in all three investigated cell lines (p < 0.001) (Table 7, and Figure 4F and G).
 |
Table 7 IC50 Levels in the Three Cancerous Cell Lines Treated with TH, Nio-TH and Nio-TH/PVA. Data are Represented as Mean ± SD and n=3 |
 |
Figure 4 Different concentrations of TH, Nio-TH, and Nio-TH/PVA (0, 10, 20, 40, 80 and 160 μg/mL) were added to the cultured MCF-7, AGS, HepG2 and HFF cells seeded onto 96-well (2×10⁵ cell/well) (A) The effect of different dilutions of Nio/PVA on cell viability in MCF-7, AGS, HepG2 and HFF cell lines. (B) Cytotoxicity evaluation of TH, Nio-TH and Nio-TH/PVA on HFF cell line. The impact of TH, Nio-TH, and Nio-TH/PVA on cell viability in (C) MCF-7, (D) AGS, (E) HepG2 cancerous cell lines. (F) Bar plot and (G) Heat-map of the IC50 levels in the three cancerous cell lines treated with nanodrug samples. Data are represented as mean ± SD and n=3; The p-values are *p < 0.05, **p < 0.01, ***p < 0.001. |
However, TH affected different types of tumor cell lines by having overlapping, inhibitory, and complementary effects on the cell mechanisms such as cell growth, apoptosis, or anti-oxidant activity. TH did not exhibit any substantial toxicity in the normal HFF cells line. Their selectivity towards cancer cells is therefore reasonable.74,75
Also, the niosomal formulation of drug molecules and the level of toxicity against the same order of cancerous cell lines were shown to be significantly correlated. Since niosomes have not been found toxic to cells in our prior research68 and some other studies,14,46,76 in which they served as vehicles to deliver drugs, we were able to choose them for this study as well. Particularly, empty niosomes developed with Span 60 have been reported to be non-toxic on cells and only serve as delivery platforms toward realizing sustained release.77,78
Therefore, Nio-TH had shown slightly higher levels of toxicity rather than solely the drug solution. Since PVA can coat the surface of nanoparticles, it serves as a barrier to limit particle aggregation and improve stability, which is why it is frequently utilized in the production of various nano-systems.79 Additionally, targeted drug delivery is made possible by the controlled release of the candid drug in the acidic cancerous microenvironment, due to the presence of PVA. Furthermore, comparing the toxicity of Nio-TH and Nio-TH/PVA on the studied cancerous cell lines showed the cytotoxic effect on the MCF-7 cell line was greater than AGS and HepG2, respectively. Our candidate model, Nio-TH/PVA, has promise for application in the future as a model for targeted drug delivery. Amiri et al demonstrated that vinblastine-containing niosomes showed the higher cytotoxicity compared to free vinblastine. As for encapsulated herbal compounds, Baranei et al performed in vitro cytotoxicity assaying formulations on 3 different cancer cells (MCF-7 HepG2, and HL-60) and one normal cell line (hGF) to analyze formulations’ therapeutic efficacy of green tea extract (GTE). And the strong differences between free GTE and loaded niosomes was explained by the increased bioavailability of coated formulation which is likely due to higher water solubility and more efficient niosome-loaded GTE cell access. Karimi et al had loaded a polymeric nanoparticle modified by oleic acid with thymol and their MTT results demonstrated that at high concentrations of the encapsulated formulation, cell viability has been reduced in OECs.29,30,32
These studies confirm that the encapsulated anticancer compounds showed higher toxicity than the free compounds. Moreover, it was noted that the cytotoxic effect of formulations was dose-dependent, meaning that higher doses were associated with greater toxicity, and the empty niosomes, which was considered as a negative control did not show any cytotoxicity against the cells.
Gene Expression Analysis
Analysis of the gene expression with real-time polymerase chain reaction (PCR) reveals the effect of a drug on a cells’ faith. We assessed the Caspase-3, Caspase-9, MMP-2, MMP-9, Cyclin E, and Cyclin D gene expression levels in MCF-7, AGS, and HepG2 cell lines (1 ×10⁸ cells per well in 96-well plate) by using real-time PCR analysis. During the research, we evaluated these genes’ expression after incubation of the three different cell lines with various formulations at IC50 concentration. These three groups of genes represent pro-apoptotic effects (Caspase-3/Caspase-9), tumor growth, invasion, and metastasis (MMP-2/MMP-9) and cell cycle regulation (Cyclin E/Cyclin D).
The expression of Caspase-3 increased to 3.12 ± 0.06 for MCF-7, 2.72 ± 0.07 for AGS, and 2.47 ± 0.03 for HepG2 cell lines when treated with Nio-TH/PVA. Caspase-3 expression significantly increased in Nio-TH than TH and Nio-TH/PVA than Nio-TH across all the cell lines. (p < 0.001) (Figure 5A and B). Similarly, the expression of Caspase-9 enhanced to 3.58 ± 0.08 for MCF-7, 3.09 ± 0.03 for AGS, 2.66 ± 0.07 for HepG2 cell lines when treated with Nio-TH/PVA. Caspase-9 expression had a meaningful increase in Nio-TH than TH and Nio-TH/PVA than Nio-TH across all the cell lines. (p < 0.001) (Figure 5C and D). Generally, Caspase-9 had shown a higher rate of augmentation in all the cell lines. On the contrary, both MMPs and Cyclins expressions decreased in all cell lines. The expression of MMP-2 decreased to 0.32 ± 0.03 for MCF-7, 0.48 ± 0.04 for AGS, and 0.61 ± 0.03 for HepG2 cell lines when treated with Nio-TH/PVA. In MCF-7, AGS and HepG2, MMP-2 expression considerably decreased in Nio-TH than TH and Nio-TH/PVA than Nio-TH (p < 0.001) (Figure 5E and F). Also, the expression of MMP-9 decreased to 0.28 ± 0.03 for MCF-7, 0.43 ± 0.03 for AGS, and 0.56 ± 0.04 for HepG2 cell lines when treated with Nio-TH/PVA. MMP-9 expression significantly diminished in Nio-TH than TH and Nio-TH/PVA than Nio-TH in all the cell lines. (p < 0.001) (Figure 5G and H). The expression of Cyclin-D decreased to 0.49 ± 0.02 for MCF-7, 0.62 ± 0.02 for AGS, and 0.68 ± 0.01 for HepG2 cell lines when treated with Nio-TH/PVA. Cyclin-D expression showed a significant decrease in Nio-TH than TH and Nio-TH/PVA than Nio-TH compared to the control sample across all cell lines (p < 0.001) (Figure 5I and J). Also, the expression of Cyclin-E reduced to 0.44 ± 0.03 for MCF-7, 0.59 ± 0.02 for AGS, and 0.64 ± 0.03 for HepG2 cell lines when treated with Nio-TH/PVA. Cyclin-E expression significantly decreased in Nio-TH than TH and Nio-TH/PVA than Nio-TH across all the cell lines. (p < 0.001) (Figure 5K and L). MMP-9 and Cyclin E expression were more affected in all the samples, but particularly in AGS and HepG2 cell lines, Cyclin D reduction rate was higher. Concerning the cell lines, the gene expression levels were greatly affected in the MCF-7 cell line. Compared to the control sample, the vehicle did not cause any significant change in the gene expressions, but the Nio-TH/PVA had a noticeable impact and resulted in a significant change.
 |
Figure 5 MCF-7, AGS, and HepG2 cancer cells (1×10⁸ cells/well in 96-well plate) were treated with IC50 concentration of Vehicle, TH, Nio-TH, and Nio-TH/PVA. The expression levels and its heat-map for Caspase-3 (A and B), Caspase-9 (C and D), MMP-2 (E and F), MMP-9 (G and H), CyclinD (I and J), CyclinE (K and L) genes in MCF-7, AGS, and HepG2 cells after treatment with various samples. The IC50 was used for each sample. Data are represented as mean ± SD and n=3; ***p<0.001, **p<0.01, *p<0.05. |
TH inhibits cancer cell growth via mitochondria‐mediated apoptosis.80 The expression of six genes (including Caspase-3, Caspase-9, MMP-2, MMP-9, Cyclin E and Cyclin D) was examined in the studied cancer cell lines after treatment with the model drug, empty niosome, Nio-TH, and Nio-TH/PVA. In the current investigation, the activity levels of Caspase-3 and Caspase-9, which both play significant roles in apoptosis (the cells’ programmed death), were examined individually. The apoptosis of cancer cells is typically associated with an increase in the caspase gene expression levels, which makes cancer prevention achievable.81 The other two groups of genes; MMPs and Cyclins are favorable in the prevention of cancer progression by the decrease in their expression. MMP-2 and MMP-9 participation in cancer progression makes them an attractive target for cancer therapy and a decrease in their expression will result in the diminishment of cancer progression.82 The level to which a class of proteins known as Cyclins is expressed determines how efficiently the cell division cycle progresses.83 Among the numerous members of the Cyclin family, Cyclin E and Cyclin D were examined in our studies. The decrease in the expression of two Cyclins in our results indicates the inhibition of cell proliferation. The gene expression results imply that in the presence of the studied formulations, cancer progression can be inhibited. Inducing apoptosis by controlling the expression of the genes involved in this pathway is thus a prospective tumor treatment strategy. Niosomes have been a candid nano carrier for delivery of anticancer compounds. Haddadian, A. et al 2022 have studied the anticancer effects of selenium-loaded niosomes on MCF-7, and the results of the gene expression studies suggested that the expression Caspase-3, Caspase-9 genes was up-regulated significantly within 24 hours of treatment with the formulation.84 Seresht et al studied the anticancer characteristics of thymol. It was found that thymol had some effects on changes of P21, P53 and Mcl-1 gene expression in MCF-7 cells, investigated by real-time RT-PCR assay.85 In another study focusing on the delivery of thymol with chitosan coated Fe3O4 magnetic nanoparticles, Haghighi et al have confirmed an increased in the autophagic role in the MDA-MB-231 cell line and an increase the expression of the MAP1LC3A gene.86
Apoptosis Analysis
By using flow cytometry, apoptosis progression was assessed for each cell line seeded onto 96-well and treated with all the samples at IC50 concentration. All the cell lines had incredibly low rates of apoptosis when treated with the empty niosome, demonstrating excellent biocompatibility of niosomes (Figure 6A–C). The apoptosis rate of the vehicle was 4.17 ± 1.51% on HepG2, 2.08 ± 1.52% on MCF-7 and 4.35 ± 0.35% on AGS cell lines. Nio-TH/PVA apoptosis rate was significantly higher in all the cell lines, followed by Nio-TH and TH. The samples treated with Nio-TH/PVA, Nio-TH, and TH respectively induced apoptosis in all the cancerous cell lines as determined by counting the cells in four phases (Q1: necrosis, Q2: late apoptosis, Q3: early apoptosis, and Q4: living cells). A significant decrease in the number of alive cells in Nio-TH than TH and in Nio-TH/PVA than Nio-TH was observed in MCF-7, AGS and HepG2 cell lines (p < 0.001) (Figure 6D–F). The apoptosis rate of Nio-TH/PVA, Nio-TH, and TH was 59.10 ± 2.55%, 35.99 ± 1.82%, and 22.28 ± 1.58% on MCF-7 cell line (Figure 6A and D), 46.49 ± 1.57%, 23.76 ± 2.37%, and 14.93 ± 1.87% on AGS cell line (Figure 6B and E) and, 35.24 ± 3.06%, 19.55 ± 1.29%, and 11.26 ± 1.44% on HepG2 cell line (Figure 6C and F). These high apoptosis rates confirm the inhibitory effects of Nio-TH/PVA on cancer cell lines and are in line with the cytotoxicity data recorded by the MTT assay.
 |
Figure 6 Flowcytometric analysis of all samples in (A) MCF-7, (B) AGS, and (C) HepG2 cell lines. Cell suspension was adjusted to 5×10⁵ cells/mL and were seeded onto 6-well and treated with IC50 concentration of various formulations. Analysis of the apoptosis rate in (D) MCF-7, (E) AGS, and (F) HepG2 cancer cell lines after incubation with different samples. Q1 (necrotic cells), Q2 (late apoptosis), Q3 (early apoptosis), and Q4 (alive cells). (G) Apoptosis rate in MCF-7, AGS, and HepG2 cell lines treated with all samples. (H) Heat-map of apoptosis analysis of all samples in MCF-7, AGS, and HepG2 cell lines. Data are represented as mean ± SD and n=3; ***p<0.001, **p<0.01, *p<0.05. |
Compared to the control sample, there was a considerable increase in apoptosis rate in Nio-TH more than TH and in Nio-TH/PVA more than Nio-TH among all the cell lines (Figure 6G and H). A key mechanism of chemotherapeutic drugs is apoptosis. The apoptotic effects of TH on cancer cells were reported by Jamali et al,74 who also confirmed that due to TH’s cytotoxic effects, an increase in ROS production resulted in the loss of membrane potential, damage to nuclear material, phase arrest, and antiproliferative effects. It is well known that natural cytotoxic compounds primarily cause apoptotic cell death, which may be through intrinsic or extrinsic pathways and involves a variety of processes including Caspase and/or p53-dependent or independent pathways.87 According to Balan et al 2022, activation of the late apoptotic stage upon treatment with thymol-loaded chitosan nanoparticles was observed. The encapsulated thymol was also confirmed to have higher apoptotic potential on A549 cell lines.88 In order to further support our findings on the assessment of apoptosis, we investigated the roles of Caspase-3 and Caspase-9 in this study through gene expression and caspase activity analyses.
Cell Cycle Analysis
Flow cytometry was used to examine how the prepared samples affected cancerous cells at different stages of their cycles. The cells go through the different phases of the cell cycle; interphase—consisting of G1 (Gap 1), S (synthesis), and G2 (Gap 2)—and the mitotic phase—M (mitosis).89 Studies show that TH may lead to excessive levels of DNA damage.90 As a result, some cells halt at the cell cycle’s initiation and do not proceed to the G1 phase. These cells are in a distinct phase known as the sub-G1 phase. Due to the cell damage in presence of Nio-TH/PVA, the majority of the cells were stuck in the SubG1 phase, which implies that the cells are not able to go through the next phase, and as a result, the cell cycle progression is paused and that is favorable for cancer inhibition. Cell lines were seeded at a density of 1 × 10⁶ cells per well in complete medium in 6-well plates and were treated with IC50 concentration of various samples. Also, the DNA content of each sample in the MCF-7 (Figure 7A), AGS (Figure 7B), and HepG2 (Figure 7C) cell lines were evaluated. The percentages of cells in sub-G1 phase for Nio-TH/PVA, Nio-TH and TH were respectively 40.40%, 31.62% and 18.15% for MCF-7 (Figure 7D), 34.04%, 22.12%, and 12.85% for AGS (Figure 7E), and 29.81%, 25.71%, 11.82% for HepG2 (Figure 7F) cell lines. Nio-TH/PVA has significantly prevented the proliferation and ceased the cells in the sub-G1 phase. The fabricated TH delivery vehicle slightly raised the number of cells in the sub-G1 phase as compared to the control samples. The MCF-7 showed higher inhibition influences than AGS and HepG2 (Figure 7G and H). In conclusion, there was a significant increase in the number of cells arrested in SubG1 phase in MCF-7, AGS, HepG2 and the increase was greater in Nio-TH compared to TH and in Nio-TH/PVA compared to Nio-TH (p < 0.001). While studying the anticancer effect of thymol on AGS (human gastric carcinoma), Kang et al in 2016 confirmed that Thymol had induced an increase of Sub-G1 phase.13
 |
Figure 7 Cells were seeded at a density of 1×10⁶ cells per well in complete medium in 6-well plates All of these experiments were conducted using IC50 concentration. Histograms showing DNA content of cell cycle progression of all samples in (A) MCF-7, (B) AGS, and (C) HepG2 cell lines. Cell cycle distribution of (D) MCF-7, (E) AGS, (F), HepG2 cell lines treated with all samples. The SubG1 percentage in all the cancerous cell lines treated with all samples, shown as (G) A bar plot and (H) A heat-map. Data are represented as mean ± SD and n=3; ***p<0.001, **p<0.01, *p<0.05. |
Caspase Activity
TH is evident to activate caspases, a conserved family of cysteine-aspartic proteases that mediate apoptosis.91 The cell damage caused by TH results in the mitochondrial-related activation of initiator caspases (Caspase-9), and once active, initiator caspases activate downstream effector caspases (Caspase-3),92 and they ultimately result in apoptosis. We investigated the caspase activity levels as well as caspase gene expression to confirm the apoptotic effects of our candid delivery platform. Cell lines were exposed to a particular concentration of the samples (IC50). For MCF-7, the caspase activity of Nio-TH/PVA, Nio-TH and TH are 2.59 ± 0.09, 1.93 ± 0.12, 1.32 ± 0.08 for Caspase-3 (Figure 8A and B) and 2.97 ± 0.11, 2.23 ± 0.10, 1.67 ± 0.10 for Caspase-9 (Figure 8C and D). Both Caspase-3 and Caspase-9 activity profoundly enhanced across all the cell lines and the increase was more significant in Nio-TH than TH and in Nio-TH/PVA than Nio-TH (p < 0.001). Hence the cell line MCF-7 showed the most increase in the treated samples, followed by AGS and HEPG2, respectively. In conclusion, Nio-TH/PVA is the most effective TH delivery vehicle in increasing the caspase activity resulting in apoptotic traits in cells and inhibition of cancer progression. Similar to the gene expression analysis, no discernible change was observed in the presence of an empty vehicle, which validates the low toxicity of the nano-carrier and is aligned with the MTT assay results. Kang et al demonstrated that exposure to thymol result in activation of caspase cascade pathway or inducing the interaction with poly ADP ribose polymerase.13 Pourgholi, A. et al have studied the therapeutic effects of Silibinin, a natural polyphenolic flavonoid, loaded in polymeric nanoparticles on, on MCF-7 cell line, and their results suggest the up-regulation of caspase-3, caspase-7.93
 |
Figure 8 (A) Bar plot and (B) heat-map showing activity levels of Caspase-3 of all samples in MCF-7, AGS, and HepG2 cell lines that were treated with IC50 concentration. (C) Bar plot and (D) heat-map showing activity levels of Caspase-9 of all samples in MCF-7, AGS, and HepG2 cell lines. (E) Bar plot and (F) heat-map showing DCF fluorescence of all samples in MCF-7, AGS, and HepG2 cell lines. Data are represented as mean ± SD and n=3; ***p<0.001, **p<0.01, *p<0.05. |
ROS Levels Analysis
Due to the pro-oxidant and antioxidant properties of polyphenols that cause cytotoxic, genotoxic, and apoptotic effects, TH demonstrated a dose-dependent decrease in cell viability and Reactive oxygen species (ROS) formation.90 Various chemotherapeutic methods are intended to dramatically raise cellular ROS levels in order to start irreversible damage that would eventually cause tumor cells to undergo apoptosis.94 Comparing the untreated control sample, there was not a significant change in ROS levels. When treated with TH, Nio-TH and Nio-TH/PVA the ROS levels increased, and the increase was greater in Nio-TH than TH and Nio-TH/PVA than Nio-TH. (p < 0.001) (Figure 8E and F). However, there was a significant increase when the cell lines were treated with Nio-TH/PVA and the foremost affected cell line was MCF-7 with 321.9 ± 1.97, followed by AGS with 275.89 ± 2.31, and HepG2 with 240.25 ± 1.75. Nio-TH showed a greater enhancement in ROS level than TH. The numbers for Nio-TH and TH are 247.4 ± 2.21 and 181.92 ± 1.78 for MCF-7, 204.6 ± 1.88 and 168.45 ± 1.62 for AGS, and 191.2 ± 2.07 and 153.25 ± 1.55 for HepG2, respectively. Accordingly, the increase in the ROS levels causes disturbance in the cancer cells viability. ROS, a group of incredibly reactive molecules, have evolved to operate as key signaling pathway regulators. It is now well acknowledged that modest amounts of ROS are essential for a variety of cellular processes and can also induce apoptosis.95 Rising ROS levels cause cell functions to be disturbed, which puts the cell under stress and gradually leads to programmed cell death. The highest amounts of ROS were seen in the cell lines treated with Nio-TH/PVA, which is also consistent with the samples’ findings on apoptosis progression. Hence, we can infer that Nio-TH/PVA results in a favorable outcome for stopping the cancer progression considering the fact that niosome did not induce apoptosis. Karimi et al which had loaded thymol in a polymeric nanoparticle modified by oleic acid had measured the ROS levels of the formulation on rat’s olfactory ensheathing cells (OECs) in normal (NG) and high glucose (HG) conditions. They have demonstrated that the formulations of encapsulated thymol at high concentrations increased the production of ROS in both HG and NG conditions.32
Migration Analysis
To test the effect of TH on the migratory and invasive ability of our studied cell lines, a migration assay was performed. The migration rate of all the samples exposed to IC50 was examined in MCF-7 (Figure 9A), AGS (Figure 9B), and HepG2 (Figure 9C). The migration rate in the treated samples with Nio-TH/PVA was dropped to 23.5 ± 3.54% in MCF-7, 30.5 ± 4.95% in AGS, and 50.5 ± 4.95% for HepG2. As for the treatment with the Nio-TH, the migration rate was reduced to 52 ± 5.66% in MCF-7, 86.5 ± 3.54% in AGS, and 93 ± 5.66% in HepG2. In comparison to the control sample, the decrease in migration rate in Nio-TH/PVA was greater than Nio-TH and in Nio-TH than TH among all the cell lines (p < 0.001). The MCF-7 was the most responsive among the examined cell lines (Figure 9D and E). Nuclear stiffness restricts the ability of cancer cells to migrate through tight pores in the tissue matrix. MMPs contribute to metastasis by widening matrix pores, facilitating confined migration.96 Our gene expression analysis confirms the downregulation of MMP-2 and MMP-9 genes. Consequently, migration of cancer cells is decreased after treatment with the optimum formulation of Nio-TH/PVA.60 Therefore, targeting cell migration is also a promising technique in cancer therapeutics. Furthermore, Rutin (a natural product) loaded liquid crystalline nanoparticles have been researched for their impact on non-small cell lung cancer, and Paudel et al have verified the anti-migratory action of the nano carrier loaded with the anticancer herbal compound. In another study by Pakizehkar, S. et al, MDA-MB-231 breast cancer cells were treated with Curcumin loaded PEG400-OA nanoparticles, and the results suggested a decrease in cell migration.97–99
 |
Figure 9 Qualitative Migration analysis of all samples in (A) MCF-7, (B) AGS, and (C) HepG2 cell lines exposed to IC50 concentration of vehicle, TH, Nio-TH, and Nio-TH/PVA. (D) Migration rate of the three cancerous cell lines in all samples presented as bar plots. (E) Heat-map of migration analysis of all samples in MCF-7, AGS, and HepG2 cell lines. Data are represented as mean ± SD and n=3; ***p<0.001. |
DAPI Staining
The DAPI staining microscopy was used to detect apoptosis, and confirmed the flow cytometry results. MCF-7 (Figure 10A), AGS (Figure 10B), HepG2 (Figure 10C) MCF-7, AGS, and HepG2 cells were plated onto a 24-well plate and exposed to the IC50 concentration of formulations for 48 h. Based on the morphological alterations observed on cells treated with developed formulations, Nio-TH/PVA appears to be the most effective agent for inducing apoptosis in all cell lines after 48 hours. Chromatin condensation and nuclear fragmentation were also observed. As a result, the optimized formulation of Nio-TH/PVA effectively induces apoptosis and blocks the progression of tumors. DAPI results by Singhal et al revealed that thymol induces marked morphological and nuclear alterations in prostate cancer LNCaP cells.100 A paper by Kumar et al studied the effect of herbal anti-cancer agent thymoquinone loaded in Fe3O4 nanoparticles against triple-negative breast cancer (TNBC) cells, and the DAPI observations confirm the cytotoxic behavior when treated with the formulations.101
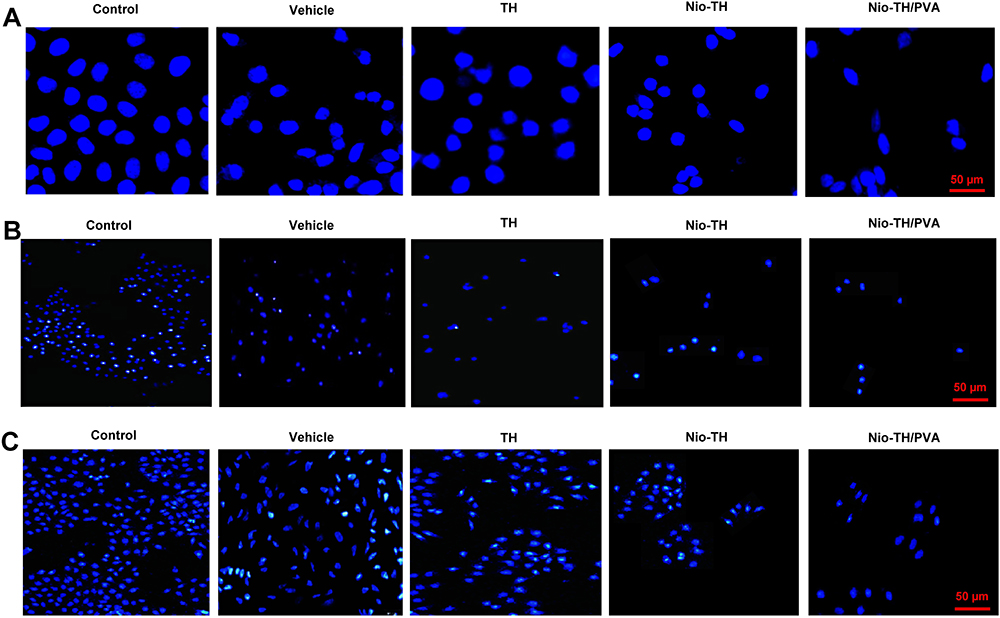 |
Figure 10 DAPI staining determining the number of nuclei of all samples in (A) MCF-7, (B) AGS, and (C) HepG2 cell lines. MCF-7, AGS, and HepG2 cells were plated onto a 24-well plate and exposed to the IC50 concentration of formulations for 48 hrs. |
Conclusion
The Nio-TH/PVA showed notable cytotoxicity against MCF-7, HepG2, and AGS cancer cell lines while demonstrating excellent biocompatibility with HFF normal cells. Due to the inclusion of PVA in the formulation, the chemotherapeutic effect was further enhanced. The in vitro assessments revealed that the Nio-TH/PVA could succeed in the inhibition of cancer progression and cancer treatments by three mechanisms: apoptosis; concluded from flow cytometry and ROS levels analysis, up-regulation of Caspase-3 and Caspase-9; by caspase activity analysis, and cell arrest; concluded from cell cycle analysis and down-regulation of Cyclin E and Cyclin D and metastasis prevention; concluded from migration analysis, and also the down-regulation of MMP-2 and MMP-9 genes.
Data Sharing Statement
All data were analyzed during this study are included in this published article.
Ethics Approval and Consent to Participate
There are no “human subjects” in this study.
Acknowledgment
E.M. would like to acknowledge the support from the National Institute of Biomedical Imaging and Bioengineering (5T32EB009035).
Author Contributions
All authors made a significant contribution to the work reported, whether that is in the conception, study design, execution, acquisition of data, analysis and interpretation, or in all these areas; took part in drafting, revising or critically reviewing the article; gave final approval of the version to be published; have agreed on the journal to which the article has been submitted; and agree to be accountable for all aspects of the work.
Funding
This research did not receive any specific grant from funding agencies in the public, commercial, or not-for-profit sectors and was funded by the authors.
Disclosure
The authors declare that they have no conflicts of interest in this work.
References
1. Sung H, Ferlay J, Siegel RL, et al. Global cancer statistics 2020: GLOBOCAN estimates of incidence and mortality worldwide for 36 cancers in 185 countries. CA Cancer J Clin. 2021;71(3):209–249. doi:10.3322/caac.21660
2. Molani S, Madadi M, Wilkes WJO. A partially observable Markov chain framework to estimate overdiagnosis risk in breast cancer screening: incorporating uncertainty in patients adherence behaviors. Omega. 2019;89:40–53.
3. Jain H, Rajendra A, Sengar M, et al. The current treatment approach to adolescents and young adults with acute lymphoblastic leukemia (AYA-ALL): challenges and considerations. Expert Rev Anticancer Ther. 2022;22(8):845–860. doi:10.1080/14737140.2022.2093718
4. Das CK, Singh SK. Immune Checkpoint Inhibitors in Cancer Therapy: A Ray of Hope, in Biomedical Translational Research. Springer; 2022:393–411.
5. Molani S, Madadi M, Williams DLJM. Investigating the effectiveness of breast cancer supplemental screening considering radiologists’ bias. MedRxiv. 2020;2020:2020.
6. Garmarudi AB. Most common techniques of outlier detection. In: Current Applications of Chemometrics. Nova Science; 2015.
7. Ebrahimi N, Adelian S, Shakerian S, et al. Crosstalk between ferroptosis and the epithelial-mesenchymal transition: implications for inflammation and cancer therapy. Cytokine Growth Factor Rev. 2022;64:33–45. doi:10.1016/j.cytogfr.2022.01.006
8. Namazifard S, Subbarao KJS. Multiple dipole source position and orientation estimation using non-invasive EEG-like signals. Sensors. 2023;23(5):2855. doi:10.3390/s23052855
9. Gezici S, Şekeroğlu N. Current perspectives in the application of medicinal plants against cancer: novel therapeutic agents. Anticancer Agents Med Chem. 2019;19(1):101–111. doi:10.2174/1871520619666181224121004
10. Ahmadi S, Seraj M, Chiani M, et al. In vitro development of controlled-release nanoniosomes for improved delivery and anticancer activity of letrozole for breast cancer treatment. Int J Nanomedicine. 2022;17:6233–6255. doi:10.2147/IJN.S384085
11. Vasan N, Baselga J, Hyman DMJN. A view on drug resistance in cancer. Nature. 2019;575(7782):299–309. doi:10.1038/s41586-019-1730-1
12. Elbe H, Yigitturk G, Cavusoglu T, et al. Apoptotic effects of thymol, a novel monoterpene phenol, on different types of cancer. Bratisl Lek Listy. 2020;121(2):122–128. doi:10.4149/BLL_2020_016
13. Kang S-H, Kim YS, Kim EK, et al. Anticancer effect of thymol on AGS human gastric carcinoma cells. J Microbiol Biotechnol. 2016;26(1):28–37.
14. Haseli S, Pourmadadi M, Samadi A, et al. A novel pH-responsive nanoniosomal emulsion for sustained release of curcumin from a chitosan-based nanocarrier: emphasis on the concurrent improvement of loading, sustained release, and apoptosis induction. Biotechnol Prog. 2022;38(5):e3280. doi:10.1002/btpr.3280
15. Yao Y, Zhou Y, Liu L, et al. Nanoparticle-based drug delivery in cancer therapy and its role in overcoming drug resistance. Front Mol Biosci. 2020;7:193. doi:10.3389/fmolb.2020.00193
16. Chamani E, Ebrahimi R, Khorsandi K, et al. In vitro cytotoxicity of polyphenols from datura innoxia aqueous leaf-extract on human leukemia K562 cells: DNA and nuclear proteins as targets. Drug Chem Toxicol. 2020;43(2):138–148. doi:10.1080/01480545.2019.1629588
17. Bazzazan S, Moeinabadi-Bidgoli K, Lalami ZA, et al. Engineered UIO-66 metal-organic framework for delivery of curcumin against breast cancer cells: an in vitro evaluation. J Drug Deliv Sci Technol. 2023;79:104009.
18. Dastneshan A, Rahiminezhad S, Mezajin MN, et al. Cefazolin encapsulated UiO-66-NH2 nanoparticles enhance the antibacterial activity and biofilm inhibition against drug-resistant S. aureus: in vitro and in vivo studies. Chem Eng J. 2023;455:140544.
19. Kazemi M, Emami J, Hasanzadeh F, et al. In vitro and in vivo evaluation of novel DTX-loaded multifunctional heparin-based polymeric micelles targeting folate receptors and endosomes. Recent Pat Anticancer Drug Discov. 2020;15(4):341–359. doi:10.2174/1574892815666201006124604
20. Rezaei T, Rezaei M, Karimifard S, et al. Folic acid-decorated pH-responsive nanoniosomes with enhanced endocytosis for breast cancer therapy: in vitro studies. Front Pharmacol. 2022;13. doi:10.3389/fphar.2022.851242
21. Akbarzadeh I, Fatemizadeh M, Heidari F, Niri NM. Niosomal formulation for co-administration of hydrophobic anticancer drugs into MCF-7 cancer cells. Arch Adv Biosci. 2020;11(2):1–9.
22. Akbarzadeh I, Saremi Poor A, Yaghmaei S, et al. Niosomal delivery of simvastatin to MDA-MB-231 cancer cells. Drug Dev Ind Pharm. 2020;46(9):1535–1549. doi:10.1080/03639045.2020.1810269
23. Jamshidifar E, Eshrati Yeganeh F, Shayan M, et al. Super magnetic niosomal nanocarrier as a new approach for treatment of breast cancer: a case study on SK-BR-3 and MDA-MB-231 cell lines. Int J Mol Sci. 2021;22(15):7948. doi:10.3390/ijms22157948
24. Amale FR, Ferdowsian S, Hajrasouliha S, et al. Gold nanoparticles loaded into niosomes: a novel approach for enhanced antitumor activity against human ovarian cancer. Adv Powder Technol. 2021;32(12):4711–4722.
25. Kazemi M, Emami J, Hasanzadeh F, et al. Pegylated multifunctional pH-responsive targeted polymeric micelles for ovarian cancer therapy: synthesis, characterization and pharmacokinetic study. Int J Polym Mater Polym Biomater. 2021;70(14):1012–1026.
26. Ge X, Wei M, He S, et al. Advances of non-ionic surfactant vesicles (niosomes) and their application in drug delivery. Pharmaceutics. 2019;11(2):55. doi:10.3390/pharmaceutics11020055
27. Bourbour M, Khayam N, Noorbazargan H, et al. Evaluation of anti-cancer and anti-metastatic effects of folate-PEGylated niosomes for co-delivery of letrozole and ascorbic acid on breast cancer cells. Mol Syst Des Eng. 2022;7(9):1102–1118. doi:10.1016/j.jacbts.2022.05.004
28. Rivera-Hernandez G, Antunes-Ricardo M, Martínez-Morales P, et al. Polyvinyl alcohol based-drug delivery systems for cancer treatment. Int J Pharm. 2021;600:120478. doi:10.1016/j.ijpharm.2021.120478
29. Amiri B, Ahmadvand H, Farhadi A, et al. Delivery of vinblastine-containing niosomes results in potent in vitro/in vivo cytotoxicity on tumor cells. Drug Dev Ind Pharm. 2018;44(8):1371–1376. doi:10.1080/03639045.2018.1451880
30. Baranei M, Taheri RA, Tirgar M, et al. Anticancer effect of green tea extract (GTE)-loaded pH-responsive niosome coated with PEG against different cell lines. Mater Today Commun. 2021;26:101751.
31. Taherkhani A, Fazli H, Taherkhani F. Application of janus magnetic nanoparticle Fe3O4@ SiN functionalized with beta‐cyclodextrin in thymol drug delivery procedure: an in vitro study. Appl Organomet Chem. 2021;35(11):e6399.
32. Karimi E, Abbasi S, Abbasi N, et al. Thymol polymeric nanoparticle synthesis and its effects on the toxicity of high glucose on OEC cells: involvement of growth factors and integrin-linked kinase. Drug Des Devel Ther. 2019;13:2513–2532. doi:10.2147/DDDT.S214454
33. Moghtaderi M, Mirzaie A, Zabet N, et al. Enhanced antibacterial activity of echinacea angustifolia extract against multidrug-resistant Klebsiella pneumoniae through niosome encapsulation. Nanomaterials. 2021;11(6):1573. doi:10.3390/nano11061573
34. Akbarzadeh I, Tavakkoli Yaraki M, Bourbour M, et al. Optimized doxycycline-loaded niosomal formulation for treatment of infection-associated prostate cancer: an in-vitro investigation. J Drug Deliv Sci Technol. 2020;57:101715. doi:10.1016/j.jddst.2020.101715
35. Fahmy UA, Badr-Eldin SM, Ahmed OA, et al. Intranasal niosomal in situ gel as a promising approach for enhancing flibanserin bioavailability and brain delivery: in vitro optimization and ex vivo/in vivo evaluation. Pharmaceutics. 2020;12(6):485.
36. Al-Mahallawi AM, Fares AR, Abd-Elsalam WH. Enhanced permeation of methotrexate via loading into ultra-permeable niosomal vesicles: fabrication, statistical optimization, ex vivo studies, and in vivo skin deposition and tolerability. AAPS PharmSciTech. 2019;20(5):1–10.
37. Zeng W, Li Q, Wan T, et al. Hyaluronic acid-coated niosomes facilitate tacrolimus ocular delivery: mucoadhesion, precorneal retention, aqueous humor pharmacokinetics, and transcorneal permeability. Colloids Surf B Biointerfaces. 2016;141:28–35. doi:10.1016/j.colsurfb.2016.01.014
38. Rochani AK, Balasubramanian S, Ravindran Girija A, et al. Dual mode of cancer cell destruction for pancreatic cancer therapy using Hsp90 inhibitor loaded polymeric nano magnetic formulation. Int J Pharm. 2016;511(1):648–658. doi:10.1016/j.ijpharm.2016.07.048
39. Akbari J, Saeedi M, Enayatifard R, et al. Curcumin niosomes (curcusomes) as an alternative to conventional vehicles: a potential for efficient dermal delivery. J Drug Deliv Sci Technol. 2020;60:102035. doi:10.1016/j.jddst.2020.102035
40. Shaker DS, Shaker MA, Hanafy MS. Cellular uptake, cytotoxicity and in-vivo evaluation of tamoxifen citrate loaded niosomes. Int J Pharm. 2015;493(1–2):285–294. doi:10.1016/j.ijpharm.2015.07.041
41. Noorbazargan H, Mashayekhi A, Khayam N, et al. Anti-cancer, anti-invasiveness & anti-metastasis of green engineered bioorganic-capped silver nanoparticles fabricated from Juniperus chinensis extract and comparison to cisplatin in lung cancer cells (A549): in vitro assessment of cellular and molecular pathways; 2020.
42. Nowroozi F, Almasi A, Javidi J, et al. Effect of surfactant type, cholesterol content and various downsizing methods on the particle size of niosomes. Iran J Pharm Res. 2018;17(Suppl2):1.
43. Yoshioka T, Sternberg B, Florence AT. Preparation and properties of vesicles (niosomes) of sorbitan monoesters (Span 20, 40, 60 and 80) and a sorbitan triester (Span 85). Int J Pharm. 1994;105(1):1–6.
44. García-Manrique P, Machado ND, Fernández MA, et al. Effect of drug molecular weight on niosomes size and encapsulation efficiency. Colloids Surf B Biointerfaces. 2020;186:110711. doi:10.1016/j.colsurfb.2019.110711
45. Kamboj S, Saini V, Bala SJ. Formulation and characterization of drug loaded nonionic surfactant vesicles (niosomes) for oral bioavailability enhancement. Sci World J. 2014;2014:1.
46. Ag Seleci D, Seleci M, Walter JG, Stahl F, Scheper T. Niosomes as nanoparticular drug carriers: fundamentals and recent applications. J Nanomater. 2016;2016:1.
47. Essa EA. Effect of formulation and processing variables on the particle size of sorbitan monopalmitate niosomes. J Nanomater. 2010;4(4):1.
48. Essa EA. Effect of formulation and processing variables on the particle size of sorbitan monopalmitate niosomes. Asian J Pharm. 2014;4(4):1.
49. Moghassemi S, Parnian E, Hakamivala A, et al. Uptake and transport of insulin across intestinal membrane model using trimethyl chitosan coated insulin niosomes. Mater Sci Eng C Mater Biol Appl. 2015;46:333–340. doi:10.1016/j.msec.2014.10.070
50. Waddad AY, Abbad S, Yu F, et al. Formulation, characterization and pharmacokinetics of Morin hydrate niosomes prepared from various non-ionic surfactants. Int J Pharm. 2013;456(2):446–458. doi:10.1016/j.ijpharm.2013.08.040
51. Taymouri S, Varshosaz J. Effect of different types of surfactants on the physical properties and stability of carvedilol nano-niosomes. Adv Biomed Res. 2016;5. doi:10.4103/2277-9175.178781
52. Zaki RM, Ali AA, El Menshawe SF, Bary AA. Formulation and in vitro evaluation of diacerein loaded niosomes. Int J Pharm Pharm Sci. 2014;6(Suppl 2):515–521.
53. Al-Mahallawi AM, Khowessah OM, Shoukri RA. Nano-transfersomal ciprofloxacin loaded vesicles for non-invasive trans-tympanic ototopical delivery: in-vitro optimization, ex-vivo permeation studies, and in-vivo assessment. Int J Pharm. 2014;472(1–2):304–314.
54. Bnyan R, Khan I, Ehtezazi T, et al. Surfactant effects on lipid-based vesicles properties. J Pharm Sci. 2018;107(5):1237–1246. doi:10.1016/j.xphs.2018.01.005
55. Junyaprasert VB, Teeranachaideekul V, Supaperm T. Effect of charged and non-ionic membrane additives on physicochemical properties and stability of niosomes. AAPS pharmscitech. 2008;9:851–859.
56. Manosroi A, Wongtrakul P, Manosroi J, et al. Characterization of vesicles prepared with various non-ionic surfactants mixed with cholesterol. Colloids Surf B Biointerfaces. 2003;30(1–2):129–138.
57. Ruckmani K, Sankar V. Formulation and optimization of zidovudine niosomes. AAPS PharmSciTech. 2010;11(3):1119–1127. doi:10.1208/s12249-010-9480-2
58. Marianecci C, Rinaldi F, Di Marzio L, et al. Ammonium glycyrrhizinate-loaded niosomes as a potential nanotherapeutic system for anti-inflammatory activity in murine models. Int J Nanomedicine. 2014;9:635. doi:10.2147/IJN.S55066
59. Huang Y, Chen J, Chen X, et al. PEGylated synthetic surfactant vesicles (Niosomes): novel carriers for oligonucleotides. J Mater Sci Mater Med. 2008;19(2):607–614. doi:10.1007/s10856-007-3193-4
60. Takeuchi H, Yamamoto H, Toyoda T, et al. Physical stability of size controlled small unilameller liposomes coated with a modified polyvinyl alcohol. Int J Pharm. 1998;164(1–2):103–111.
61. Khalifa A-ZM, Abdul Rasool BK. Optimized mucoadhesive coated niosomes as a sustained oral delivery system of famotidine. AAPS PharmSciTech. 2017;18(8):3064–3075. doi:10.1208/s12249-017-0780-7
62. Cao Y, Liu F, Chen Y, et al. Drug release from core-shell PVA/silk fibroin nanoparticles fabricated by one-step electrospraying. Sci Rep. 2017;7(1):1–9.
63. Kayal S, Ramanujan R, C E. Doxorubicin loaded PVA coated iron oxide nanoparticles for targeted drug delivery. Mater Sci Eng C. 2010;30(3):484–490.
64. Şanlı O, Karaca I, Işıklan N. Preparation, characterization, and salicylic acid release behavior of chitosan/poly (vinyl alcohol) blend microspheres. J Appl Polym Sci. 2009;111(6):2731–2740.
65. Mansoori-Kermani A, Khalighi S, Akbarzadeh I, et al. Engineered hyaluronic acid-decorated niosomal nanoparticles for controlled and targeted delivery of epirubicin to treat breast cancer. Materi Today Bio. 2022;16:100349. doi:10.1016/j.mtbio.2022.100349
66. Karimifard S, Rezaei N, Jamshidifar E, et al. pH-responsive chitosan-adorned niosome nanocarriers for co-delivery of drugs for breast cancer therapy. ACS Appl Nano Mater. 2022;5(7):8811–8825.
67. Mohammadi MR, Malkovskiy AV, Jothimuthu P, et al. PEG/dextran double layer influences Fe ion release and colloidal stability of iron oxide nanoparticles. Sci Rep. 2018;8(1):1–11.
68. Akbarzadeh I, Shayan M, Bourbour M, et al. Preparation, optimization and in-vitro evaluation of curcumin-loaded niosome@calcium alginate nanocarrier as a new approach for breast cancer treatment. Biology. 2021;10(3):173. doi:10.3390/biology10030173
69. Kishore RSK, Pappenberger A, Dauphin IB, et al. Degradation of polysorbates 20 and 80: studies on thermal autoxidation and hydrolysis. J Pharm Sci. 2011;100(2):721–731. doi:10.1002/jps.22290
70. Samadi A, Pourmadadi M, Yazdian F, et al. Ameliorating quercetin constraints in cancer therapy with pH-responsive agarose-polyvinylpyrrolidone -hydroxyapatite nanocomposite encapsulated in double nanoemulsion. Int J Biol Macromol. 2021;182:11–25. doi:10.1016/j.ijbiomac.2021.03.146
71. AbuElfadl A, Boughdady M, Meshali M. New peceol™/span™ 60 niosomes coated with chitosan for candesartan cilexetil: perspective increase in absolute bioavailability in rats. Int J Nanomedicine. 2021;16:5581. doi:10.2147/IJN.S324171
72. Balasubramaniam A, Kumar VA, Pillai KS, et al. Formulation and in vivo evaluation of niosome-encapsulated daunorubicin hydrochloride. Drug Dev Ind Pharm. 2002;28(10):1181–1193. doi:10.1081/ddc-120015351
73. Cosco D, Paolino D, Muzzalupo R, et al. Novel PEG-coated niosomes based on bola-surfactant as drug carriers for 5-fluorouracil. Biomed Microdevices. 2009;11(5):1115–1125. doi:10.1007/s10544-009-9328-2
74. Jamali T, Kavoosi G, Safavi M, Ardestani SK. In-vitro evaluation of apoptotic effect of OEO and thymol in 2D and 3D cell cultures and the study of their interaction mode with DNA. Sci Rep. 2018;8(1):1–19.
75. Blažíčková M, Blaško J, Kubinec R, et al. Newly synthesized thymol derivative and its effect on colorectal cancer cells. Molecules. 2022;27(9):2622. doi:10.3390/molecules27092622
76. Marianecci C, Di Marzio L, Rinaldi F, et al. Niosomes from 80s to present: the state of the art. Adv Colloid Interface Sci. 2014;205:187–206. doi:10.1016/j.cis.2013.11.018
77. Gude RP, Jadhav MG, Rao SGA, et al. Effects of niosomal cisplatin and combination of the same with theophylline and with activated macrophages in murine B16F10 melanoma model. Cancer Biother Radiopharm. 2002;17(2):183–192. doi:10.1089/108497802753773801
78. Uchegbu IF, Double JA, Kelland LR, et al. The activity of doxorubicin niosomes against an ovarian cancer cell line and three in vivo mouse tumour models. J Drug Target. 1996;3(5):399–409. doi:10.3109/10611869608996831
79. Raudszus B, Mulac D, Langer K. A new preparation strategy for surface modified PLA nanoparticles to enhance uptake by endothelial cells. Int J Pharm. 2018;536(1):211–221. doi:10.1016/j.ijpharm.2017.11.047
80. De La Chapa JJ, Singha PK, Lee DR, Gonzales CB. Thymol inhibits oral squamous cell carcinoma growth via mitochondria‐mediated apoptosis. J Oral Pathol Med. 2018;47(7):674–682.
81. Carneiro BA, El-Deiry WS. Targeting apoptosis in cancer therapy. Nat Rev Clin Oncol. 2020;17(7):395–417.
82. Gonzalez-Avila G, Sommer B, Mendoza-Posada DA, et al. Matrix metalloproteinases participation in the metastatic process and their diagnostic and therapeutic applications in cancer. Crit Rev Oncol Hematol. 2019;137:57–83. doi:10.1016/j.critrevonc.2019.02.010
83. Martínez-Alonso D, Malumbres M. Mammalian cell cycle cyclins. In: Seminars in Cell & Developmental Biology. Elsevier; 2020.
84. Haddadian A, Robattorki FF, Dibah H, et al. Niosomes-loaded selenium nanoparticles as a new approach for enhanced antibacterial, anti-biofilm, and anticancer activities. Sci Rep. 2022;12(1):21938. doi:10.1038/s41598-022-26400-x
85. Seresht HR, Albadry BJ, Al-mosawi AK, Gholami O, Cheshomi H. The cytotoxic effects of thymol as the major component of Trachyspermum ammi on breast cancer (MCF-7) cells. Pharm Chem J. 2019;53:101–107.
86. Haghighi A, Shahanipour K, Monajemi R, et al. Evaluation of the cytotoxic effect of thymol loaded chitosan coated Fe3O4 magnetic nanoparticles on MDA-MB-231 cell line and expression of autophagic MAP1LC3A gene. Russ J Bioorg Chem. 2022;2022:1–13.
87. Gali-Muhtasib H, Hmadi R, Kareh M, et al. Cell death mechanisms of plant-derived anticancer drugs: beyond apoptosis. Apoptosis. 2015;20(12):1531–1562. doi:10.1007/s10495-015-1169-2
88. Balan DJ, Das M, Sathya S, et al. Chitosan based encapsulation increased the apoptotic efficacy of thymol on A549 cells and exhibited non toxic response in Swiss albino mice. Int J Biol Macromol. 2022;202:620–631. doi:10.1016/j.ijbiomac.2022.01.093
89. Matthews HK, Bertoli C, de Bruin RA. Cell cycle control in cancer. Nat Rev Mol Cell Biol. 2022;23(1):74–88.
90. Yamada G, Hagiwara Y, Kimura T, et al. Impact of body weight gain on the incidence of nonalcoholic fatty liver disease in nonobese Japanese individuals. Am J Gastroenterol. 2021;116(4):733–748. doi:10.14309/ajg.0000000000001030
91. Islam MT, Khalipha AB, Bagchi R, et al. Anticancer activity of thymol: a literature‐based review and docking study with emphasis on its anticancer mechanisms. IUBMB Life. 2019;71(1):9–19.
92. Avrutsky MI, Troy CM. Caspase-9: a multimodal therapeutic target with diverse cellular expression in human disease. Front Pharmacol. 2021;12:1728.
93. Pourgholi A, Dadashpour M, Mousapour A, et al. Anticancer potential of silibinin loaded polymeric nanoparticles against breast cancer cells: insight into the Apoptotic genes targets. Asian Pac J Cancer Prev. 2021;22(8):2587. doi:10.31557/APJCP.2021.22.8.2587
94. Trachootham D, Alexandre J, Huang P. Targeting cancer cells by ROS-mediated mechanisms: a radical therapeutic approach? Nat Rev Drug Discov. 2009;8(7):579–591. doi:10.1038/nrd2803
95. Perillo B, Di Donato M, Pezone A, et al. ROS in cancer therapy: the bright side of the moon. Exp Mol Med. 2020;52(2):192–203. doi:10.1038/s12276-020-0384-2
96. Infante E, Castagnino A, Ferrari R, et al. LINC complex-Lis1 interplay controls MT1-MMP matrix digest-on-demand response for confined tumor cell migration. Nat Commun. 2018;9(1):1–13.
97. Paudel KR, Wadhwa R, Tew XN, et al. Rutin loaded liquid crystalline nanoparticles inhibit non-small cell lung cancer proliferation and migration in vitro. Life Sci. 2021;276:119436. doi:10.1016/j.lfs.2021.119436
98. Pakizehkar S, Ranji N, Naderi Sohi A, et al. Curcumin loaded PEG400‐OA nanoparticles: a suitable system to increase apoptosis, decrease migration, and deregulate miR‐125b/miR182 in MDA‐MB‐231 human breast cancer cells. Polym Adv Technol. 2020;31(8):1793–1804.
99. Khorani M, Bobe G, Matthews DG, et al. The impact of the hAPP695 SW transgene and associated amyloid-β accumulation on murine hippocampal biochemical pathways. J Alzheimers Dis. 2022;Preprint:1–19.
100. Singhal B, Pandey P, Khan F, Singh SK, Kumar T. In vitro elucidation of antiproliferative and apoptotic effects of thymol against prostate cancer LNCaP cells. 2021.
101. Kumar SR, Thangam R, Vivek R, et al. Synergetic effects of thymoquinone-loaded porous PVPylated Fe3O4 nanostructures for efficient pH-dependent drug release and anticancer potential against triple-negative cancer cells. Nanoscale Adv. 2020;2(8):3209–3221. doi:10.1039/d0na00242a
 © 2023 The Author(s). This work is published and licensed by Dove Medical Press Limited. The
full terms of this license are available at https://www.dovepress.com/terms
and incorporate the Creative Commons Attribution
- Non Commercial (unported, 3.0) License.
By accessing the work you hereby accept the Terms. Non-commercial uses of the work are permitted
without any further permission from Dove Medical Press Limited, provided the work is properly
attributed. For permission for commercial use of this work, please see paragraphs 4.2 and 5 of our Terms.
© 2023 The Author(s). This work is published and licensed by Dove Medical Press Limited. The
full terms of this license are available at https://www.dovepress.com/terms
and incorporate the Creative Commons Attribution
- Non Commercial (unported, 3.0) License.
By accessing the work you hereby accept the Terms. Non-commercial uses of the work are permitted
without any further permission from Dove Medical Press Limited, provided the work is properly
attributed. For permission for commercial use of this work, please see paragraphs 4.2 and 5 of our Terms.