Back to Journals » Journal of Inflammation Research » Volume 16
Polyhydroxylated Fullerene C60(OH)40 Nanofilms Promote the Mesenchymal–Epithelial Transition of Human Liver Cancer Cells via the TGF-β1/Smad Pathway
Authors Sosnowska M ![]() , Kutwin M, Koczoń P, Chwalibog A
, Kutwin M, Koczoń P, Chwalibog A ![]() , Sawosz E
, Sawosz E
Received 1 April 2023
Accepted for publication 27 July 2023
Published 29 August 2023 Volume 2023:16 Pages 3739—3761
DOI https://doi.org/10.2147/JIR.S415378
Checked for plagiarism Yes
Review by Single anonymous peer review
Peer reviewer comments 2
Editor who approved publication: Professor Ning Quan
Malwina Sosnowska,1 Marta Kutwin,1 Piotr Koczoń,2 André Chwalibog,3 Ewa Sawosz1
1Department of Nanobiotechnology, Institute of Biology, Warsaw University of Life Sciences, Warsaw, Poland; 2Department of Chemistry, Institute of Food Sciences, Warsaw University of Life Sciences, Warsaw, Poland; 3Department of Veterinary and Animal Sciences, University of Copenhagen, Frederiksberg, Denmark
Correspondence: André Chwalibog, Department of Veterinary and Animal Sciences, University of Copenhagen, Frederiksberg, Denmark, Tel +45 40963573, Email [email protected]
Background: The various growth factors change the phenotype of neoplastic cells from sedentary (epithelial) to invasive (mesenchymal), which weaken intercellular connections and promote chemotaxis. It can be assumed that the use of anti-inflammatory polyhydroxyfull nanofilms will restore the sedentary phenotype of neoplastic cells in the primary site of the tumor and, consequently, increase the effectiveness of the therapy.
Methods: The studies were carried out on liver cancer cells HepG2, C3A and SNU-449, and non-cancer hepatic cell line THLE-3. Transforming growth factor (TGF), epidermal growth factor and tumor necrosis factor were used to induce the epithelial–mesenchymal transition. C60(OH)40 nanofilm was used to induce the mesenchymal–epithelial transition. Obtaining an invasive phenotype was confirmed on the basis of changes in the morphology using inverted light microscopy. RT-PCR was used to confirm mesenchymal or epithelial phenotype based on e-cadherin, snail, vimentin expression or others. Water colloids at a concentration of 100 mg/L were used to create nanofilms of fullerene, fullerenol, diamond and graphene oxide. The ELISA test for the determination of TGF expression and growth factor antibody array were used to select the most anti-inflammatory carbon nanofilm. Mitochondrial activity and proliferation of cells were measured by XTT and BrdU tests.
Results: Cells lost their natural morphology of cells growing in clusters and resembled fibroblast cells after adding a cocktail of factors. Among the four allotropic forms of carbon tested, only the C60(OH)40 nanofilm inhibited the secretion of TGF in all the cell lines used and inhibited the secretion of other factors, including insulin-like growth factor system. Nanofilm C60(OH)40 was non-toxic to liver cells and inhibited the TGF-β 1/Smad pathway of invasive cells treated with the growth factor cocktail.
Conclusion: The introduction of an anti-inflammatory, nontoxic component that can induce the mesenchymal–epithelial transition of cancer cells may represent a future adjuvant therapy after tumor resection.
Keywords: carbon allotropes, epithelial phenotype, growth factors, hepatocellular carcinoma, mesenchymal phenotype, metastasis
Graphical Abstract:

Introduction
Hepatocellular carcinoma (HCC) is a malignant, rapidly growing cancer of the digestive system; it is more common in men and rarely presents with clinical signs in the early stages.1 Delayed diagnosis of liver cancer and distant metastases after surgical resection of the tumor results in a patient survival of 4 months.2,3 Poor prognosis is related to the secretion of cytokines into the extracellular matrix (ECM), which induces the epithelial–mesenchymal transition (EMT) of tumor cells and subsequent vascular invasion. Little is known about therapies based on metastatic inhibition and protection against recurrence.4
EMT is a reversible process of the cell transition toward the mesenchymal lineage (ie, invasive). In this process, cell dormancy is replaced by the ability to migrate and settle in distant places. The mesenchymal phenotype is associated with the apical-basal polarization of cells and weakens the strong intercellular connections and connections with the ECM.4 In physiological conditions, the cells adopt the mesenchymal phenotype during embryogenesis, inflammatory processes, and tissue repair; it is called EMT type I. Fibrosis of the liver, lung, and kidney correlates with the EMT type II phenotype. In addition to cancer cells, stromal cells (ie, fibroblasts) can undergo transformation (EMT type III).4,5 Cancer cells increase the production of fibronectin and collagen type I and type III to promote the mesenchymal phenotype and single cell or collective migration.6 However, EMT is difficult to observe because cancer cells often do not complete it.7
The cellular microenvironment plays a key role in maintaining polarization and preventing the transformation from indolent to aggressive states via mechanochemical signals.6 The ECM is a mosaic of various structural and functional proteins, saccharides, and other compounds, such as cytokines.8 Some studies have reported that chronic inflammation promotes an invasive cell phenotype via secretion of growth factors.9 Many growth factors are secreted in the human body at the same time. Growth factors are produced by cancer cells and tumor-associated cells, that is, fibroblasts, endothelial cells, and immune cells. Furthermore, growth factors are produced during DNA damage and oncogenesis.10 Individual cytokines affect other cytokines, and they can activate each other. For example, an increase in transforming growth factor (TGF) secretion increases epidermal growth factor (EGF) secretion, which causes cytoskeletal remodeling and altered cell motility.4 Cells have surface receptors that communicate with the components of the ECM and can change the behavior of cells. Thus, the connection of growth factors with their receptors induces several changes at the RNA and protein levels.10
EMT gene expression is regulated by transcription regulators—Smad proteins, phosphorylated in the TGF/TβRII/TβRI pathway.11 TGF-β is secreted as latent precursor molecules; therefore, they require binding to the type II receptor (TβRII) to be activated. TβRII is a serine/threonine kinase present in the cell membrane. TGF-β–TβRII complexes phosphorylate TGF-β type I receptor (TβRI). Activated TβRI then recruits Smad proteins and phosphorylates them.10 Smad2/3 creates a heterocomplex with Smad4 that travels to the nucleus. In the nucleus, Smad binds to transcription factors (Snail, Slug, Twist, and Zeb), and this complex regulates the expression of genes, including vimentin, E-cadherin, N-cadherin, metalloproteinases, claudin, and desmoglein.12,13 Thus, the TGF-β/Smad pathway connects the ECM and the cell surface with the cell nucleus.11
Currently, little is known about the effects of carbon nanomaterials, in particular carbon films, on EMT and the TGF-β1/Smad pathway. It seems that the epithelial phenotype can be stimulated by using designed nanomaterial with unique properties, such as low toxicity, promotion of good settling of cancer cells, and low immunogenicity.14 The last factor is particularly important considering how cytokines induce the mesenchymal phenotype.15,16
After passing through the vessels and migrating to distant organs, a cancer cell becomes settled by undergoing the mesenchymal–epithelial transition (MET).4 It seems that the key way to fight cancer is to block EMT or to stimulate MET at the site of the primary focus by altering the ECM. Cells with an epithelial phenotype, concentrated in one place, are an easier target for anticancer therapies than mesenchymal cells.3 Thus, the main goal of this study was to determine whether fullerene might enhance MET of liver cancer cells in in vitro conditions.
Fullerenes (C60) are hollow truncated icosahedrons with a molecular diameter of 0.7 nm. Fullerene exhibits antioxidant, hepatoprotective, and anti-inflammatory properties,17,18 which are associated with its high affinity for electrons and lipophilicity, and ability to absorb and deactivate free radicals.19 The application of fullerene in the pharmaceutical and biological sectors is difficult due to its low solubility in polar solvents. The presence of as many as 30 double bonds in the C60 structure and the ability to accept electrons facilitate the modification of fullerene to a water-soluble form, namely fullerenol (hydroxyfullerene). Fullerenol with a small number of oxygen groups can be produced by metabolic processes. The number of oxygen substituents in the fullerene structure (from 4 to 44) determines its antioxidant and anti-inflammatory properties.20 Shimizu et al reported that the fullerenols C60(OH)6–12 and C60(OH)12 are more cytotoxic than C60, C60(OH)2, and C60(OH)36 for primary cultured rat hepatocytes, human hepatoma HepG2 cells, and rat hepatoma dRLh-84 cells.21 The low toxicity of fullerenols is related to their easy ability to penetrate cell membranes and damage mitochondria, as well as the presence of tetrahydrofuran, which remains after the synthesis stage of these nanostructures.22 Fullerenes and fullerenols do not cause acute and subacute toxicity in vivo at low doses (75–150 mg/kg), although they accumulate in the liver and may have a long-term effect on it.2,17,23 However, a high dose of fullerene, above 300 mg/kg, causes behavioral disturbances and liver pathological changes in mice after a single intraperitoneal injection.23 In another study, fullerenol C60(OH)30 administered with yeast medium (2 mg/mL) did not affect the lifespan and behavior of fruit flies (Drosophila melanogaster).19
Oncological studies have shown that fullerenols inhibit angiogenesis and hepatoma growth in a mouse model,24 suppress microtubule synthesis, regulate actin polymerization and depolymerization, and increase cell membrane permeability and cytosol diffusion in HCC SMMC-7721 cells.25 Liu et al showed that metallofullerenol nanomaterial Gd@C82(OH)22 blocks EMT, resulting in efficient elimination of breast cancer stem cells.17 To our knowledge, this study represents the first time that fullerenol has been used as a surface that promotes the adhesion of cells with a metastatic phenotype (MET) and not as a blocker of the process in which cells only acquire the ability to migrate (EMT).
Materials and Methods
Ethics approval: not applicable.
Cell Cultures
The normal adult liver epithelial cell line THLE-3 (CRL-11233) was purchased from the American Type Culture Collection (ATCC, Manassas, VA, USA). After thawing, the THLE-3 cells were maintained at 37 °C in a humidified atmosphere containing 5% CO2 in Bronchia/Trachea Epithelial Cell Growth Medium (No. 511–500, Sigma-Aldrich, St. Louis, MO, USA). After the third passage, THLE-3 cells were cultured in Dulbecco’s Modified Eagle’s Medium/Nutri (DMEM/F12, D8062, Sigma-Aldrich) supplemented with 10% fetal bovine serum (FBS, Life Technologies, Houston, TX, USA), penicillin (100 U/mL), and streptomycin (100 mg/mL, Life Technologies, Grand Island, NY, USA).
Liver cancer cell lines, HepG2 (HB-8065), C3A (CRL-10741), and SNU-449 (CRL-2234), were obtained from the ATCC. The cells were maintained at 37 °C, under 5% CO2, in Dulbecco’s Modified Eagle Medium, Low Glucose (DMEM, Gibco, Thermo Fisher Scientific, Waltham, MA, USA) for HepG2 and C3A cells, and Roswell Park Memorial Institute 1640 (RPMI 1640, Gibco, Thermo Fisher Scientific) for SNU-449 cells. DMEM and RPMI media were supplemented with 10% FBS (Life Technologies), penicillin (100 U/mL), and streptomycin (100 mg/mL, Life Technologies).
THLE-3, HepG2, C3A and SNU-449 cells were seeded on 6-well and 96-well plates at a concentration of 1.5 × 10⁵ and 1 × 10⁴, respectively.
Physicochemical Characterization of Carbon Colloids and Carbon Nanofilms
Diamond nanoparticles (ND), produced by the explosion method, and graphene oxide flakes (GO), produced by a modified Hummers method, were obtained from SkySpring Nanomaterials, Inc. (Houston, TX, USA). Fullerenes (C60) were purchased from SES Research (Houston, TX, USA) and produced by the arc discharge method. Fullerenols (C60(OH)40) were purchased from US Research Nanomaterials, Inc. (Houston, TX, USA). The starting material of C60(OH)40 was pure C60 fullerenes, which were functionalized by more than 40 hydroxyl groups (water solubility >50 mg/mL). The physicochemical characteristics of ND, GO, and C60 are found in our other publications.26–28
Characterization of C60(OH)40 Nanoparticles
C60(OH)40 nanoparticles were purchased as a powder, dispersed into ultrapure Milli-Q water (100 mg/L), and sonicated in an ultrasonic bath (Bandelin Electronic, Berlin, Germany). The morphology of the C60(OH)40 nanoparticles was characterized using transmission electron microscopy (TEM: JEM-1220 JEOL, Tokyo, Japan) in two independent samples. The zeta potential was determined with a Nano-ZS90 Zetasizer (Malvern Instruments, Malvern, UK) in triplicate.
A small drop of a dark brown suspension of fullerenol at a concentration of 1% was placed on a KRS plate with a pipette. Then, it was covered with another KRS plate to form a fine film. The two KRS plates with fullerenol between them were mounted in a plate holder that was placed in the measuring chamber of System 2000 Perkin Elmer Fourier-transform infrared (FTIR) spectrometer. The spectrum was registered in transmission mode in the range of 4000–400 cm−1, with a resolution of 4 cm−1. The spectrum comprised 30 scans. The spectrum of the sample was background corrected using a spectrum registered previously with the empty measuring chamber.
Characterization of C60(OH)40 Nanofilms
Atomic force microscopy (AFM) was performed directly on the nanofilms and uncoated plates. C60(OH)40 aqueous solution (100 mg/L) was used to form a nanofilm by applying 1 mL of the solution to the bottom of the wells of 6-well plates. After colloid evaporation, nanofilm had perfectly adhered to the bottom of the plastic wells as a thin layer. AFM imaging was performed using the MFP 3D Bio AFM with a commercial triangular cantilever (MLCT Bruker, Camarillo, CA, USA), with a spring constant of k = 0.10 N/m, in AC mode, and in air. Six pictures were taken of two independent samples.
Selection of Carbon Nanomaterial That Can Promote the Mesenchymal–Epithelial Transition
THLE-3, HepG2, C3A, and SNU-449 cells were grown on carbon nanofilms for 24 h. The purpose was to find the most anti-inflammatory and nontoxic nanofilm.
Growth Factor Assays
The inflammatory response of THLE-3, HepG2, C3A, and SNU-449 cells cultivated on ND, GO, C60, and C60(OH)40 nanofilms was measured using the TGF beta1 Human ELISA Kit (No. BMS249-4, Thermo Fisher Scientific). After incubation for 24 h, cell culture supernatant (free of FBS) was collected and concentrated seven times using Amicon® Ultra 15 mL centrifugal filters with a 3 kDa cut-off (Millipore, Bedford, MA, USA). To activate latent TGF-β1 to the immunoreactive form, 20 µL of 1 N HCl was added to 200 µL of the concentrated sample. After incubation for 1 h at room temperature, samples were neutralized by the addition of 20 µL of 1 N NaOH. A standard curve was prepared in the range from 2000 to 31 pg/mL human TGF-β1. All samples were run in triplicate steps according to the manufacturer’s instructions. Color changes were measured at 450 nm.
The quantitative detection of human TGF-β1 provided information about the immunogenicity of the nanofilms. Detailed analysis of secreted growth factors and released receptors was assessed on the least immunogenic nanofilm, made of C60(OH)40, using the Human Growth Factor Antibody Array (ab134002, Abcam, Cambridge, UK). All samples were run in duplicate according to the manufacturer’s recommendations. Cells were cultured on nanofilm for 24 h; then, the FBS-free culture medium was collected. The culture medium was centrifuged at 5500 rpm for 20 min to remove any cellular debris for the test and concentrated using Amicon® Ultra 15 mL centrifugal filters with a 3 kDa cut-off (Millipore). Protein concentrations were measured by a bicinchoninic acid protein assay (Sigma-Aldrich). A total of 370 µg of protein was added for each array membrane. Forty-one human growth factor expressions were detected using Azure c400 (Azure Biosystems, Dublin, CA, USA).
Metabolic Activity Assay
The toxicity of C60(OH)40 nanofilm was assessed using the XTT assay kit (Roche, Mannheim, Germany). XTT is cleaved to formazan by succinate reductase, which belongs to the mitochondrial respiratory chain (EC 1.3.99.1) of living cells. Cells were transferred to a 96-well plate with nanofilms and cultured for 24 h in a medium containing 10% FBS. Electron coupling reagent (0.1 mL) was mixed with XTT labeling reagent (5 mL), and then the mixture was added to each culture well (50 µL of XTT labeling mixture per 100 µL of culture medium with cells). After incubation for 1 h at 37 °C, the absorbance was measured using a Tecan Infinite 200 microplate reader (Tecan, Durham, NC, USA) at 492 nm and with a reference wavelength of 690 nm.
Optimization of the Epithelial–Mesenchymal Transition
After incubating cells on new plates overnight, the full medium was replaced with a low-serum medium (DMEM/F12, DMEM, and RPMI with 2% [v/v] FBS) containing growth factors to facilitate the mesenchymal transformation of THLE-3, HepG2, C3A, and SNU-449 cells. Three types of growth factors were used for EMT induction: TGF-β1 (No. ab50036, Abcam), tumor necrosis factor alpha (TNFα, No. PHC3015, Thermo Fisher Scientific), and EGF (No. PHG0315, Thermo Fisher Scientific) at a concentration of 10 and 20 ng/mL growth medium. In the human body, growth factors act together. For this reason, the growth factors were mixed in a weight ratio of 1:1:1, and their activity (synergism, antagonism) was checked. The growth factor cocktail was added to the cells at a final concentration of 10 ng/mL (3.33 ng of TGF, 3.33 ng of TNF, and 3.33 ng of EGF) and/or 20 ng/mL (6.67 ng of TGF, 6.67 ng of TNF, and 6.67 ng of EGF). Treated and untreated cells (control) were incubated for 24 and/or 48 h.
Confirmation of the Mesenchymal Phenotype
For each cell line (THLE-3, HepG2, C3A, and SNU-449), the mesenchymal phenotype was assessed with the following groups: (1) untreated group, control; (2) group treated with TGF-β1; (3) group treated with TNF-α; (4) group treated with EGF; and (5) group treated with the growth factor cocktail.
Changes in Metabolic Activity and Proliferation of Cells
Cell proliferation, viability, and cytotoxicity were determined with the XTT assay kit (Roche). Cells were transferred to a 96-well plate, treated with growth factors at 10 and 20 ng/mL, and cultivated for 24 and 48 h as described in section “Optimization of the epithelial–mesenchymal transition”. The next steps were carried out as described in section “Metabolic activity assay”.
Cell proliferation was studied using a kit for measuring DNA synthesis; it is based on incorporation of thymidine analog (Roche). After the addition of growth factors at a concentration of 20 ng/mL, all cell lines were cultivated for 24 h. Then, 20 µL of 100 µM bromodeoxyuridine (BrdU) solution suspended in culture medium was added to each well of a 96-well plate. The cells were labeled with BrdU for 24 h. All subsequent steps were carried out according to the manufacturer’s instructions. The plate was analyzed with a Tecan Infinite 200 microplate reader at 370 nm with a reference wavelength of 492 nm.
Changes in Cell Morphology
An inverted light microscope (Leica, TL-LED, Wetzlar, Germany) was used to assess the cell morphology and the effectiveness of EMT induction after the addition of growth factors. After incubating cells with growth factors for 48 h, cells were stained with May Grünwald-Giemsa stain. For each group of cells, five photos were taken with a digital camera (Leica MC190 HD) and LAS V4.10 software (Leica).
Changes in Messenger RNA Expression
Cell cultures were maintained with the addition of growth factors (20 ng/mL) and according to the groups described in section “Confirmation of the mesenchymal phenotype”. After incubation for 48 h, cells were detached from 6-well plates and centrifuged at 1200 rpm. RNA was isolated using the PureLink® RNA Mini Kit (Ambion™ Life Technologies, Foster City, CA, USA). Cell pellets were resuspended and dispersed in 0.4 mL of lysis buffer with 1% 2-mercaptoethanol. Cell lysates were fixed in ethanol at a 1:1 ratio and transferred to the columns. The binding, washing, and elution steps were then performed according to the manufacturer’s protocol. The RNA purity and concentration were measured using a NanoDrop™ One/OneC Microvolume UV-Vis Spectrophotometer (Thermo Fisher Scientific). Purified RNA was kept at −80 °C.
The samples were diluted to the lowest RNA concentration of all the samples. For complementary DNA (cDNA) synthesis, a 10 µL was prepared including RNA mixture in water, 2 µL of 10× RT Buffer, 0.8 µL of 25× dNTP Mix, 2 µL of 10× RT Random Primers, and 1 µL of MultiScribe™ Reverse Transcriptase (High-Capacity cDNA Reverse Transcription Kit, Applied Biosystems, Foster City, CA, USA). Reverse transcription was performed using a 2720 Thermal Cycler (Thermo Fisher Scientific) and the following temperature cycle: 10 min at 25 °C, 120 min at 37 °C, and store at 4 °C. cDNA was stored at −20 °C.
The cDNA concentration was measured and then diluted to 20 ng/µL. Ultrapure water and a mix of cDNA from all groups was used as a primer control to ensure the purity of the reaction. Real-time polymerase chain reaction (PCR) with the ΔΔCT method was used to measure messenger RNA (mRNA) expression. First, 5 µL of cDNA (100 ng) was transferred to each well of a 48-well plate. Then, 10 µL of a solution containing 0.75 µL of forward primer (10 µM), 0.75 µL of reverse primer (10 µM), 7.5 µL of Power SYBR™ Green PCR Master Mix (Thermo Fisher Scientific), and 1 µL of ultrapure water was added to each well. The following genes were examined: SNAI1 (encodes Snail), CDH1 (encodes E-cadherin), CDH2 (encodes N-cadherin), MMP2 (encodes matrix metalloproteinase-2), MMP9 (encodes matrix metalloproteinase-9), and GAPDH (encodes glyceraldehyde-3-phosphate dehydrogenase) (Table 1). GAPDH was used as the reference gene. The reaction conditions were 95 °C for 10 min, followed by 40 cycles of 95 °C for 15s and 60 °C for 60s. There were four replicates for each sample. The amplification was performed using a StepOnePlus™ Real-Time PCR System (Thermo Fisher Scientific). The results were calculated according to ΔCT = CT gene − CT gapdh and -ΔΔCT = -(ΔCT gene – ΔCT control).
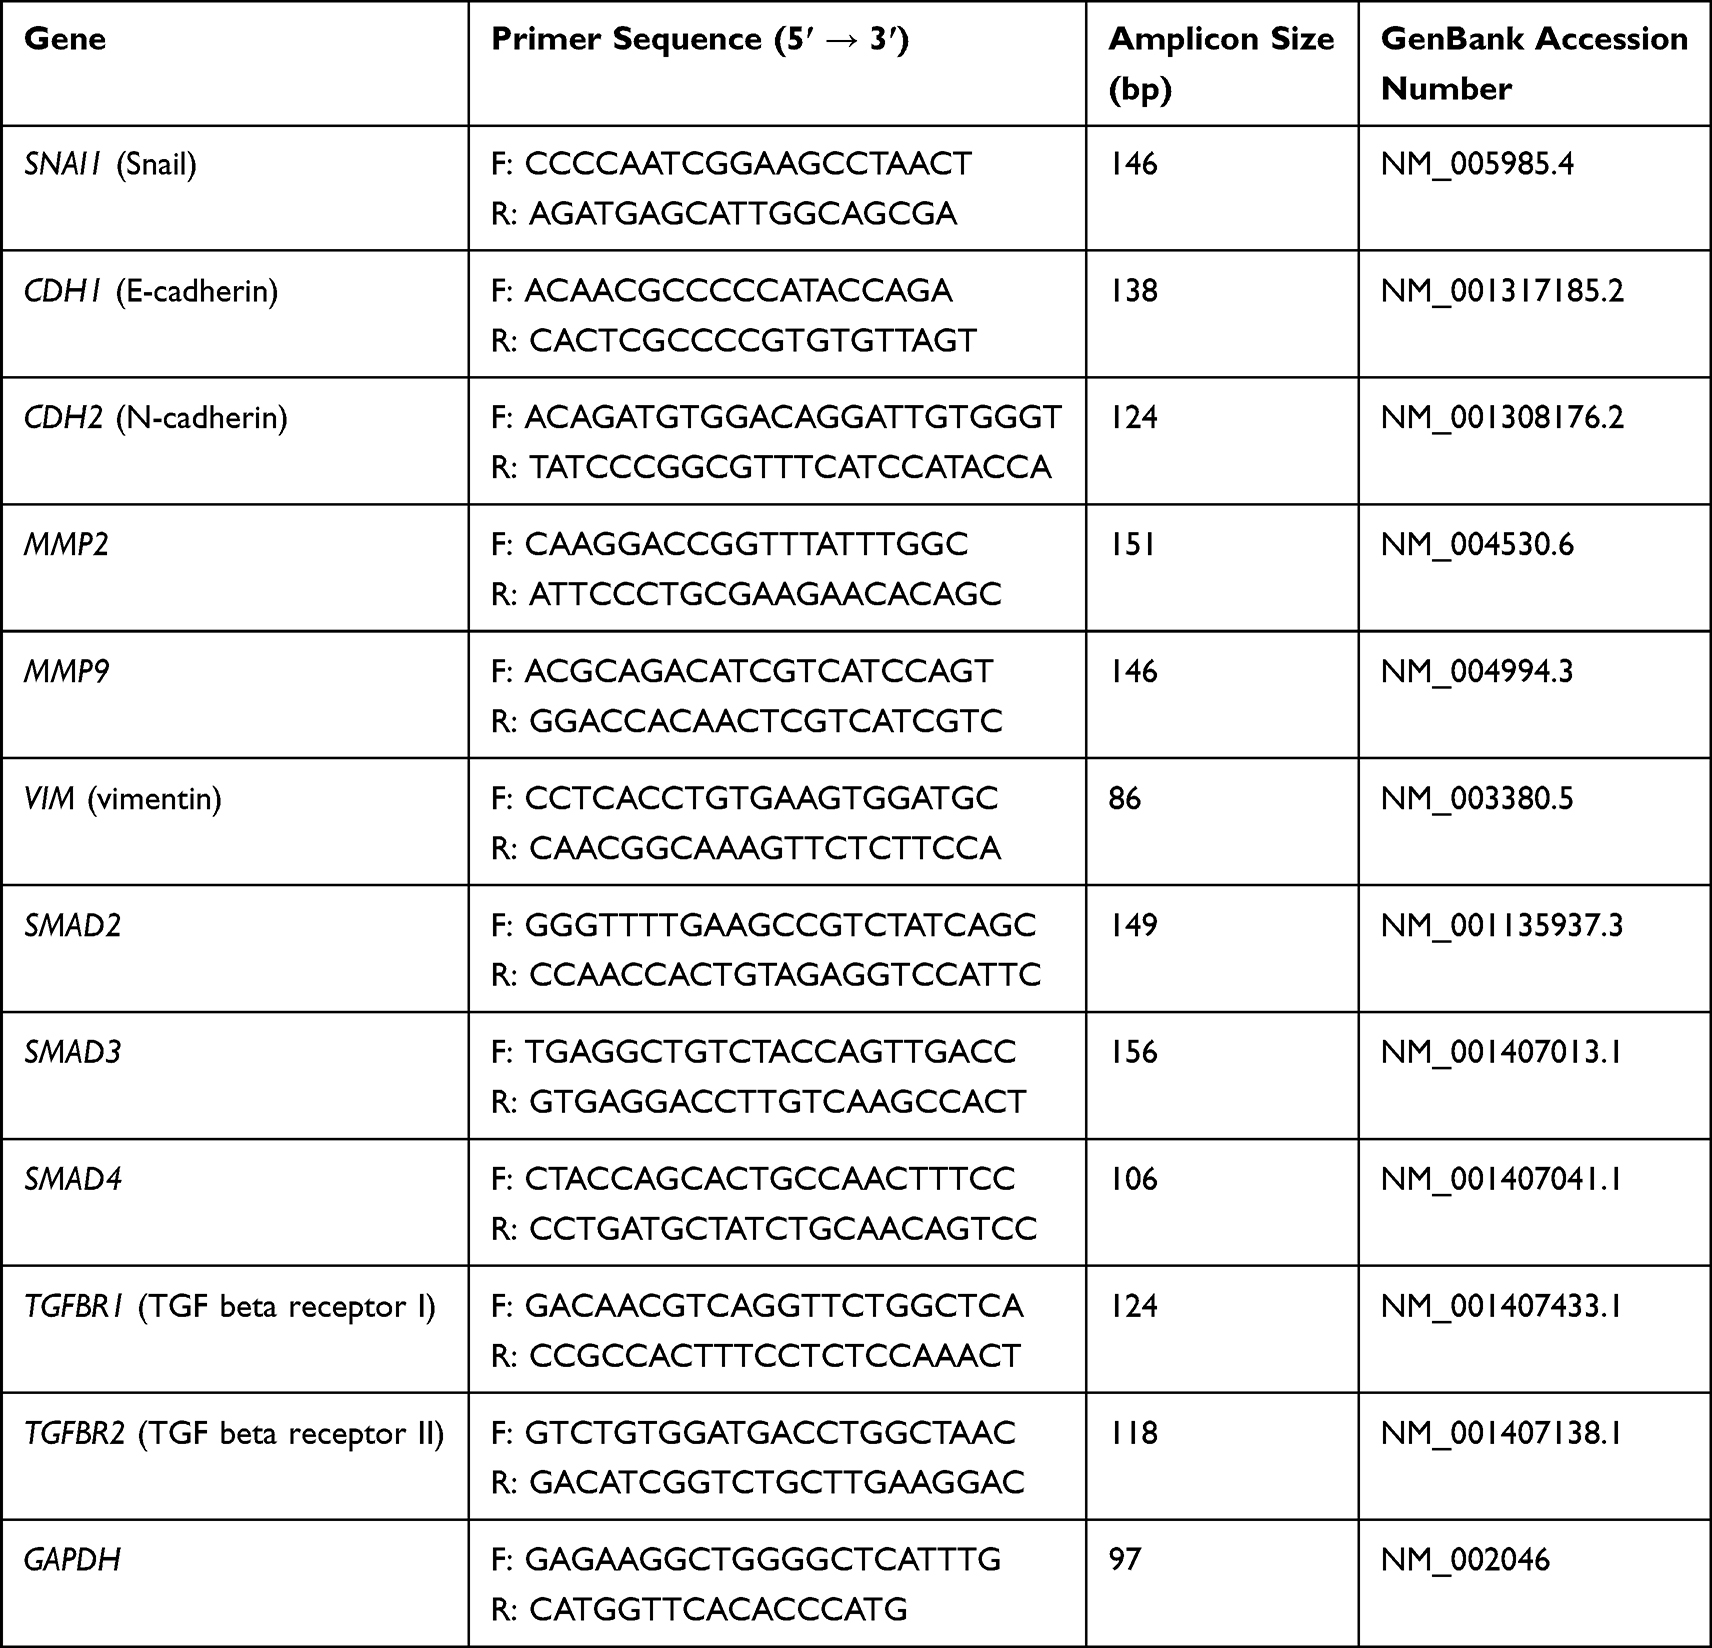 |
Table 1 Primers Used to Evaluate the Expression of Genes Involved in the Epithelial–Mesenchymal Transition and the Transforming Growth Factor Beta1 (TGF-β1) Pathway |
Promotion of the Mesenchymal–Epithelial Transition
THLE-3, HepG2, C3A, and SNU-449 model (mesenchymal) cells, induced by a growth factor cocktail (20 ng/mL) for 48 h in section “Optimization of the epithelial–mesenchymal transition” were used for these experiments. Mesenchymal cells were trypsinized and collected by centrifugation. Then, cells were transferred to C60(OH)40-coated (research group) or uncoated (control) 6-well plates at a concentration 1.5 × 10⁵ and maintained in low-serum medium. There were two groups for each cell line: (1) control, mesenchymal cells cultivated on uncoated plates; and (2) mesenchymal cells cultivated on C60(OH)40 nanofilms. MET was evaluated after 24 h of incubation.
Changes in Gene Expression at the mRNA Level
After incubation for 24 h, the cells were detached and harvested by centrifugation. RNA isolation, reverse transcription, and real-time PCR were performed as previously described. The expression of SNAI1, CDH1, CDH2, VIM, SMAD2, SMAD3, SMAD4, TGFBR1, and TGFBR2 was determined (Table 1).
Statistical Analysis
Data are presented as mean values with standard deviation. The data were analyzed using one-way analysis of variance (ANOVA) with Tukey’s multiple comparison test (Statgraphics Plus 4.1, StatPoint Technologies, Warrenton, VA, USA). Two-way ANOVA was used only for the XTT assay in section “Changes in metabolic activity and proliferation of cells”. Comparison between two research groups was carried out using the t-test. Differences at with a p ≤ 0.05 were defined as statistically significant.
Results
Physicochemical Characteristics of the Nanomaterials
Carbon nanoparticles such as ND, GO, C60, and C60(OH)40 were used, from which aqueous solutions were prepared. The obtained solutions were used to cover the surface of cell culture plates, creating a nanofilm on the bottom of the wells. Nanofilms were used to mimic ECM to study the influence of the cellular microenvironment, especially its structural features, on the oncogenic potential of cells. In previous studies, ND, GO, and C60 nanofilms were analyzed and characterized.26–28 Thus, only fullerenol has been investigated and characterized in this publication. The most important physical and chemical characteristics of all nanomaterials are presented in Table 2.
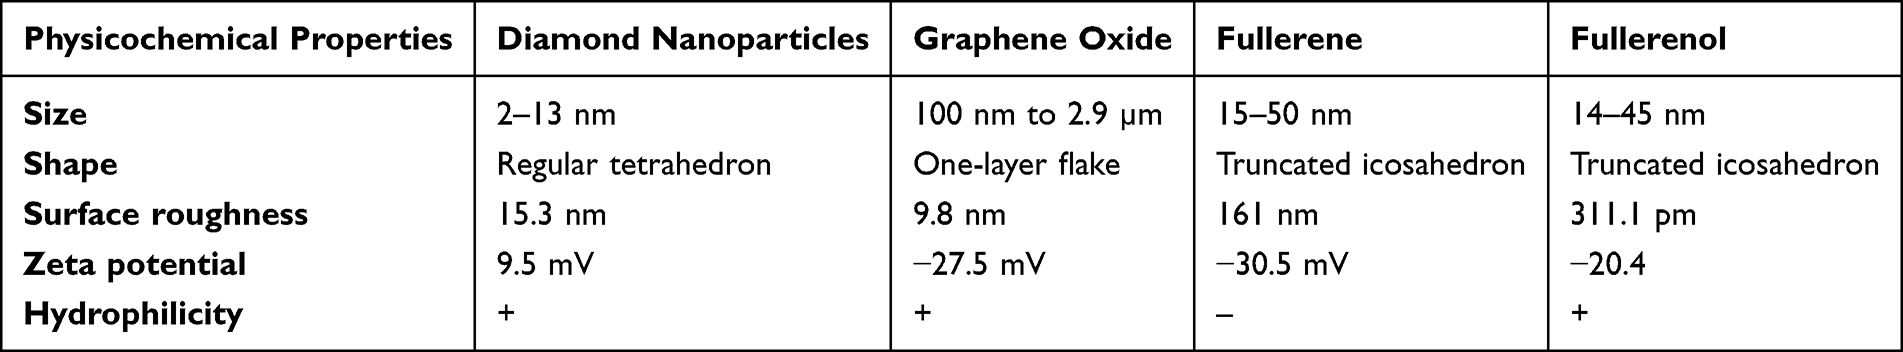 |
Table 2 Physicochemical Properties of Carbon Nanomaterials Include Diamond Nanoparticles, Graphene Oxide, Fullerene and Fullerenol |
Characterization of Fullerenol Nanoparticles
The fullerenol used was a dark slightly yellowish powder that was well dispersible in water. The zeta potential of fullerenol was −20.4 ± 2.1 mV, indicating moderate stability of the aqueous colloid. Fullerenol nanoparticles viewed under a transmission electron microscope were round and polydisperse (polydispersity index = 0.55) and were 14–45 nm in size (Figure 1A).
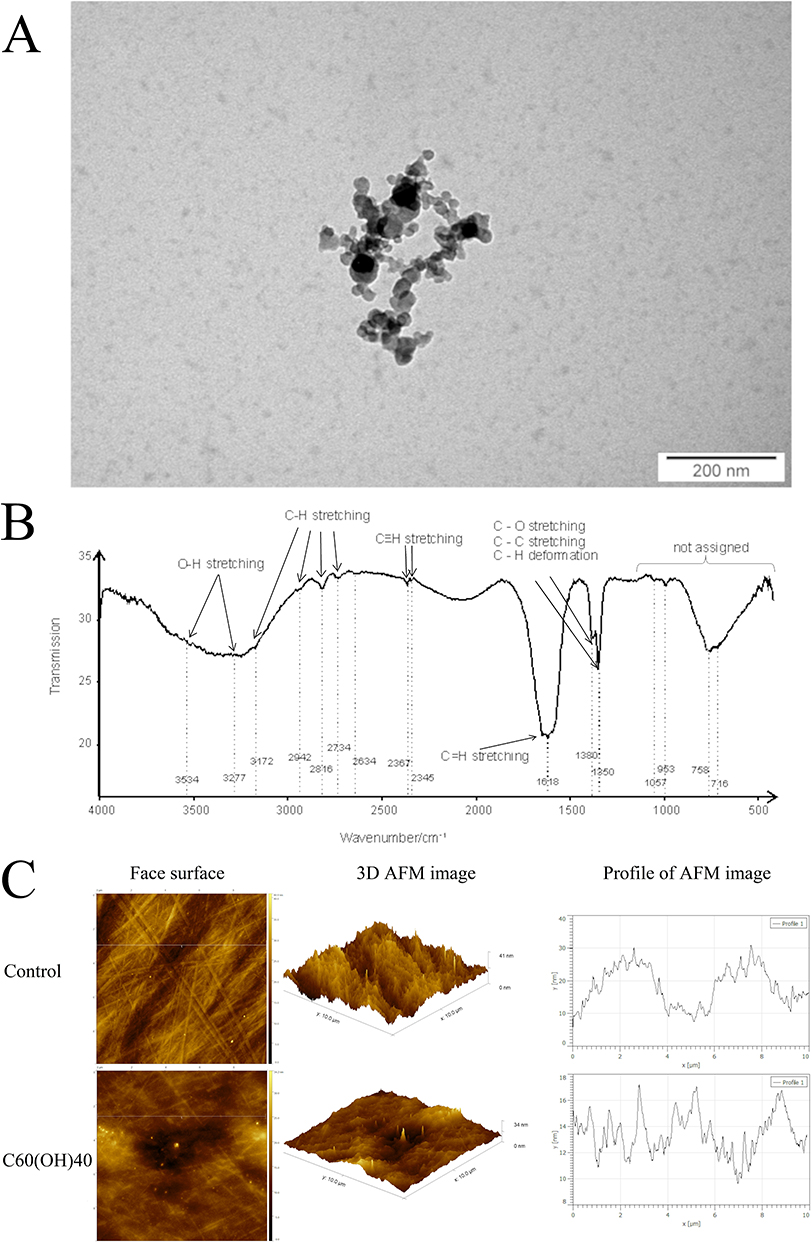 |
Figure 1 Characterization of the morphology and surface chemistry nanoparticles of fullerenol and roughness of nanofilm using transmission electron microscopy ((A); scale bar is 200 nm), Fourier-transform infrared spectroscopy (B) and atomic force microscopy (C). (C) Comparison of the topography between an ordinary polystyrene plate (control; the scale bar is 10 µm × 10 µm × 41 nm) and a polystyrene plate coated with fullerenol (C60(OH)40; the scale bar is 10 µm × 10 µm × 34 nm). The figure shows a two-dimensional image (left side), a three-dimensional image (center), and height profiles of fullerenol (right side). Abbreviations: AFM, atomic force microscopy; C60(OH)40, fullerenol. |
The FTIR spectrum of fullerenol contains several distinct bands of different intensities and structures located in the entire registered spectral region of 4000–400 cm−1 (Figure 1B). The wide band of strong intensity located at the very left of the group spectrum is asymmetrical, without a clear center. It is generated by vibrations of the O-H group from water and the O-H group attached to carbon (alcohol-like group). The deconvolution procedure proved the presence of two centers of bands, at 3534 cm−1 (water group) and 3277 cm−1 (alcohol-like group). The next spectral range with characteristic bands is 3200–2600 cm−1. Five weak bands located at 3172, 2942 2816, 2734, and 2634 cm−1, respectively, are present in this range. They are due to C-H stretching vibrations. According to data from the literature, the band at 3172 cm−1 (shoulder) is due to C-H stretching from cyclic hydrocarbons, while four remaining bands (all of weak intensity) are due to the presence of C-H groups from chain hydrocarbons. The band at 2367 cm−1 (weak intensity) followed by a band of very weak intensity at 2345 cm−1 are both due to the presence and vibrations of triple carbon–carbon bonds. On the right of the spectrum (lower wavenumbers) is a wide band with a center at 2089 cm−1 that could not assign in this study due to a lack of adequate data from the literature. The structured, very-strong band at 1618 cm−1 is due to stretching of carbon–carbon double bonds. Bands at 1380 and 1350 cm−1 are due to C–O or C–C stretching or deformation of C–H groups. The presence of all three groups is expected in the studied sample, and they overlap. The band at 1380 cm−1, which does not show a well-defined center, can be considered an overlap of signals from two different vibrating groups. The region below 1350 cm−1 is considered a fingerprint region, and assignment of bands present in this region is quite difficult. There are two weak bands (1057 and 953 cm−1) and two strong bands (758 and 716 cm−1) in this region.
The presence of the aforementioned bands in the FTIR spectrum evidences the presence of carbon occurring in different types of hybridizations. This, in turn, proves the mixed structure of the studied fullerenol. It consists of carbon chains (sp3 hybridization) and rings (sp2 hybridization) as well as triple-bonded carbons (sp hybridization). Oxygen in the form of O-H groups attached to both carbon rings and chains is also present in the sample.
Characterization of Fullerenol Nanofilm
The surface of the culture plates on which the tumor cells were grown was covered with an aqueous solution of fullerenol. The AFM analysis showed that the surface of the plate coated with the C60(OH)40 nanofilm was two times less rough compared with the control plate (control: 770 pm; C60(OH)40: 311 pm) (Table 3). The AFM profile showed that the control plate had significantly fewer peaks with higher roughness values than the C60(OH)40 nanofilm plate. The C60(OH)40 nanofilm reduced the roughness height of the plate while preserving its irregular topography (Figure 1C).
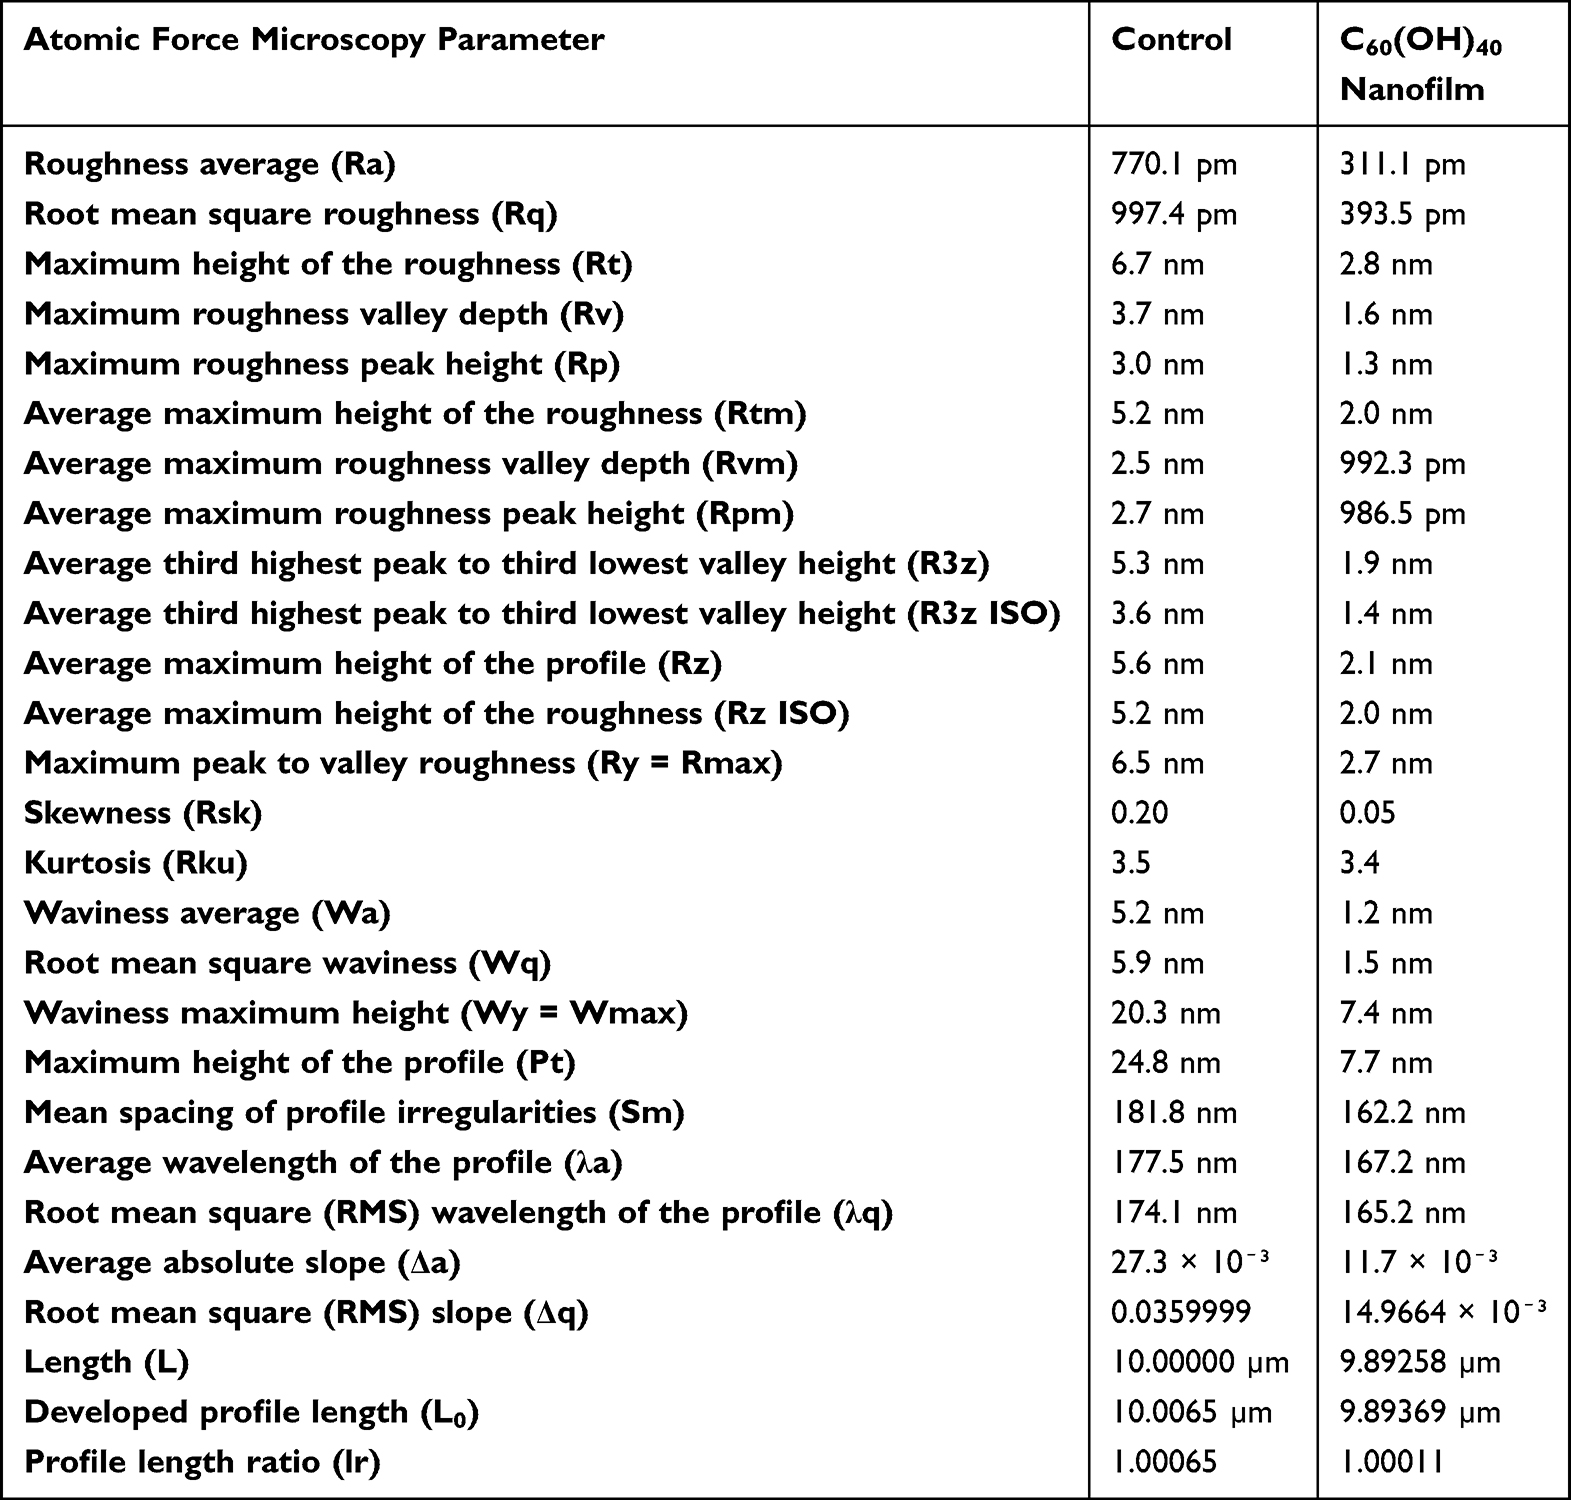 |
Table 3 The Roughness Parameters of Uncoated and Fullerenol-Coated Plates Obtained from Atomic Force Micrographs |
Influence of Carbon Nanofilms on the Behavior of THLE-3, HepG2, C3A, and SNU-449 Cells
Effect of Surface on the TGF-β1 Level
The cell’s perception of the physicochemical properties of the surface largely determines its secretory status and, consequently, its oncogenic potential. Thus, we analyzed the influence of surfaces on the level of TGF-β1, which is the driver of EMT.
Only C60(OH)40 nanofilm significantly reduced the level of TGF-β1 in the culture medium of THLE-3 cells (Figure 2Aa). For HepG2 cells, ND and GO nanofilms increased TGF-β1 in the medium, while C60(OH)40 nanofilm decreased TGF-β1 (Figure 2Ab). There was a similar trend for C3A cells, with increased TGF-β1 in the GO and ND nanofilm groups, and a decrease in the C60(OH)40 nanofilm group (Figure 2Ac). TGF-β1 was decreased in the culture medium of all SNU-449 groups, with the greatest decrease in the C60(OH)40 nanofilm group (Figure 2Ad).
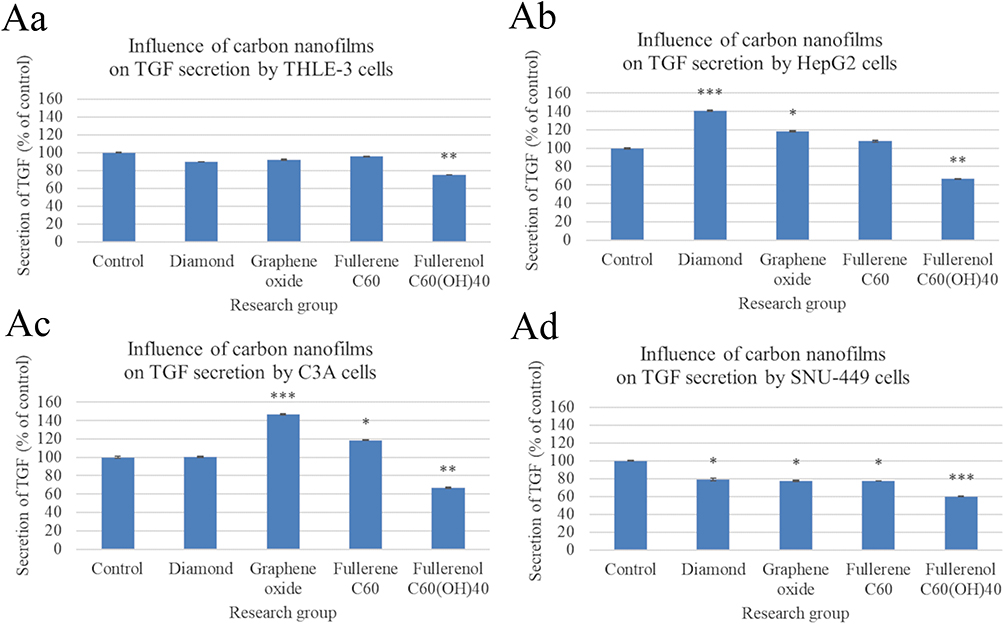 |
Figure 2 Analysis of active transforming growth factor beta1 (TGF-β1) levels in culture medium by enzyme-linked immunosorbent assay after cultivating cells on carbon nanofilms for 24 h. There were significant differences in TGF-β1 secreted by control and nanofilm-treated THLE-3 cells ((Aa), p = 0.011), HepG2 cells ((Ab), p < 0.001), C3A cells ((Ac), p < 0.001), and SNU-449 cells (Ad, p = 0.011). Differences with a p-value ≤ 0.05 were defined as statistically significant compared to the control group: one asterisk (*), p-value ≤ 0.05; two asterisks (**), p-value ≤ 0.01; three asterisks (***), p-value ≤ 0.001. Abbreviation: TGF-β1, transforming growth factor beta1. |
Influence of Fullerenol Nanofilm on Toxicity and the Levels of Growth Factors Secreted by Cells
C60(OH)40 nanofilm was the most effective surface material, reducing TGF-β1 in all tested cell lines; hence, it was selected for further detailed investigation. First, the cytotoxicity of C60(OH)40 nanofilm was evaluated (Figure 3A). It did not reduce the viability of THLE-3, HepG2, and C3A cells. Although C60(OH)40 nanofilm was also not strongly cytotoxic for SNU-449 cancer cells, it caused a slight but significant 6.2% reduction in their viability (p = 0.011).
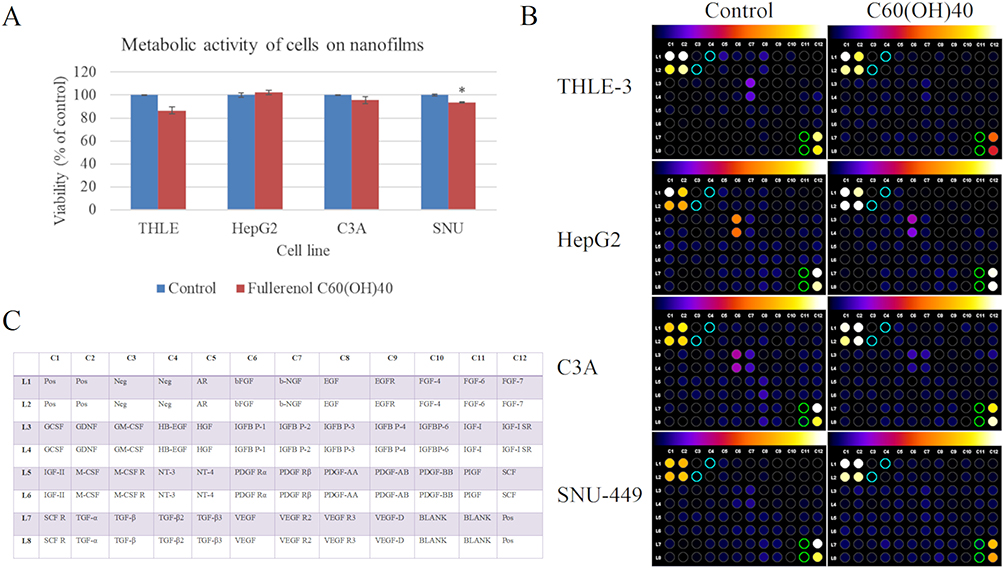 |
Figure 3 Influence of fullerenol nanofilm on toxicity and the levels of growth factors secreted by cells. (A) Metabolic activity of cells after 24 h incubation on fullerenol nanofilm determined with the XTT assay. There were significant differences between viability of SNU-449 control cells and cells grown on nanofilm C60(OH)40 (p = 0.011). Differences with a p-value ≤ 0.05 were defined as statistically significant compared to the control group: one asterisk (*), p-value ≤ 0.05. (B) The growth factor profile in culture media of cells growth on ordinary polystyrene plates and plates coated with C60(OH)40 nanofilm. Different colors indicate differences in protein expression with expression increasing from black to white according to scale above the photo. Negative controls and blanks are marked with blue and green circles and were used for background removal. The background was removed with Protein Array Analyzer for ImageJ software. (C) The table shows the location of individual growth factors on the protein membrane. The positive control (pos) was biotin-conjugated IgG. Cytokine expression was evaluated using densitometry software for a semi-quantitative comparison. Abbreviations: Pos, positive control; Neg, negative control; AR, amphiregulin; bFGF, basic fibroblast growth factor; b-NGF, basic nerve growth factor; EGF, epidermal growth factor; EGFR, epidermal growth factor receptor; FGF, fibroblast growth factor; GCSF, granulocyte colony-stimulating factor; GDNF, glial cell line-derived neurotrophic factor; GM-CSF, granulocyte-macrophage colony-stimulating factor; HB-EGF, heparin-binding EGF-like growth factor; HGF, hepatocyte growth factor; IGFBP, insulin-like growth factor binding protein; IGF, insulin-like growth factor; IGF-I SR, anti-insulin-like growth factor-I receptor; M-CSF, macrophage colony-stimulating factor; M-CSF R, macrophage colony-stimulating factor receptor; NT, neurotrophin; PDGF R, platelet-derived growth factor receptor; PDGF, platelet-derived growth factor; PIGF, placenta growth factor; SCF, stem cell factor; SCF R, placenta growth factor receptor; TGF, transforming growth factor; VEGF, vascular endothelial growth factor; VEGF R, vascular endothelial growth factor receptor. |
Next, the effect of C60(OH)40 nanofilm on the growth and pro-oncogenic potential of cancer cells was evaluated. This endeavor involved expression analysis of 41 human growth factors in culture medium after growing cells on C60(OH)40 nanofilm (Figure 3B and C). Cultivation of THLE-3 cells on C60(OH)40 nanofilm decreased the expression of most of the tested growth factors, including fibroblast growth factor (FGF), nerve growth factor (NGF), EGF, hepatocyte growth factor (HGF), insulin-like growth factor 1 (IGF-I), insulin-like growth factor binding protein (IGFBP), platelet-derived growth factor (PDGF), placenta growth factor (PIGF), and stem cell factor (SCF). There was an increase in vascular endothelial growth factor (VEGF) and insulin-like growth factor 2 (IGF-II), and no changes in TGF expression. C60(OH)40 nanofilm reduced the expression of most tested growth factors secreted by HepG2 cells, including FGF, NGF, EGF, IGFBP, IGF-I, IGF-II, PDGF, PIGF, SCF, VEGF, TGFα, and TGF-β3. On the other hand, there was increased HGF, TGF-β1, and TGF-β2 expression. There were similar results for C3A cells, a clone of the HepG2 cell line, except that the expression of IGF-II and all TGF types was increased under the influence of C60(OH)40 nanofilm. SNU-449 cells showed different results. Fullerenol nanofilm increased the expression of all growth factors except IGFBP1. Overall, the expression of IGFBP was most strongly reduced after cultivation on C60(OH)40 nanofilm, regardless of the cell line.
Optimization of the Epithelial–Mesenchymal Transition of THLE-3, HepG2, C3A and SNU-449 Cells via a Growth Factor Cocktail
Cancer cells with a mesenchymal phenotype (as opposed to an epithelial phenotype) have strong metastatic potential. Thus, to document the potential anti-cancer effect of the nanofilms on the evaluated cell lines, EMT procedure was performed by using TGF-β1, TNF, EGF, and a growth factor cocktail. Cytotoxicity, cell proliferation, and morphology, and the expression of selected genes under the influence of the applied growth factors were evaluated.
Cytotoxicity of Growth Factors After Culturing for 24 Hours
The potential cytotoxicity of the growth factors was examined by measuring their metabolic activity with the XTT assay after incubation for 24 h. THLE-3 cells supplemented with TNF, EGF, and a growth factor cocktail showed increased metabolic activity regardless of the concentration used (Figure 4Aa). The growth factors did not produce significant differences in HepG2 cell viability (Figure 4Ab). For the C3A line, depending on the concentration, there was a reduction in cell activity under the influence of TNF (20 ng/mL) and the growth factor cocktail (10 and 20 ng/mL) (Figure 4Ac). The SNU-449 cells were the most sensitive to growth factors: Viability decreased significantly under the influence of 10 ng/mL TGF-β1, TNF, and the growth factor cocktail, and after the addition of 20 ng/mL TGF-β1, TNF, EGF, and the growth factor cocktail (Figure 4Ad). For this reason, growth factors at a concentration of 20 ng/mL were used for the subsequent experiments in this section.
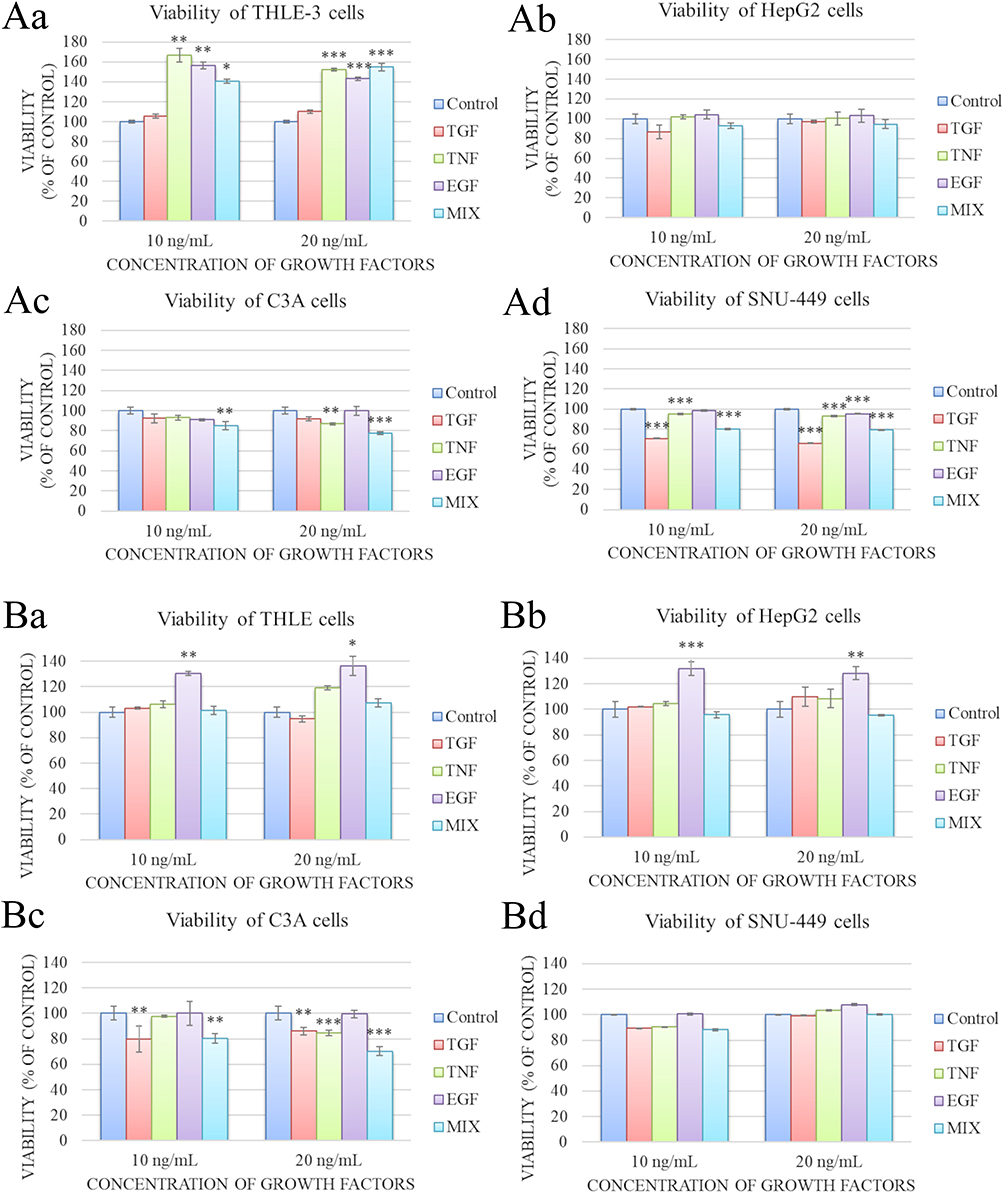 |
Figure 4 Metabolic activity of THLE-3, HepG2, C3A and SNU-449 cells after incubation for 24 h (Aa–Ad) and 48 h (Ba–Bd) in medium supplemented with 10 or 20 ng/mL growth factors (measured by the XTT assay). The growth factor concentration was not significant. There were significant differences in metabolic activity by control and growth factors-treated THLE-3 cells ((Aa), p < 0.001; (Ba), p < 0.001), HepG2 cells ((Bb), p < 0.001), C3A cells ((Ac), p < 0.001; (Bc), p < 0.001), and SNU-449 cells ((Ad), p < 0.001). Differences with a p-value ≤ 0.05 were defined as statistically significant compared to the control group: one asterisk (*), p-value ≤ 0.05; two asterisks (**), p-value ≤ 0.01; three asterisks (***), p-value ≤ 0.001. Abbreviations: TGF, transforming growth factor; TNF, tumor necrosis factor; EGF, epidermal growth factor; MIX, cocktail of growth factors; XTT, 2,3-Bis-(2-Methoxy-4-Nitro-5-Sulfophenyl)-2H-Tetrazolium-5-Carboxanilide. |
Cytotoxicity of Growth Factors After Culturing for 48 Hours
After incubation for 48 h, there was an increase in the metabolic activity of THLE-3 and HepG2 cells under the influence of EGF (Figure 4Ba and Bb). The addition of TGF-β1 and the growth factor cocktail at both concentrations and the addition of TNF at 20 ng/mL decreased the viability of C3A cells (Figure 4Bc). The growth factors did not affect the metabolic activity of SNU-449 cells (Figure 4Bd). Due to the increase in metabolic activity of two cell lines (THLE-3 and HepG2) after culturing for 48 h with the addition of 20 ng/mL growth factors, an incubation time of 48 h was used for the subsequent experiments.
Effect of Growth Factors on Cell Proliferation
Cell proliferation after the addition of growth factors was examined with the BrdU assay (Figure 5Aa–Ad). Growth factors did not affect the proliferation of THLE-3 cells. The growth factors, especially the cocktail, reduced the proliferation of HepG2 and SNU-449 cells. Only the growth factor cocktail reduced C3A cell proliferation.
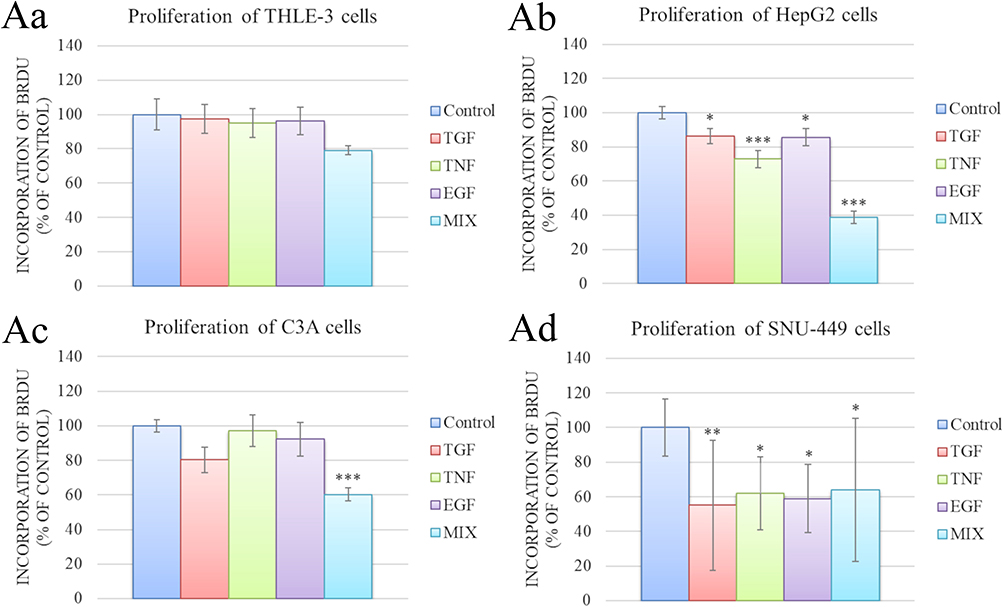 |
Figure 5 Proliferation of THLE cells (Aa), HepG2 cells (Ab), C3A cells (Ac) and SNU-449 cells (Ad) after incubation for 48 h in medium supplemented with 20 ng/mL growth factors (measured by the BrdU assay). There were significant differences in incorporation of BrdU by control and growth factors-treated HepG2 cells (p < 0.001), C3A cells (p < 0.001), and SNU-449 cells (p = 0.004). Differences with a p-value ≤ 0.05 were defined as statistically significant compared to the control group: one asterisk (*), p-value ≤ 0.05; two asterisks (**), p-value ≤ 0.01; three asterisks (***), p-value ≤ 0.001. Abbreviations: BrdU, bromodeoxyuridine; TGF, transforming growth factor; TNF, tumor necrosis factor; EGF, epidermal growth factor; MIX, cocktail of growth factors. |
Evaluation of Cell Morphology After the Addition of Growth Factors
To select the optimal growth factor to initiate EMT, cell morphology was examined (Figure 6). After the addition of TNF, EGF, and a growth factor cocktail, normal THLE-3 cells had shrunken cell bodies and long cytoplasmic protrusions. TGF-β1 did not change the morphology of THLE-3 cells.
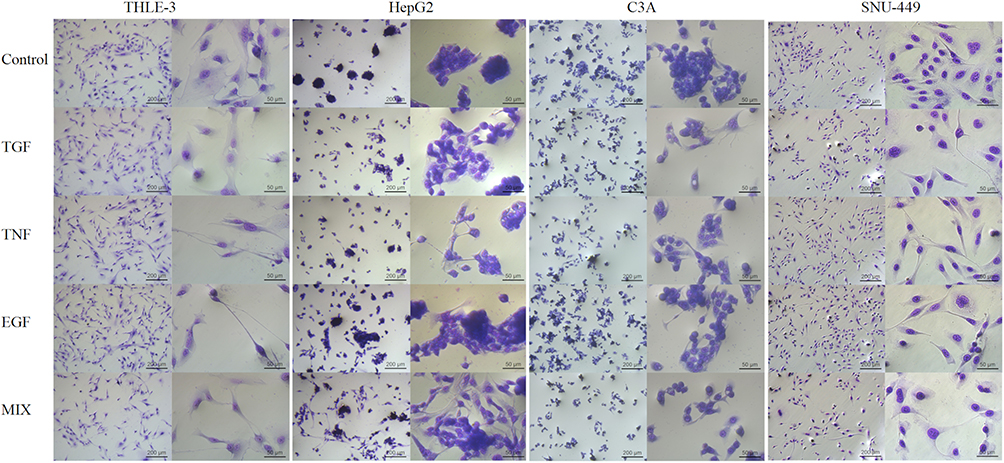 |
Figure 6 THLE-3, HepG2, C3A and SNU-449 cell morphology after incubation for 48 h in normal culture (control) and culture with the addition transforming growth factor, tumor necrosis factor, epidermal growth factor, and a growth factor cocktail (using May Grunwald-Giemsa stain). The scale bar is 200 µm on the left side and 50 µm on the right side. Abbreviations: TGF, transforming growth factor; TNF, tumor necrosis factor; EGF, epidermal growth factor; MIX, cocktail of growth factors. |
HepG2 cells showed a classic tendency to form large, tight, multilayer cell clusters, but after stimulation with the growth factor cocktail for 48 h, the cells showed a fibroblast-like spindle morphology and reduced intercellular adhesion. There was similar but not as strong effect for TGF-β1 and TNF. EGF was the only growth factor that did not significantly alter the HepG2 phenotype; however, it did increase the number of cells.
The characteristic cobblestone epithelial morphology of C3A cells was lost when TGF-β1, TNF, and the growth factor cocktail were added to the culture medium. The growth factor cocktail fragmented the cell clusters to the greatest extent, making it possible to observe single cells.
SNU-449 cells also form cell clusters in high confluence. Administration of TGF-β1, TNF, EGF, and the growth factor cocktail significantly extended the structure of the cytoskeleton. In addition, cells in all study groups were separated from each other and had long, thin cytoplasmic protrusions.
Influence of Growth Factors on Gene Expression in Cells
To select a growth factor that upregulates mesenchymal markers and downregulates epithelial markers, real-time PCR was used to examine mRNA expression (Figure 7). In THLE-3 cells, SNAI1 expression increased in all groups (Figure 7Aa). CDH1 and MMP2 expression increased after the addition TGF-β1 and TNF. CDH2 expression was also increased by TGF-β1 as well as the growth factor cocktail. The addition of TNF and the growth factor cocktail increased MMP9 expression.
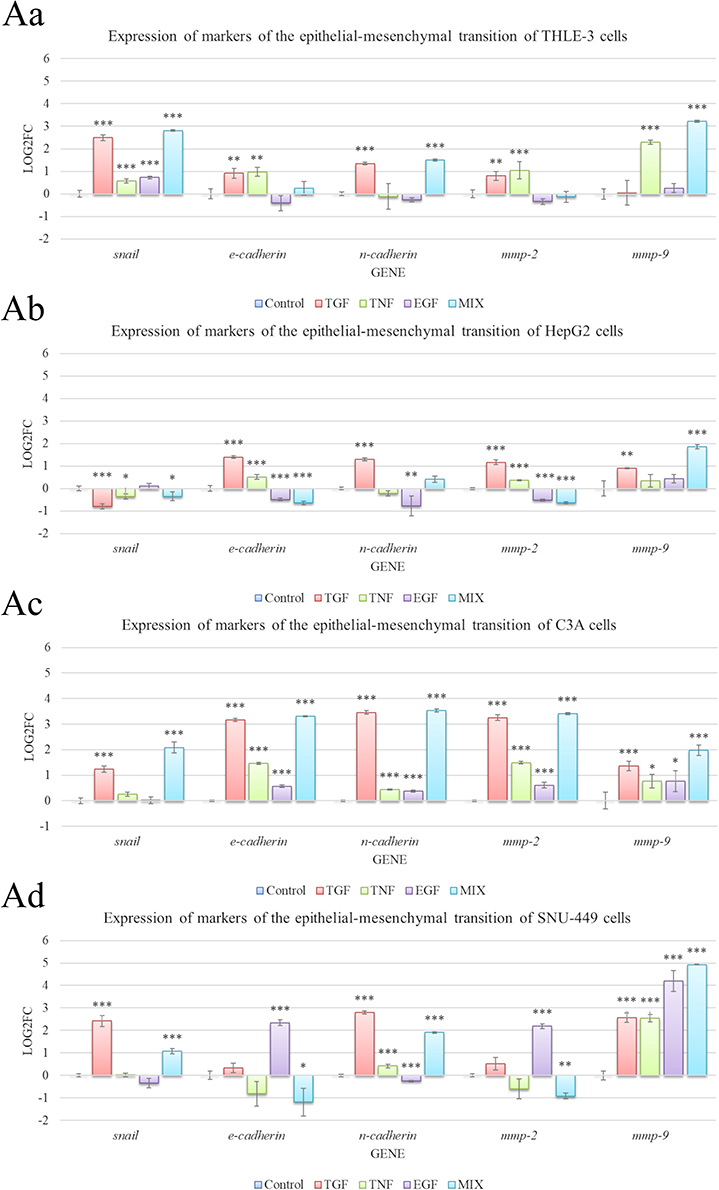 |
Figure 7 Messenger RNA (mRNA) expression of SNAI1, CDH1, CDH2, MMP2, and MMP9 in THLE-3 (Aa), HepG2 (Ab), C3A (Ac), and SNU-449 cells (Ad) after incubation for 48 h in medium supplemented with 20 ng/mL of transforming growth factor, tumor necrosis factor, epidermal growth factor, and a growth factor cocktail. mRNA levels were determine with real-time polymerase chain reaction. The bars represent the means with standard deviations (n = 4). Relative expression was calculated using the reference gene (GAPDH) and the non-treated group (value = 0). The expression is presented as log2(fold change). Values above 0 indicate an increase in gene expression. Values below 0 indicate a decrease in gene expression. There were significant differences in expression of all genes by control and growth factors-treated THLE-3 cells (p < 0.0001), HepG2 cells (p < 0.0001), C3A cells (p < 0.0001), and SNU-449 cells (p < 0.0001). Differences with a p-value ≤ 0.05 were defined as statistically significant compared to the control group: one asterisk (*), p-value ≤ 0.05; two asterisks (**), p-value ≤ 0.01; three asterisks (***), p-value ≤ 0.001. Abbreviations: TGF, transforming growth factor; TNF, tumor necrosis factor; EGF, epidermal growth factor; MIX, cocktail of growth factors; Mmp, matrix metalloproteinase. |
In HepG2 cells, TGF-β1, TNF, and the growth factor cocktail downregulated SNAI1 (Figure 7Ab). TGF and TNF upregulated CDH1 and MMP2, but EGF and the growth factor cocktail downregulated these genes. TGF-β1 increased CDH2, while TNF and EGF decreased this gene. TGF-β1 and the growth factor cocktail increased MMP9 expression.
There was a stronger growth factor effect on gene expression in C3A cells compared with HepG2 cells (Figure 7Ac). TGF-β1 and the growth factor cocktail increased SNAI1. C3A cells overexpressed CDH1, CDH2, MMP2, and MMP9 independently of the treatment group. However, TGF-β1 and the growth factor cocktail increased the expression of these genes the most.
In SNU-449 cells, TGF-β1 and the growth factor cocktail increased SNAI1 expression (Figure 7Ad). EGF and the growth factor cocktail decreased CDH1 and MMP2 expression. TGF-β1, TNF, and the growth factor cocktail increased CDH2, but EGF reduced CDH2. MMP9 was increased in all groups, with the greatest increase from the growth factor cocktail.
In conclusion, experiments to induce EMT and obtain a model population of cells with a mesenchymal phenotype and high metastatic activity revealed that a growth factor cocktail is the most advantageous solution. Indeed, the results proved the synergistic nature of multiple growth factors. Based on the analysis of morphology and EMT markers, the growth factor cocktail was used for the next experiments.
Effect of Fullerenol Nanofilm on Restoration of the Epithelial Phenotype of Liver Cancer Cells
To determine the effect of C60(OH)40 nanofilm on restoration of the epithelial phenotype of liver cancer cells, the TGF/TGFR/Smad signaling pathway was investigated (Figure 8Aa–Ac, Table S1). After cultivation on C60(OH)40 nanofilm, HepG2 and C3A cells had reduced SNAI1, SMAD2, SMAD3, and TGFR2 expression and increased CDH1, VIM, and SMAD4 expression. The only difference between the cell lines was an increase in CDH2 expression in C3A cells and an insignificant tendency for this marker to increase in HepG2 cells. There were different results for SNU-449 cells. C60(OH)40 nanofilm upregulated the expression of SNAI1 and CDH1 and downregulated the expression of VIM, SMAD3, and SMAD4. Interestingly, there were no differences in the expression of TGFR1, TGFR2, SMAD2, and CDH2.
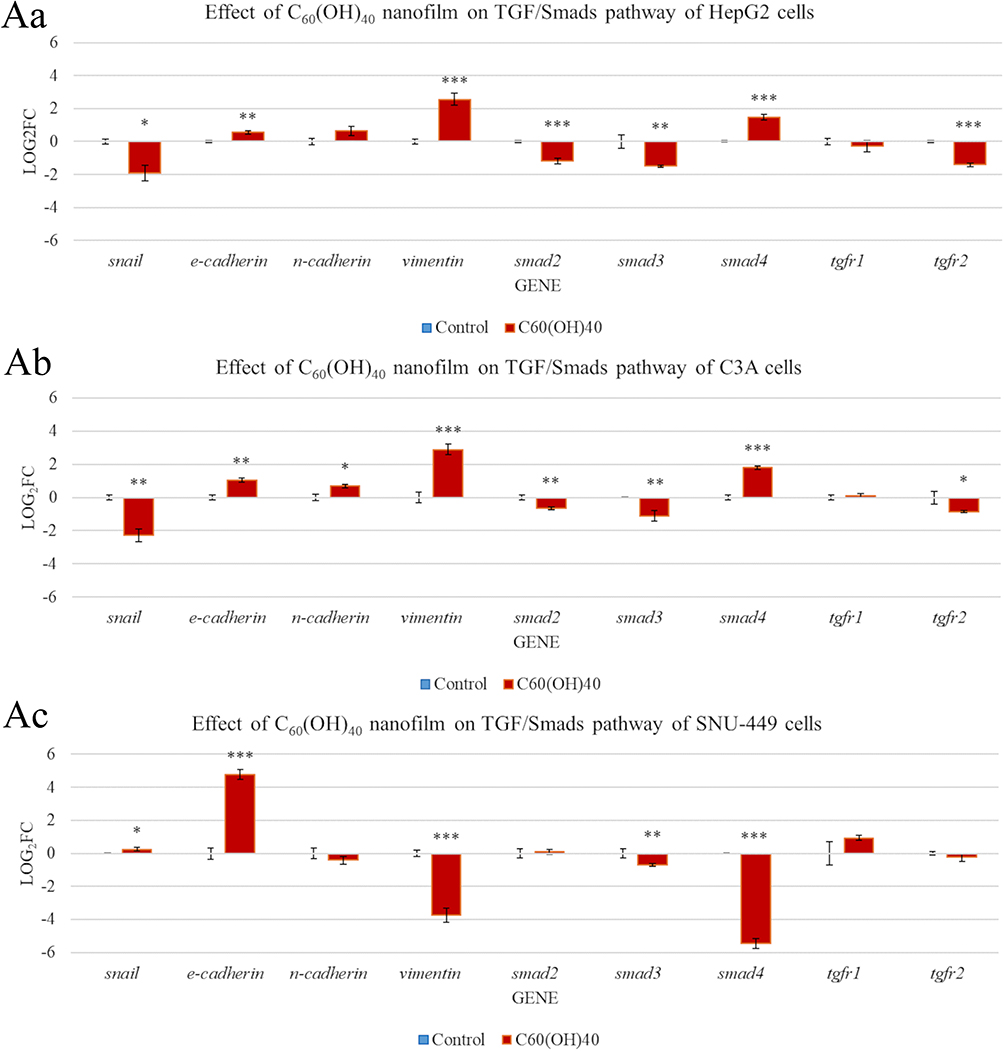 |
Figure 8 Messenger RNA (mRNA) expression of genes involved in mesenchymal-epithelial transformation of HepG2 (Aa), C3A (Ab), and SNU-449 (Ac) model cells after culturing for 24 h on C60(OH)40 nanofilm. mRNA levels were determined with real-time polymerase chain reaction. The bars represent the means with standard deviations (n = 4). Relative expression was calculated using the reference gene (GAPDH) and the non-treated group (value = 0). The expression is presented as log2(fold change). Values above 0 indicate an increase in gene expression. Values below 0 indicate a decrease in gene expression. Differences with a p-value ≤ 0.05 were defined as statistically significant compared to the control group: one asterisk (*), p-value ≤ 0.05; two asterisks (**), p-value ≤ 0.01; three asterisks (***), p-value ≤ 0.001. Abbreviations: TGF, transforming growth factor; TGFR, transforming growth factor receptor; C60(OH)40, fullerenol. |
Discussion
This study included four steps: The first step concerned the physical and chemical characteristics of surfaces formed from aqueous solutions of nanoparticles by covering the bottom of the culture plate and allowing the colloids to evaporate. The second step was dedicated to determining the biological impact of the tested surfaces, especially the most effective surface, fullerenol, on cells. The third step concerned refining a method of transforming cells with an epithelial phenotype in order to obtain mesenchymal cells (EMT) with a high potential for metastasis and invasiveness. Finally, the fourth step was employed to document the effect of fullerenol nanofilm to induce MET of the cells transformed in the third batch of experiments, producing cells with a resting, epithelial, and non-metastatic phenotype.
In in vitro studies, the surface at the bottom of cell culture plate wells creates an external environment for the cell by imitating the ECM. Therefore, both surface chemistry and surface structure are key factors that determine the behavior and status of the cell, similarly to the ECM in natural conditions. The tested carbon materials, despite being the same element, differ in terms of atomic structure, which determines the chemical and physical properties of these nanomaterials. The uniqueness of the surface created by fullerenol results from of a variety of domains rich in sp, sp2, and sp3 hybridization. Moreover, the surface of fullerenol nanofilm had much lower roughness than other materials. Fullerenol was also very hydrophilic, similarly to GO, due to the presence of oxygen groups. Oxygen groups attached to both rings and carbon chains of fullerenol are involved in intermolecular hydrogen bonds, which create a tightly packed structure observed as a uniform coating of the plate surface with reduced roughness.29 The lack of hydrogen interactions between the pristine fullerene particles means that the particles are spaced apart. Despite the smaller size of fullerene relative to fullerenol,29 the greater particle spacing may be the reason for differences in roughness between the two similar materials. Dmitrenko et al30 reported similar observations: The combination of polyphenylene isophthalamide with fullerene resulted in a significantly higher average surface roughness (5.76 nm) than when combined with fullerenol (2.57 nm). Better dispersion of fullerenol in polyphenylene isophthalamide and strong interaction with the polymer, in the present study with polystyrene, reduces surface roughness compared with fullerene without functional groups. Fullerenols are ultra-fine molecules (<1 nm) that are smaller than conventional abrasive substances, such as nanosilica, and are classified as colloidal nanoabrasive substances.31 Takaya et al showed that the polishing properties of fullerenes increase as the number of oxygen groups increases.31 Thus, it could be assumed that fullerenol nanofilm most mimics the ECM: it favors cell homing and is conducive to the acquisition of a resting, epithelial phenotype and the suppression of the inflammatory processes. This assumption was verified in another experiment.
This study evaluated the direction of the biointeraction between the carbon nanofilm surface and the examined cancer cell lines. To determine whether carbon nanofilms have anti-inflammatory properties and can promote the epithelial phenotype of cells by inhibiting the secretion of growth factors, the main factor causing EMT, namely TGF-β1, was examined.32 C60(OH)40 nanofilm, similarly to the metallofullerenol Gd@C82(OH)22 studied by other authors in breast cancer,17 inhibited the secretion of TGF-β1 in hepatoma. The observed weak effect of pristine C60 on the inhibition of TGF-β1 secretion can be explained by the significant antioxidant capacity of C60(OH)40, compared with C60, because reactive oxygen species stimulate TGF-β1 secretion.17 These differences are probably related to the ring structure of pristine C60 (sp2 hybridization) in which there are no water and alcohol-like groups,26 which are present in fullerenol (sp, sp2, and sp3 hybridization).
Mechano- and chemotransduction derived from the surface nanostructure change the signaling and secretion of TGF via TGF-βR.33 Our group showed that the greater roughness of a plate coated with pristine C60,26 GO,27 and ND28 compared with ordinary polystyrene plate increases TGF secretion by HepG2 and C3A cells. Zhu et al observed activation of TGF-βR/Smad2/3 signaling in liver HepG2, prostate PC3, and lung A549 tumor cells after treatment with 10 μg/mL GO. They reported that mechanical stimulation with GO enhanced lung metastasis of cancer cells in various models.33 According to Shirley et al,34 LNCaP prostate cancer cells and MDA-MB-231 and MCF-7 breast cancer cells cultured on decellularized 3D tissues with the addition of ND inhibited migration to deeper tissue layers and stimulated MET.34 In the present study, ND nanofilm inhibited TGF-β1 secretion in SNU-449 cells and stimulated it in HepG2 cells. These results clearly showed that C60(OH)40 nanofilm reduced TGF secretion to the greatest extent in all cell lines (as previously reported by Kovel et al)20; hence, C60(OH)40 was used in subsequent experiments.
Next, the anti-inflammatory nature of fullerenol was evaluated. EMT is associated with TGF secretion and the production of other growth factors. For this reason, the effect of C60(OH)40 nanofilm on growth factors secreted by cells was investigated. C60(OH)40 nanofilm inhibited the secretion of most known inducers of EMT, including EGF, FGF,15 NGF,35 and VEGF36 in HepG2 and C3A cells. However, C60(OH)40 nanofilm increased HGF in the culture medium of HepG2, C3A, and SNU-449 cells. Among all tested growth factors, C60(OH)40 nanofilm induced the largest quantitative change in the IGF system, which is involved in hepatocyte proliferation as a key mediator of growth hormone and participates in glucose uptake, normal insulin sensitivity, and glycogen storage.37 The IGF system consists of insulin-like growth factors (IGF-I and IGF-II), their receptors, and IGFBP.38 In normal tissue, receptor-binding proteins inhibit the binding of IGF-I and IGF-II to the receptor and thus inhibit proliferation-promoting signaling pathways such as RAF/MEK/ERK and PI3K/AKT/mTOR. C60(OH)40 nanofilm only decreased all IGF system elements in HepG2 cells. This reduced IGF-I and IGF-II expression in HepG2 cells correlates with decreased proliferation and neovascularization in HCC tissues according to El Tayebi et al.39 However, in all cell lines, C60(OH)40 nanofilm caused a simultaneous downregulation of IGFBP. A decrease in IGFBP in THLE-3, C3A, and SNU-449 cells would be associated with increased access of IGF-II to its receptor, an increase in its activity, and the activation of multiple oncogenic pathways.40 Burnett et al reported that IGF1 and IGFBP3 knockout increases GO cytotoxicity in U2OS osteosarcoma cells.40 IGFB elimination was not a consequence of C60(OH)40 cytotoxicity because C60(OH)40 nanofilm applied at 100 mg/L was nontoxic to THLE, HepG2, and C3A cells, and caused only a slight reduction in the viability of SNU-449 cells. As very fine nanoparticles, fullerenols easily penetrate cell membranes and localize in the cytoplasm or cell nucleus, which promotes higher cytotoxicity.19 C60(OH)40 nanofilm used in this research strongly adhered to the polystyrene plate, and the nanolayer created from nanoparticles acted from the outside of the cell (as a mimic of the ECM). The effect of C60(OH)40 nanofilm was different in SNU-449 cells compared with other liver cancer cell lines, which could be due to the inherent invasiveness of SNU-449 cells (grade II–III, diffusely spreading cells) and the presence of hepatitis B virus.41 In addition, HepG2 and C3A cells are more differentiated, noninvasive, and have the ability to secrete alpha-fetoproteins, in contrast to SNU-449 cells.42
The greatest threat to the body is cancer cells that have acquired the ability to metastasize and thus have a mesenchymal phenotype. EMT promotes the proliferation, invasion, and metastasis of liver cancer cells.43 For this reason, the third step of the research was to develop a strategy to create a model of HepG2, C3A, and SNU-443 mesenchymal cells with high invasiveness, capable of metastasis in vitro. The aim of this part of the research was to document that modification of the surface (an ECM mimic) can affect sedentary cells with an epithelial phenotype as well as cancer cells that are active and ready to metastasize, and that the ECM can influence MET, restoring cells to their milder epithelial phenotype.
Considering the effects of individual EMT inducers, TGF is considered the most potent due to its ability to regulate Smad proteins and, consequently, proliferation, differentiation, and migration of cells.32 Similarly to Liu et al32 and Zhang et al,44 in the present study TGF suppressed the proliferative capacity and reduced the viability of HCC cells without affecting normal THLE-3 cells. This study is the first to show that this factor has activity against cancerous rather than normal liver cells. The key mediator of apoptosis, proliferation, and hepatocarcinogenesis is TNF-α. Depending on the concentration, TNF-α can contribute to chronic inflammation as well as inhibit angiogenesis.45 Xu et al proved that TNF-α at a concentration of just 5 ng/mL promotes the proliferation and invasion of HepG2 cells; the higher doses used in the present study inhibited both metabolic activity and proliferation of liver cancer cells.46 The next growth factor used was EGF. Overexpression of EGF and its receptor causes fibrogenesis, accelerates the entry of hepatitis C virus into cells, and is a factor correlating with HCC.47,48 In this study, treatment with EGF for 48 h enhanced HepG2 cell viability, a phenomenon also observed by Zhang et al.49 This increased viability occurs via upregulation of ERK1/2 AKT phosphorylation. EGF is considered a factor that stimulates hepatocyte proliferation47 as well as inhibits the proliferation of HepG2 and SNU-449 cells as shown in our studies. The incorporation of thymidine into the DNA of HepG2 cells is dependent on the concentration of EGF as discovered by Wang et al.50 EGF used at concentrations higher than 5 ng/mL reduces the proliferation of HepG2 cells,50 which is consistent with the present results. It can be assumed that the reduction in proliferation may be due to the desire of tumor cells to overcome anoikis after detachment from the ECM. Researchers have reported that overexpression of the EGF receptor blocks anoikis. For epithelial cell survival and proliferation, signaling from integrins is required for strong cell–ECM adhesion, which is weakened by EMT induction.51
In this study, incubating HCC cells with a growth factor cocktail of TGF-β1, TNF, and EGF at a total concentration of 20 ng/mL (1:1:1) in low-serum culture medium (2% v/v) for 48 h was the most effective for obtaining invasive phenotype of cell. The serum concentration was reduced to increase the effect of cell spreading, as serum is a source of adhesive particles. Essid et al used this same approach, claiming that the presence of serum strongly suppresses EMT under hypoxic conditions.15 Cytokines in the HCC microenvironment interact with each other to enhance the EMT effect caused by the use of single growth factors.32 Thus, for the first time in EMT stimulation experiments, this study employed a cocktail of three growth factors, namely TGF-β1, TNF-α, and EGF. Liu et al had previously proved that EGF and TNF-α together promote the invasion of HepG2 and SMMC-7721 HCC cells through synergistic induction of fibronectin.32 Similarly, the combination of TNF-α with TGF-β1 caused morphological changes toward the mesenchymal phenotype of alveolar epithelial cells A549.52 In addition, hypoxia in combination with the addition of EGF and FGF induced phenotypic transformation of CAL33 cancerous tongue cells.15 There are also reports of an indirect effect of TNF on EMT by increasing HGF.53 It seems that the growth factor cocktail used in the present study promotes EMT toward the metastatic phenotype, allowing for the most beneficial modification of cancer cells for further research on the effect of the surface on the return of cells to the epithelial phenotype.
The artificially created inflammatory environment of liver cancer after the addition of the growth factor cocktail caused a marked change in cell morphology, in particular HepG2 and SNU-449 cells. After adding the growth factor cocktail, HCC cells lost their natural morphology of growing in clusters and strong intercellular connections. After EMT, the cells resembled the morphology of fibroblasts or U87 glioblastoma cells, a finding consistent with other reports.17 Although the cancer cells had mesenchymal morphology also after application of TGF-β1, TNF, or EGF alone, the effect was weaker. Thus, the cytokines show synergy. The change in morphology resulted from disrupting the main membrane proteins involved in ECM adhesion, migration, and reorganization, that is, E-cadherin and N-cadherin. Metastatic cells show increased expression of proteins such as N-cadherin, vimentin, and claudin, and decreased expression of E-cadherin.54 In the present study, the growth factor cocktail upregulated CDH2 expression in C3A and SNU-449 cells and downregulated CDH1 expression in HepG2 and SNU-449 cells. This means that the growth factors reduced the share of tight intercellular connections in favor of flexible connections. In addition, there was increased expression of SNAI1, which encodes a transcription factor that silences the expression of E-cadherin by binding its promoter.12 The addition of TGF-β1, both alone and in a cocktail, enhances SNAI1 expression,55 a finding in THLE-3, C3A, and SNU-449 cells. The growth factor cocktail enhanced MMP9 (encodes gelatinase) more strongly than the addition of single growth factor in all cell lines. It is the overexpression of MMP-9 in HCC that leads to lymph node infiltration and, consequently, a higher tumor grade (based on the TNM staging system). The expression of MMP2 (collagenase), whose main function is basement membrane breakdown,56 was also increased in C3A cells after treatment with growth factors. The results in this study unequivocally confirmed that the growth factor cocktail promotes EMT toward increased cell invasiveness, taking into account a wide range of mechanisms related to the dysregulation of cell–cell junctions and obtaining the mesenchymal phenotype and acquisition of the ability to degrade ECM via metalloproteinases and perform chemotaxis.
In the final part of this study, C60(OH)40 nanofilm was evaluated for its ability to induce MET in cancer cells so that they could regain the epithelial phenotype. These experiments used the cells that had been treated with the growth factor cocktail and had undergone EMT in the previous stage of this study. Oncogenic pathways such as PI3K/Akt, Akt-mTOR, NF-κB, Wnt/β-catenin, Ras/MAPK, Notch, and TGF-β1/Smad are involved in distant metastasis of cancer cells.57 Given that the TGF-β1/Smad pathway was activated by the growth factor cocktail, the expression of genes involved in this pathway was evaluated. C60(OH)40 nanofilm in the inflammatory environment of liver cancer inhibited the TGF-β1/Smad pathway and thus promoted MET in HCC cells in vitro. Specifically, C60(OH)40 nanofilm reduced the expression of the TGF-βRII receptor in HepG2 and C3A cells; the main role of this receptor is the binding and activation of TGF-β1.10 Lost signaling from the plasma membrane is associated with decreased phosphorylation of Smad2 and Smad3.11 The Smad protein heterocomplex enters the cell nucleus and binds to and downregulates Snail (a transcription factor).12,13 Snail is a repressor of E-cadherin transcription; therefore, the SNAI1 reduction is associated with an increase in the expression of the main marker of the epithelial phenotype of cells, that is, E-cadherin.58 The effect of fullerenol was cell line dependent and differed between HepG2, C3A, and SNU-449 cells. In SNU-449 cells, fullerenol did not alter the expression of TGF receptors but decreased SMAD3 and SMAD4 expression. These small differences in the TGF-β1-Smad signaling pathway resulted in a stronger MET effect in SNU-449 cells, denoted by promoting the expression of epithelial markers (E-cadherin) and inhibiting mesenchymal markers (vimentin) at the mRNA level. C60(OH)40 nanofilm changed the structure of the intermediate filaments of the cytoskeleton, altered cell polarization (vimentin), and increased the strength of intercellular connections (E-cadherin). According to Helal et al, vimentin was the most important marker of EMT in post-resection samples of 109 patients with HCC.59 High vimentin levels are a marker of tumor size, vascular invasion, and recurrence.
Conclusion
The concept of the research assumed the use of mimic ECM, which would reduce the activity of HepG2, C3A, SNU-449 liver cancer cells, while not inducing toxicity to non-cancer THLE-3 cells. In the first step, physicochemical characterization of ND, GO, C60, and fullerenol C60(OH)40 and their nanofilms, as well as analysis of the effect of these nanofilms on the examined cells, showed that the highly hydrophilic and relatively smooth C60(OH)40 nanofilm was the most advantageous candidate to mimic the ECM. Thus, in the second stage, C60(OH)40 nanofilm was used as a biocompatible and homing-friendly surface imitating the normal ECM. This surface reduced the oncogenic potential of the HCC, denoted by changes in TGF, FGF, NGF, EGF, IGF, and VEGF secretion. In the third phase, striving to determine the full response regarding the influence of C60(OH)40 nanofilm on the characteristics of cancer cells, such as their phenotype, proliferation, and metastatic capacity, EMT was induced in HepG2, C3A, and SNU-449 cells, obtaining highly invasive cells with a mesenchymal phenotype. An innovative growth factor cocktail (TGF-β1, TNF, and EGF) induced MET in the invasive cells. Finally, C60(OH)40 nanofilm inhibited the TGF-β1/Smad pathway to return the HepG2, C3A, and SNU-44 cells to an epithelial phenotype. In the future, application of aqueous colloid C60(OH)40 may allow producing nanofilms at tumor resection sites that could prevent distant migration of unremoved tumor cells.
Acknowledgments
This report is a part of Malwina Sosnowska’s habilitation thesis.
Funding
This research was carried out in the framework of National Science Centre Poland project number 2019/33/N/NZ7/01392.
Disclosure
The authors report no conflicts of interest in this work.
References
1. Tang Z, He J, Zou J, Yu S, Sun X, Qin L. Cisplatin-resistant HepG2 cell-derived exosomes transfer cisplatin resistance to cisplatin-sensitive cells in HCC. PeerJ. 2021;9:e11200. doi:10.7717/peerj.11200
2. Kuznietsova H, Dziubenko N, Herheliuk T, et al. Water-soluble pristine C60 fullerene inhibits liver alterations associated with hepatocellular carcinoma in rat. Pharmaceutics. 2020;12(9):794. doi:10.3390/pharmaceutics12090794
3. Raza A, Sood GK. Hepatocellular carcinoma review: current treatment, and evidence-based medicine. World J Gastroenterol. 2014;20(15):4115–4127. doi:10.3748/wjg.v20.i15.4115
4. Tsubakihara Y, Moustakas A. Epithelial-mesenchymal transition and metastasis under the control of transforming growth factor. Int J Mol Sci. 2018;19(19):3672. doi:10.3390/ijms19113672
5. Choi SS, Diehl AM. Epithelial‐to‐mesenchymal transitions in the liver. Hepatology. 2009;50:2007–2013. doi:10.1002/hep.23196
6. Wendt M, Allington TM, Schiemann WP. Mechanisms of epithelial-mesenchymal transition by TGF-β. Future Oncol. 2009;5(8):1145–1168. doi:10.2217/fon.09.90
7. Cordani M, Strippoli R, Somoza Á. Nanomaterials as inhibitors of epithelial mesenchymal transition in cancer treatment. Cancers. 2019;12(1):25. doi:10.3390/cancers12010025
8. Parekh A, Weaver AM. Regulation of cancer invasiveness by the physical extracellular matrix environment. Cell Adhes Migr. 2009;3(3):288–292. doi:10.4161/cam.3.3.8888
9. Reiman JM, Knutson KL, Radisky DC. Immune promotion of epithelial-mesenchymal transition and generation of breast cancer stem cells. Cancer Res. 2010;70(8):3005–3008. doi:10.1158/0008-5472.CAN-09-4041
10. Harikrishnan LS, Warrier J, Tebben AJ, et al. Heterobicyclic inhibitors of transforming growth factor beta receptor I (TGFβRI). Bioorgan Med Chem. 2018;26(5):1026–1034. doi:10.1016/j.bmc.2018.01.014
11. Verrecchia F, Mauviel A. Transforming growth factor-β signaling through the Smad pathway: role in extracellular matrix gene expression and regulation. J Invest Dermatol. 2002;118(2):211–215. doi:10.1046/j.1523-1747.2002.01641.x
12. Luo Y, Ren Z, Du B, et al. Structure identification of ViceninII extracted from Dendrobium officinale and the reversal of TGF-β1-induced epithelial–mesenchymal transition in lung adenocarcinoma cells through TGF-β/Smad and PI3K/Akt/mTOR signaling pathways. Molecules. 2019;24:144. doi:10.3390/molecules24010144
13. Kume K, Haraguchi M, Hijioka H, et al. The transcription factor Snail enhanced the degradation of E-cadherin and desmoglein 2 in oral squamous cell carcinoma cells. Biochem Bioph Res Co. 2013;430(3):889–894. doi:10.1016/j.bbrc.2012.12.060
14. Abarrategi A, Gutiérrez MC, Moreno-Vicente C, et al. Multi-wall carbon nanotube scaffolds for tissue engineering purposes. Biomaterials. 2008;29:94–102. doi:10.1016/j.biomaterials.2007.09.021
15. Essid N, Chambard JC, Elgaaïed AB. Induction of epithelial-mesenchymal transition (EMT) and Gli1 expression in head and neck squamous cell carcinoma (HNSCC) spheroid cultures. Bosnian J Basic Med. 2018;18(4):336. doi:10.17305/bjbms.2018.3243
16. Joseph JP, Harishankar MK, Pillai AA, Devi A. Hypoxia induced EMT: a review on the mechanism of tumor progression and metastasis in OSCC. Oral Oncol. 2018;80:23–32. doi:10.1016/j.oraloncology.2018.03.004
17. Liu Y, Chen C, Qian P, et al. Gd-metallofullerenol nanomaterial as non-toxic breast cancer stem cell-specific inhibitor. Nat Commun. 2015;23:5988. doi:10.1038/ncomms6988
18. Sharoyko VV, Iamalova NR, Ageev SV, et al. In vitro and in silico investigation of water-soluble fullerenol C60(OH)24: bioactivity and biocompatibility. J Phys Chem B. 2021;125(32):9197–9212. doi:10.1021/acs.jpcb.1c03332
19. Bolshakova O, Borisenkova A, Suyasova M, et al. In vitro and in vivo study of the toxicity of fullerenols С60, С70 and С120О obtained by an original two step method. Mater Sci Eng C. 2019;104:109945. doi:10.1016/j.msec.2019.109945
20. Kovel ES, Kicheeva AG, Vnukova NG, Churilov GN, Stepin EA, Kudryasheva NS. Toxicity and antioxidant activity of fullerenol c60, 70 with low number of oxygen substituents. Int J Mol Sci. 2021;22(12):6382. doi:10.3390/ijms22126382
21. Shimizu K, Kubot R, Kobayashi N, et al. Cytotoxic effects of hydroxylated fullerenes in three types of liver cells. Materials. 2013;6(7):2713–2722. doi:10.3390/ma6072713
22. Jiao F, Liu Y, Qu Y, et al. Studies on anti-tumor and antimetastatic activities of fullerenol in a mouse breast cancer model. Carbon. 2010;48(8):2231–2243. doi:10.1016/j.carbon.2010.02.032
23. Prylutska SV, Grebinyk AG, Lynchak OV, Byelinska IV, Cherepanov VV. In vitro and in vivo toxicity of pristine C60 fullerene aqueous colloid solution. Fuller Nanotub Carbon Nanostructures. 2019;27(9):715–728. doi:10.1080/1536383X.2019.1634055
24. Chen C, Xing G, Wang J, et al. Multihydroxylated [Gd@C82(OH)22]n nanoparticles: antineoplastic activity of high efficiency and low toxicity. Nano Lett. 2005;5(10):2050–2057. doi:10.1021/nl051624b
25. Zhu X, Cirovic S, Shaheen A, Xu W. Investigation of fullerenol-induced changes in poroelasticity of human hepatocellular carcinoma by AFM-based creep tests. Biomech Model Mechan. 2018;17(3):665–674. doi:10.1007/s10237-017-0984-5
26. Sosnowska M, Kutwin M, Jaworski S, et al. Mechano-signalling, induced by fullerene C60 nanofilms, arrests the cell cycle in the G2/M phase and decreases proliferation of liver cancer cells. Int J Nanomed. 2019;14:6197. doi:10.2147/IJN.S206934
27. Sosnowska M, Kutwin M, Strojny B, et al. Graphene oxide nanofilm and chicken embryo extract decrease the invasiveness of HepG2 liver cancer cells. Cancer Nanotechnol. 2021;12(1):1–33. doi:10.1186/s12645-020-00073-5
28. Sosnowska M, Kutwin M, Strojny B, et al. Diamond nanofilm normalizes proliferation and metabolism in liver cancer cells. Nanotechnol Sci Appl. 2021;14:115. doi:10.2147/NSA.S322766
29. Roy P, Bag S, Chakraborty D, Dasgupta S. Exploring the inhibitory and antioxidant effects of fullerene and fullerenol on ribonuclease A. ACS Omega. 2018;3(9):12270–12283. doi:10.1021/acsomega.8b01584
30. Dmitrenko ME, Penkova AV, Kuzminova AI, et al. Development and investigation of novel polyphenylene isophthalamide pervaporation membranes modified with various fullerene derivatives. Sep Purif Technol. 2019;226:241–251. doi:10.1016/j.seppur.2019.05.092
31. Takaya Y, Tachika H, Hayashi T, Kokubo K, Suzuki K. Performance of water-soluble fullerenol as novel functional molecular abrasive grain for polishing nanosurfaces. CIRP Ann. 2009;58(1):495–498. doi:10.1016/j.cirp.2009.03.118
32. Liu L, Li N, Zhang Q, Zhou J, Lin L, He X. Inhibition of ERK1/2 signaling impairs the promoting effects of TGF-β1 on hepatocellular carcinoma cell invasion and epithelial–mesenchymal transition. Oncol Res. 2017;25(9):1607. doi:10.3727/096504017X14938093512742
33. Zhu J, Li B, Xu M, et al. Graphene oxide promotes cancer metastasis through associating with plasma membrane to promote TGF-β signaling-dependent epithelial–mesenchymal transition. ACS Nano. 2020;14(1):818–827. doi:10.1021/acsnano.9b07891
34. Shirley AJ, Schweeberg S, Waag T, et al. The influence of differently functionalized nanodiamonds on proliferation, apoptosis and EMT/MET phenomena in 2D and 3D tumor cell cultures. J Mater Chem B. 2021;9(45):9395–9405. doi:10.1039/D1TB01739J
35. Lin C, Ren Z, Yang XI, et al. Nerve growth factor (NGF)-TrkA axis in head and neck squamous cell carcinoma triggers EMT and confers resistance to the EGFR inhibitor erlotinib. Cancer Lett. 2020;472:81–96. doi:10.1016/j.canlet.2019.12.015
36. Bi Q, Tang S, Xia L, et al. Ectopic expression of MiR-125a inhibits the proliferation and metastasis of hepatocellular carcinoma by targeting MMP11 and VEGF. PLoS One. 2012;7(6):e40169. doi:10.1371/journal.pone.0040169
37. Adamek A, Kasprzak A. Insulin-like growth factor (IGF) system in liver diseases. Int J Mol Sci. 2018;19(5):1308. doi:10.3390/ijms19051308
38. Cevenini A, Orrù S, Mancini A, Alfieri A, Buono P, Imperlini E. Molecular signatures of the insulin-like growth factor 1-mediated epithelial-mesenchymal transition in breast, lung and gastric cancers. Int J Mol Sci. 2018;19(8):2411. doi:10.3390/ijms19082411
39. El Tayebi HM, Waly AA, Assal RA, Hosny KA, Esmat G, Abdelaziz AI. Transcriptional activation of the IGF-II/IGF-1R axis and inhibition of IGFBP-3 by miR-155 in hepatocellular carcinoma. Oncol Lett. 2015;10(5):3206–3212. doi:10.3892/ol.2015.3725
40. Burnett M, Abuetabh Y, Wronski A, et al. Graphene oxide nanoparticles induce apoptosis in wild-type and CRISPR/Cas9-IGF/IGFBP3 knocked-out osteosarcoma cells. J Cancer. 2020;11(17):5007. doi:10.7150/jca.46464
41. Leroy K, Silva Costa CJ, Pieters A, et al. Expression and functionality of connexin-based channels in human liver cancer cell lines. Int J Mol Sci. 2021;22(22):12187. doi:10.3390/ijms222212187
42. Jung CW, Song TJ, Lee KO, et al. Characterization of hepatocellular carcinoma cell lines based on cell adhesion molecules. Int J Mol Med. 2012;29(6):1158–1164. doi:10.3892/ijmm.2012.951
43. Lee TK, Poon RT, Yuen AP, et al. Twist overexpression correlates with hepatocellular carcinoma metastasis through induction of epithelial-mesenchymal transition. Clin Cancer Res. 2006;12(18):5369–5376. doi:10.1158/1078-0432.CCR-05-2722
44. Zhang X, Fan Q, Li Y, et al. Transforming growth factor-beta1 suppresses hepatocellular carcinoma proliferation via activation of Hippo signaling. Oncotarget. 2017;8(18):29785. doi:10.18632/oncotarget.14523
45. Jang MK, Su Kim H, Chung YH. Clinical aspects of tumor necrosis factor-α signaling in hepatocellular carcinoma. Curr Pharm Design. 2014;20(17):2799–2808. doi:10.2174/13816128113199990587
46. Xu ZW, Yan SX, Wu HX, et al. The influence of TNF-α and Ang II on the proliferation, migration and invasion of HepG2 cells by regulating the expression of GRK2. Cancer Chemoth Pharm. 2017;79(4):747–758. doi:10.1007/s00280-017-3267-z
47. Fuchs BC, Hoshida Y, Fujii T, et al. Epidermal growth factor receptor inhibition attenuates liver fibrosis and development of hepatocellular carcinoma. Hepatology. 2014;59(4):1577–1590. doi:10.1002/hep.26898
48. Liu Z, Chen D, Ning F, Du J, Wang H. EGF is highly expressed in hepatocellular carcinoma (HCC) and promotes motility of HCC cells via fibronectin. J Cell Biochem. 2018;119(5):4170–4183. doi:10.1002/jcb.26625
49. Zhang L, Lin W, Chen X, Wei G, Zhu H, Xing S. Tanshinone IIA reverses EGF-and TGF-β1-mediated epithelial-mesenchymal transition in HepG2 cells via the PI3K/Akt/ERK signaling pathway. Oncol Lett. 2019;18(6):6554–6562. doi:10.3892/ol.2019.11032
50. Wang D, Yang E, Cheng LY. Effects of IFN-gamma, TNF-alpha and EGF on the expression of HLA class I antigen and the proliferation of human hepatocellular carcinoma HepG2 cells. Anticancer Res. 1997;17(1A):181–188.
51. Kim YN, Koo KH, Sung JY, Yun UJ, Kim H. Anoikis resistance: an essential prerequisite for tumor metastasis. Int J Cell Biol. 2012;2012:1–11. doi:10.1155/2012/306879
52. Yamauchi Y, Kohyama T, Takizawa H, et al. Tumor necrosis factor-α enhances both epithelial-mesenchymal transition and cell contraction induced in A549 human alveolar epithelial cells by transforming growth factor-β1. Exp Lung Res. 2010;36(1):12–24. doi:10.3109/01902140903042589
53. Zhang X. Activated monocyte-derived TNF-α upregulates HGF/c-Met to trigger EMT of hepatoma cells. In
54. Liao Y, Wang W, Huang X, Sun Y, Tian S, Cai P. Reduced graphene oxide triggered epithelial-mesenchymal transition in A549 cells. Sci Rep. 2018;8:15188. doi:10.1038/s41598-018-33414-x
55. Hu CT, Wu JR, Chang TY, Cheng CC, Wu WS. The transcriptional factor Snail simultaneously triggers cell cycle arrest and migration of human hepatoma HepG2. J Biomed Sci. 2008;15(3):343–355. doi:10.1007/s11373-007-9230-y
56. Scheau C, Badarau IA, Costache R, et al. The role of matrix metalloproteinases in the epithelial-mesenchymal transition of hepatocellular carcinoma. Anal Cell Pathol. 2019;2019:1–10. doi:10.1155/2019/9423907
57. Du H, Gu J, Peng Q, et al. Berberine suppresses EMT in liver and gastric carcinoma cells through combination with TGFβR regulating TGF-β/Smad pathway. Oxid Med Cell Longev. 2021;2021:1–21. doi:10.1155/2021/2337818
58. Cano A, Pérez-Moreno MA, Rodrigo I, et al. The transcription factor snail controls epithelial–mesenchymal transitions by repressing E-cadherin expression. Nat Cell Biol. 2000;2(2):76–83. doi:10.1038/35000025
59. Helal TES, Aref A, Gomaa AI, et al. Epithelial-mesenchymal transition markers in HCV-associated hepatocellular carcinoma: a multivariate follow up study. Asian Pac J Cancer Prev. 2022;23(3):839. doi:10.31557/APJCP.2022.23.3.839
 © 2023 The Author(s). This work is published and licensed by Dove Medical Press Limited. The
full terms of this license are available at https://www.dovepress.com/terms
and incorporate the Creative Commons Attribution
- Non Commercial (unported, 3.0) License.
By accessing the work you hereby accept the Terms. Non-commercial uses of the work are permitted
without any further permission from Dove Medical Press Limited, provided the work is properly
attributed. For permission for commercial use of this work, please see paragraphs 4.2 and 5 of our Terms.
© 2023 The Author(s). This work is published and licensed by Dove Medical Press Limited. The
full terms of this license are available at https://www.dovepress.com/terms
and incorporate the Creative Commons Attribution
- Non Commercial (unported, 3.0) License.
By accessing the work you hereby accept the Terms. Non-commercial uses of the work are permitted
without any further permission from Dove Medical Press Limited, provided the work is properly
attributed. For permission for commercial use of this work, please see paragraphs 4.2 and 5 of our Terms.
Recommended articles
Comprehensive Genomic Profiling Identifies FAT1 as a Negative Regulator of EMT, CTCs, and Metastasis of Hepatocellular Carcinoma
Huang ZL, Zhang PB, Zhang JT, Li F, Li TT, Huang XY
Journal of Hepatocellular Carcinoma 2023, 10:369-382
Published Date: 7 March 2023
Evaluation of the Clinical Efficacy of Intensity-Modulated Radiotherapy Combined with Transcatheter Arterial Chemoembolization for Hepatocellular Carcinoma with Extrahepatic Oligometastasis and Prognostic Factors for Patient Survival
Luo Y, Huang X, Chen J, Zhang S
International Journal of General Medicine 2023, 16:1271-1278
Published Date: 12 April 2023
LncRNA MEG3 Inhibits Tumor Progression by Modulating Macrophage Phenotypic Polarization via miR-145-5p/DAB2 Axis in Hepatocellular Carcinoma
Wei Q, Liu G, Huang Z, Huang Y, Huang L, Huang Z, Wu X, Wei H, Pu J
Journal of Hepatocellular Carcinoma 2023, 10:1019-1035
Published Date: 5 July 2023
Single-Cell RNA Sequencing Revealed That the Enrichment of TPI1+ Malignant Hepatocytes Was Linked to HCC Metastasis and Immunosuppressive Microenvironment
Liang Y, Zhong D, Yang Q, Tang Y, Qin Y, Su Y, Huang X, Shang J
Journal of Hepatocellular Carcinoma 2024, 11:373-383
Published Date: 22 February 2024