")
Back to Journals » International Journal of Chronic Obstructive Pulmonary Disease » Volume 19
Platelet-to-Lymphocyte Ratio (PLR), Neutrophil-to-Lymphocyte Ratio (NLR), Monocyte-to-Lymphocyte Ratio (MLR), and Eosinophil-to-Lymphocyte Ratio (ELR) as Biomarkers in Patients with Acute Exacerbation of Chronic Obstructive Pulmonary Disease (AECOPD)
Authors Liao QQ, Mo YJ, Zhu KW , Gao F, Huang B, Chen P, Jing FT, Jiang X, Xu HZ, Tang YF, Chu LW, Huang HL, Wang WL, Wei FN, Huang DD, Zhao BJ, Chen J, Zhang H
Received 31 October 2023
Accepted for publication 1 February 2024
Published 23 February 2024 Volume 2024:19 Pages 501—518
DOI https://doi.org/10.2147/COPD.S447519
Checked for plagiarism Yes
Review by Single anonymous peer review
Peer reviewer comments 2
Editor who approved publication: Dr Richard Russell
Qian-Qian Liao,1,* Yan-Ju Mo,2,* Ke-Wei Zhu,3,4,* Feng Gao,2 Bin Huang,2 Peng Chen,4 Feng-Tian Jing,5 Xuan Jiang,6 Hong-Zhen Xu,1 Yan-Feng Tang,7 Li-Wei Chu,8 Hai-Ling Huang,1 Wen-Li Wang,8 Fang-Ning Wei,9 Dan-Dan Huang,9 Bin-Jing Zhao,9 Jia Chen,9 Hao Zhang1
1Department of Pharmacy, People’s Hospital of Guilin, Guilin, People’s Republic of China; 2Department of Respiratory and Critical Care Medicine, People’s Hospital of Guilin, Guilin, People’s Republic of China; 3GuangZhou BaiYunShan Pharmaceutical Holdings CO.,LTD. BaiYunShan Pharmaceutical General Factory, Guangzhou, People’s Republic of China; 4Department of Clinical Pharmacology, Xiangya Hospital, Central South University, Changsha, People’s Republic of China; 5Department of Respiratory Medicine, Xing An County People’ Hospital, Guilin, People’s Republic of China; 6Department of Hospital Infection Management, People’s Hospital of Guilin, Guilin, People’s Republic of China; 7Department of Geriatrics, People’s Hospital of Guilin, Guilin, People’s Republic of China; 8Department of Laboratory Medicine, People’s Hospital of Guilin, Guilin, People’s Republic of China; 9School of Clinical Pharmacy, Guilin Medical University, Guilin, People’s Republic of China
*These authors contributed equally to this work
Correspondence: Ke-Wei Zhu, GuangZhou BaiYunShan Pharmaceutical Holdings CO.,LTD. BaiYunShan Pharmaceutical General Factory, No. 88 Yunxiang Road Tonghe Street, Baiyun District, Guangzhou, Guangdong Province, 510515, People’s Republic of China, Tel +86-020-87062636, Fax +86-020-87095309, Email [email protected]
Purpose: The study comprehensively evaluated the prognostic roles of the platelet-to-lymphocyte ratio (PLR), neutrophil-to-lymphocyte ratio (NLR), monocyte-to-lymphocyte ratio (MLR), basophil-to-lymphocyte ratio (BLR), and eosinophil-to-lymphocyte ratio (ELR) in patients with acute exacerbation of chronic obstructive pulmonary disease (AECOPD).
Patients and Methods: Six hundred and nineteen patients with AECOPD and 300 healthy volunteers were retrospectively included into the study. The clinical characteristics of the patients with AECOPD and the complete blood counts (CBCs) of the healthy volunteers were collected. The associations of PLR, NLR, MLR, BLR, and ELR with airflow limitation, hospital length of stay (LOS), C-reactive protein (CRP), and in-hospital mortality in patients with AECOPD were analyzed.
Results: Compared with the healthy volunteers, PLR, NLR, MLR, BLR, and ELR were all elevated in COPD patients under stable condition. PLR, NLR, MLR, and BLR were further elevated while ELR was lowered during exacerbation. In the patients with AECOPD, PLR, NLR, and MLR were positively correlated with hospital LOS as well as CRP. In contrast, ELR was negatively correlated with hospital LOS as well as CRP. Elevated PLR, NLR, and MLR were all associated with more severe airflow limitation in AECOPD. Elevated PLR, NLR, and MLR were all associated with increased in-hospital mortality while elevated ELR was associated with decreased in-hospital mortality. Binary logistic regression analysis showed that smoking history, FEV1% predicted, pneumonia, pulmonary heart disease (PHD), uric acid (UA), albumin, and MLR were significant independent predictors ofin-hospital mortality. These predictors along with ELR were used to construct a nomogram for predicting in-hospital mortality in AECOPD. The nomogram had a C-index of 0.850 (95% CI: 0.799– 0.901), and the calibration curve, decision curve analysis (DCA), and clinical impact curve (CIC) further demonstrated its good predictive value and clinical applicability.
Conclusion: In summary, PLR, NLR, MLR, and ELR served as useful biomarkers in patients with AECOPD.
Keywords: healthy volunteers, in-hospital mortality, length of stay, nomogram, pneumonia, pulmonary heart disease
Introduction
Chronic obstructive pulmonary disease (COPD) is a common chronic inflammatory disease worldwide, which is characterized by chronic airflow limitation accompanied by persistent respiratory symptoms such as dyspnea, cough, and sputum production.1 COPD poses a huge health and economic burden for an individual, as well as society due to its high prevalence of approximately 10% in adult populations and a rising incidence.2 COPD had a high mortality rate worldwide and was the fifth leading cause of death in the past, and the ranking will rise to third by 2030. Acute exacerbations contribute substantially to hospitalization and mortality in COPD patients, and 46% of the patients experienced exacerbations at least once in the previous year.3
Patients with acute exacerbation of chronic obstructive pulmonary disease (AECOPD) have poor prognosis with a high mortality rate in hospital. It has been reported that the in-hospital mortality was in the range of 4–14% according to population-based surveys performed in Asia-Pacific territories.3 Several clinical parameters were reported to be associated with in-hospital mortality in patients with AECOPD. For instance, cigarette smoking, as an extremely common risk factor for COPD, was associated with increased in-hospital mortality in patients with AECOPD;1,4 increased age and poor respiratory gas exchange served as risk factors for in-hospital mortality;3 raised C-reactive protein (CRP) levels were correlated with elevated risk for hospitalization and death in COPD as well as in-hospital mortality in AECOPD.5–7
Recently, increasing studies found that the platelet-to-lymphocyte ratio (PLR), neutrophil-to-lymphocyte ratio (NLR), and monocyte-to-lymphocyte ratio (MLR), as systemic inflammatory factors, played prognostic roles in various cancers, such as colorectal cancer,8 lung cancer,9 cervical cancer,10 breast cancer,11,12 gastric cancer,13 pancreatic cancer,14 gallbladder cancer,15 and hepatocellular carcinoma.16 In addition, PLR, NLR, and MLR were predictors of in-hospital mortality in patients with COVID-19.17 A previous study has demonstrated that both PLR and NLR were positively correlated with in-hospital mortality in AECOPD.7 However, whether MLR also served as a prognostic factor for in-hospital mortality in AECOPD is unknown. Moreover, whether MLR was a better predictor of in-hospital mortality compared to PLR as well as NLR was an exploratory issue.
PLR, NLR, and MLR are reliable indicators of systemic inflammation. In addition, the basophil-to-lymphocyte ratio (BLR) and eosinophil-to-lymphocyte ratio (ELR) may be related to systemic inflammation.18–20 The prognostic roles of BLR and ELR in cancers remain unclear due to rare published studies. Recently, it has been reported that elevated BLR was correlated with improved overall survival in patients with non-small cell lung cancer.21,22 In addition, BLR was identified to be an independent prognostic factor for distant recurrence-free survival in cervical cancer.23 With respect to ELR, Ohkuma R, et al24 found that ELR was an independent prognostic factor forthe clinical outcome in stage II resectable pancreatic cancer.24 In AECOPD, ELR was a potential indicator of eosinophilic airway inflammation.25 Whether BLE and ELR are predictors of in-hospital mortality in AECOPD is unclear.
This study comprehensively evaluated the prognostic roles of PLR, NLR, MLR, BLR, and ELR for clinical outcomes in patients with AECOPD. The levels of PLR, NLR, MLR, BLR, and ELRbetween stable and exacerbation conditions in COPD patients were compared, and the levels of PLR, NLR, MLR, BLR, and ELR between COPD patients and healthy volunteers were also compared. The correlations of PLR, NLR, MLR, BLR, and ELR with airflow limitation, hospital length of stay (LOS), CRP, and in-hospital mortality in patients with AECOPD were analyzed. A nomogram was constructed to predict the in-hospital mortality, and the practicability and accuracy of the nomogramwere validated.
Materials and Methods
Patients
Patients with AECOPD admitted to the People’s Hospital of Guilin (Guilin, People’s Republic of China) from February 2012 to November 2021 were retrospectively included into the study. In addition, 300 healthy volunteers from the Department of Laboratory Medicine in the People’s Hospital of Guilin were also retrospectively included into this study (Table S1). The study was carried out using a retrospective non-interventional way, signed informed consent could be waived in accordance with relevant Chinese guidelines and laws, and the study protocol, including verbal informed consent and the waiver, has been approved by the Medical Ethics Committee of People’s Hospital of Guilin (No. 2022–011KY). In addition, verbal informed consent was obtained prior to the interview.
FEV1/FVC was calculated as the ratio of forced expiratory volume in one second (FEV1) to forced vital capacity (FVC). The diagnosis of COPD was based on post-bronchodilator FEV1/FVC <0.70 combined with clinical manifestations such as dyspnea, chronic cough, and sputum production.1 AECOPD was defined as acute worsening of respiratory symptoms necessitatingadditional treatment. The typical symptom of AECOPD was aggravated dyspnea accompanied by increased sputum purulence, cough, and wheeze.1 Patients aged ≥18 years old with a primary diagnosis of AECOPD were included in the study. Exclusion criteria were malignancy, acute myocardial infarction, acute heart failure, and other end-stage diseases. For the patients admitted to the hospital more than once, the baseline characteristics in the first admission wererecorded.
Data Collection
The clinical data of the patients with AECOPD were obtained from electronic medical records (EMRs). The demographic data included age, gender, COPD history, height, weight, and a body mass index (BMI). The patients were classified using FEV1% predicted in accordance with Global Initiative for Chronic Obstructive Lung Disease (GOLD) guidelines.1 Pulmonary function parameters consisted of FEV1% predicted, FVC% predicted, and FEV1/FVC. Arterial blood gas (ABG) analysis involved PH, arterial oxygen tension (PaO2), and arterial carbon dioxide tension (PaCO2). Respiratory failure was a severe impairment of gas exchange functions in the respiratory system, leading to hypoxaemia (PaO2 <60 mmHg) and/or hypercapnia (PaCO2 >50 mmHg).26 The common comorbidities of AECOPD comprised asthma, pneumonia, pulmonary heart disease (PHD), hypertension, diabetes mellitus, and cardiovascular disease. Blood routine examinations primarily consists of complete blood counts (CBCs), which referred to the counts of the white blood cell (WBC), red blood cell (RBC), hemoglobin (Hb), platelet, neutrophil, monocyte, lymphocyte, eosinophil, and basophil. PLR, NLR, MLR, BLR, and ELR were calculated using these counts. The other laboratory findings involved D-dimers, uric acid (UA), serum creatinine (Scr), blood urea nitrogen (BUN), albumin, and lactate dehydrogenase (LDH). Hospital length of stay (LOS) was calculated from the date of admission to the data of discharge from hospital or death. All of the clinical data were obtained at the time of admission to the hospital and were pretreatment data.
Stable COPD was a condition characterized as chronic symptoms and persistent airflow limitation without exacerbations in COPD.1 For the survival patients with AECOPD in hospital, the clinical data for blood routine examinations and pulmonary function parameters in stable condition were obtained and analyzed using a case–control way.
For the healthy volunteers, the clinical data were derived from regular medical examinations and collected from the EMR in the Department of Laboratory Medicine of People’s hospital of Guilin. These clinical data consisted of age, gender, and CBCs.
Statistical Analysis
The normal distribution of continuous data was determined using the Kolmogorov–Smirnov test. After the Kolmogorov–Smirnov test, it was found that all of the continuous data were present as abnormal distributions. Thus, the value for each continuous variable represented the median (25th–75th centile). The comparison of continuous data between independent groups was performed by Mann–Whitney U-test, and the paired comparison of the continuous data between groups was performed using the Wilcoxon signed rank test.27,28 The comparison of categorical variables between independent groups was performed using Chi-Square test or Fisher’s exact test. In addition, the comparison of the continuous data among multiple independent groups was performed using the Kruskal–Wallis test.29 Bonferroni’s post hoc comparison test was used if the P value was <0.05 in the Kruskal–Wallis test. The correlation between continuous clinical data was evaluated by the Spearman correlation coefficient, and the correlation between continuous and categorical variables was also evaluated by the Spearman correlation coefficient. The correlation between categorical variables was analyzed using phi or Cramer’s V coefficient.
The association of clinical parameters with in-hospital mortality in patients with AECOPD was analyzed using binary logistic regression along with the corresponding odds ratio (OR) and 95% confidence interval (CI). Receiver operating characteristic (ROC) curves were plotted to evaluate the predictive ability of clinical parameters for in-hospital mortality. A nomogram for predicting in-hospital mortality was established on the basis of the result of binary logistic regression analysis. R (version 4.1.0) analysis packages, including PredictABEL_1.2–4, nricens_1.6, rmda_1.6, and rms_6.3–0, were used to plot the nomogram and perform the corresponding validation. All of the analyses were performed using SPSS version 26.0 (SPSS, Inc., Chicago, IL, USA), and P < 0.05 was considered to be statistically significant.
Results
Clinical Characteristics of 619 Patients with AECOPD
A total of 619 patients with AECOPD were included into the retrospective study in accordance with the inclusion and exclusion criteria, and the baseline characteristics of these patients are summarized in Table 1. Fifty-five patients died during hospitalization, reflecting an in-hospital mortality rate of 8.89%. The included patients consisted of 516 (83.4%) male patients and 103 (16.6%) female patients, with a median age of 70 years old. The median COPD history of the patients was 5.28 years, and 308 (49.8%) patients had no smoking history. The median height, weight, and body mass index (BMI) of the patients were 163 cm, 56 kg, and 21.4 kg/m2, respectively. 11 (1.8%), 117 (18.9%), 330 (53.3%), and 161 (26.0%) patients with AECOPD were classified as GOLD stages I, II, III, and IV, respectively. The median FEV1% predicted, FVC% predicted, and FEV1/FVC were 38.5%, 67.5%, and 58.5%, respectively. After medical evaluation, ninety-two (14.9%) patients were identified to have respiratory failure. 72 (11.6%), 180 (29.1%), 199 (32.1%), and 168 (27.1%) patients with AECOPD had 0, 1, 2, and ≥3 comorbidities, respectively. 67 (10.8%), 250 (40.4%), 59 (9.5%), 187 (30.2%), and 42 (6.8%) patients were accompanied by asthma, pneumonia, PHD, hypertension, and diabetes mellitus, respectively. The median PLR, NLR, MLR, BLR, and ELR were 185.8, 4.712, 0.465, 0.022, and 0.087, respectively.
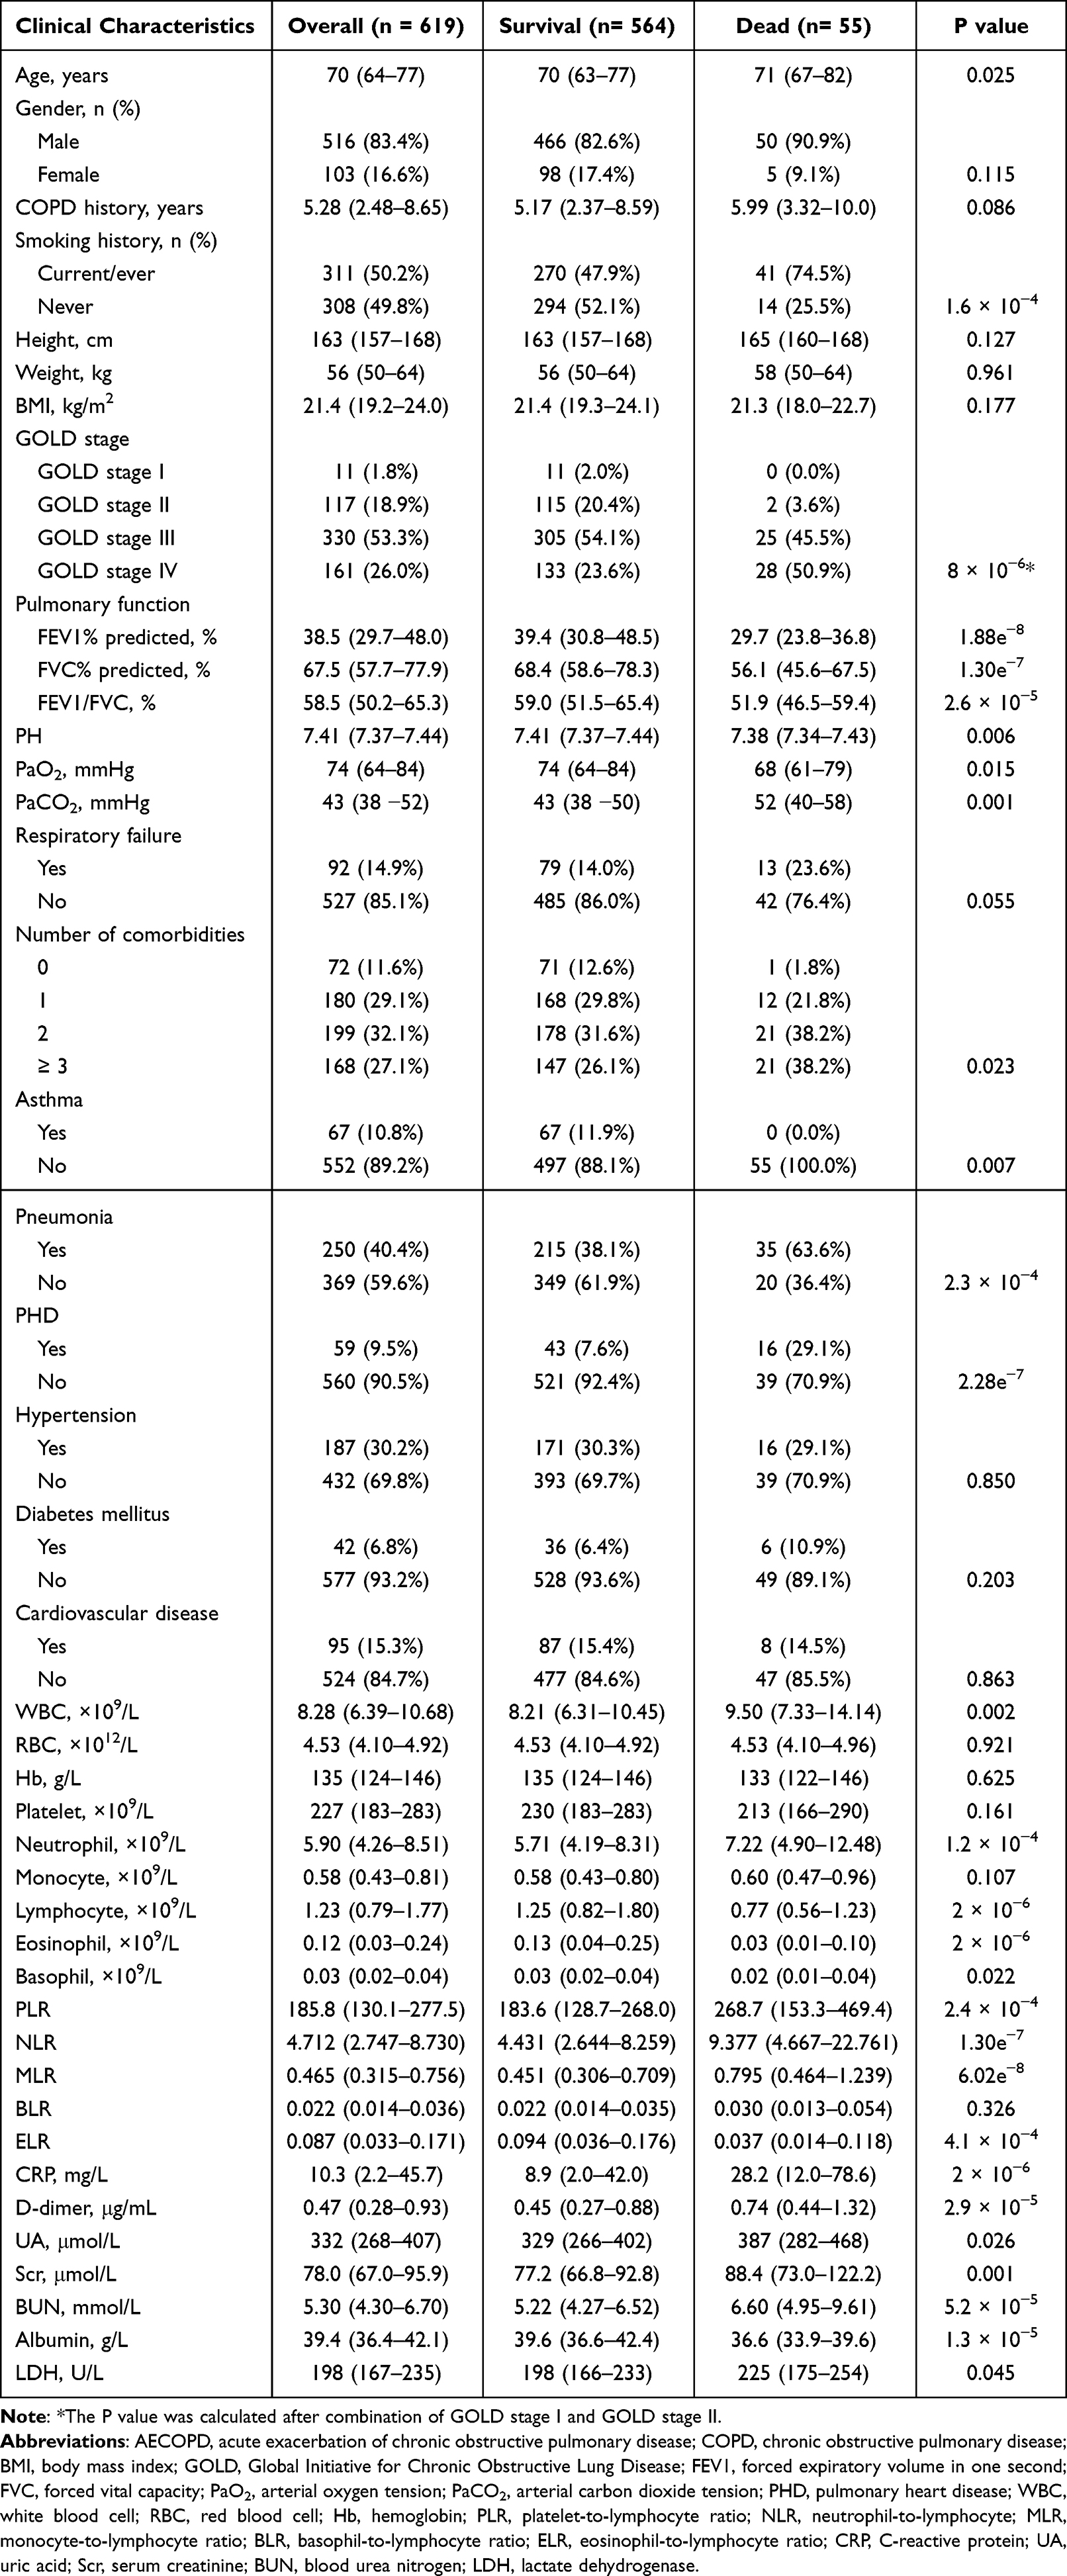 |
Table 1 Comparison of Baseline Characteristics Between Survival and Dead Patients with AECOPD |
55 (8.89%) and 564 (91.1%) patients were divided into dead and survival groups, respectively. The age, PaCO2, WBC, neutrophil, PLR, NLR, MLR, D-dimer, UA, Scr, BUN, and LDH were significantly increased in the dead group compared to the survival group (all P < 0.05). In contrast, the FEV1% predicted, FVC% predicted, FEV1/FVC, PH, PaO2, lymphocyte, eosinophil, basophil, ELR, and albumin were significantly decreased in the dead group compared with the survival group (all P < 0.05). In addition, smoking history, GOLD stages, the number of comorbidities, asthma, pneumonia, and PHD were related to in-hospital mortalities (all P < 0.05). The rate of respiratory failure was marginally elevated in the dead group compared to the survival group (P = 0.055, Table 1).
The Levels of PLR, NLR, MLR, BLR, and ELR in COPD Patients During Stable and Exacerbation Periods and Healthy Volunteers
For the survival patients in hospital (n = 564), FEV1% predicted (P = 2.69e−88), FVC% predicted (P = 1.57e−81), and FEV1/FVC (P = 4.73e−18) were dramatically elevated in the stable period compared to the exacerbation period. In the stable period, PaO2 was remarkably increased (P = 4.64e−38), while PaCO2 was remarkably decreased (P = 5.02e−19), as compared to the exacerbation period (Table 2). Among the survival patients, 410 COPD patients in stable condition completed blood routine examinations. CBCs, Hb, PLR, NLR, MLR, BLR, and ELR between stable and exacerbation conditions in the COPD patients were compared in Table 2. PLR (P = 0.015), NLR (P = 5.11e−13), MLR (P = 0.007), and BLR (P = 7.37e−16) were significantly decreased in stable condition compared to exacerbation condition, while ELR was significantly increased in stable condition compared with exacerbation condition (P = 0.018). In addition, demographic characteristics, blood cell counts, Hb, PLR, NLR, MLR, BLR, and ELR in patients with stable COPD and healthy volunteers are summarized in Table 3. PLR (P = 3.69e−38), NLR (P = 1.00e−69), MLR (P = 2.76e−66), BLR (P = 4.48e−25) and ELR (P = 1.18e−14) were dramatically decreased in the healthy volunteers compared to the patients with stable COPD.
 |
Table 2 Comparison of Clinical Parameters Between COPD Patients in Stable and Exacerbation Conditions |
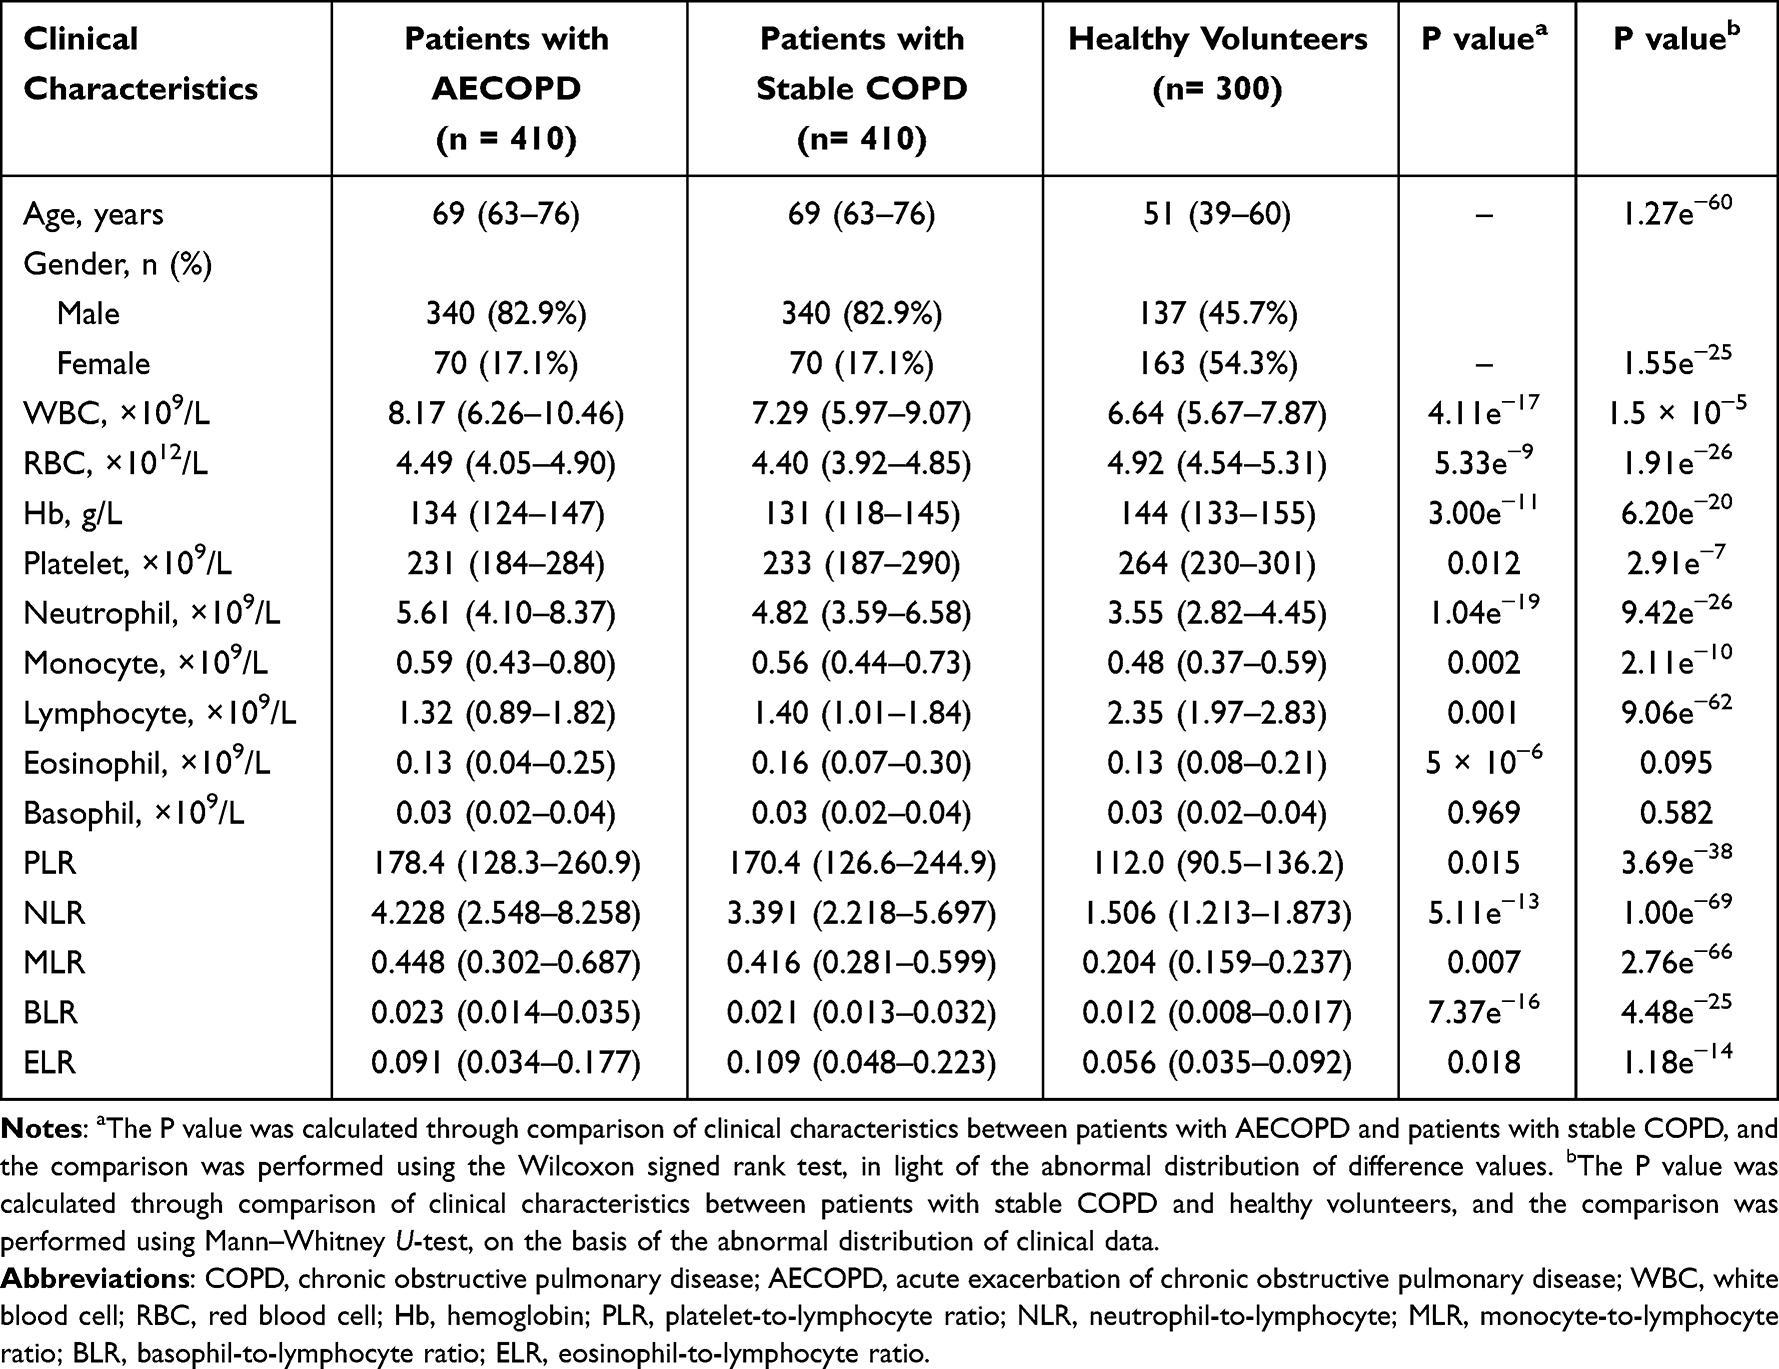 |
Table 3 Comparisons of Clinical Characteristics Among COPD Patients During Stable and Exacerbation Periods and Healthy Volunteers |
Associations of PLR, NLR, MLR, BLR, and ELR with Airflow Limitation in Patients with AECOPD
The Kruskal–Wallis test was used to evaluate the differences in PLR, NLR, MLR, BLR, and ELR among AECOPD patients in stages, II, III, and IV. As a result, there were significant differences in PLR (P = 0.003), NLR (P = 3 × 10⁻⁶), MLR (P = 1.4 × 10⁻⁵), and ELR (P = 0.025) among AECOPD patients with stages I ~ IV. The median (25th–75th centile) PLR values were 136.3 (125.4–171.1), 171.6 (117.4–239.0), 184.3 (134.9–275.8), and 215.5 (138.4–323.1) in AECOPD patients at GOLD stages I, II, III, and IV, respectively. The patients classified as GOLD stage IV had significantly higher PLR than the patients classified as GOLD stage II (Bonferroni’s P = 0.009, Figure 1A). The median (25th–75th centile) NLR values were 3.405 (1.319–8.685), 3.631 (2.141–6.326), 4.635 (2.827–8.692), and 5.870 (3.465–12.457) in patients with AECOPD at GOLD stages I, II, III, and IV, respectively. Higher NLR was associated with more severe airflow limitation (Figure 1B). The corresponding median (25th–75th centile) MLR values were 0.281 (0.232–1.023), 0.362 (0.262–0.563), 0.474 (0.322–0.820), and 0.560 (0.390–0.858), respectively. The patients classified as GOLD stage II had significantly lower MLR compared to the patients classified as GOLD stage III (Bonferroni’s P = 6.5 × 10⁻⁴) as well as the patients classified as GOLD stage IV (Bonferroni’s P = 7 × 10⁻⁶, Figure 1C). For ELR, the median (25th–75th centile) values were 0.043 (0.034–0.083), 0.105 (0.041–0.212), 0.090 (0.036–0.181), and 0.075 (0.021–0.155). The patients with AECOPD at stage IV had significantly lower ELR than the patients with AECOPD at stage II (Bonferroni’s P = 0.037, Figure 1D).
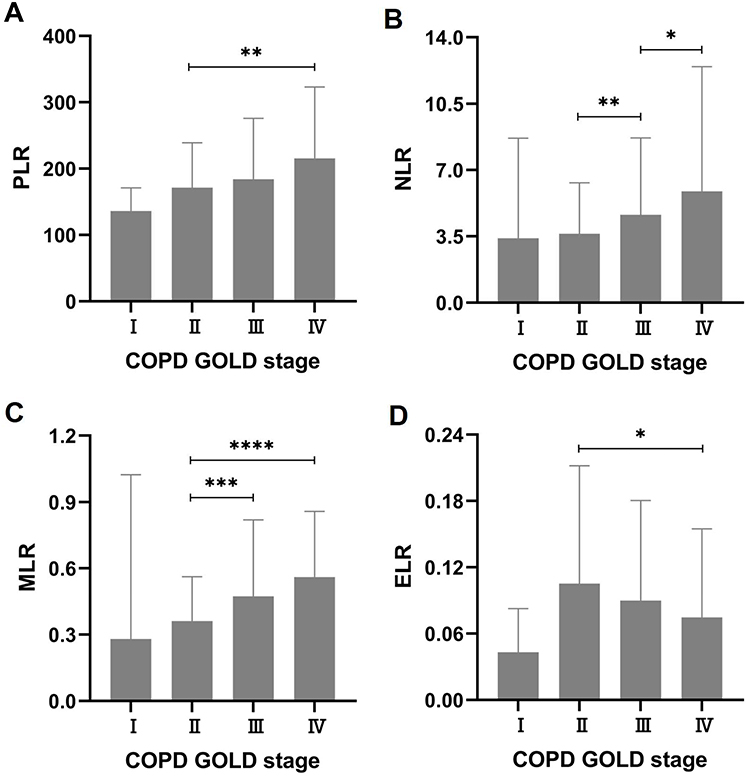 |
Figure 1 Associations of PLR, NLR, MLR, BLR, and ELR with GOLD stages in patients with AECOPD. (A) PLR, platelet-to-lymphocyte ratio; (B) NLR, neutrophil-to-lymphocyte; (C) MLR, monocyte-to-lymphocyte ratio; (D) ELR, eosinophil-to-lymphocyte ratio. *P < 0.05; **P < 0.01; ***P < 0.001; ****P < 0.0001. Abbreviations: GOLD, Global Initiative for Chronic Obstructive Lung Disease; AECOPD, acute exacerbation of chronic obstructive pulmonary disease. Each value represents the median with interquartile range. |
In addition, FEV1% predicted negatively correlated with PLR (r = −0.166, P = 3.2 × 10⁻⁵), NLR (r = −0.223, P = 1.99e−8), MLR (r = −0.197, P = 7.69e−7), and BLR (r = −0.088, P = 0.029), whereas ELR presented a positive correlation with FEV1% predicted (r = 0.087, P = 0.030) (Figure 2). With respect to FEV1/FVC, neither BLR (r = −0.073, P = 0.068) nor ELR (r = −0.077, P = 0.055) had significant correlations with FEV1/FVC. PLR (r = −0.129, P = 0.001), NLR (r = −0.117, P = 0.003), and MLR (r = −0.178, P = 8 × 10⁻⁶) all presented negative correlations with FEV1/FVC (Figure 3).
 |
Figure 2 Correlations of PLR, NLR, MLR, BLR, and ELR with FEV1% predicted in patients with AECOPD. (A) PLR, platelet-to-lymphocyte ratio; (B) NLR, neutrophil-to-lymphocyte; (C) MLR, monocyte-to-lymphocyte ratio; (D) BLR, basophil-to-lymphocyte ratio; (E) ELR, eosinophil-to-lymphocyte ratio. Abbreviation: FEV1, forced expiratory volume in one second; AECOPD, acute exacerbation of chronic obstructive pulmonary disease. |
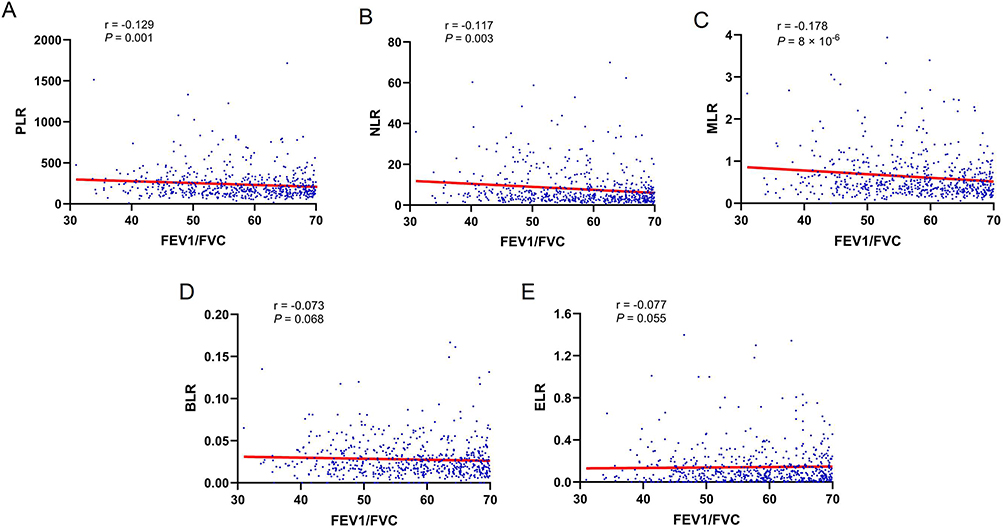 |
Figure 3 Correlations of PLR, NLR, MLR, BLR, and ELR with FEV1/FVC in patients with AECOPD. (A) PLR, platelet-to-lymphocyte ratio; (B) NLR, neutrophil-to-lymphocyte; (C) MLR, monocyte-to-lymphocyte ratio; (D) BLR, basophil-to-lymphocyte ratio; (E) ELR, eosinophil-to-lymphocyte ratio. Abbreviations: FEV1, forced expiratory volume in one second; FVC, forced vital capacity; AECOPD, acute exacerbation of chronic obstructive pulmonary disease. |
Influences of PLR, NLR, MLR, BLR, and ELR on the Hospital Length of Stay and C-Reactive Protein in Patients with AECOPD
Spearman correlation coefficients were used to evaluate the correlations of PLR, NLR, MLR, BLR, and ELR with hospital LOS and CRP based on abnormal distributions of these clinical data. The median (25th–75th centile) hospital LOS was 8 (6–11) days. As shown in Figure 4, PLR (r = 0.152, P = 1.5 × 10⁻⁴), NLR (r = 0.279, P = 1.52e−12), and MLR (r = 0.262, P = 3.30e−11) were positively correlated with hospital LOS, while ELR was negatively correlated with hospital LOS (r = −0.117, P = 0.004). BLR had no correlation with hospital LOS (r = 0.035, P = 0.390). The median (25th–75th centile) CRP was 10.3 (2.2–45.7) mg/L. As shown in Figure 5, CRP positively correlated with PLR (r = 0.280, P = 2.12e−12), NLR (r = 0.464, P = 1.06e−33), and MLR (r = 0.456, P = 1.88e−32), but negatively correlated with ELR (r = −0.166, P = 4.1 × 10⁻⁵). Moreover, BLR had no correlation with CRP (r = 0.039, P = 0.332).
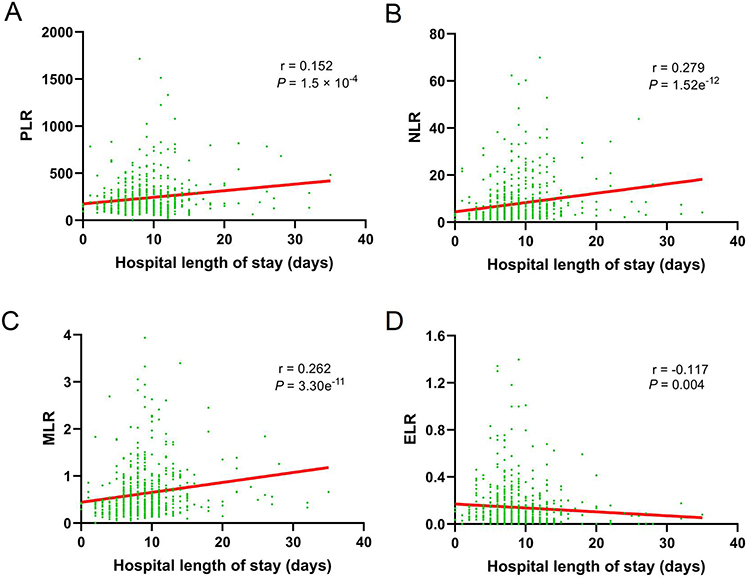 |
Figure 4 Correlations of PLR, NLR, MLR, BLR, and ELR with hospital length of stay in patients with AECOPD. (A) PLR, platelet-to-lymphocyte ratio; (B) NLR, neutrophil-to-lymphocyte; (C) MLR, monocyte-to-lymphocyte ratio; (D) ELR, eosinophil-to-lymphocyte ratio. Abbreviation: AECOPD, acute exacerbation of chronic obstructive pulmonary disease. |
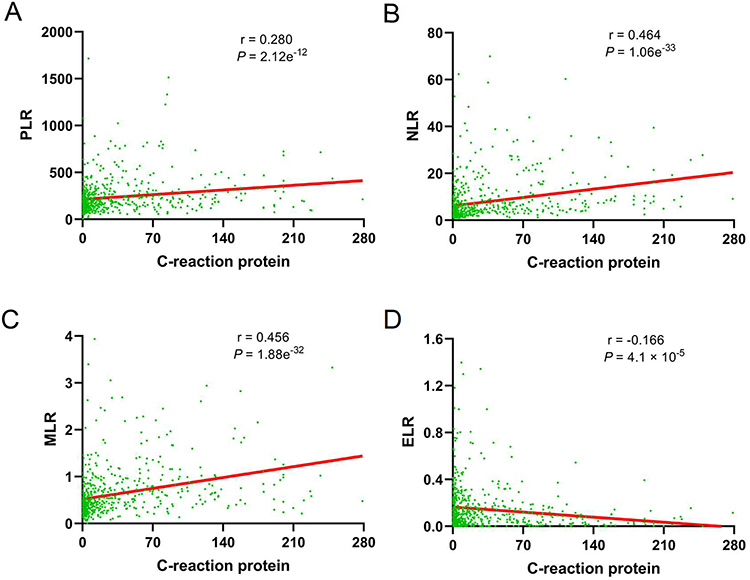 |
Figure 5 Correlations of PLR, NLR, MLR, BLR, and ELR with C-reaction protein in patients with acute exacerbation of chronic obstructive pulmonary disease. (A) PLR, platelet-to-lymphocyte ratio; (B) NLR, neutrophil-to-lymphocyte; (C) MLR, monocyte-to-lymphocyte ratio; (D) ELR, eosinophil-to-lymphocyte ratio. |
Receiver Operating Characteristic (ROC) Curves for In-Hospital Mortality in Patients with AECOPD
ROC curves were plotted to assess the sensitivity, specificity, and accuracy of PLR, NLR, MLR, BLR, and ELR in the prediction of in-hospital mortality in patients with AECOPD, and the area under the curve (AUC) was used to indicate the predictive ability for in-hospital mortality. The AUCs (95% CI) for PLR, NLR, MLR, BLR, and ELR were 0.650 (0.569–0.731), 0.715 (0.646–0.785), 0.721 (0.651–0.791), 0.540 (0.448–0.632), and 0.644 (0.568–0.720), respectively (Figure 6). The results indicated that both NLR and MLR had higher predictive value for in-hospital mortality compared to PLR as well as ELR. In addition, the results suggested that MLR had the highest predictive value for in-hospital mortality. The AUC for BLR was close to 0.5, implying that BLR almost had no predictive ability for in-hospital mortality. In addition, the AUCs (95% CI) for GOLD stages, FEV1% predicted, FVC% predicted, FEV1/FVC, and CRP were 0.677 (0.607–0.746), 0.729 (0.662–0.795), 0.714 (0.641–0.787), 0.679 (0.602–0.737), and 0.696 (0.638–0.753), respectively, suggesting that FEV1% predicted had the highest predictive ability for in-hospital mortality among these parameters. The AUCs for NLR, MLR, FEV1% predicted, and FVC% predicted all exceeded 0.7, indicating that these clinical parameters had excellent predictive ability for in-hospital mortality.
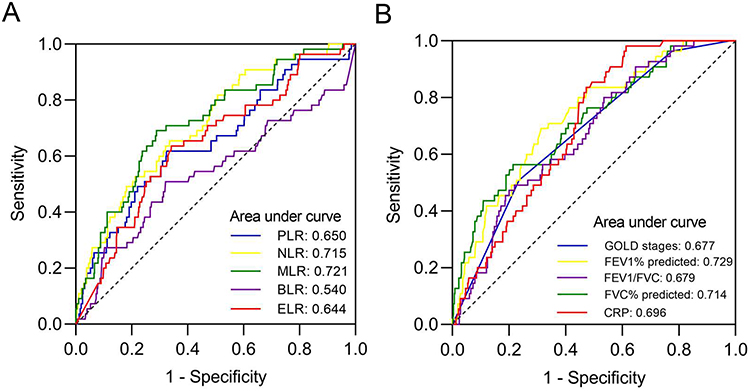 |
Figure 6 Receiver operating characteristic (ROC) curves for evaluating the predictive ability of clinical characteristics in patients with AECOPD. Abbreviations: AECOPD, acute exacerbation of chronic obstructive pulmonary disease; PLR, platelet-to-lymphocyte ratio; NLR, neutrophil-to-lymphocyte; MLR, monocyte-to-lymphocyte ratio; BLR, basophil-to-lymphocyte ratio; ELR, eosinophil-to-lymphocyte ratio; GOLD, Global Initiative for Chronic Obstructive Lung Disease; FEV1, forced expiratory volume in one second; FVC, forced vital capacity; CRP, C-reactive protein. |
Association of Clinical Characteristics with In-Hospital Mortality in Patients with AECOPD
The age, FEV1% predicted, FVC% predicted, FEV1/FVC, PH, PaO2, PaCO2, WBC, neutrophil, lymphocyte, eosinophil, basophil, PLR, NLR, MLR, ELR, CRP, D-dimer, UA, Scr, BUN, albumin, and LDH as continuous variables had differences between survival and dead patients with AECOPD, and had potential to predict in-hospital mortality (Table 1). The associations of the clinical parameters with in-hospital mortality in patients with AECOPD were analyzed using univariate binary logistic regression. As shown in Table 4, these clinical parameters, except for basophil and LDH, were significantly associated with in-hospital mortality in patients with AECOPD. Among these clinical parameters, the age, PaCO2, WBC, neutrophil, PLR, NLR, MLR, CRP, D-dimer, UA, Scr, and BUN were risk factors for in-hospital mortality in patients with AECOPD (all OR values >1, Table 4).
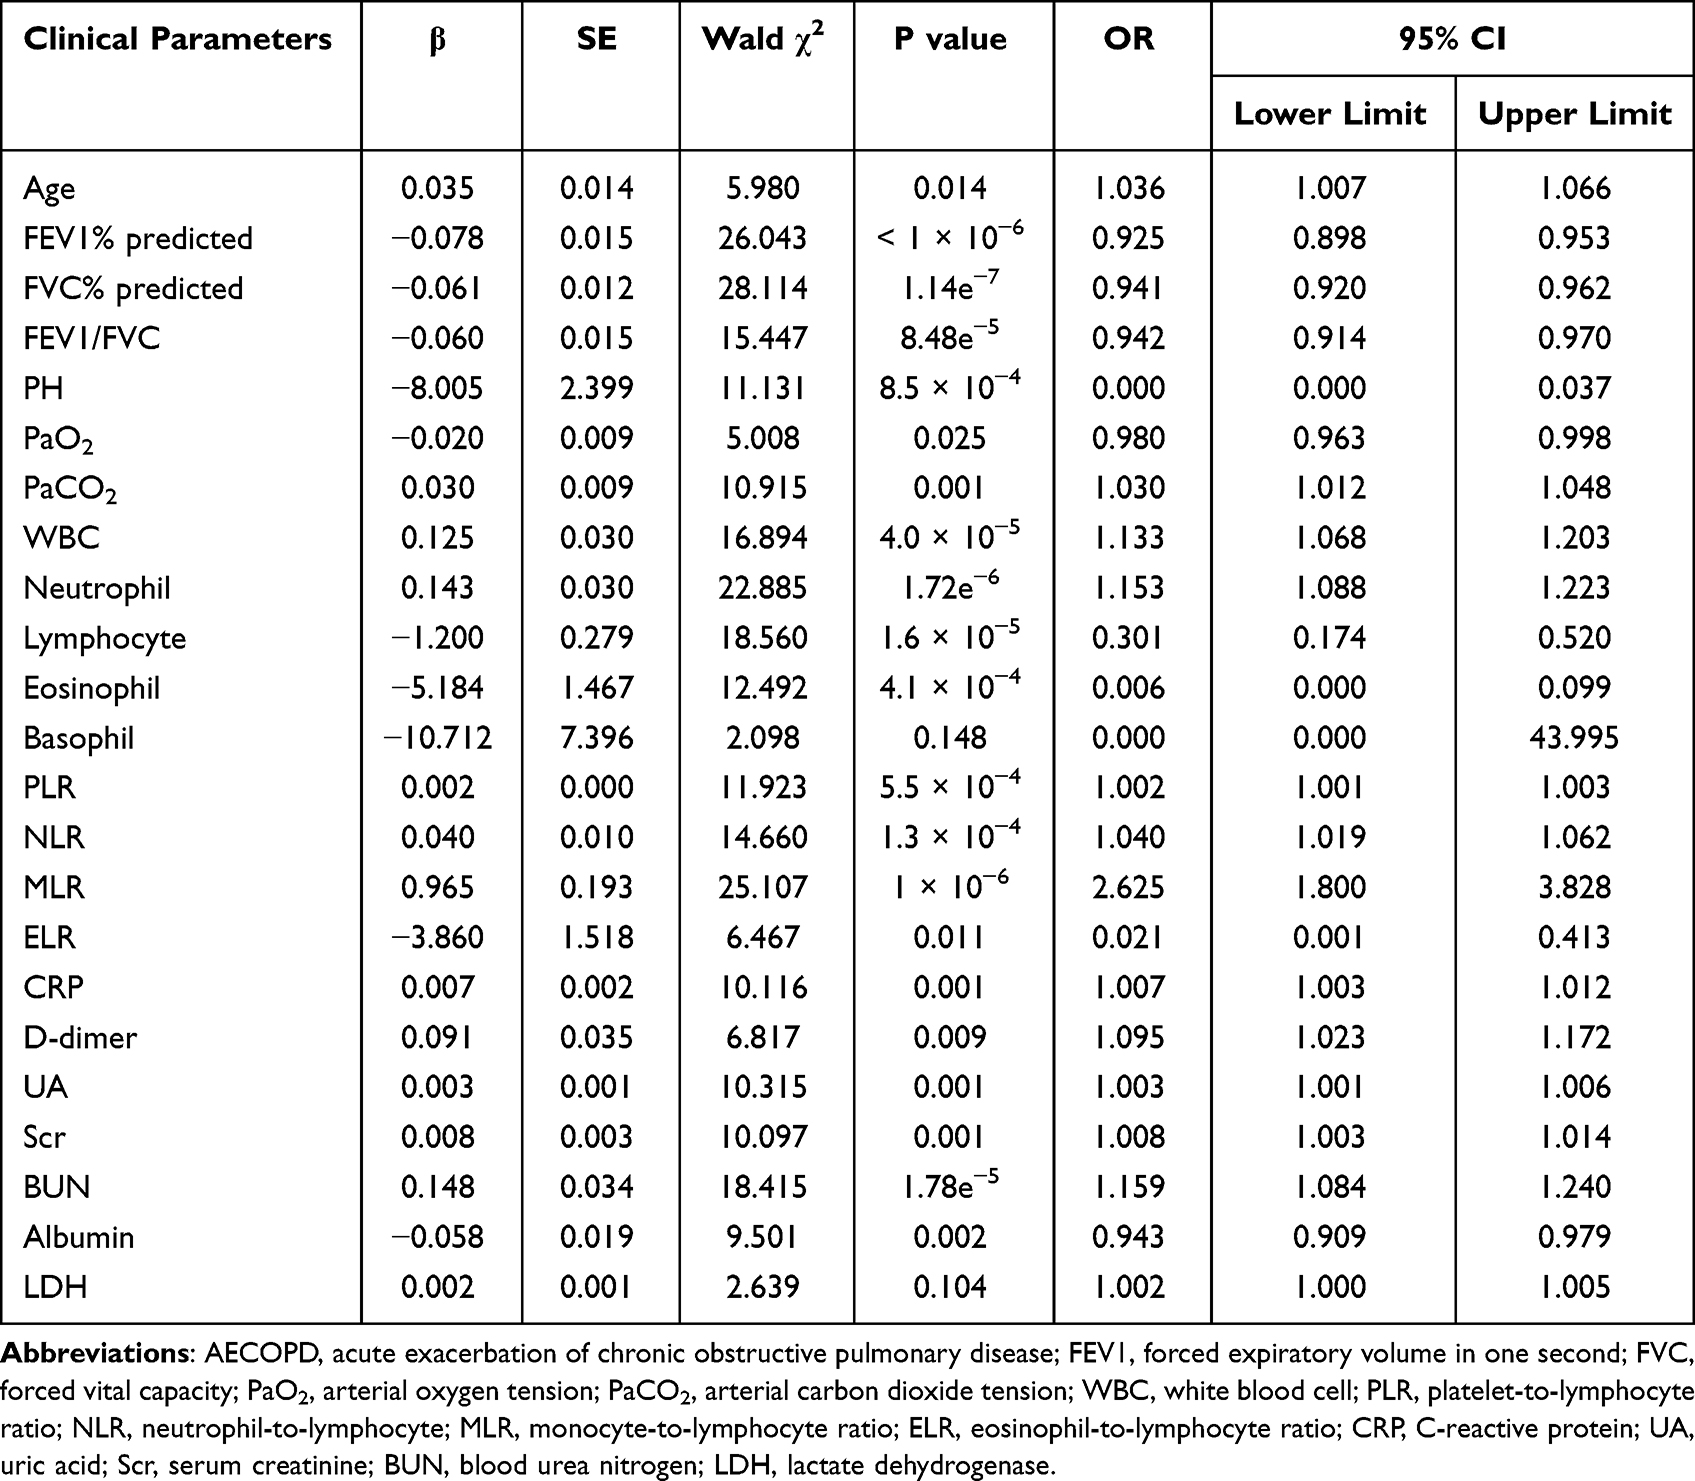 |
Table 4 Univariate Binary Logistic Regression Analysis of Clinical Parameters Associated with In-Hospital Mortality in Patients with AECOPD |
In view of the correlations between clinical characteristics (Table S2), multivariate binary logistic regression analysis included age, smoking history, FEV1% predicted, the number of comorbidities, asthma, pneumonia, PHD, PH, PaCO2, PaO2, CRP, D-dimers, UA, Scr, BUN, albumin, WBC, NLR, MLR, and ELR. As shown in Table 5, smoking history, FEV1% predicted, pneumonia, PHD, UA, albumin, and MLR were significant independent predictors of in-hospital mortality in the patients with AECOPD. In addition, increased ELR was marginally associated with decreased in-hospital mortality (P = 0.070). Among these predictors, smoking history, pneumonia, PHD, increased UA, and increased MLR were risk factors for in-hospital mortality (all OR values > 1).
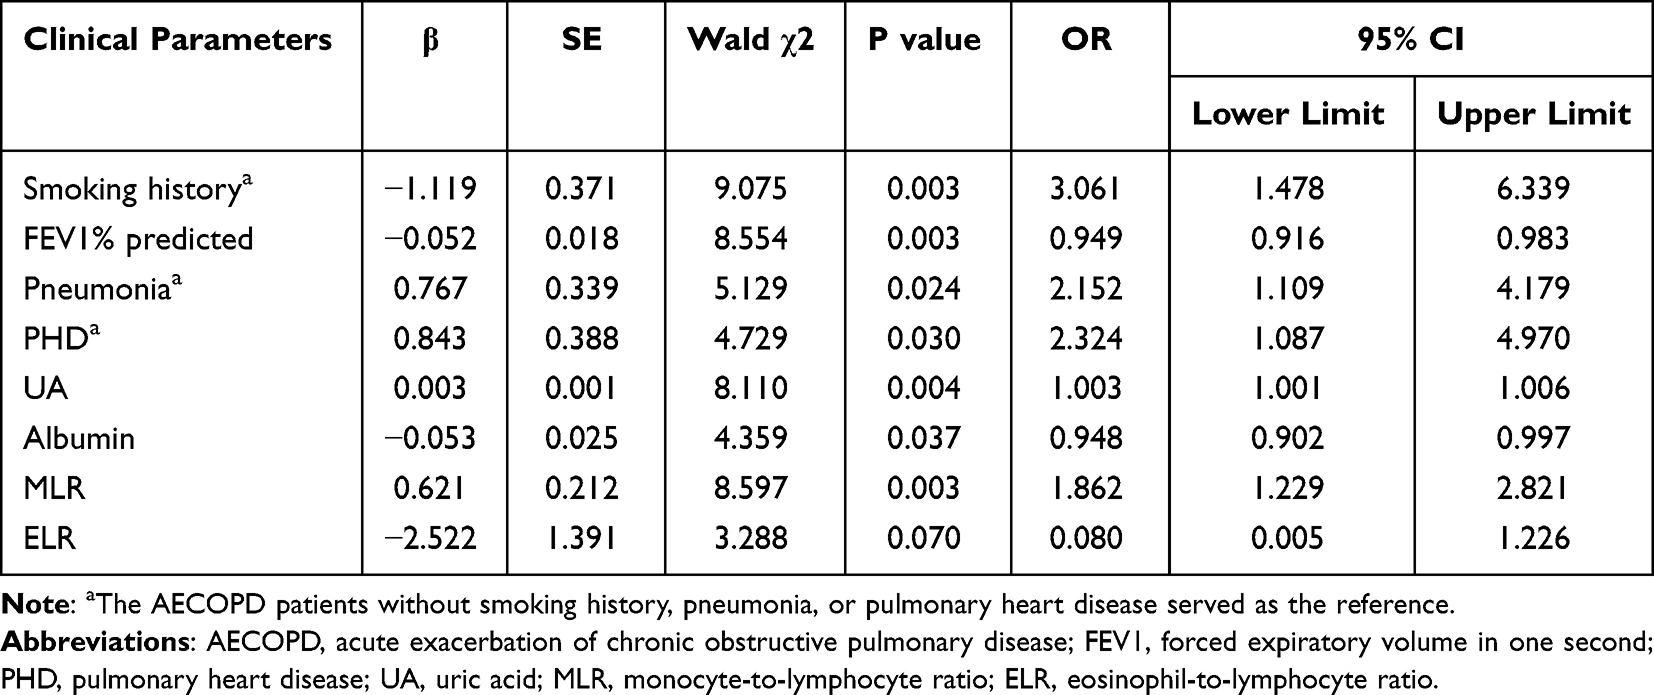 |
Table 5 Multivariate Binary Logistic Regression Analysis of Risk Factors Associated with In-Hospital Mortality in Patients with AECOPD |
Establishment and Validation of a Predictive Model
The predictors, including smoking history, FEV1% predicted, pneumonia, PHD, UA, albumin, MLR, and ELR were used to establish a nomogram to predict in-hospital mortality in the patients with AECOPD (Figure 7). Each predictor reflected a designated score presented on the “Points” line (top line) of the nomogram. The total score of a patient with AECOPD was a summation of the scores for all the predictors. The probability of in-hospital mortality in a patient with AECOPD was estimated on the basis of the total score. The index of concordance (C-index) for the nomogram was 0.850 (95% CI: 0.799–0.901), indicating that the nomogram had high predictive ability. Moreover, the nomogram without MLR or ELR was plotted with a C-index of 0.826 (95% CI: 0.772–0.879, Figure S1). The C-index and predictive ability of the nomogram were validated by ROC curves (Figure 8A). The AUC for the nomogram with MLR and ELR was significantly higher than the AUC for the nomogram without MLR or ELR (P = 0.015), indicating that the introduction of MLR and ELR significantly improved the predictive ability of the nomogram. Decision curve analysis (DCA) was performed to assess the clinical applicability of the nomogram as we previously described.30 The nomogram with MLR and ELR added high net benefits within a wide range of threshold probabilities (Figure 8B). Calibration curves were plotted through bootstrap sampling 2000 times. The calibration curves for the nomogram with MLR and ELR and the nomogram without MLR or ELR were close to the reference lines, indicating that the values predicted by both the nomograms were consistent with the actual observed values (Figure 8C and D).
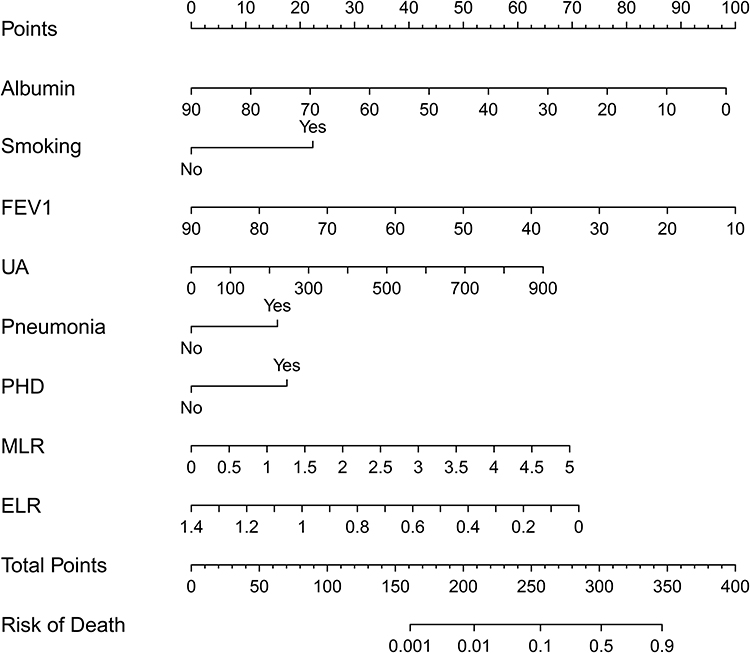 |
Figure 7 The nomogram for in-hospital mortality in patients with AECOPD. Abbreviations: AECOPD, acute exacerbation of chronic obstructive pulmonary disease; FEV1, forced expiratory volume in one second; UA, uric acid; PHD, pulmonary heart disease; MLR, monocyte-to-lymphocyte ratio; ELR, eosinophil-to-lymphocyte ratio. |
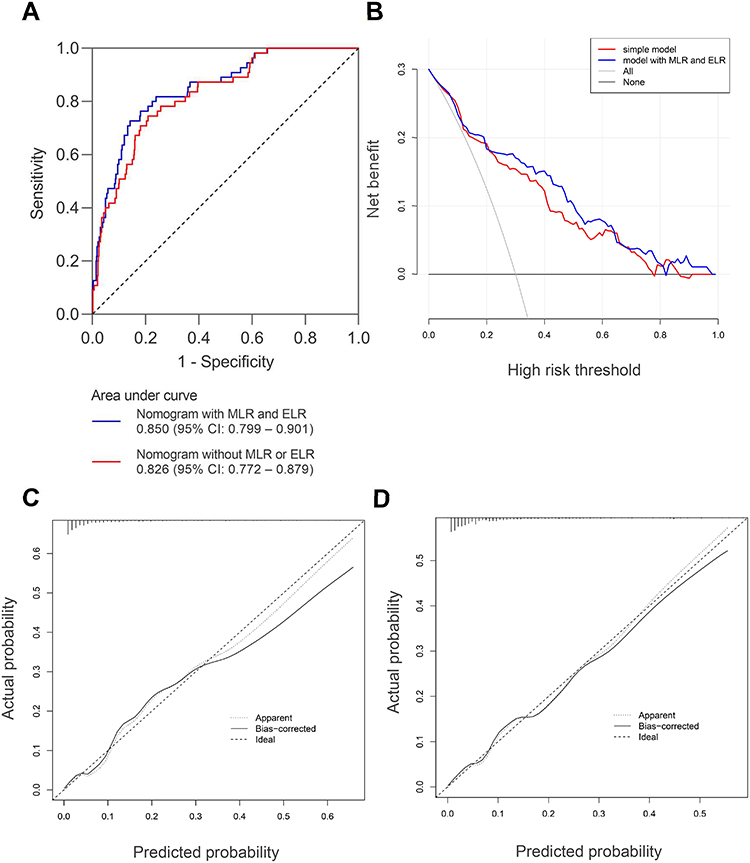 |
Figure 8 Validation of nomograms in AECOPD. (A) Receiver operating characteristic (ROC) curves for nomograms; (B) Decision curve analysis (DCA) of nomograms; the simple model referred to the nomogram without MLR or ELR; (C) The calibration curve for the nomogram with MLR and ELR; (D) The calibration curve for the nomogram without MLR or ELR; In panels (C and D), perfect prediction corresponded to the “ideal” line, the “Apparent” line represented the entire cohort (n = 619), and the “Bias-corrected” line was plotted through bootstrapping (B = 2000 repetitions), indicating observed nomogram performance. Abbreviations: AECOPD, acute exacerbation of chronic obstructive pulmonary disease; MLR, monocyte-to-lymphocyte ratio; ELR, eosinophil-to-lymphocyte ratio. |
A clinical impact curve (CIC) was used to further evaluate the predictive value and clinical applicability of the nomogram.31 As shown in Figure 9A, the nomogram with MLR and ELR had superior net benefits within a wide range of threshold probabilities. DAC and CIC analysis indicated that the nomogram with MLR and ELR possessed significant predictive value. Moreover, the nomogram without MLR or ELR also had good predictive value (Figure 9B). The net reclassification improvement (NRI) and integrated discrimination index (IDI) were used to compare the predictive value between the two nomograms. Compared to the nomogram without MLR or ELR, the nomogram with MLR and ELR had a NRI of 0.323 (95% CI: 0.048–0.599; P = 0.022) and IDI of 0.048 (95% CI: 0.012–0.084; P = 0.009), indicating improved discriminatory performance. The result also reflected the addition of MLR and ELR significantly enhanced the predictive value of the nomogram.
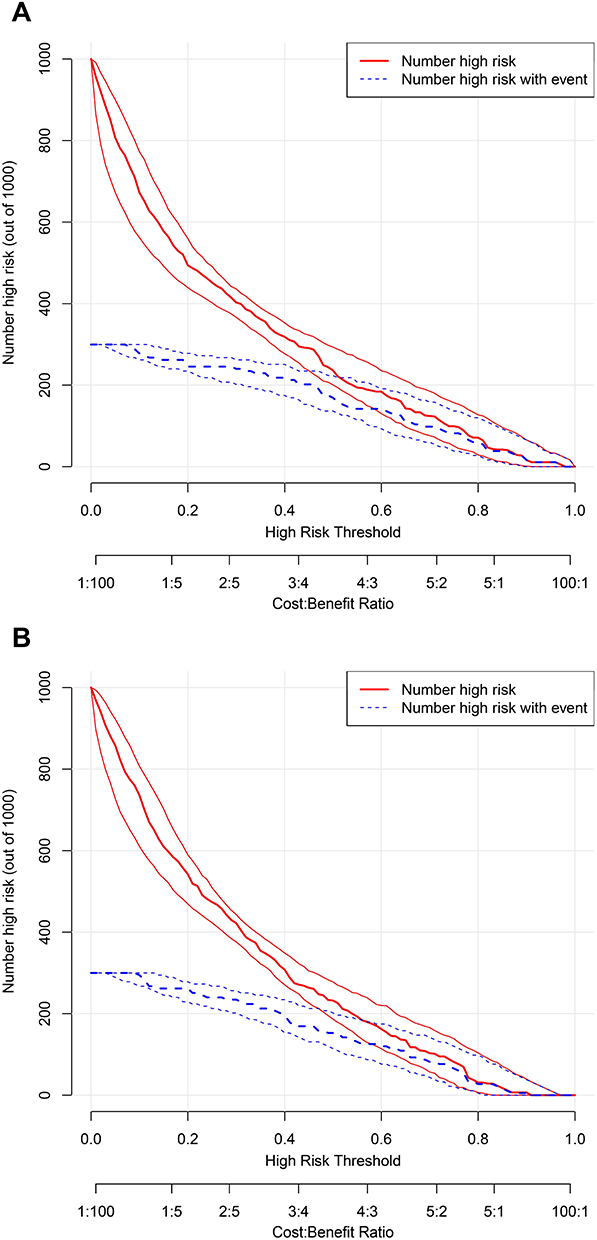 |
Figure 9 Clinical impact curves of nomograms in AECOPD. (A) Nomogram without MLR or ELR; (B) Nomogram with MLR and ELR. The red curve and blue curve indicated the numbers of patients who were classified as high risk and true high risk by the model at threshold probabilities, respectively. True high risk denoted the high risk with events. The clinical impact curves indicated that both the nomograms had high net benefits, and suggested the high clinical predictive value of the nomograms. Abbreviations: AECOPD, acute exacerbation of chronic obstructive pulmonary disease; MLR, monocyte-to-lymphocyte ratio; ELR, eosinophil-to-lymphocyte ratio. |
Discussion
To our best knowledge, this was the first to find that MLR and ELR were predictors of in-hospital mortality in AECOPD. In the present study, MLR independently predicted in-hospital mortality in patients with AECOPD, and increased MLR was associated with elevated in-hospital mortality, while increased ELR was correlated with reduced in-hospital mortality. Interestingly, increased PLR, NLR, and MLR were risk factors for in-hospital mortality in AECOPD, while increased ELR was a favorable factor for in-hospital mortality. PLR, NLR, and MLR, as systemic inflammatory factors, were positively correlated with CRP. In addition, Yang et al18 found that increased NLR and MLR were associated with enhanced systemic inflammation. These findings suggested that enhanced systemic inflammation was related to raised in-hospital mortality in AECOPD.
Compared with the healthy volunteers, PLR, NLR, MLR, BLR, and ELR were all elevated in COPD patients under stable condition. PLR, NLR, MLR, and BLR were further elevated, while ELR was lowered during exacerbation. In the patients with AECOPD, elevated GOLD stages were associated with increased PLR, NLR, and MLR. Moreover, PLR, NLR, and MLR were all negatively correlated with FEV1% predicted as well as FEV1/FVC. These findings indicated that higher PLR, NLR, and MLR were all associated with more serious airflow limitation in AECOPD.
Mounting evidence indicated that prolonged hospital LOS was independently correlated with the increased severity of AECOPD.32–35 In addition, serum CRP is a crucial indicator of the severity of AECOPD.36 In the current study, PLR, NLR, and MLR were all positively correlated with hospital LOS as well as CRP. On the contrary, ELR was negatively correlated with hospital LOS as well as CRP. The results suggested that increased PLR, NLR, and MLR were risk factors for the severity of AECOPD.
In the study, the number of comorbidities was related to in-hospital mortality in AECOPD. Among the comorbidities, asthma, pneumonia, and PHD were significantly associated with in-hospital mortality, there was no association of hypertension, diabetes mellitus, and cardiovascular disease with in-hospital mortality (Table 1). The results suggested accompanying with other respiratory diseases was a risk factor for in-hospital mortality in AECOPD. PHD (cor pulmonale) refers to right ventricular hypertrophy with/without dilation induced by pulmonary hypertension that results in altered lung function and structure.37 In fact, COPD is the leading cause of PHD, and PHD occurs in COPD patients due to loss of vascular bed and alveolar wall destruction.38 It was the first time PHD had been reported to be a risk factor for in-hospital mortality in AECOPD.
It was reported that raised UA was correlated with increased 30-day mortality as well as 1-year mortality in AECOPD.39 Recently, Ogan et al40 revealed that UA was increased in patients with AECOPD deceased during follow-up compared with alive AECOPD patients. For this study, it was first found that elevated UA was correlated with increased in-hospital mortality. Taken together, raised UA increased the risk of mortality in AECOPD.
A nomogram was established on the basis of the results of binary logistic regression. As a result, smoking history, FEV1% predicted, pneumonia, PHD, UA, albumin, MLR, and ELR were chosen. The nomogram had a C-index of 0.850, indicating great predictive value for in-hospital mortality. The predictive value and clinical applicability of the nomogram were demonstrated by DCA, calibration curves, and CIC. Moreover, NRI and IDI showed that the nomogram with MLR and ELR had higher predictive ability than the nomogram without MLR or ELR, indicating that the introduction of MLR and ELR significantly improved the predictive ability of the nomogram.
There were some limitations in the current study. This study was performed in a single center, leading to little contribution to generalize the findings. In the absence of a validation cohort to verify the practicability and accuracy of the nomogram, whether the nomogram has high predictive ability in other populations was uncertain.
Conclusions
In the patients with AECOPD, elevated PLR, NLR, and MLR were all associated with aggravated airflow limitation, prolonged hospital LOS, increased CRP, and raised in-hospital mortality. On the contrary, elevated ELR was correlated with reduced hospital LOS, CRP, and in-hospital mortality. In addition, a nomogram was constructed on the basis of the clinical parameters related to in-hospital mortality, the nomogram had great predictive value for in-hospital mortality. The predictive value and clinical applicability of the nomogram were confirmed by DCA, calibration curves, and CIC. In addition, the introduction of MLR and ELR markedly improved the predictive value of the nomogram.
Abbreviations
COPD, Chronic obstructive pulmonary disease; PLR, platelet-to-lymphocyte ratio; NLR, neutrophil-to-lymphocyte ratio; MLR, monocyte-to-lymphocyte ratio; BLR, basophil-to-lymphocyte ratio; ELR, eosinophil-to-lymphocyte ratio; AECOPD, acute exacerbation of chronic obstructive pulmonary disease; CBC, complete blood count; LOS, length of stay; CRP, C-reactive protein; DCA, decision curve analysis; CIC, clinical impact curve; NRI, net reclassification improvement; IDI, integrated discrimination index; FEV1, forced expiratory volume in one second; FVC, forced vital capacity; EMR, electronic medical record; GOLD, Global Initiative for Chronic Obstructive Lung Disease; PaO2, arterial oxygen tension; PaCO2, arterial carbon dioxide tension; PHD, pulmonary heart disease; WBC, white blood cell; RBC, red blood cell; Hb, hemoglobin; UA, uric acid; Scr, serum creatinine; BUN, blood urea nitrogen; LDH, lactate dehydrogenase; OR, odds ratio; CI, confidence interval; ROC, receiver operating characteristic; C-index, index of concordance.
Data Sharing Statement
The clinical data for the patients with AECOPD used and/or analyzed during the current study are available from the corresponding author on reasonable request. The clinical data for the healthy volunteers used and/or analyzed during the current study are included within the Supplementary Material.
Ethics Approval and Informed Consent
This study was performed in line with the principles of the Declaration of Helsinki. The ethics approval was granted by the Medical Ethics Committee of People’s hospital of Guilin (No. 2022-011KY).
Acknowledgments
The authors thank all the medical staff for providing us more or less help in the collection of clinical parameter data.
Author Contributions
All authors made a significant contribution to the work reported, whether that is in the conception, study design, execution, acquisition of data, analysis and interpretation, or in all these areas; took part in drafting, revising or critically reviewing the article; gave final approval of the version to be published; have agreed on the journal to which the article has been submitted; and agree to be accountable for all aspects of the work.
Funding
This work was supported by the Guilin Municipal Science and Technology Bureau [grant number 20190218-7-8].
Disclosure
Author Ke-Wei Zhu was employed by GuangZhou BaiYunShan Pharmaceutical Holdings CO.,LTD. BaiYunShan Pharmaceutical General Factory, Guangzhou, People’s Republic of China. The remaining authors declare that the research was conducted in the absence of any commercial or financial relationships that could be construed as a potential conflict of interest.
References
1. Vogelmeier CF, Criner GJ, Martinez FJ, et al. Global strategy for the diagnosis, management, and prevention of chronic obstructive lung disease 2017 Report. GOLD executive summary. Am J Respir Crit Care Med. 2017;195(5):557–582. doi:10.1164/rccm.201701-0218PP
2. Agusti A, Vogelmeier C, Faner R. COPD 2020: changes and challenges. Am J Physiol Lung Cell Mol Physiol. 2020;319(5):L879–L883. doi:10.1152/ajplung.00429.2020
3. Ko FW, Chan KP, Hui DS, et al. Acute exacerbation of COPD. Respirology. 2016;21(7):1152–1165. doi:10.1111/resp.12780
4. Luo Z, Zhang W, Chen L, Xu N. Prognostic value of neutrophil: lymphocyte and platelet: lymphocyte ratios for 28-day mortality of patients with AECOPD. Int J Gen Med. 2021;14:2839–2848. doi:10.2147/IJGM.S312045
5. Leuzzi G, Galeone C, Taverna F, Suatoni P, Morelli D, Pastorino U. C-reactive protein level predicts mortality in COPD: a systematic review and meta-analysis. Eur Respir Rev. 2017;26(143):160070. doi:10.1183/16000617.0070-2016
6. Dahl M, Vestbo J, Lange P, Bojesen SE, Tybjaerg-Hansen A, Nordestgaard BG. C-reactive protein as a predictor of prognosis in chronic obstructive pulmonary disease. Am J Respir Crit Care Med. 2007;175(3):250–255. doi:10.1164/rccm.200605-713OC
7. Yao C, Liu X, Tang Z. Prognostic role of neutrophil-lymphocyte ratio and platelet-lymphocyte ratio for hospital mortality in patients with AECOPD. Int J Chron Obstruct Pulmon Dis. 2017;12:2285–2290. doi:10.2147/COPD.S141760
8. Kang Y, Zhu X, Lin Z, et al. Compare the diagnostic and prognostic value of MLR, NLR and PLR in CRC patients. Clin Lab. 2021;67:9.
9. Wang J, Li H, Xu R, et al. The MLR, NLR, PLR and D-dimer are associated with clinical outcome in lung cancer patients treated with surgery. BMC Pulm Med. 2022;22(1):104. doi:10.1186/s12890-022-01901-7
10. Huang H, Liu Q, Zhu L, et al. Prognostic value of preoperative systemic immune-inflammation index in patients with cervical cancer. Sci Rep. 2019;9(1):3284. doi:10.1038/s41598-019-39150-0
11. Huszno J, Kolosza Z. Prognostic value of the neutrophil-lymphocyte, platelet-lymphocyte and monocyte-lymphocyte ratio in breast cancer patients. Oncol Lett. 2019;18(6):6275–6283. doi:10.3892/ol.2019.10966
12. Tiainen S, Rilla K, Hamalainen K, Oikari S, Auvinen P. The prognostic and predictive role of the neutrophil-to-lymphocyte ratio and the monocyte-to-lymphocyte ratio in early breast cancer, especially in the HER2+ subtype. Breast Cancer Res Treat. 2021;185(1):63–72. doi:10.1007/s10549-020-05925-7
13. Song S, Li C, Li S, Gao H, Lan X, Xue Y. Derived neutrophil to lymphocyte ratio and monocyte to lymphocyte ratio may be better biomarkers for predicting overall survival of patients with advanced gastric cancer. Onco Targets Ther. 2017;10:3145–3154. doi:10.2147/ott.S138039
14. Fang L, Yan FH, Liu C, et al. Systemic inflammatory biomarkers, especially fibrinogen to albumin ratio, predict prognosis in patients with pancreatic cancer. Cancer Res Treat. 2021;53(1):131–139. doi:10.4143/crt.2020.330
15. Singh J, Shukla D, Gupta S, Shrivastav BR, Tiwari PK. Clinical epidemiology of gallbladder cancer in North-Central India and association of immunological markers, NLR, MLR and PLR in the diagnostic/prognostic prediction of GBC. Cancer Treat Res Commun. 2021;28:100431. doi:10.1016/j.ctarc.2021.100431
16. Guo L, Ren H, Pu L, Zhu X, Liu Y, Ma X. The prognostic value of inflammation factors in hepatocellular carcinoma patients with hepatic artery interventional treatments: a retrospective study. Cancer Manag Res. 2020;12:7173–7188. doi:10.2147/CMAR.S257934
17. Fois AG, Paliogiannis P, Scano V, et al. The systemic inflammation index on admission predicts in-hospital mortality in COVID-19 patients. Molecules. 2020;25(23):5725. doi:10.3390/molecules25235725
18. Yang Z, Zhang Z, Lin F, et al. Comparisons of neutrophil-, monocyte-, eosinophil-, and basophil- lymphocyte ratios among various systemic autoimmune rheumatic diseases. APMIS. 2017;125(10):863–871. doi:10.1111/apm.12722
19. Bozan N, Alpayci M, Aslan M, et al. Mean platelet volume, red cell distribution width, platelet-to-lymphocyte and neutrophil-to-lymphocyte ratios in patients with ankylosing spondylitis and their relationships with high-frequency hearing thresholds. Eur Arch Otorhinolaryngol. 2016;273(11):3663–3672. doi:10.1007/s00405-016-3980-y
20. Mercan R, Bitik B, Tufan A, et al. The association between neutrophil/lymphocyte ratio and disease activity in rheumatoid arthritis and ankylosing spondylitis. J Clin Lab Anal. 2016;30(5):597–601. doi:10.1002/jcla.21908
21. Lang D, Ritzberger L, Rambousek V, et al. First-line pembrolizumab mono- or combination therapy of non-small cell lung cancer: baseline metabolic biomarkers predict outcomes. Cancers (Basel). 2021;13(23):6096. doi:10.3390/cancers13236096
22. Wang K, Zhao Q, Yan T, et al. The prognostic value of multiple systemic inflammatory biomarkers in preoperative patients with non-small cell lung cancer. Front Surg. 2022;9:830642. doi:10.3389/fsurg.2022.830642
23. Lee JW, Jeon S, Mun ST, Lee SM. Prognostic value of fluorine-18 fluorodeoxyglucose uptake of bone marrow on positron emission tomography/computed tomography for prediction of disease progression in cervical cancer. Int J Gynecol Cancer. 2017;27(4):776–783. doi:10.1097/IGC.0000000000000949
24. Ohkuma R, Kubota Y, Horiike A, et al. The prognostic impact of eosinophils and the eosinophil-to-lymphocyte ratio on survival outcomes in stage II resectable pancreatic cancer. Pancreas. 2021;50(2):167–175. doi:10.1097/MPA.0000000000001731
25. Gao J, Chen B, Wu S, Wu F. Blood cell for the differentiation of airway inflammatory phenotypes in COPD exacerbations. BMC Pulm Med. 2020;20(1):50. doi:10.1186/s12890-020-1086-1
26. Lamba TS, Sharara RS, Singh AC, Balaan M. Pathophysiology and classification of respiratory failure. Crit Care Nurs Q. 2016;39(2):85–93. doi:10.1097/CNQ.0000000000000102
27. Rosner B, Glynn RJ, Lee ML. The Wilcoxon signed rank test for paired comparisons of clustered data. Biometrics. 2006;62(1):185–192. doi:10.1111/j.1541-0420.2005.00389.x
28. Zhu KW, Wang GM, Li CY, et al. Pharmacokinetics and bioequivalence of two formulations of rosuvastatin following single‐dose administration in healthy Chinese subjects under fasted and fed conditions. Clin Pharmacol Drug Dev. 2022;11(8):987–996. doi:10.1002/cpdd.1112
29. Liu Y, Chen W. A SAS macro for testing differences among three or more independent groups using Kruskal-Wallis and Nemenyi tests. J Huazhong Univ Sci Technolog Med Sci. 2012;32(1):130–134. doi:10.1007/s11596-012-0023-9
30. Liao QQ, Ren YF, Zhu KW, et al. Long-term prognostic factors in patients with antineutrophil cytoplasmic antibody-associated vasculitis: a 15-year multicenter retrospective study. Front Immunol. 2022;13:913667. doi:10.3389/fimmu.2022.913667
31. Lu K, Liao QQ, Zhu KW, et al. Efficacy and safety of different doses of rivaroxaban and risk factors for bleeding in elderly patients with venous thromboembolism: a real-world, multicenter, observational, cohort study. Adv Ther. 2024;41(1):391–412. doi:10.1007/s12325-023-02717-5
32. Alshabanat A, Otterstatter MC, Sin DD, et al. Impact of a COPD comprehensive case management program on hospital length of stay and readmission rates. Int J Chron Obstruct Pulmon Dis. 2017;12:961–971. doi:10.2147/COPD.S124385
33. Roche N, Rabbat A, Zureik M, Huchon G. Chronic obstructive pulmonary disease exacerbations in emergency departments: predictors of outcome. Curr Opin Pulm Med. 2010;16(2):112–117. doi:10.1097/MCP.0b013e328335f039
34. Milan S, Bondalapati P, Megally M, et al. Positive expiratory pressure therapy with and without oscillation and hospital length of stay for acute exacerbation of chronic obstructive pulmonary disease. Int J Chron Obstruct Pulmon Dis. 2019;14:2553–2561. doi:10.2147/COPD.S213546
35. FWS K, Chan KP, Ngai J, et al. Blood eosinophil count as a predictor of hospital length of stay in COPD exacerbations. Respirology. 2020;25(3):259–266. doi:10.1111/resp.13660
36. Celli BR, Fabbri LM, Aaron SD, et al. An updated definition and severity classification of chronic obstructive pulmonary disease exacerbations: the Rome proposal. Am J Respir Crit Care Med. 2021;204(11):1251–1258. doi:10.1164/rccm.202108-1819PP
37. Forfia PR, Vaidya A, Wiegers SE. Pulmonary heart disease: the heart-lung interaction and its impact on patient phenotypes. Pulm Circ. 2013;3(1):5–19. doi:10.4103/2045-8932.109910
38. Sakao S. Chronic obstructive pulmonary disease and the early stage of cor pulmonale: a perspective in treatment with pulmonary arterial hypertension-approved drugs. Respir Investig. 2019;57(4):325–329. doi:10.1016/j.resinv.2019.03.013
39. Bartziokas K, Papaioannou AI, Loukides S, et al. Serum uric acid as a predictor of mortality and future exacerbations of COPD. Eur Respir J. 2014;43(1):43–53. doi:10.1183/09031936.00209212
40. Ogan N, Gunay E, Baha A, Candar T, Akpinar EE. The effect of serum electrolyte disturbances and uric acid level on the mortality of patients with acute exacerbation of chronic obstructive pulmonary disease. Turk Thorac J. 2020;21(5):322–328. doi:10.5152/TurkThoracJ.2019.19034
 © 2024 The Author(s). This work is published and licensed by Dove Medical Press Limited. The full terms of this license are available at https://www.dovepress.com/terms.php and incorporate the Creative Commons Attribution - Non Commercial (unported, v3.0) License.
By accessing the work you hereby accept the Terms. Non-commercial uses of the work are permitted without any further permission from Dove Medical Press Limited, provided the work is properly attributed. For permission for commercial use of this work, please see paragraphs 4.2 and 5 of our Terms.
© 2024 The Author(s). This work is published and licensed by Dove Medical Press Limited. The full terms of this license are available at https://www.dovepress.com/terms.php and incorporate the Creative Commons Attribution - Non Commercial (unported, v3.0) License.
By accessing the work you hereby accept the Terms. Non-commercial uses of the work are permitted without any further permission from Dove Medical Press Limited, provided the work is properly attributed. For permission for commercial use of this work, please see paragraphs 4.2 and 5 of our Terms.