
Back to Journals » International Journal of Chronic Obstructive Pulmonary Disease » Volume 21
Plasma Lipidomic Signatures Across the Healthy–Pre-COPD–COPD Continuum Identified by Machine Learning
Authors Xing Y, Yu G, Tian Q, Zhang T, Li D, Guo Y, Luo X, Li W, Liu X, Xu J, Li J
Received 17 January 2026
Accepted for publication 25 June 2026
Published 13 July 2026 Volume 2026:21 596991
DOI https://doi.org/10.2147/COPD.S596991
Checked for plagiarism Yes
Review by Single anonymous peer review
Peer reviewer comments 2
Editor who approved publication: Prof. Dr. Zijing Zhou
Yeyiyi Xing, Guojing Yu, Qihui Tian, Tongyi Zhang, Duoyang Li, Yifan Guo, Xuqin Luo, Wenyu Li, Xiao Liu, Jiaqi Xu, Jie Li
Department of Respiratory Medicine, Dongzhimen Hospital, Beijing University of Chinese Medicine, Beijing, People’s Republic of China
*These authors contributed equally to this work
Correspondence: Jie Li, Department of Respiratory Medicine, Dongzhimen Hospital, Beijing University of Chinese Medicine, Beijing, People’s Republic of China, Email [email protected]
Objective: Chronic obstructive pulmonary disease (COPD) imposes a substantial global burden, and Pre-COPD is regarded as an early, high-risk window that comprises distinct phenotypes, including small airway dysfunction (SAD), emphysema, and preserved ratio impaired spirometry (PRISm), whose early molecular heterogeneity is not fully captured by spirometry or imaging. This study aimed to characterize plasma lipidomic profiles across the healthy–Pre-COPD–COPD continuum, including these three phenotypes, and to apply regularized machine learning to identify lipid signatures shared across or specific to individual phenotypes.
Methods: In this single-center, cross-sectional, observational study, 124 participants were enrolled, comprising 30 healthy controls, 63 individuals with Pre-COPD (SAD, n=23; emphysema, n=20; PRISm, n=20), and 31 patients with COPD. Untargeted plasma lipidomics was performed by UHPLC–high-resolution mass spectrometry. Differential lipids were identified by OPLS-DA (VIP > 1) and P values, and those that remained associated with disease group after adjustment for sex, age, BMI, and smoking (FDR < 0.05) were retained as candidate features. Elastic-net–regularized multinomial logistic regression was then applied for feature selection and to assess the discriminative performance of the selected lipids, evaluated by internal five-fold nested cross-validation with bootstrap stability selection. For each task, clinical-only, lipid-only, and combined models were compared, under a two-stage design comprising three phenotype-specific models (Healthy–SAD–COPD, Healthy–Emphysema–COPD, Healthy–PRISm–COPD) and a merged Healthy–Pre-COPD–COPD model.
Results: A total of 171 differential lipids were identified. The merged Healthy–Pre-COPD–COPD model achieved a macro-averaged area under the curve (AUC) of 0.85 (95% CI 0.79– 0.91), and the Healthy–SAD–COPD, Healthy–Emphysema–COPD, and Healthy–PRISm–COPD models achieved 0.90 (0.85– 0.95), 0.92 (0.87– 0.97), and 0.83 (0.74– 0.90), respectively; across all tasks, models incorporating the selected lipids outperformed clinical-only models, whose macro-averaged AUCs ranged from 0.54 to 0.73. A compact set of recurrently selected, high-stability lipids, namely the ceramides Cer(d18:0/14:0), Cer(m18:0/18:0), and Cer(d18:1/22:0), PG(16:0/0:0), and LacCer(d16:0/16:0), was associated with disease stage and with pulmonary function. The phenotypes shared this signature but were further distinguished by phenotype-specific lipids, namely PI(18:0/20:4) and Cer(d18:1/22:0) in SAD, both associated only with small-airway indices and the latter being especially discriminative in this phenotype, PE(22:6/0:0) in emphysema, and GM3(d18:1/22:0) in PRISm.
Conclusion: Under internal cross-validation, plasma lipidomic profiles discriminated healthy individuals, Pre-COPD phenotypes, and patients with COPD and were associated with pulmonary function, and a compact set of candidate lipids was identified. As this was an exploratory, cross-sectional analysis without longitudinal or external validation, these candidate markers require external and prospective validation before any clinical application.
Keywords: pre-COPD subtypes, untargeted lipidomics, machine learning, chronic obstructive pulmonary disease
Introduction
COPD is a chronic inflammatory respiratory disorder characterized by persistent airflow limitation. COPD affects approximately 450 million people worldwide and ranks as the third leading cause of death globally, imposing a substantial economic burden on patients and society.1,2 Because COPD remains incurable and often becomes clinically apparent after substantial structural and functional damage has occurred, early identification of high-risk disease states is essential for prevention-oriented management.
The concept of Pre-COPD has been introduced in the Global Initiative for Chronic Obstructive Lung Disease (GOLD) reports, with phenotypes such as small airway dysfunction (SAD), emphysema, and Preserved Ratio Impaired Spirometry (PRISm) described as potential precursor states to COPD.3 These phenotypes may reflect distinct pathological processes before establish airflow limitation. However, conventional spirometry and chest imaging mainly define functional or structural abnormalities and may not fully characterize early molecular heterogeneity among Pre-COPD phenotypes.4,5 Lipidomic biomarkers may provide additional molecular information for characterizing early disease states that are not fully captured by spirometry or imaging.6 Disordered lipid metabolism has been increasingly implicated in COPD pathogenesis and progression, potentially through airway inflammation, oxidative stress, and immune dysregulation.7–11 Previous metabolomic and lipidomic studies in COPD have reported alterations in glycerophospholipid, sphingolipid, and acylcarnitine-related pathways, which have been associated with airflow obstruction, emphysema, lung function impairment, and exacerbation-related outcomes.12 These findings support the relevance of lipid metabolism to COPD-related pathological processes, but most available studies have focused on established COPD rather than Pre-COPD. Existing metabolomic studies in ever-smokers and preserved-spirometry populations suggest that molecular perturbations may already be present before overt airflow obstruction, and a recent multi-omics pilot study further reported exploratory metabolomic and lipidomic differences between COPD and GOLD-defined Pre-COPD smokers.13 Phenotype-specific plasma lipidomic characterization across the Healthy–Pre-COPD–COPD continuum remains limited, particularly for distinct Pre-COPD phenotypes such as SAD, emphysema, and PRISm.
However, lipidomic datasets are high-dimensional and contain highly correlated features, whereas cohorts of early disease are typically small, which limits conventional multivariable analysis.14 Regularised machine-learning approaches such as the elastic net can mitigate these constraints and support the identification of robust lipid signatures that are shared across, or specific to, individual Pre-COPD phenotypes.15 Therefore, this study aimed to characterize plasma lipidomic profiles in healthy individuals, Pre-COPD phenotypes, and patients with COPD, and to identify lipid signatures associated with different stages of the disease continuum. We also explored whether machine learning could facilitate the recognition of shared and phenotype-specific lipid features, thereby providing a basis for further investigation of the biological processes associated with Pre-COPD and COPD.
Methods
Study Design and Population
This study was conducted as a single-center, cross-sectional, observational study. Patients were recruited from outpatient and inpatient services at Dongzhimen Hospital, Beijing University of Chinese Medicine, between January 2023 and February 2025; healthy volunteers were recruited from the hospital Health Examination Center. Standardized pulmonary function tests were performed for all participants during the medical visit or health examination, and complete clinical data were collected. Fasting venous blood samples were collected and stored at the Beijing University of Chinese Medicine Biobank. The study protocol was approved by the Medical Ethics Committee of Dongzhimen Hospital, Beijing University of Chinese Medicine (approval no. 2022DZMEC-432). Written informed consent was obtained from all participants for the use of their clinical information and blood samples for research purposes.
In accordance with the GOLD 2024 report, COPD was defined as a post-bronchodilator FEV1/FVC ratio <0.70. Pre-COPD was defined as the presence of any of the following structural or functional abnormality phenotypes in the absence of persistent airflow limitation: (1) SAD phenotype: post-bronchodilator FEV1/FVC ≥0.70 and FEV1 ≥80% predicted, with at least two small-airway indices (FEF25–75%, FEF50%, and/or FEF75%) <65% predicted; (2) Emphysema phenotype: post-bronchodilator FEV1/FVC ≥0.70, with emphysema documented on clinical chest CT or HRCT reports obtained during routine clinical evaluation; (3) PRISm phenotype: post-bronchodilator FEV1/FVC ≥0.70 with FEV1 <80% predicted. The healthy control group was defined by the absence of chronic respiratory symptoms, structural lung disease, and prior diagnoses of asthma or COPD, along with post-bronchodilator FEV1/FVC ≥0.70 and FEV1 ≥80% predicted, and no significant abnormalities on chest imaging. Smoking status was categorized as never versus former/current, and cumulative exposure was quantified in pack-years.
Standardized questionnaires and examinations were administered to all participants. Demographic characteristics (age, sex), smoking history, medical history, and medication use were collected using a self-administered questionnaire. Height and weight were measured, and body mass index (BMI) was calculated. Pulmonary function testing was performed in accordance with American Thoracic Society/European Respiratory Society (ATS/ERS) standards, and FEV1, FVC, and the FEV1/FVC ratio were measured before and after bronchodilator administration, and HRCT was performed when clinically indicated to assess emphysema.
Plasma Sample Collection
Fasting (≥12 h) venous blood samples were obtained from all participants in the early morning on the day of the medical visit or physical examination. Blood was collected into vacuum blood collection tubes containing sodium heparin as an anticoagulant. Samples were centrifuged at 3000 rpm for 10 min at 4°C to separate plasma, which was aliquoted and stored at −80°C. Plasma aliquots were transferred to the Beijing University of Chinese Medicine Biobank for long-term storage until lipidomic analysis.
Lipid Extraction and Sample Preparation
After thawing at 4°C, samples were vortex-mixed for 10s. An aliquot of 40 μL plasma was mixed with 300 μL methanol and 1000 μL methyl tert-butyl ether (MTBE), followed by vortex-mixing for 1 min and 60 min, respectively. Phase separation was induced by adding 250 μL ultrapure water, and the mixture was vortex-mixed for 1 min and centrifuged at 12,000 rpm for 10 min at 4°C. A 400-μL aliquot of the supernatant was collected, dried under vacuum at low temperature, and reconstituted in 100 μL isopropanol/acetonitrile (1:1, v/v) by sonication. After centrifugation at 12,000 rpm for 10 min at 4°C, 90 μL of the supernatant was transferred to an HPLC vial with a 250-μL insert for LC-MS analysis. QC samples were prepared by pooling equal volumes of all samples and were extracted using the same procedure.
Untargeted Lipidomic Profiling
Untargeted lipidomic profiling was performed on a Dionex UltiMate 3000 UHPLC system coupled to a Q Exactive Orbitrap mass spectrometer. Positive- and negative-ion data were acquired in separate runs. Chromatographic separation was achieved on a Waters ACQUITY UPLC BEH C8 column (1.7 μm, 2.1 mm × 100 mm) maintained at 55°C, and the autosampler was set at 10°C. In positive-ion mode, mobile phase A consisted of acetonitrile/water (1:10, v/v) containing 0.04% formic acid and 1 mM ammonium acetate, and mobile phase B consisted of acetonitrile/isopropanol (1:9, v/v) containing 0.1% formic acid and 5 mM ammonium formate. The gradient was as follows: 0 min, 100% A; 2.0 min, 70% A; 9.0 min, 30% A; 11.0 min, 5% A; 12.0–14.0 min, 0% A; and 14.1–16.0 min, 100% A. The flow rate was 0.26 mL/min and the injection volume was 6.0 μL. In negative-ion mode, mobile phase A consisted of acetonitrile/water supplemented with 0.04% acetic acid and 1 mM ammonium acetate, and mobile phase B consisted of acetonitrile/isopropanol (1:1, v/v). The gradient was as follows: 0 min, 90% A; 3 min, 65% A; 6 min, 15% A; 8.0–11.0 min, 0% A; and 11.1–13.0 min, 90% A. The flow rate was 0.30 mL/min and the injection volume was 6.0 μL.
A heated electrospray ionization source was used. The spray voltages in positive- and negative-ion modes were 3.7 and 3.5 kV, respectively. The capillary temperature was set at 320°C, the auxiliary gas heater temperature at 300°C, the sheath gas pressure at 30 psi, and the auxiliary gas pressure at 10 psi. Nitrogen was used as both sheath and auxiliary gas, and the collision gas pressure was 1.5 mTorr. Full-scan MS data were acquired over an m/z range of 100–1500 at a resolution of 70,000, with an automatic gain control target of 1 × 10⁶ and a maximum injection time of 50 ms. Data-dependent MS/MS spectra were acquired at a resolution of 17,500, with an automatic gain control target of 1 × 10⁵, a maximum injection time of 50 ms, a 2 m/z isolation window, and stepped collision energies of 10, 30, and 60 V. Up to 10 precursor ions were selected for fragmentation with dynamic exclusion enabled. External calibration was applied to maintain a mass accuracy within 5 ppm. For quality control, pooled QC samples were injected 10 times before formal acquisition to equilibrate the analytical system and were subsequently analyzed once every 10 study samples throughout the run. Blank samples were included to monitor background contamination and carryover, and the injection order of study samples was randomized.
Data Processing and Preprocessing
Raw UHPLC-MS data were imported into Progenesis QI software (version 3.0; Waters Corporation) for data processing. Within this platform, retention-time alignment, peak detection, deconvolution, and isotope/adduct grouping were performed to generate a feature matrix indexed by retention time and mass-to-charge ratio (RT-m/z). Feature intensities were normalized in Progenesis QI using the “Normalize to all compounds” algorithm. Features with a coefficient of variation (CV) >30% across QC samples were excluded to improve analytical reproducibility. In addition, features with more than 20% zero or missing values were removed, and the remaining missing values were imputed using one-fifth of the minimum positive value for each feature. Before multivariate statistical analysis, the data were log10-transformed and Pareto-scaled. Positive- and negative-ion datasets were processed separately, and differential lipids identified from the two ionization modes were subsequently integrated for downstream interpretation.
Lipid annotation was performed primarily against the LIPID MAPS database. Annotation confidence was supported by accurate mass matching within 5 ppm, isotope pattern similarity, diagnostic MS/MS fragment information, adduct pattern, and expected chromatographic retention behavior. Lipid annotations were generally reported at the sum composition level and were considered to correspond mainly to MSI level 2.
Differential Lipid Analysis
To summarize overall lipidomic variation and explore separation trends across disease stages, principal component analysis (PCA) was performed on standardized lipid data. Score plots were generated to visualize sample clustering and dispersion across groups in low-dimensional space. Subsequently, an Orthogonal Partial Least Squares Discriminant Analysis (OPLS-DA) model was constructed to improve between-group discrimination and to obtain variable importance in projection (VIP) scores for each lipid feature. Model fit and robustness were evaluated using 200 permutation tests to assess the risk of overfitting. For differential screening, pairwise comparisons were performed between the healthy group and each Pre-COPD phenotype, between the healthy group and the COPD group, and between each Pre-COPD phenotype and the COPD group. For each comparison, the log2 fold change and corresponding P value for each lipid were calculated and integrated with the VIP scores obtained from the OPLS-DA model. Differential lipids were defined using predefined thresholds described in the Statistical Analysis section.
Machine Learning Model Development
The plasma lipidome is high-dimensional relative to the sample size (p ≫ n), so the feature set was first reduced to lipids that remained significantly associated with disease group after adjustment for clinical covariates (Supplementary Table S2). Even after this reduction, the events per variable (EPV) remained below the conventional threshold of 10, a setting in which maximum likelihood estimation tends to overfit whereas penalised regression has been shown by simulation to yield more robust models.16 All classifiers were therefore based on the elastic net,15 whose combined L1 and L2 penalties provide feature sparsity and a grouping effect well suited to highly correlated lipids, and were fitted as elastic-net–regularised multinomial logistic regression, which performs feature selection and classification within a single interpretable framework. No class weighting was applied, as the class distribution was only moderately imbalanced (approximately 1:2:1), to which the elastic net is robust. For each task, three model families were constructed to assess whether lipids carried discriminative information beyond established clinical predictors: a clinical-only model (sex, age, BMI, and smoking index), a model using the adjusted significant lipids alone, and a combined model.
Model performance was estimated by five-fold stratified nested cross-validation. The outer loop provided unbiased estimation of generalisation performance, while the inner loop, applied only within each outer training set, performed bootstrap-based stability selection (retaining features with a selection frequency ≥0.5)17 together with cross-validated tuning of the hyperparameters (α over (0, 0.2, 0.5, 0.8, 1); λ chosen by the one-standard-error rule). By aggregating results across subsamples, stability selection provides finite-sample control of the expected number of falsely selected variables. The final model for each task was refitted on the complete dataset, retaining the features selected in at least one-fold. Predicted probabilities from the held-out test folds were pooled to compute class-specific and macro-averaged AUCs (95% confidence intervals by bootstrapping), accuracy, sensitivity, specificity, and the F1 score; calibration was assessed using the Brier score and calibration curves. The EPV was calculated for each model to gauge overfitting risk, and feature importance, defined as the sum of the absolute regression coefficients across classes, was reported with each feature’s cross-validation selection frequency (eg, “5/5”) and visualised using importance plots, coefficient heatmaps, and stability plots.
A two-stage strategy was adopted. First, to characterise the individual Pre-COPD phenotypes, three phenotype-specific models were built: Healthy–SAD–COPD (model B1), Healthy–Emphysema–COPD (model B2), and Healthy–PRISm–COPD (model B3); given the limited size of each subgroup, these were used primarily to identify phenotype-related candidate lipids and may be constrained by small-sample variability. Second, as Pre-COPD represents a precursor stage of COPD, the three phenotypes were merged into a single Pre-COPD group to capture shared lipid changes and yield a more robust, generalisable classifier, which was analysed together with the healthy and COPD groups to construct a combined Healthy–Pre-COPD–COPD model (model B).
Statistical Analysis
Statistical analyses were performed using SPSS (version 26.0) and R (version 4.2.2). Categorical variables were summarized as counts and percentages [n (%)], and group comparisons were performed using the χ2-test or Fisher’s exact test, as appropriate. Continuous variables were assessed for normality prior to analysis. Normally distributed continuous variables were summarized as mean ± standard deviation (SD) and compared using one-way analysis of variance (ANOVA). Non-normally distributed continuous variables were summarized as median (interquartile range [IQR]) and compared using the Kruskal–Wallis test. Unless otherwise specified, all tests were two-sided, and P < 0.05 was considered statistically significant. Differential lipids were screened using VIP scores, fold change, and P values, with typical thresholds of VIP > 1.0, and P < 0.05. Fold change (FC) was used to indicate the direction of change, with FC > 1 indicating upregulation and FC < 1 indicating downregulation. To control for clinical confounders, each lipid was then modelled as the dependent variable in a multivariable linear regression on disease group together with sex, age, BMI, and smoking index, and the significance of the group term was assessed by an F-test comparing this model with a covariate-only null model. P values were corrected for multiple testing using the Benjamini–Hochberg procedure (FDR < 0.05), and this adjustment was performed separately for each classification task. Lipids that remained significantly associated with disease group after adjustment (Supplementary Table S2) were retained as candidate predictors for the subsequent machine-learning models.18
To assess the clinical relevance of the model-selected key lipids, their correlations with pulmonary function indices (FVC%, FEV1%, and FEV1/FVC) and small-airway indices (FEF25–75%, FEF50%, and FEF75%) were evaluated using Spearman’s rank correlation, and the results were visualised as heatmaps generated in Origin (version 2021). In addition, single-lipid ROC analyses were performed for each selected key lipid; the AUC and 95% confidence interval were calculated, and the optimal cutoff was determined using the Youden index.
Results
Patients, Data Collection, and Study Design
The overall workflow of the study and participant recruitment for each analysis are illustrated in Scheme 1. A total of 124 participants were enrolled and categorized into three main groups: Group A (Healthy controls, n=30), Group B (Pre-COPD, n=63), and Group C (COPD, n=31). Group B was further stratified into three phenotypes: SAD (Group B1, n=23), Emphysema (Group B2, n=20), and PRISm (Group B3, n=20). Standardized questionnaires, physical examinations, and pulmonary function tests were completed by all participants, and fasting venous blood samples were collected. Key demographic characteristics and pulmonary function measures are summarized in Table 1.
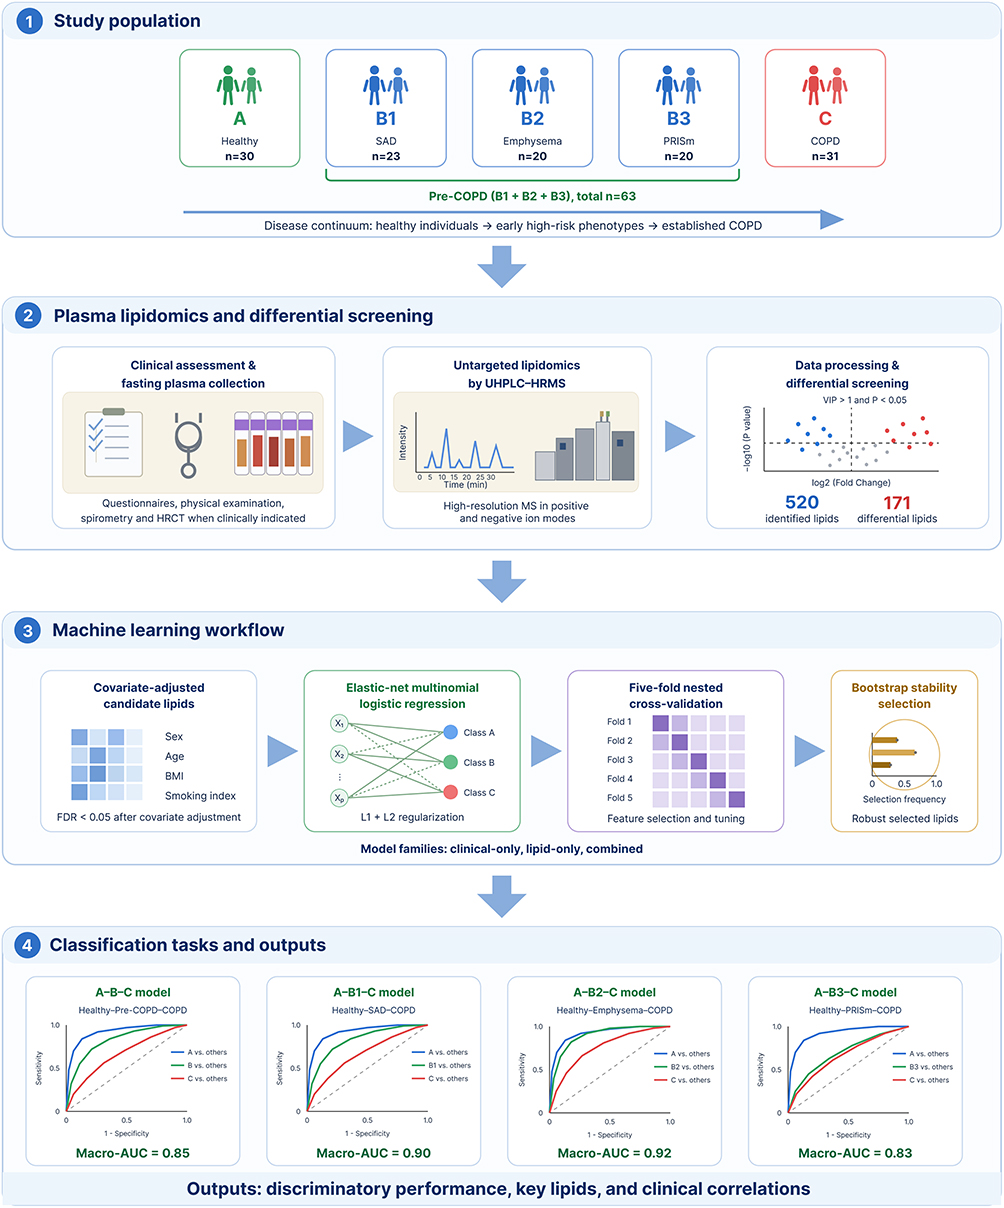 |
Scheme 1 Schematic overview of the study. |
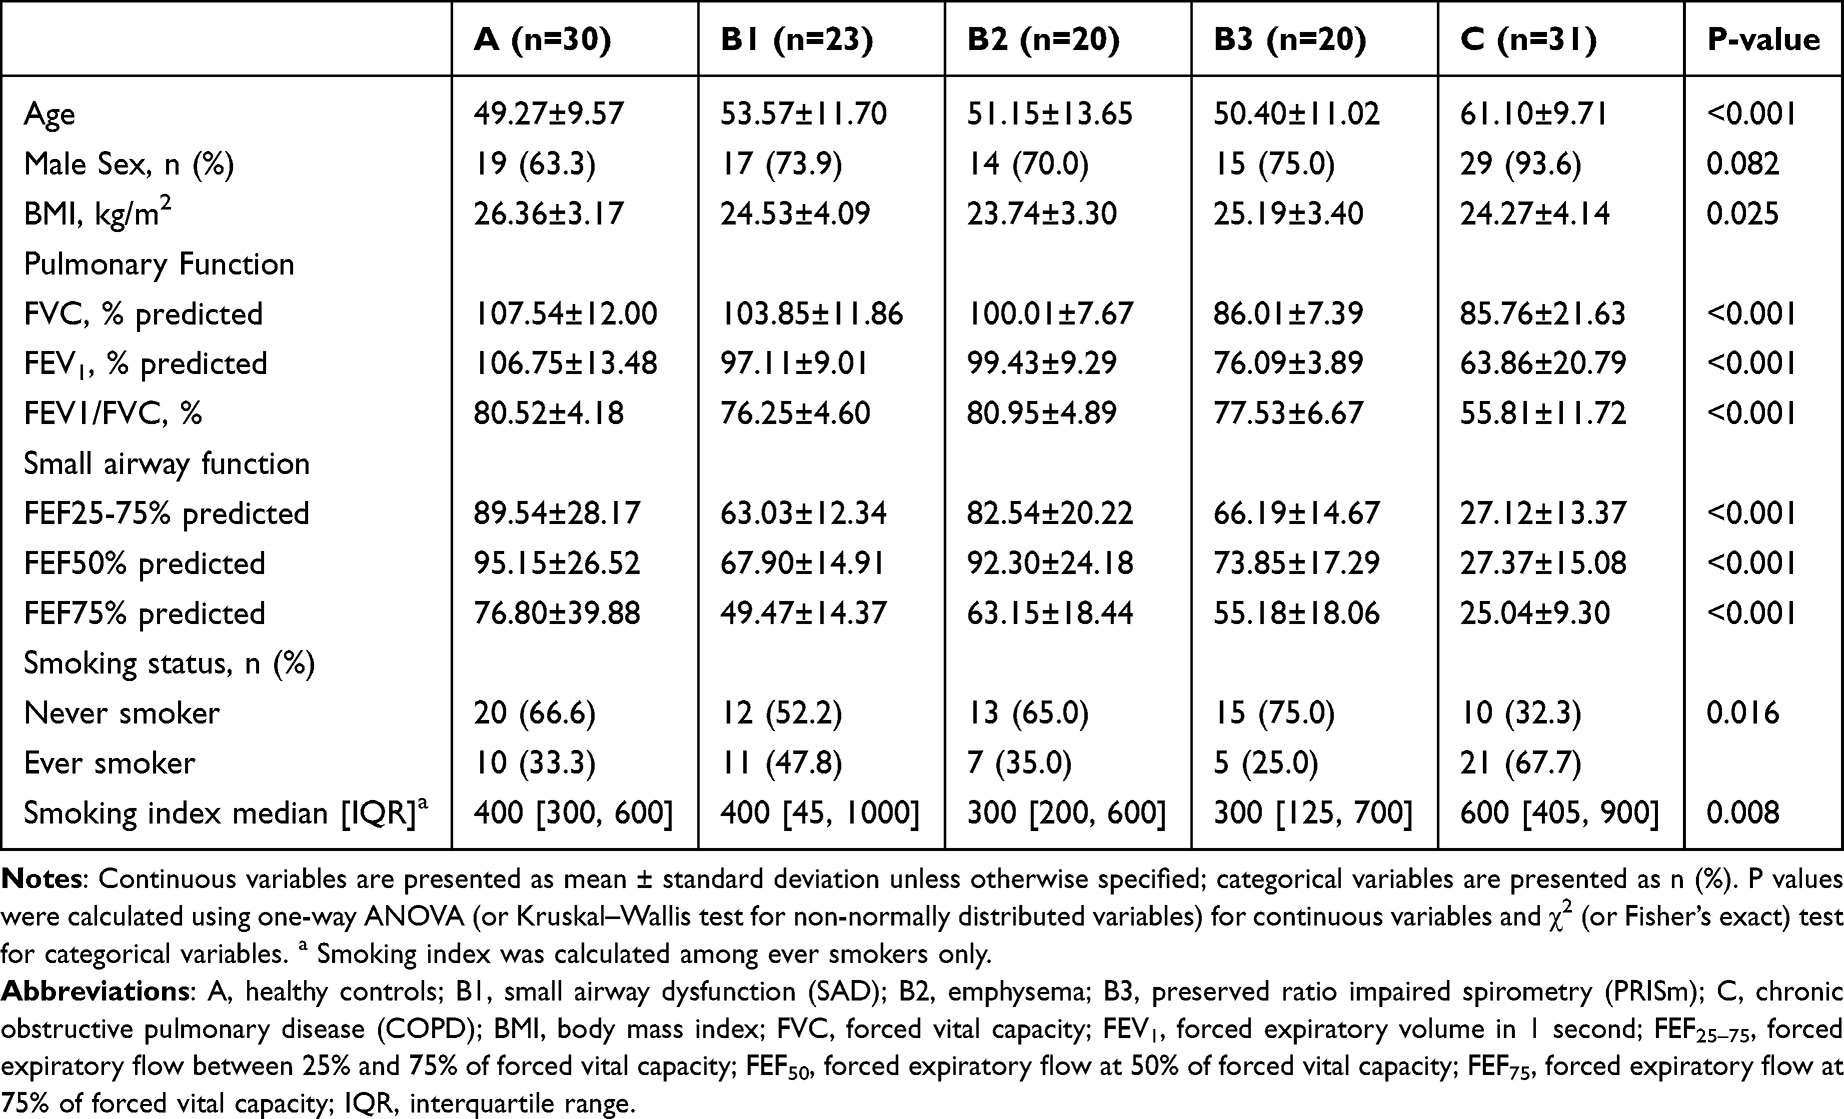 |
Table 1 Baseline Characteristics of the Study Population |
Global Lipidomic Profiling and Differential Analysis
A total of 520 lipid species were identified across all samples. Using thresholds of VIP > 1.0 and P < 0.05, 171 differential lipids were screened (Supplementary Table S1), mainly belonging to Phosphatidylethanolamine (PE), triacylglycerol (TG), sphingomyelin (SM), phosphatidylcholine (PC), Phosphatidylinositol (PI), and ceramide (Cer) (Figure 1A). PCA and OPLS-DA demonstrated clear separation among groups, and all OPLS-DA models showed Q2 values > 0.5 with negative intercepts in permutation tests, indicating robust discrimination without obvious overfitting (Figure 1B and Supplementary Figure S1). The standardized abundances of these 171 differential lipids across all individual samples are shown as a hierarchically clustered heatmap, which revealed substantial inter-individual variation in lipid profiles (Figure 1C).
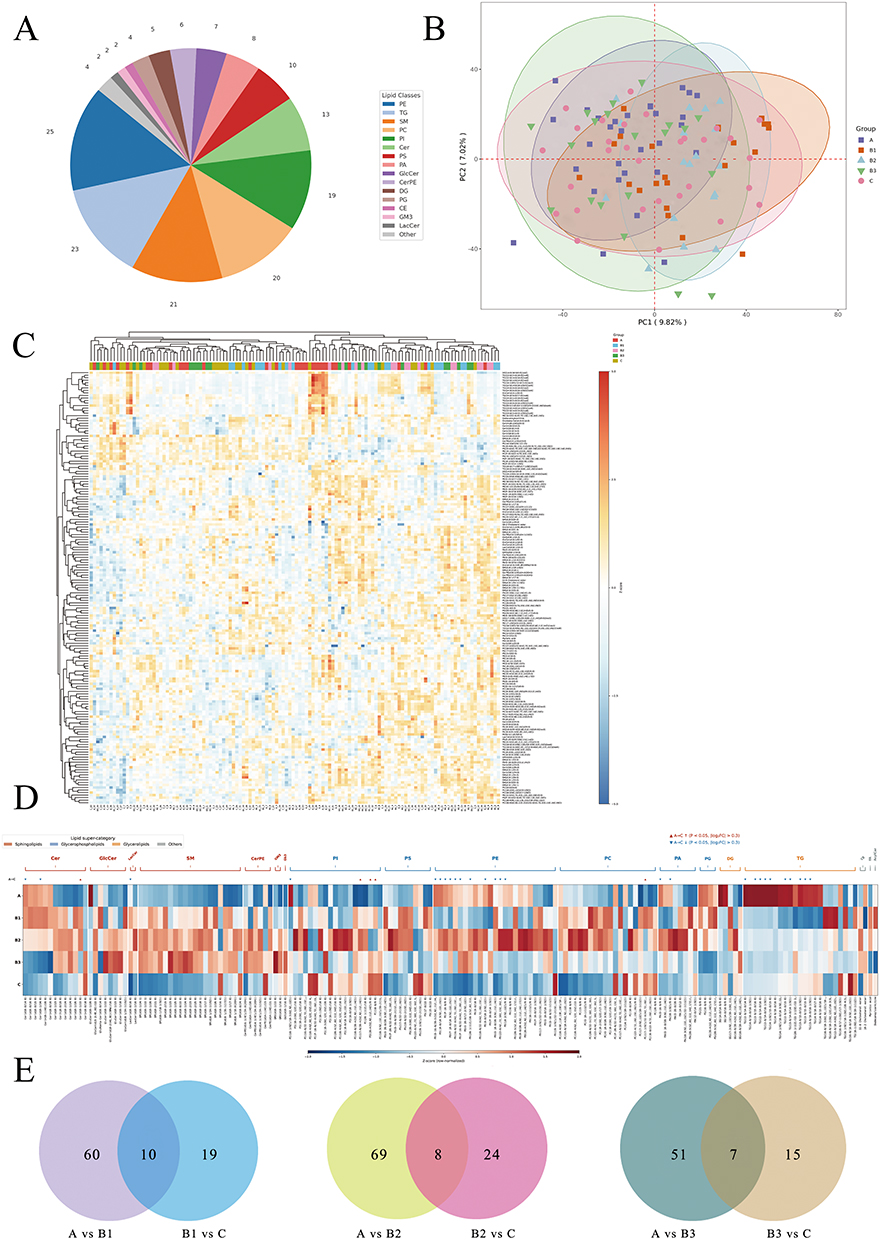 |
Figure 1 Global plasma lipidomic profiling across health, Pre-COPD phenotypes, and COPD. (A) Classification pie chart of the 171 differential lipids. (B) PCA diagram of all samples. (C) Heatmap of sample-level standardized abundances (columns: individual samples; rows: lipids). (D) Heatmap of group means (A, B1, B2, B3, C) highlighting stage-and phenotype-specific shifts. (E) Venn diagrams summarizing unique/shared differential lipids along three paths (A–B1–C, A–B2–C, A–B3–C). Notes: A, healthy controls; B1, small airway dysfunction (SAD); B2, emphysema; B3, preserved ratio impaired spirometry (PRISm); C, chronic obstructive pulmonary disease (COPD). |
Group-level comparison of the 171 differential lipids revealed stage-dependent shifts in the plasma lipid profile (Figure 1D). Relative to healthy controls (group A), all three Pre-COPD phenotypes (B1–B3) exhibited a broadly consistent elevation across most lipid classes. Sphingolipids, including Cer, SM, glucosylceramide (GlcCer) and lactosylceramide (LacCer), were uniformly higher in all three Pre-COPD subgroups, as were the glycerophospholipid classes PI and phosphatidic acid (PA). PC and phosphatidylserine (PS) showed a similar, albeit milder, upward trend. PE displayed a phenotype-specific pattern: B2 (emphysema) showed a marked increase, whereas B1 (SAD) and B3 (PRISm) remained largely unchanged. Among the three Pre-COPD phenotypes, B2 generally exhibited the most pronounced lipid perturbations, followed by B1 and B3 (Figure 1D).
In contrast, the transition from Pre-COPD to COPD (group C) was marked by a widespread decline in lipid levels. SM, Cer, GlcCer, LacCer, PC and PS all decreased from their elevated Pre-COPD levels, in many cases returning to or falling below the levels observed in healthy controls. PE was notably the most reduced lipid class in COPD relative to both healthy controls and Pre-COPD groups. A notable exception was PI, which remained elevated in COPD at levels comparable to the Pre-COPD stage, suggesting persistent phosphoinositide pathway activation across the disease continuum. Venn analysis further identified 10, 8 and 7 lipids shared between the A-versus-Pre-COPD and Pre-COPD-versus-COPD comparisons along the A–B1–C, A–B2–C and A–B3–C trajectories, respectively, whereas most differential lipids were specific to a single pairwise transition (Figure 1E).
Development and Validation of Machine Learning–Based Diagnostic Models
Across all four classification tasks, the elastic-net models discriminated well along the Healthy–Pre-COPD–COPD continuum, and the lipids consistently added information beyond established clinical predictors (Table 2). Models using clinical covariates alone (sex, age, BMI, and smoking index) achieved only modest discrimination, with macro-averaged AUCs of 0.54–0.73 and accuracies of 0.50–0.60. Incorporating the adjusted significant lipids markedly improved performance, the lipid-containing models reaching macro-averaged AUCs of 0.83–0.92 and accuracies of 0.70–0.81, indicating that the plasma lipidome carried discriminative information not captured by clinical variables alone.
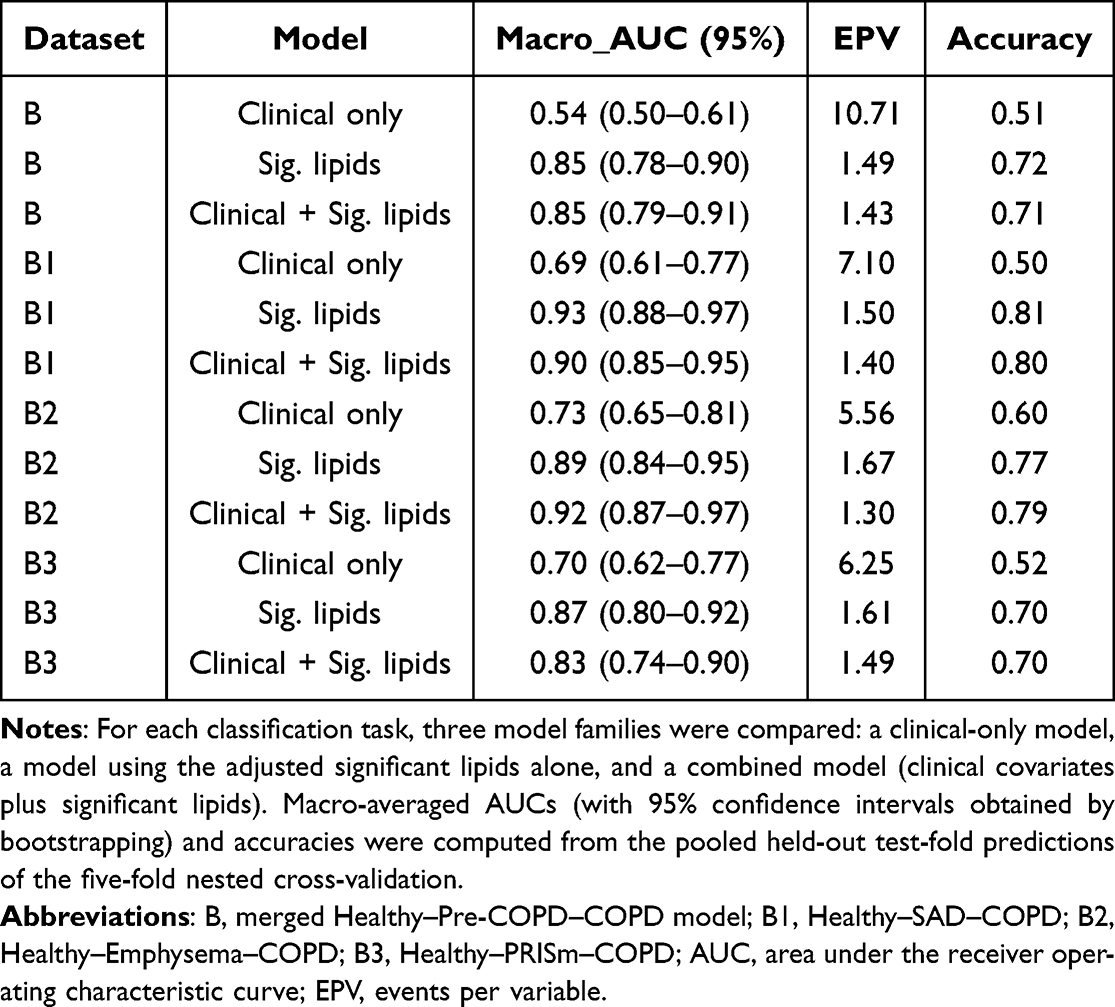 |
Table 2 Discrimination, Events-per-Variable, and Accuracy of the Elastic-Net Models Across the Healthy–Pre-COPD–COPD Continuum |
For the combined models (clinical covariates plus significant lipids), the merged Healthy–Pre-COPD–COPD model (model B) achieved a macro-averaged AUC of 0.85 (95% CI 0.79–0.91) with an accuracy of 0.71, while the three phenotype-specific models performed comparably or better: 0.90 (0.85–0.95) and 0.80 for Healthy–SAD–COPD (B1), 0.92 (0.87–0.97) and 0.79 for Healthy–Emphysema–COPD (B2), and 0.83 (0.74–0.90) and 0.70 for Healthy–PRISm–COPD (B3). Class-specific AUCs ranged from 0.78 to 0.95, and the corresponding ROC curves are shown in Figure 2. Per-class performance metrics across the four tasks are summarised in Supplementary Table S3, and the confusion matrix of the combined model is shown in Supplementary Figure S4.
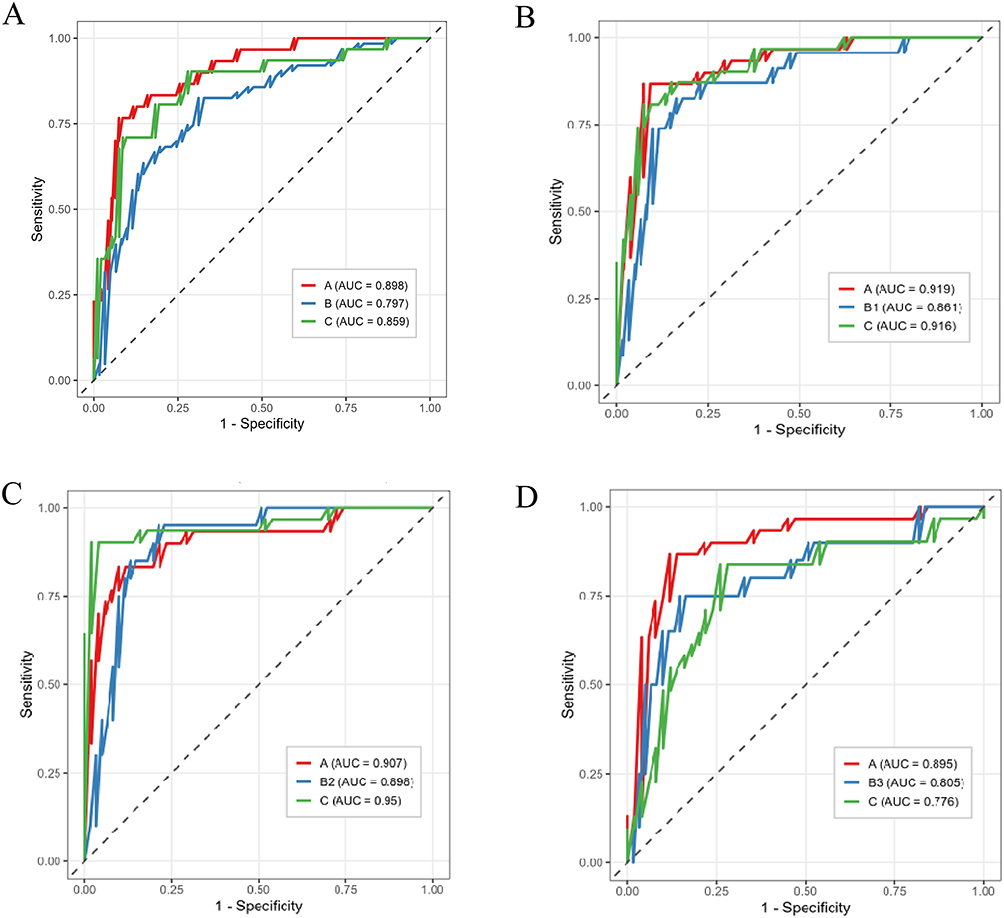 |
Figure 2 Class-specific receiver operating characteristic (ROC) curves for the combined (clinical plus significant lipids) elastic-net models. (A) the merged Healthy–Pre-COPD–COPD model. (B) Healthy–SAD–COPD (B1); (C) Healthy–Emphysema–COPD (B2); (D) Healthy–PRISm–COPD (B3). Notes: In each panel the three curves correspond to the healthy (A), Pre-COPD (B/B1/B2/B3), and COPD (C) classes, plotted one-versus-rest, with the corresponding AUC shown in the legend. Curves were derived from the pooled held-out test-fold predictions of the five-fold nested cross-validation. |
The number of features retained in each final model and their stability across cross-validation folds are shown in Figure 3, and detailed fold-wise feature-selection stability is provided in Supplementary Figure S2. The combined Healthy–Pre-COPD–COPD model (B) retained 28 lipids and 4 clinical features, of which the five most important lipids were selected in all five folds. The phenotype-specific models retained 26 features (22 lipids) for B1, with the six top-ranked lipids showing the highest cross-fold stability and overall importance; 19 features (15 lipids) for B2, with the five top-ranked lipids combining high importance and stability; and 13 features (11 lipids) for B3, among which three lipids showed both high stability and the greatest importance.
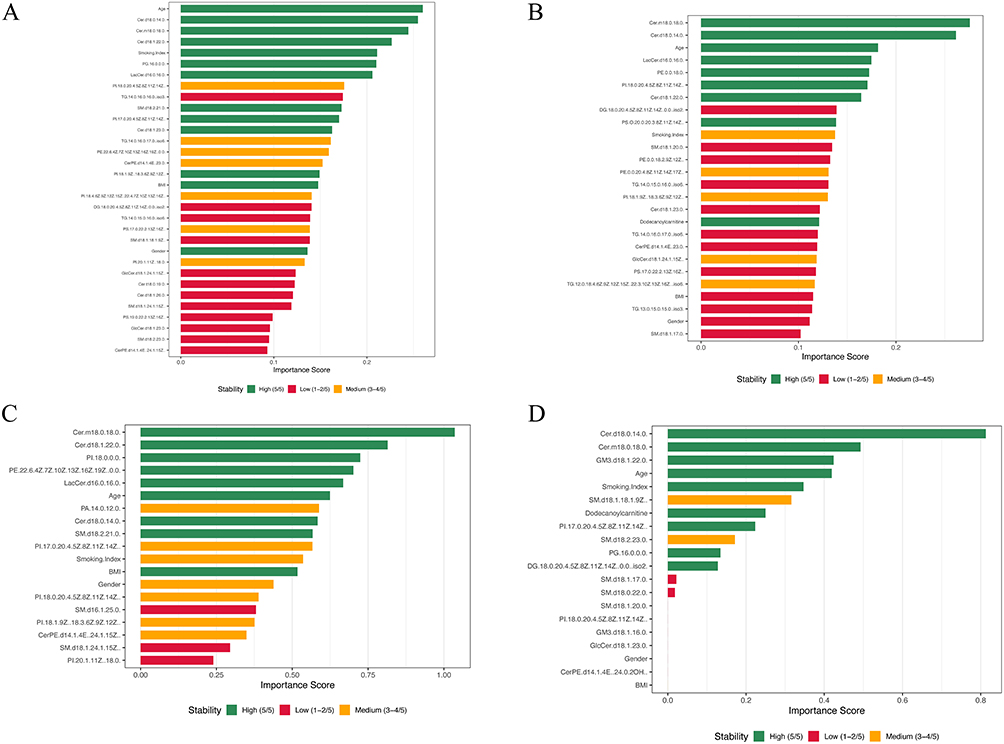 |
Figure 3 Feature importance and selection stability of the final combined elastic-net models. (A) Healthy–Pre-COPD–COPD. (B) Healthy–SAD–COPD (B1); (C) Healthy–Emphysema–COPD (B2); (D) Healthy–PRISm–COPD (B3). Notes: Bars show feature importance, defined as the sum of the absolute regression coefficients across classes, ordered by importance; bar color denotes selection stability across the five cross-validation folds: High (5/5), Medium (3–4/5), and Low (1–2/5). |
Training accuracy was generally higher than test accuracy (Supplementary Figure S3), indicating mild overfitting; nonetheless, all four lipid-based models maintained a macro-averaged AUC above 0.80, and Brier scores were generally below 0.20 with well-aligned calibration curves (Supplementary Figure S5), indicating reliable predicted probabilities. The events-per-variable of the lipid-containing models was low (1.3–1.7; Table 2), underscoring the rationale for penalised regression and stability selection to limit overfitting in this high-dimensional setting, whereas the clinical-only models had higher values (5.6–10.7).
Diagnostic Utility and Clinical Relevance of Model-Selected Lipids
Correlation Analysis of Machine Learning-Selected Lipids with Clinical Parameters Across Different Models
To evaluate the clinical relevance of the model-selected key lipids, their associations with major clinical parameters, including conventional spirometric indices (FVC%, FEV1%, FEV1/FVC) and small-airway indices (FEF25–75%, FEF50%, FEF75%), were assessed using Spearman’s rank correlation (Figure 4). The two ceramides recurrently selected across all four models showed consistent and opposing patterns: Cer(d18:0/14:0) was positively correlated and Cer(m18:0/18:0) was negatively correlated with all six pulmonary function indices in every model. In the SAD model, PI(18:0/20:4(5Z,8Z,11Z,14Z)) and Cer(d18:1/22:0) were negatively correlated with the small-airway indices (FEF25–75%, FEF50%, and FEF75%) but not with FVC% or FEV1%, indicating a small-airway–selective association. Among the phenotype-specific lipids, PI(18:0/0:0) was negatively correlated and PE(22:6(4Z,7Z,10Z,13Z,16Z,19Z)/0:0) was positively correlated with the pulmonary function indices in the emphysema model, phosphatidylglycerol PG(16:0/0:0) was positively correlated with these indices in the Pre-COPD model, and LacCer(d16:0/16:0) was positively correlated with them in the Pre-COPD, SAD, and emphysema models. Overall, the model-selected lipids, and the two ceramides in particular, were broadly correlated with pulmonary function, including small-airway measures.
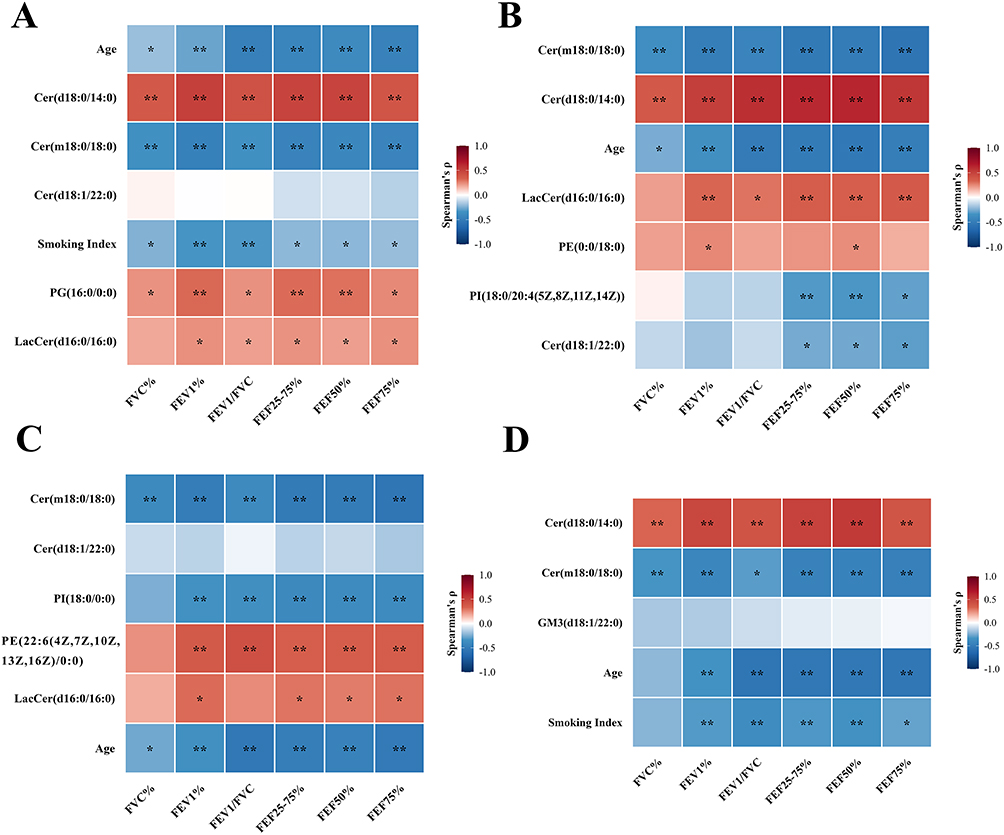 |
Figure 4 Spearman correlations between model-selected lipids and clinical parameters. Heatmaps display Spearman’s rank correlation coefficients (r) between key lipids selected by the multiclass models and clinical indicators for (A) A–B–C, (B) A–B1–C, (C) A–B2–C, and (D) A–B3–C. Red denotes positive correlations and blue denotes negative correlations. Statistical significance is indicated by p < 0.05 (*) and p < 0.01 (**). |
Single-Lipid ROC Analysis Supports Diagnostic Utility
To assess the standalone diagnostic value of the model-selected lipids, the top-ranked, high-stability lipids from each model were evaluated by univariate ROC analysis (Table 3). The lipids selected in the combined Healthy–Pre-COPD–COPD model discriminated healthy individuals from patients with COPD most effectively, with the two ceramides Cer(d18:0/14:0) and Cer(m18:0/18:0) reaching AUCs of 0.88 and 0.84, respectively, while PG(16:0/0:0), LacCer(d16:0/16:0), and Cer(d18:1/22:0) yielded moderate AUCs of 0.70 to 0.77. Discrimination between healthy individuals and the individual Pre-COPD phenotypes was phenotype-dependent: in the SAD comparison the small-airway–associated PI(18:0/20:4) and Cer(d18:1/22:0) performed best, with AUCs of 0.81 and 0.79, whereas the two core ceramides discriminated poorly, with AUCs of 0.58 and 0.59; the emphysema comparison showed the weakest performance, in which only Cer(d18:1/22:0) reached moderate discrimination at an AUC of 0.74; and in the PRISm comparison Cer(d18:0/14:0), the ganglioside GM3(d18:1/22:0), and Cer(m18:0/18:0) achieved relatively high AUCs ranging from 0.78 to 0.87. Overall, single-lipid discrimination was strongest for the healthy-versus-COPD comparison and for the PRISm phenotype, driven mainly by the ceramides, whereas it remained modest and phenotype-dependent for the SAD and emphysema phenotypes.
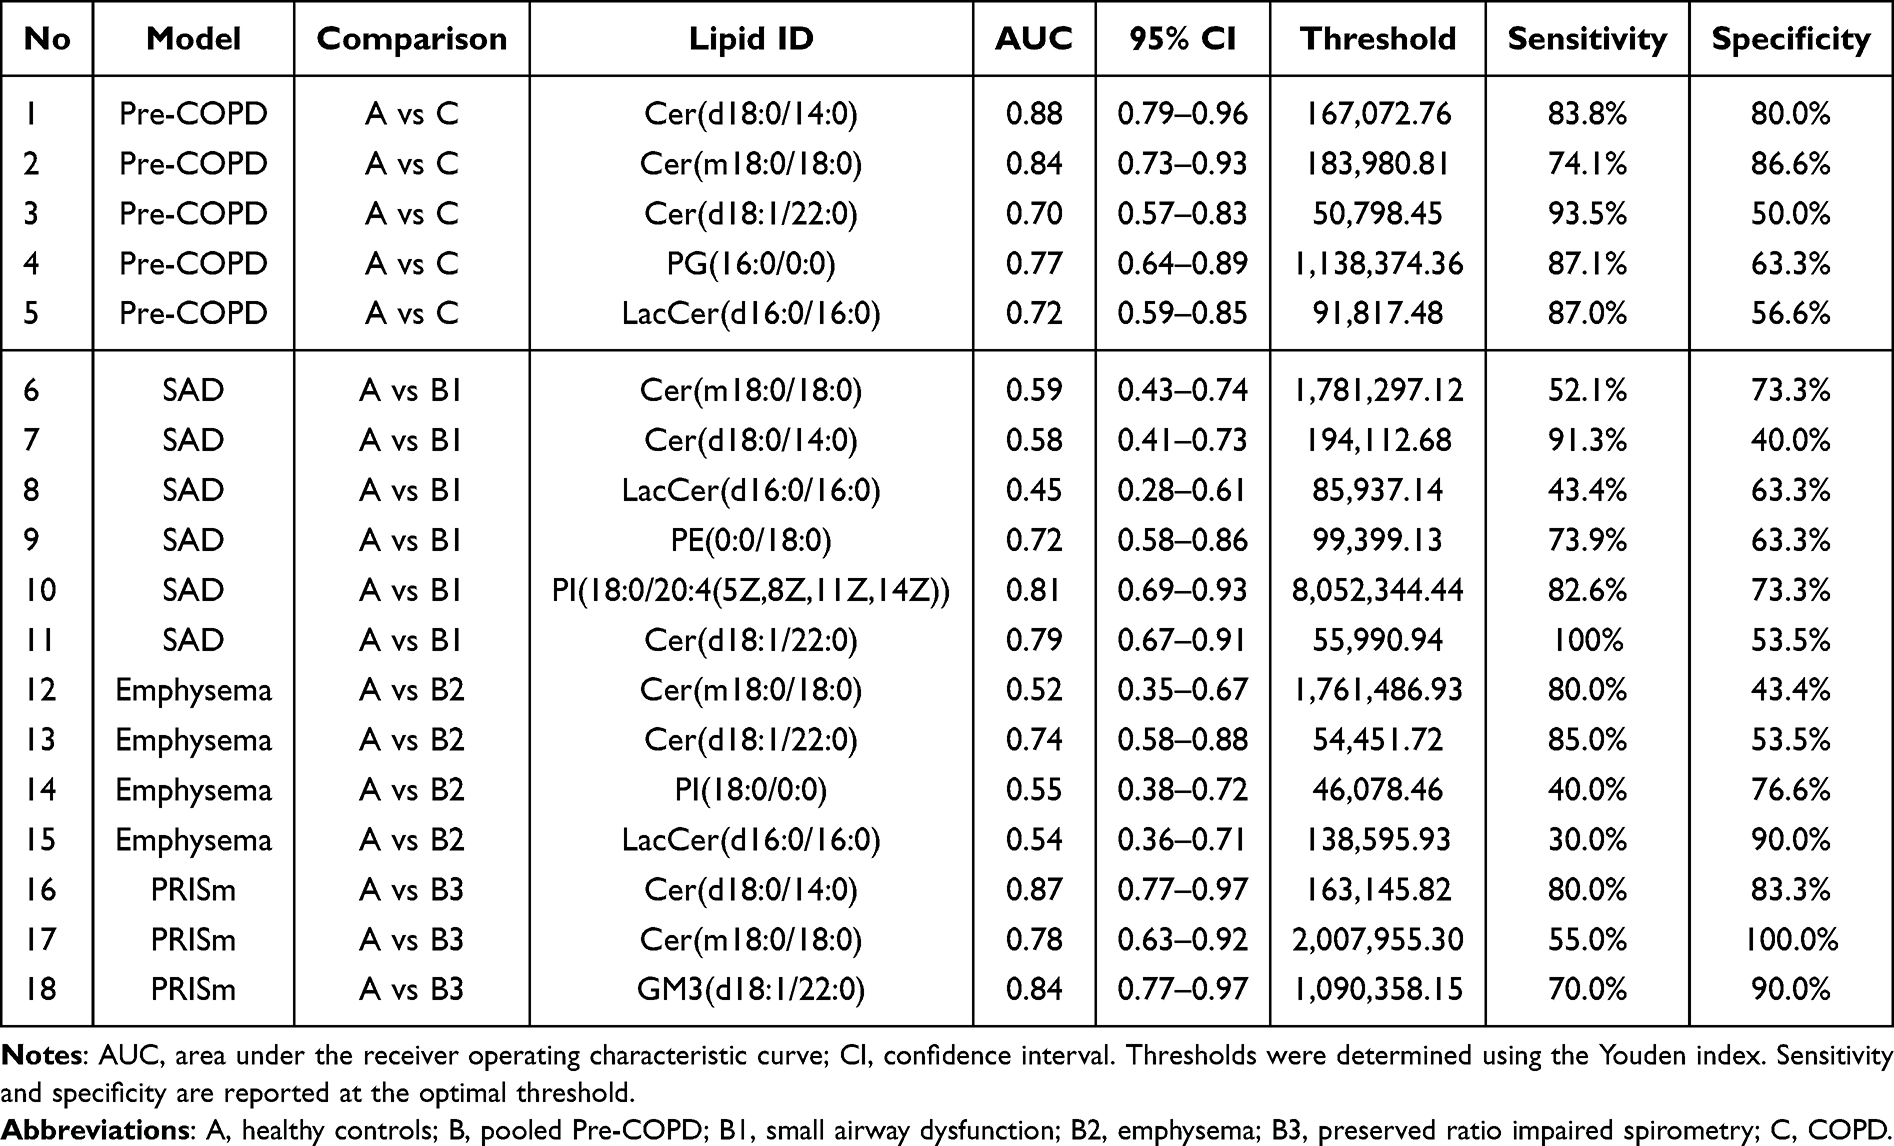 |
Table 3 Diagnostic Performance of Machine-Learning–Selected Plasma Lipids Based on Single-Lipid ROC Analysis Across Phenotype-Specific Models |
Discussion
In this study, we characterized plasma lipidomic profiles across the healthy–Pre-COPD–COPD continuum, encompassing three Pre-COPD phenotypes, and applied elastic-net machine learning to identify lipid signatures shared across or specific to individual phenotypes. The plasma lipidome changed in a stage-dependent and predominantly non-monotonic manner: most differential lipids, spanning several sphingolipids and glycerophospholipid classes, were elevated in Pre-COPD relative to healthy controls and subsequently declined in COPD, in many cases returning to or falling below healthy levels. Across all four classification tasks, models incorporating the adjusted significant lipids consistently outperformed those based on clinical covariates alone, indicating that the plasma lipidome carried discriminative information beyond age, sex, BMI, and smoking. A compact set of recurrently selected, high-stability lipids—the ceramides Cer(d18:0/14:0), Cer(m18:0/18:0) and Cer(d18:1/22:0), PG(16:0/0:0), and LacCer(d16:0/16:0)—correlated with pulmonary function and retained standalone diagnostic value, most strongly for the discrimination between healthy individuals and patients with COPD. The three Pre-COPD phenotypes shared this core signature yet were further distinguished by phenotype-specific lipids, including small-airway–associated species in the SAD phenotype and a GM3 ganglioside unique to PRISm.
Among the five lipids selected by the merged model with high importance and stability, the ceramides were the most informative. Sphingolipid accumulation is well established in COPD, in which cigarette-smoke–induced oxidative stress promotes ceramide generation that drives airway inflammation, alveolar epithelial apoptosis, and emphysematous destruction.19,20 Both core ceramides separated healthy individuals from patients with COPD, with areas under the curve (AUC) of 0.88 for Cer(d18:0/14:0) and 0.84 for Cer(m18:0/18:0), yet they diverged in direction: Cer(m18:0/18:0) was negatively correlated with all spirometric and small-airway indices, in line with the conventional view of ceramide as deleterious, whereas Cer(d18:0/14:0) was positively correlated. Because ceramide kinase phosphorylates ceramide to the pro-survival metabolite ceramide-1-phosphate (C1P), which blocks apoptosis in alveolar macrophages by inhibiting acid sphingomyelinase and serine palmitoyltransferase,21,22 the accumulation of species such as Cer(d18:0/14:0) may reflect a compensatory flux toward C1P that limits alveolar injury, consistent with its positive association with lung function. The plasma trajectory we observed, in which most ceramides rose in Pre-COPD and then declined in COPD, argues against simple monotonic accumulation and points to stage-dependent remodeling of sphingolipid metabolism along the continuum.
The two remaining markers related to lung function in opposite ways relative to expectation. PG(16:0/0:0) behaved as a protective lipid: as a minor surfactant phospholipid it antagonises Toll-like receptor 2 and 4 signaling through CD14 and MD-2,23 is reduced in COPD in proportion to lung-function loss and emphysema severity,7,24 and was positively correlated with the pulmonary function indices in our data (AUC 0.77), such that its progressive loss would be expected to permit sustained airway inflammation. LacCer(d16:0/16:0), by contrast, contradicted the literature: although lipid-raft LacCer accumulation drives aberrant autophagy, inflammation, and apoptosis in smoke-exposed lungs and rises with emphysema severity,25,26 here it peaked in Pre-COPD, fell below healthy levels in COPD, and was positively rather than negatively correlated with lung function (AUC 0.72)—a discrepancy that may reflect the circulating plasma rather than the lung-tissue compartment and warrants further study.
The phenotype-specific models recovered this shared signature but added discriminating lipids. In the SAD model, PI(18:0/20:4) and Cer(d18:1/22:0) were correlated with the small-airway indices (FEF25–75%, FEF50%, FEF75%) but not with FVC% or FEV1%, and gave the strongest single-lipid discrimination from healthy individuals (AUCs 0.81 and 0.79), whereas the core ceramides performed poorly here (0.58 and 0.59)—a small-airway–selective pattern consistent with PI being a minor anti-inflammatory surfactant phospholipid whose arachidonoyl species also feeds eicosanoid signalling in the bronchiolar compartment.7,24 The emphysema model overlapped with the SAD model and additionally selected PE(22:6/0:0), in line with the pathological sequence in which terminal-bronchiole loss precedes emphysematous destruction;27 its single-lipid discrimination was the weakest, with only Cer(d18:1/22:0) reaching moderate performance (AUC 0.74). The PRISm model was uniquely characterised by GM3(d18:1/22:0), not selected in any other model; here discrimination from healthy individuals was relatively strong, led by Cer(d18:0/14:0) and GM3 (AUCs 0.87 and 0.84), with Cer(m18:0/18:0) at 0.78. Although GM3 is unstudied in COPD, pulmonary GM3 accumulates after biomass- and wildfire-smoke exposure alongside inflammation-associated transcriptomic shifts,28 raising the possibility that PRISm involves a distinct ganglioside-linked inflammatory process that warrants confirmation given the small subgroup.
There are still several limitations in our study. First, it was conducted at a single centre with a limited sample size, which raises the risk of overfitting. To mitigate this, we combined elastic-net regularisation with stability selection under nested cross-validation and report performance on held-out folds; these measures reduce but do not eliminate the risk, and the performance reported for the smaller subgroups may be optimistic. Second, the models were assessed only by internal cross-validation, without an independent external cohort, and lipidomic measurements are sensitive to platform, batch, and population differences, so their generalisability remains uncertain. Third, the analysis is cross-sectional and the between-group comparisons were unadjusted; the observed lipid trajectories therefore reflect group-level mean differences that may carry residual confounding by age and smoking, and our mechanistic interpretations remain candidate explanations drawn from the literature rather than causal relationships demonstrated here. This caveat is reinforced by our use of the circulating plasma pool, whereas much of the supporting evidence derives from lung tissue, bronchoalveolar lavage, or cellular models. Before clinical application, several steps are therefore required: longitudinal validation to test whether these lipids predict progression from Pre-COPD to COPD, targeted and absolutely quantified assays to enable cross-laboratory standardisation, and multicentre replication to confirm reproducibility. Despite these limitations, the recurrent selection of a compact, stable set of lipids related to lung function provides a rational starting point for the targeted, longitudinal studies required to establish their clinical value.
Conclusions
In this study, plasma lipidomic profiling distinguished healthy individuals, three Pre-COPD phenotypes, and patients with COPD, revealing stage-related differences that comprised both shared and phenotype-specific lipid features. Combining untargeted lipidomics with elastic-net machine learning evaluated by internal nested cross-validation, the merged three-class model reached a macro-averaged AUC of 0.85, and the phenotype-specific models reached 0.83 to 0.92; across all tasks, models incorporating the selected lipids outperformed those based on clinical covariates alone, whose macro-averaged AUCs ranged from 0.54 to 0.73. A compact, recurrently selected set of lipids—the ceramides Cer(d18:0/14:0), Cer(m18:0/18:0), and Cer(d18:1/22:0), PG(16:0/0:0), and LacCer(d16:0/16:0)—was associated with disease stage and with pulmonary function, while phenotype-specific lipids, including PI(18:0/20:4) and Cer(d18:1/22:0)—the latter especially discriminative—in the SAD phenotype, PE(22:6/0:0) in emphysema, and GM3(d18:1/22:0) in PRISm, further separated the subgroups. As an exploratory study, this work provides early evidence that plasma lipid alterations accompany the Pre-COPD stage and identifies candidate markers for further investigation. Confirming their clinical value will require external and prospective validation, together with targeted quantification and multicentre replication.
Institutional Review Board Statement
The study was conducted in accordance with the Declaration of Helsinki and approved by the Medical Ethics Committee of Dongzhimen Hospital, Beijing University of Chinese Medicine (approval no. 2022DZMEC-432).
Data Sharing Statement
The untargeted metabolomics data generated and analyzed in this study, along with de-identified clinical information are available from the corresponding author upon reasonable request.
Informed Consent Statement
Written informed consent was obtained from all participants for the collection and use of their clinical information and blood samples for research purposes.
Author Contributions
All authors made a significant contribution to the work reported, whether that is in the conception, study design, execution, acquisition of data, analysis and interpretation, or in all these areas; took part in drafting, revising or critically reviewing the article; gave final approval of the version to be published; have agreed on the journal to which the article has been submitted; and agree to be accountable for all aspects of the work.
Funding
This research was funded by National Natural Science Foundation of China (Grant No. 82574987), The Fifth Batch of National Traditional Chinese Medicine Excellent Clinical Talents Training Project (Funded by National Administration of Traditional Chinese Medicine, Document No. 2022-1), and Key Project of “Jiebang Guashuai” for the Fundamental Research Funds for the Central Universities (Grant No. 2022-JYB-JBZR-028), and the 2024 Graduate Student Independent Research Project of Beijing University of Chinese Medicine (Project No. ZJKT2024049).
Disclosure
The authors declare no conflicts of interest in this work.
References
1. (GOLD) GIfCOLD. Global Strategy for the Diagnosis, Management, and Prevention of Chronic Obstructive Pulmonary Disease. Fontana, WI; 2024.
2. Adeloye D, Song P, Zhu Y, Campbell H, Sheikh A, Rudan I. Global, regional, and national prevalence of, and risk factors for, chronic obstructive pulmonary disease (COPD) in 2019: a systematic review and modelling analysis. Lancet Respir Med. 2022;10(5):447–16. doi:10.1016/S2213-2600(21)00511-7
3. Venkatesan P. GOLD report: 2022 update. Lancet Respir Med. 2022;10(2):e20. doi:10.1016/S2213-2600(21)00561-0
4. Elbehairy AF, Marshall H, Naish JH, et al. Advances in COPD imaging using CT and MRI: linkage with lung physiology and clinical outcomes. Eur Respir J. 2024;63(5).
5. Graham BL, Steenbruggen I, Miller MR, et al. Standardization of spirometry 2019 update. an official American thoracic society and European respiratory society technical statement. Am J Respir Crit Care Med. 2019;200(8):e70–e88. doi:10.1164/rccm.201908-1590ST
6. Pinto-Plata V, Casanova C, Divo M, et al. Plasma metabolomics and clinical predictors of survival differences in COPD patients. Respir Res. 2019;20(1):219. doi:10.1186/s12931-019-1167-y
7. Agudelo CW, Kumley BK, Area-Gomez E, et al. Decreased surfactant lipids correlate with lung function in chronic obstructive pulmonary disease (COPD). PLoS One. 2020;15(2):e0228279. doi:10.1371/journal.pone.0228279
8. Casadevall C, Agranovich B, Enríquez-Rodríguez CJ, et al. Metabolomic plasma profile of chronic obstructive pulmonary disease patients. Int J Mol Sci. 2025;26(10):4526. doi:10.3390/ijms26104526
9. Zhou Q, Xing L, Ma M, et al. Lysophospholipid metabolism, clinical characteristics, and artificial intelligence-based quantitative assessments of chest CT in patients with stable COPD and healthy smokers. Sci Rep. 2025;15(1):26376. doi:10.1038/s41598-025-11960-5
10. Ruan W, Peng Z, Huang M, et al. Cigarette smoke-induced glycerophospholipid DLPC promotes macrophage ferroptosis through the USP7/GPX4 regulatory axis in chronic obstructive pulmonary disease. Chem Biol Interact. 2025;420:111697. doi:10.1016/j.cbi.2025.111697
11. Kleuser B, Schumacher F, Gulbins E. New therapeutic options in pulmonal diseases: sphingolipids and modulation of sphingolipid metabolism. Handb Exp Pharmacol. 2024;284:289–312.
12. Gillenwater LA, Kechris KJ, Pratte KA, et al. Metabolomic profiling reveals sex specific associations with chronic obstructive pulmonary disease and emphysema. Metabolites. 2021;11(3):161. doi:10.3390/metabo11030161
13. Pulik K, Korczyński P, Mycroft-Rzeszotarska K, et al. Induced sputum multi-omics reveals airway signatures of COPD in smokers: a pilot study. Int J Mol Sci. 2026;27(5):2271. doi:10.3390/ijms27052271
14. Liebal UW, Phan ANT, Sudhakar M, Raman K, Blank LM. Machine learning applications for mass spectrometry-based metabolomics. Metabolites. 2020;10(6):243. doi:10.3390/metabo10060243
15. Zou H, Hastie T. Regularization and variable selection via the elastic net. J Royal Statis Soc Series B. 2005;67(2):301–320. doi:10.1111/j.1467-9868.2005.00503.x
16. Pavlou M, Ambler G, Seaman S, De Iorio M, Omar RZ. Review and evaluation of penalised regression methods for risk prediction in low-dimensional data with few events. Stat Med. 2016;35(7):1159–1177. doi:10.1002/sim.6782
17. Meinshausen N, Bühlmann P. Stability selection. J Royal Statis Soc Series B. 2010;72(4):417–473. doi:10.1111/j.1467-9868.2010.00740.x
18. Benjamini Y, Hochberg Y. Controlling the false discovery rate: a practical and powerful approach to multiple testing. J Royal Statis Soc. 1995;57(1):289–300. doi:10.1111/j.2517-6161.1995.tb02031.x
19. Huang Q, Kang T, Shen S, et al. Extracellular vesicular delivery of ceramides from pulmonary macrophages to endothelial cells facilitates chronic obstructive pulmonary disease. Cell Commun Signal. 2025;23(1):124. doi:10.1186/s12964-025-02125-y
20. Petrache I, Medler TR, Richter AT, et al. Superoxide dismutase protects against apoptosis and alveolar enlargement induced by ceramide. Am J Physiol Lung Cell Mol Physiol. 2008;295(1):L44–53. doi:10.1152/ajplung.00448.2007
21. Gómez-Muñoz A, Kong JY, Salh B, Steinbrecher UP. Ceramide-1-phosphate blocks apoptosis through inhibition of acid sphingomyelinase in macrophages. J Lipid Res. 2004;45(1):99–105. doi:10.1194/jlr.M300158-JLR200
22. Granado MH, Gangoiti P, Ouro A, Arana L, Gómez-Muñoz A. Ceramide 1-phosphate inhibits serine palmitoyltransferase and blocks apoptosis in alveolar macrophages. Biochim Biophys Acta. 2009;1791(4):263–272. doi:10.1016/j.bbalip.2009.01.023
23. Numata M, Chu HW, Dakhama A, Voelker DR. Pulmonary surfactant phosphatidylglycerol inhibits respiratory syncytial virus-induced inflammation and infection. Proc Natl Acad Sci U S A. 2010;107(1):320–325. doi:10.1073/pnas.0909361107
24. Hristova VA, Watson A, Chaerkady R, et al. Multiomics links global surfactant dysregulation with airflow obstruction and emphysema in COPD. ERJ Open Res. 2023;9(3):00378–2022. doi:10.1183/23120541.00378-2022
25. Chatterjee S, Yuan R, Thapa S, Talwar R. Central role of β-1,4-GalT-V in cancer signaling, inflammation, and other disease-centric pathways. Int J Mol Sci. 2023;25(1):483. doi:10.3390/ijms25010483
26. Bodas M, Min T, Vij N. Lactosylceramide-accumulation in lipid-rafts mediate aberrant-autophagy, inflammation and apoptosis in cigarette smoke induced emphysema. Apoptosis. 2015;20(5):725–739. doi:10.1007/s10495-015-1098-0
27. McDonough JE, Yuan R, Suzuki M, et al. Small-airway obstruction and emphysema in chronic obstructive pulmonary disease. N Engl J Med. 2011;365(17):1567–1575. doi:10.1056/NEJMoa1106955
28. Jostes HC, Hickman E, Solosky AM, et al. Wildfire smoke induces GM3 ganglioside lipid accumulation and transcriptomic shifts in mouse lung tissue: a smoke signal story. Sci Total Environ. 2025;1000:180396. doi:10.1016/j.scitotenv.2025.180396
 © 2026 The Author(s). This work is published and licensed by Dove Medical Press Limited. The
full terms of this license are available at https://www.dovepress.com/terms
and incorporate the Creative Commons Attribution
- Non Commercial (unported, 4.0) License.
By accessing the work you hereby accept the Terms. Non-commercial uses of the work are permitted
without any further permission from Dove Medical Press Limited, provided the work is properly
attributed. For permission for commercial use of this work, please see paragraphs 4.2 and 5 of our Terms.
© 2026 The Author(s). This work is published and licensed by Dove Medical Press Limited. The
full terms of this license are available at https://www.dovepress.com/terms
and incorporate the Creative Commons Attribution
- Non Commercial (unported, 4.0) License.
By accessing the work you hereby accept the Terms. Non-commercial uses of the work are permitted
without any further permission from Dove Medical Press Limited, provided the work is properly
attributed. For permission for commercial use of this work, please see paragraphs 4.2 and 5 of our Terms.